Holistic approach to assess co benefits of local climate mitigation in a hot humid region of Australia - Nature
←
→
Page content transcription
If your browser does not render page correctly, please read the page content below
www.nature.com/scientificreports
OPEN Holistic approach to assess
co‑benefits of local climate
mitigation in a hot humid region
of Australia
Shamila Haddad1, Riccardo Paolini1, Giulia Ulpiani1, Afroditi Synnefa1,
Gertrud Hatvani‑Kovacs1, Samira Garshasbi1, Jonathan Fox1, Konstantina Vasilakopoulou1,
Lawrence Nield2 & Mattheos Santamouris1*
Overheated outdoor environments adversely impact urban sustainability and livability. Urban
areas are particularly affected by heat waves and global climate change, which is a serious threat
due to increasing heat stress and thermal risk for residents. The tropical city of Darwin, Australia,
for example, is especially susceptible to urban overheating that can kill inhabitants. Here, using
a modeling platform supported by detailed measurements of meteorological data, we report the
first quantified analysis of the urban microclimate and evaluate the impacts of heat mitigation
technologies to decrease the ambient temperature in the city of Darwin. We present a holistic study
that quantifies the benefits of city-scale heat mitigation to human health, energy consumption, and
peak electricity demand. The best-performing mitigation scenario, which combines cool materials,
shading, and greenery, reduces the peak ambient temperature by 2.7 °C and consequently decreases
the peak electricity demand and the total annual cooling load by 2% and 7.2%, respectively. Further,
the proposed heat mitigation approach can save 9.66 excess deaths per year per 100,000 people
within the Darwin urban health district. Our results confirm the technological possibilities for urban
heat mitigation, which serves as a strategy for mitigating the severity of cumulative threats to urban
sustainability.
Urban areas face several challenges, including increased energy and resources consumption, health risks and vul-
nerability to extreme events1, that must be counteracted by structures and processes that advance the well-being
of people and the planet to ensure the sustainability of urban s ystems2. Additional man-made changes to local
and regional c limate3 and the localized effects of urbanization induce higher surface and air temperatures in cities
compared to those in rural areas4, a phenomenon known as the urban heat island (UHI) effect. The magnitude
of a UHI varies between 0.4 °C and 11 °C5 and is affected by synoptic weather conditions, the local morphology
and structure of the city, urban materials, anthropogenic heat generation by human activities, and heat s inks6.
This effect is further exacerbated by global climate change leading to more frequent heat waves7,8 and severe
consequences for urban sustainability. UHI is documented in more than 400 major cities around the world5,9.
UHIs increase the cooling energy demand of buildings depending on the magnitude of the urban overheating,
microclimate, building characteristics and performance of air conditioning systems. On average, UHIs increase
the cooling loads of urban buildings by 13.1% compared to rural buildings reference demand10. Each degree
of temperature rise results in a 0.45–4.6% increase in the peak electricity demand, which leads to an electricity
penalty of 21 (± 10.4) W/°C/person11. On top of the effects of urbanization, climate change and market penetra-
tion of air conditioning will put further stress on urban energy systems. It is expected that the average cooling
energy needs of residential and commercial buildings in 2050 will increase by 750% and 275%, r espectively12.
The most significant increases are predicted to occur in I ndia12, where hot-humid conditions are prevalent.
Beyond energy consumption, local and global climate change pose a burden to public health considering
the significant increases in mortality and hospitalization during heat wave days, especially for the most at-risk
1
UNSW Built Environment, The University of New South Wales, Sydney, Australia. 2Former Northern Territory
Government Architect, Darwin, Australia. *email: m.santamouris@unsw.edu.au
Scientific Reports | (2020) 10:14216 | https://doi.org/10.1038/s41598-020-71148-x 1
Vol.:(0123456789)
www.nature.com/scientificreports/
r esidents13. More frequent and longer heat wave events adversely affect vulnerable people with low socioeconomic
status14–17 and elderly individuals who are more susceptible to heat18,19. Further, in tropical areas, the prevalence
of infectious disease mortality is amplified by rainfall and temperature increases, and an increasing trend in
heat-related cardio-respiratory mortality has also been documented in hot-humid a reas20.
While the majority of heat-related deaths occur indoors, the increased risks of heat exhaustion and heat
stroke will substantially limit outdoor physical activity and w ork17,21 and reduce workers’ p roductivity22 across
wider spatial and temporal scales. Thus, thermal comfort in urban open spaces is vital to sustainable cities yet
complex due to psychological a daptation23.
Among the most impacted areas are tropical cities, where high-humidity regimes reduce the mitigation
potential of evaporative c ooling24 and increase thermal discomfort because transpiration is i mpaired25–27.
Climate change is worsening the situation. Over the last few decades, Australian cities have experienced
longer, more intense and more frequent extreme heat events, which cause 55% of all deaths related to natural
disasters28. By 2070, the Australia-wide annual average warming is expected to be between 2.2 °C and 5 °C29, and
annual net temperature-related deaths will rise to 1,250 per year in the unmitigated climate change s cenario30. In
the tropical city of Darwin, Northern Territory, residents could be subjected to up to 227 days per annum above
35 °C by the year 2070, with an annual average temperature of 31 °C31. The heat released by widespread use of
air conditioning32 and man-made materials such as asphalt p avements33 exacerbates the heat wave conditions
in hot-humid regions.
Extensively investigated local climate mitigation t echnologies34,35 have the potential to reduce average peak
ambient temperatures by 2–3 °C36,37. However, the body of knowledge focusing on the overheating conditions and
cooling potentials in tropical cities analyses different mitigation s trategies38, while a quantification of the most
relevant co-benefits and their interrelation is still needed. More in detail, little research has been conducted—
especially in hot-humid regions—to quantify the potential of these heat mitigation measures to reduce energy
consumption, reduce peak electricity demand and improve health using an integrated and holistic approach.
The synergy among energy, health, comfort, and vulnerability emphasizes the need to apply an integrated
interdisciplinary framework for urban sustainability research. In the context of sustainable urban systems, we pre-
sent a new approach to counteract urban overheating yielding sustainability outcomes both locally and globally.
Using extensive measurements of local and urban climate, we analyze the characteristics of urban overheating in
the hot-humid city of Darwin. We also analyze urban heat mitigation measures using a microclimate simulation
tool and evaluate the impacts of several changes to urban cover and the urban fabric on building cooling energy
needs, peak electricity demand and health.
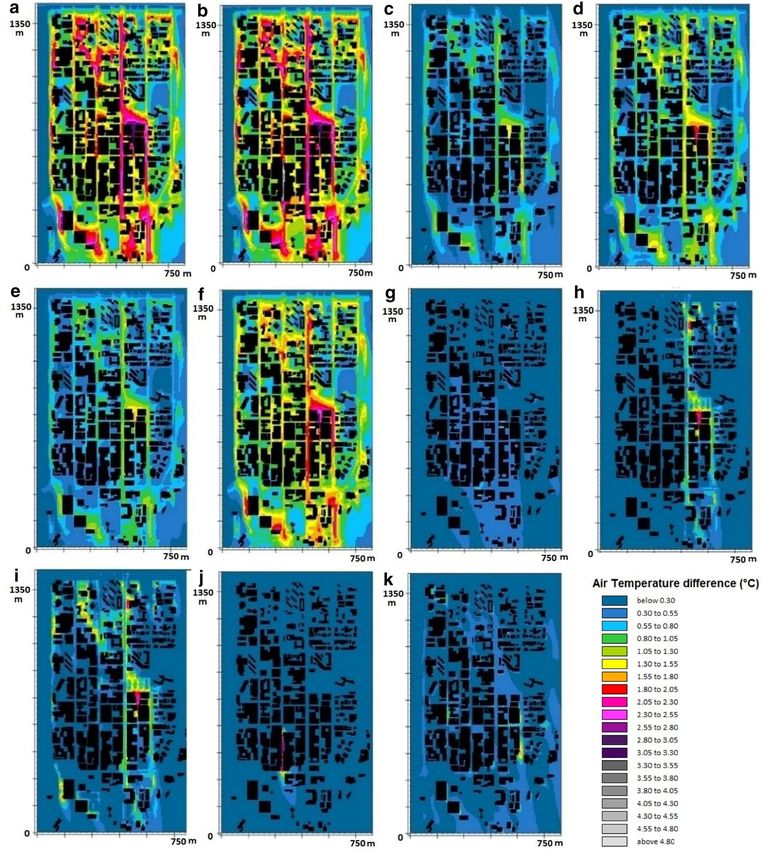
Local urban and suburban climate. We identified four main methodological approaches namely statisti-
cal analysis of climatic data, experimental campaigns, microclimate simulation, and analysis of the heat mitiga-
tion impacts (Fig. 1), applied either separately or in combination.
In all clusters of climatic data analyzed for a 10-year period, the air temperature exceeded 36.0 °C, and the
average relative humidity (RH) varied from 66 to 77% (see “Methods” and Supplementary Figure 1). The highest
ambient temperatures (with an average of 29.4 °C) occurred in 24% of the year, combined with a northwesterly
wind direction and an average wind speed of 4.7 m/s. The lowest average ambient temperature (high average
humidity) is observed during the periods when wind directions were from southeastern and north to northeast-
ern direction which is likely influenced by the national parks and development of a sea breeze flow. Southerly and
southeasterly wind directions were the prevailing synoptic conditions for the minimum ambient temperature and
humidity levels, with an average air temperature, RH, and wind speed of 25.3 °C, 66% and 4.1 m/s, respectively.
Once the synoptic boundary conditions were delineated, we carried out a short-term (three days) monitor-
ing to get an evidence-based understanding of how the heat island developed and distributed throughout the
cityscape, with due attention to the city hot and cool spots. We measured the local microclimatic conditions and
thermal response of the materials to strike links between potential causes of and remedies to urban overheating
and substantiate the selection of the mitigation scenarios (Supplementary Figure 2). Our short-term ground-
based monitoring confirmed a significant difference in the spatial distribution of air temperature (Ta) at the
pedestrian level, with the maximum T a difference between urban and suburban areas, ΔT(urban-suburban), exceed-
ing 2.0 °C. The average wind speed decreased to 0.5 m/s in the urban area, 10 times lower than that recorded
at the suburban station. Since the cityscape in Darwin is dominated by low-rise buildings and relatively wide
streets, the wind breaking was attributed to a strong convergence induced by the heat island circulation39. The
RH was higher at all urban measurement points, exceeding 75%. The spatial distribution of T s based on the data
obtained during short-term ground-based monitoring are presented in Supplementary Figure 3. Our infrared
aerial monitoring recorded very high surface temperatures ( Ts) for the streets of Darwin, exceeding 60 °C. Bitu-
men surfaces in parking lots reached temperatures of 67 °C. Roofs and street pavements also recorded high Ts
values, with peak temperatures of 66 °C and 56 °C, respectively. Dark, low-albedo construction materials used
in the urban fabric potentially affect local climatic conditions by absorbing incoming shortwave radiation and
reradiating it as longwave thermal radiation. Trees recorded lower Ts values (below 38 °C) and reduced the Ts
values of streets and pavements by over 10 °C through shading.
A second, long-term, monitoring campaign was later arranged to expand the investigation during both dry
and wet season and get an understanding of the year-round variability and spatial heterogeneity of the heat
island distribution. The long-term monitoring campaign documented consistent warm and humid conditions
throughout the year, with the 50th percentile of hourly T a above 28 °C, while the absolute minimum tempera-
ture was approximately 20.0 °C (Fig. 2). The hourly ΔT(urban-suburban) was positive for 95% of the studied period
and surpassed 5.0 °C. ΔT(urban-suburban) was larger at lower wind speeds and declined as wind speeds increased,
highlighting the role of advection in urban cooling. The nocturnal mean Ta was consistently higher in the city
Scientific Reports | (2020) 10:14216 | https://doi.org/10.1038/s41598-020-71148-x 2
Vol:.(1234567890)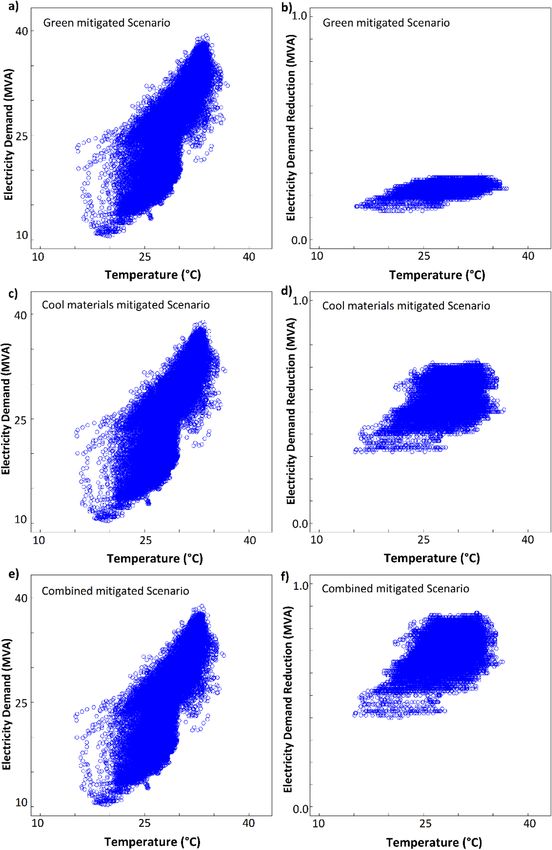
www.nature.com/scientificreports/

                            Figure 1.  Main methodological approaches and framework used in this study.

                            (on average 1.3 °C higher) than in the suburban area, suggesting that the city of Darwin cools less rapidly than
                            its surroundings (Supplementary Figure 4).
                                During the study period, the RH was above 60% for more than two-thirds of the year. The calculated wet-
                            bulb globe temperature (WBGT) was above 28 °C and 30 °C for 75% and 54% of the time, respectively, raising

Scientific Reports |   (2020) 10:14216 |              https://doi.org/10.1038/s41598-020-71148-x                                          3

                                                                                                                                     Vol.:(0123456789)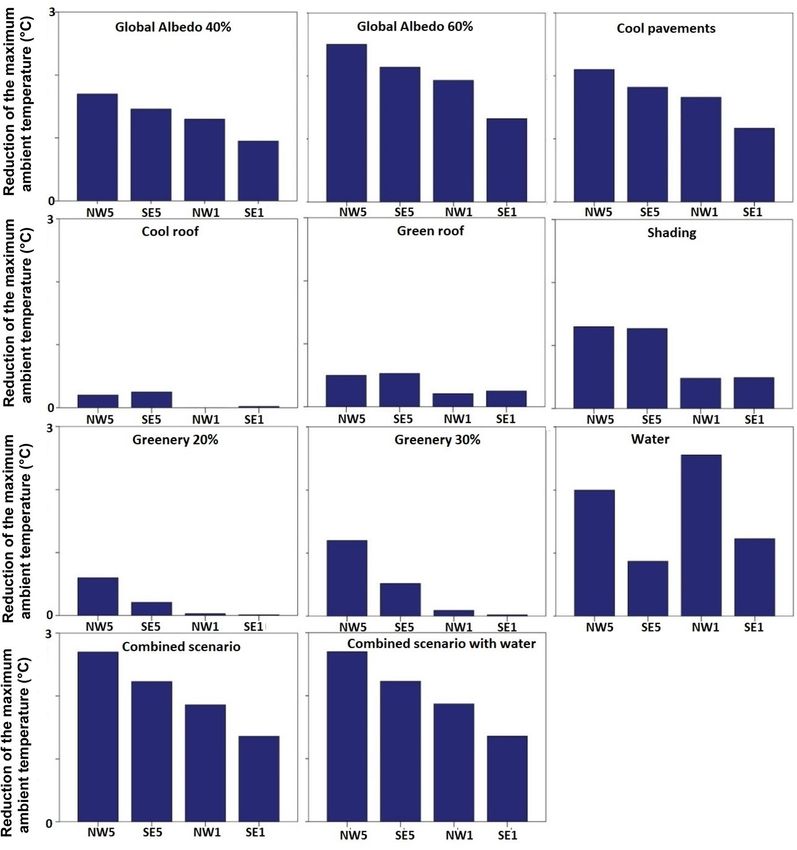
www.nature.com/scientificreports/
Figure 2. Cumulative frequency distribution of T
a, relative humidity and hourly ΔT(urban-suburban) over a year (a),
box plots of Ta, wind speed and maximum ΔT(urban-suburban) (b).
heat stress concerns during strong and extended physical exertion (Supplementary Figure 6). Similarly, the
heat index showed that residents were safe from heat in the shade for only up to 23% of the time, and exposure
to direct solar radiation would potentially increase the risk of dangerous heat disorders such as hyperthermia.
Darwin City Central suffers excessively from overheating primarily because of the way it is built. As detailed
in Supplementary Table 4, 35% of the city of Darwin is covered by unshaded blacktop bitumen and over 80% of
pathways are made of concrete and aggregate. Monitoring campaigns suggest that the overheating is amplified
by the high Ts values of the urban fabric that increase Ta, urban morphology that traps heat within the urban
canopy, reduced wind speeds and lack of cooling sea breeze due to elevated sea surface temperature (SST). The
advection rate in the city of Darwin depends on the urban form and layout of urban canyons. Areas with low-rise
open layouts recorded lower daytime ambient temperatures than other parts of the city. The cooling effects of
urban green spaces were also apparent in our results (Supplementary Figure 5). Further, locally released anthro-
pogenic heat from air conditioning additionally increases local temperatures in urban a reas40,41. However, our
campaign did not quantify its relative weight. Thus, quantification of anthropogenic heat, for instance by means
of a combination of inventories and eddy covariance measurements, is required to assess in detail its relative
contribution to Darwin’s local climate.
Mitigation potential of the proposed strategies. We examined 11 mitigation scenarios for decreasing
the ambient temperature by the increase of greenery, application of cool materials, water spray system, shading,
green roof, and combination of the selected strategies (see “Methods”). The results of microclimate simulations
are discussed here for the peak hour (14:00) of a typical warm day (20th February 2016) during wet season. In
the simulated unmitigated scenario, Ta varies between 32.0 °C and 36.4 °C, and Ts exceeds 55 °C (Fig. 3).
Simulation results (Fig. 4, Supplementary Table 10) demonstrate maximum ΔTa values of 1.7 °C and 2.8 °C
for precinct-scale increases in albedo of 0.4 and 0.6 (ALB0.4 and A LB0.6), respectively. The peak surface tempera-
ture (Ts,MAX) is reduced by 11 °C, and the highest reduction in surface temperature (MAX ∆Ts) reaches 15 °C.
The scenario with cool pavements (CP) shows air temperature range of 31.9–34.3 °C and MAX ∆Ta and MAX
∆Ts values of 2.2 °C and 15.8 °C, respectively. Ta ranges from 31.7 to 35.1 °C when shading is used in the main
streets (Fig. 3). Solar control reduces T a,MAX by 1.3 °C and decreases T s,MAX by 12 °C. The results demonstrate
that increasing greenery coverage ( G20% and G 30%) could trim T
a,MAX by 1.2 °C and lower T s by 11–23 °C. This
results in a MAX ∆Ta value of approximately 2.6 °C. By increasing the albedo of all building roofs (CR), Ta,MAX is
reduced by 0.2 °C, and MAX ΔTa reaches 0.7 °C. CR results in the pedestrian-level Ta ranging from 32 to 36.3 °C,
which indicates a negligible impact on reducing ΔTs,MAX. The application of green roofs (GR) on all buildings
reduces Ta,MAX and T s,MAX by 0.5 °C and 2 °C, respectively, and results in a MAX ∆Ta value of 1.6 °C. The use of
10 evaporative cooling systems locally in the central pedestrian mall (W) leads to a significant local ambient
temperature drop of 3.9 °C (Fig. 3). The combined mitigation scenario (ALB_SH_G) reduces Ta by 2.7 °C and
Ts by 26 °C. By adding evaporative cooling systems, the combined scenario (ALB_SH_G_W) indicates a MAX
ΔTa value of 5.2 °C in areas where water spray systems were used.
Scientific Reports | (2020) 10:14216 | https://doi.org/10.1038/s41598-020-71148-x 4
Vol:.(1234567890)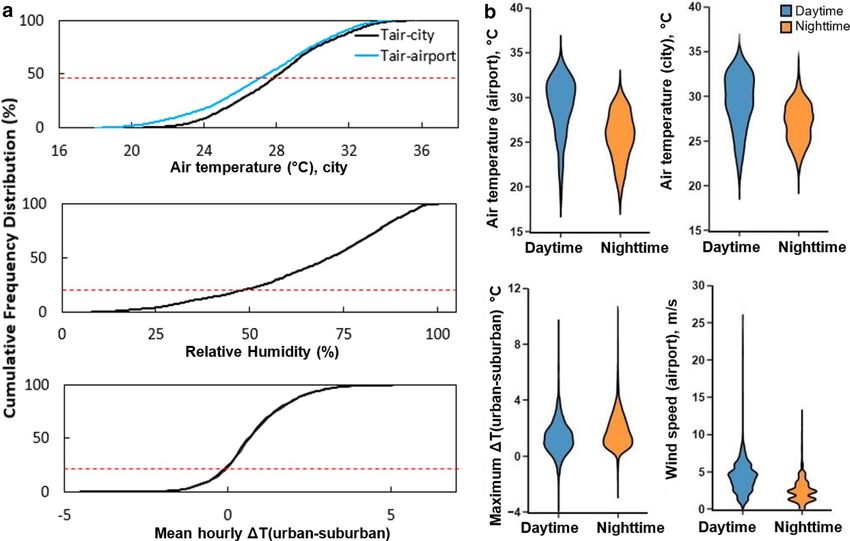
www.nature.com/scientificreports/
Figure 3. The range of ambient temperature and air temperature reduction: T
a,MAX (red marker) and Ta,MIN
(blue marker) (a), ΔTa,MAX (°C) (blue marker) and the MAX ΔTa (red marker) (b). REF (unmitigated), ALB_
SH_G (Albedo, greenery and shading), ALB_SH_G_W (albedo, shading, greenery and water), SH (shading), CP
(cool pavement), ALB 40% (albedo 0.4), ALB 60% (albedo 0.6), CR (cool roof), G 20% (greenery 20%), G 30%
(greenery 30%), W (water), GR (green roof).
The mitigation potential of the strategies varies considerably as a function of synoptic weather conditions
(Fig. 5). The use of CP, SH, G, and their combination shows higher ambient temperature reduction under higher
wind speeds, while the cooling effect of water misting on air temperature decreases under higher wind speeds.
The wind direction contributes to the MAX ∆Ta values in the G and W scenarios being 40–50% higher under a
northwesterly wind direction.
Impacts and benefits of mitigation technologies. We evaluated the impacts of the unmitigated and
mitigated local climate profiles on cooling energy needs, electricity demand, and heat-related mortality and
morbidity rates during the wet and dry seasons in 2016 using three selected mitigation strategies: i.e., urban
greenery, cool material, and combination of selected strategies (Supplementary Table 11).
Cooling energy savings. The calculated annual total cooling load is 441 kWh m−2 (Fig. 6a) for residential build-
ings in the unmitigated condition. Urban greenery reduces the annual cooling load of residential buildings by
11.6 kWh m−2 (2.6%); cool roofs and pavements by 25.8 kWh m−2 (5.8%); and the combination of greenery, cool
roofs and pavements and urban shading by 31.9 kWh m−2 (7.2%). Cooling load savings in the wet season are
higher (by 22–28%) than those in the dry weather regime, consistent with the higher air temperature reduction
observed during the wet season. For office buildings, the calculated annual total cooling load is 585 kWh m−2
in the unmitigated condition (Fig. 6b). Urban greenery can reduce the annual cooling load of office buildings
by 8.3 kWh m−2 (1.4%); cool roofs and pavements by 24.3 kWh m−2 (4.1%); and the combined scenario by
30 kWh m−2 (5.1%). The cooling load savings in the wet season are higher (by 37–67%) than those in the dry
season.
Cool materials and urban greenery may result in residential cooling load savings of 137.2 GWh and 62.0 GWh,
respectively, which are 19% and 64% lower than the cooling load savings achieved by the combined scenario
(170.1 GWh). The combined scenario saves 95.1 GWh in commercial buildings, while cool materials and green-
ery lead to savings of 76.8 GWh and 26.4 GWh, respectively. On average, 68% of the annual cooling load savings
occur during the wet season, and the remaining 32% occur during the dry season. The annual total cooling load
savings for residential and commercial buildings resulting from the application of greenery and cool materials in
the city of Darwin are estimated to be 88.4 GWh and 214 GWh, respectively. The cooling load savings for these
building stocks exceed 265 GWh y−1 with the combinations of strategies, which is 67% and 19% more than that
for greenery and cool materials, respectively.
Electricity demand reduction with mitigation. All mitigation strategies reduce the electricity demand because
the ambient temperature exceeds 18 °C, which is the temperature of minimum demand, for most of the year42
(the electricity demand data account for all consumption sources, not limited to air conditioning). The use of
greenery offers only a modest reduction with peak savings of 0.3 MVA, while the combination of mitigation
strategies achieves the largest savings of 0.8 MVA (Fig. 7, Supplementary Table 12). This corresponds to a peak
electricity demand reduction of 2% compared to the unmitigated scenario.
Heat‑related mortality and morbidity. The anomalies in hospital admissions were calculated based on the rela-
tion found with the daily maximum and mean temperatures, where anomalies in hospital admissions increased
by 7% and 8% for every 1 °C increase in daily maximum and mean temperatures, respectively. The anomalies
in daily deaths within the whole population were estimated based on the regression model developed, where an
increase of 1 °C in daily maximum temperatures raises the medians and averages of the mortality anomalies by
4.9 and 4.4%, respectively. Last, the model from Woodruff et al.79,80 was used to calculate the estimated number
of heat-related mortality among people with age of 65 and above.
The annual anomalies in hospital admissions and deaths were estimated per 100,000 population. The applica-
tion of cool materials and greenery reduces the annual excess hospital admissions of 40.14 to 27.51 and 34.67,
Scientific Reports | (2020) 10:14216 | https://doi.org/10.1038/s41598-020-71148-x 5
Vol.:(0123456789)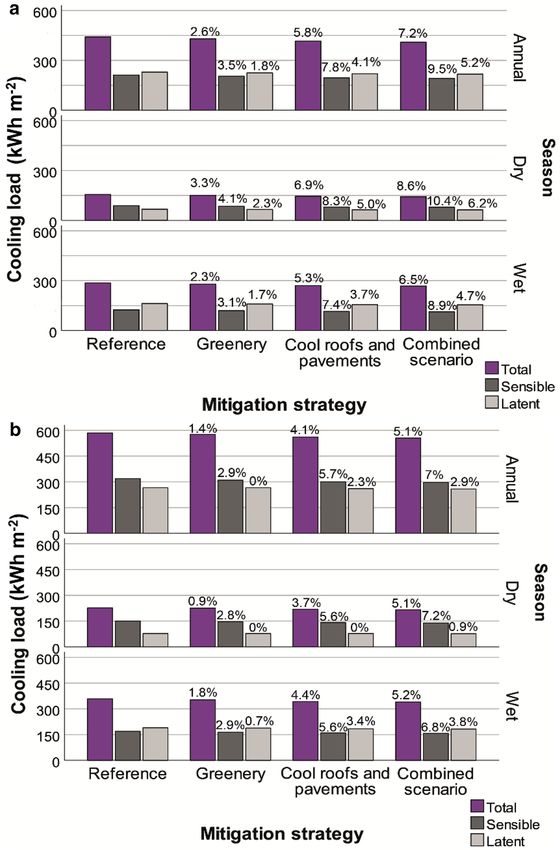
www.nature.com/scientificreports/
Figure 4. Spatial distribution of Ta in each mitigation scenario against that in the reference condition under the
prevailing summer condition: ALB_SH_G (a), ALB_SH_G_W (b), SH (c), CP (d), ALB 40% (e), ALB 60% (f),
CR (g), G 20% (h), G 30% (i), W (j), GR (k).
respectively. The combined scenario decreases the annual excess hospital admissions to 24.49 per 100,000 popula-
tion. During the days with maximum air temperatures and humidity levels above the 80th percentiles, the esti-
mated 0.96 excess hospital admissions in the unmitigated condition is reduced to − 12.21 with the combination
of strategies. These results reveal the temperature and humidity impacts on health43 and highlight the positive
contribution of the mitigation strategies.
The combination of SH, G and CP saves 9.66 excess deaths per year per 100,000 people within the Darwin
urban health district based on our developed model (Fig. 8). The number of saved lives reaches 12 when both
the urban and rural health districts are considered. Four deaths can be avoided per annum per 100,000 people
aged over 65 with the implementation of the combined mitigation scenario (Fig. 8).
Discussion
Managing the adverse effects of urban overheating needs a holistic interdisciplinary approach to understand
how the urban environment is built and responds to climate. This study offers an evidence-based methodologi-
cal approach to fill the existing knowledge gap through a comprehensive assessment of the impact of mitigation
technologies in energy, peak electricity demand, mortality and morbidity. We evaluated the impacts of mitigation
Scientific Reports | (2020) 10:14216 | https://doi.org/10.1038/s41598-020-71148-x 6
Vol:.(1234567890)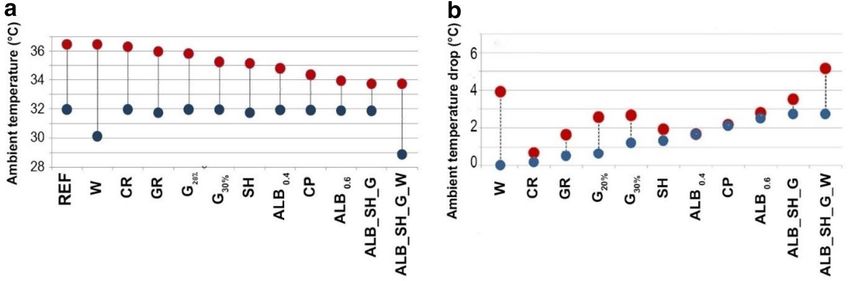
www.nature.com/scientificreports/
Figure 5. ∆Ta, MAX calculated under NW5 = North-Westerly wind of 5 m/s, SE5 = South-Easterly winds of 5 m/s,
NW1 = North-Westerly wind of 1 m/s, SE1 = South-Easterly winds of 1 m/s.
technologies applied in the tropical city of Darwin, which is particularly susceptible to heat-related illness with
increasing temperature due to global and local climate change.
The city of Darwin experienced 1,764 h above 30 °C during the period of this study (2017–2018). The
combination of high ambient air temperatures and high RH levels presents a substantial challenge for human
thermoregulation44. This is particularly relevant to labor-intensive outdoor work. The magnitude of urban over-
heating in Darwin is affected by several factors: the use of materials with high solar absorptance in the urban
fabric that stimulate advection and thermal radiation; reduced wind speed in the urban area and lack of sea
breeze due to insufficient thermal gradient between land and sea; and release of anthropogenic heat into the city
by air conditioning units and traffic that increases the urban ambient temperature by 1 ºC45. In this study, we
have demonstrated that the implementation of heat mitigation strategies can measurably slow the rate at which
the city of Darwin is warming.
The cooling potential of the mitigation strategies varies as a function of background synoptic conditions.
Increased wind speeds have a positive impact on the cooling potential of reflective surfaces, shading, and greenery
due to the increased convective cooling of the built surfaces and evapotranspiration potential of urban greenery.
In contrast, higher wind speeds decrease the mitigation potential of water spray systems because of accelerated
removal of water droplets from the target area. In this study, we used mist cooling as an efficient mitigation
strategy in hot-humid climates, as advocated in recent s tudies46. By pulverizing water into fine droplets, these
systems not only use an extremely modest water flow rate (further reduced when control logics are in place47)
but also let heat transfer (evaporation) occur even in very humid air because of the high surface-to-volume ratio.
Scientific Reports | (2020) 10:14216 | https://doi.org/10.1038/s41598-020-71148-x 7
Vol.:(0123456789)www.nature.com/scientificreports/
Figure 6. Cooling load of the residential (a) and office (b) buildings.
The urban form and layout in the city of Darwin affect the advection and thus change the cooling potential
of the strategies under different synoptic conditions. Local and global application of mitigation strategies also
impact cooling potential. The mitigation technologies contribute to decreasing T s and thus improving outdoor
thermal comfort by reducing the emitted infrared radiation and convected sensible heat from opaque surfaces.
The ambient temperature in Darwin, which has a tropical savanna c limate48, exceeds the typical setpoint
for cooling (here 24 °C) for approximately 90% of the time, which highlights the important cooling demand of
buildings. A large fraction of the cooling loads in Darwin are represented by latent heat loads due to the high
humidity levels for substantial periods of the year. Thus, the application of mitigation techniques has a negligi-
ble impact on the latent cooling demand. Regarding the sensible load, we obtained a decrease of approximately
10% (25–30 kWh m−2 y−1) with the mitigation strategies. The maximum total cooling load reduction with the
most effective mitigation strategy is 7.2% and 5.1% for residential and office buildings, respectively. Although
the reduction percentage may seem low, the impact of the mitigation strategies results in large cooling demand
savings based on the absolute values (30–32 kWh m−2 y−1).
To achieve greater reductions in residential and commercial building energy needs, the focus should be
placed on improving building energy performance. We considered uninsulated buildings with poor thermal
performance representing building stocks developed prior to the introduction of building energy efficiency
regulations. However, the cumulative annual savings in the combined scenario account for more than 250 GWh.
Scientific Reports | (2020) 10:14216 | https://doi.org/10.1038/s41598-020-71148-x 8
Vol:.(1234567890)www.nature.com/scientificreports/
Figure 7. Electricity demand and absolute savings in the green mitigation scenario (a,b), cool materials
scenario (c,d) and combined scenario (e,f).
Natural ventilation is not a viable option to maintain comfortable indoor conditions due to the high ambient
humidity and lack of cool sea breeze to reduce the ambient temperature during nighttime. This is a challenge in
many hot-humid areas where sea breezes bring no relief because of high SST and limited air–sea interactions.
Uncertainty in the absolute values of cooling energy savings at the urban scale may be expected49 due to the
ccupants50. Our results are
diversity of building stocks and the variance in the adaptive behavior of building o
Scientific Reports | (2020) 10:14216 | https://doi.org/10.1038/s41598-020-71148-x 9
Vol.:(0123456789)www.nature.com/scientificreports/
Figure 8. Calculated impact on the annual cumulated anomalies in morbidity and mortality per 100,000
population in the unmitigated and the mitigated scenarios the Darwin Urban Health District, and the Urban
and Rural Health Districts.
presented relative to the unmitigated scenario; nevertheless, we acknowledge high nonlinearity in user behavior,
such as opening w indows51.
The performance of the surrogate model is robust for the peak and minimum electricity demand; however,
it is suboptimal in the intermediate demand range. The peak electricity demand is approximately 5.5 kW per
capita for the population of over 7,000 people in the city of Darwin. The peak demand reduction is 0.11 kW,
which is not negligible in absolute terms. The city of Darwin has a small area with several hotels and a rapidly
expanding population, inducing high uncertainty in the estimation of individual energy use. Therefore, it is not
possible to normalize the demand per capita to compare different periods for significant changes to population
density and use long data series.
The absolute humidity has a nonlinear effect on the electricity demand. This is likely due to the dehumidifi-
cation process in traditional air conditioning systems, which need a coil temperature lower than the dew point
temperature to remove moisture by condensation. After moisture removal, the air is reheated to supply comfort
conditions, which generates an excess load. Other types of building cooling technologies, such as desiccant or
hybrid air conditioning, offer potential alternative solutions for overcoming this i ssue52.
Exposure to hot-humid conditions outdoors and physical exertion lead to the development of heat stress or
stroke due to the limited potential for body heat loss, hydration, and shaded rest breaks that reduce the accu-
mulation of body heat. Our mitigation scenarios decrease the negative heat-related health outcomes, and the
largest improvement is achieved with the combination of strategies. Nevertheless, this study does not discuss the
benefits of denser green infrastructure, such as reduced storm water run-off, air pollution reduction, increased
space for recreation and higher biodiversity53–55.
Climate change threats to health reinforce the need for mitigation and adaptation of urban areas and build-
ings to reduce heat exposure and public health p rograms17. However, evidence-based approaches to sustainable
development require integrated knowledge about the environment, development, and health56. Although the
implications of research findings may vary depending on the context and time scale, a holistic methodologi-
cal approach is crucial to shift toward a more environmentally sustainable future. Thus, it is recommended to
address the challenges of energy sustainability and climate change through interdisciplinary and mission-oriented
research coupled with the science of human and natural systems57.
Methods
The study area. Darwin is the capital of the Northern Territory (NT), located in the northernmost part of
Australia. It features a tropical savanna (Aw) c limate48,58. Darwin local government area (LGA) recorded 78,804
residents in 201659. It covers a land area of 112 km2, and the total floor area is 8,492,553 m2 for residential and
commercial buildings60. The monitoring and mitigation study covers a land area of about 1.0 km2, which is part
of the Darwin City Central with an area of 3 km2. We assessed the impacts of the mitigation at different city
scales based on the availability of the required data. We received the semi-hourly electricity demand data from
Power and Water Corporation for the Darwin City Central, which comprises the City Centre and the Frances
Bay area. We obtained land use data from Darwin LGA for building energy demand analysis. Darwin urban and
rural health data were obtained from the department of Health and families for Greater Darwin (3,163 km2) and
Darwin rural area.
Weather data. Semi-hourly weather data were obtained from the Bureau of Meteorology (BoM) weather
station located in Darwin airport (Lat: 12.42°S; Long: 130.89°E; elevation: 30.4 m above mean sea level, BoM
station number 014015, WMO ID 94120), 6 km from the city, based on the records of the last 10 years from
Scientific Reports | (2020) 10:14216 | https://doi.org/10.1038/s41598-020-71148-x 10
Vol:.(1234567890)www.nature.com/scientificreports/
200761. The measured quantities are dry-bulb and wet-bulb air temperatures, wind speed and direction, and
air pressure. Moreover, also 1-min radiation data are collected, including global horizontal irradiance, diffuse
irradiance, and incoming thermal radiation. The location of the airport station is provided in Supplementary
Figure 2. We performed an analysis of the hourly climate data recorded over 10 years at the Darwin BoM airport
station and found four clusters of synoptic weather conditions for the three main climatic parameters: i.e., ambi-
ent temperature, ambient humidity and wind direction. The K-Means Clustering technique was used to classify
the data and extract the main scientific conclusions. The analysis permits to understand the main climatic char-
acteristics of the city (Supplementary Figure 1). Humidity and temperature are clustered in four groups of very
high, high, average, and low conditions. The four clusters of wind directions are north to east (0°–90°), east to
south (9°–190°), south to west (190°–290°), west to north (190°–360°).
For the purpose of the energy and electricity demand analysis, we focused on semi-hourly data obtained
from February 2016 to December 2017. Unrealistic values were filtered by performing range, step, persistence,
and relational tests48. The validation procedure for the radiation data was performed on the 1-min raw data
from Darwin airport weather station (part of the Baseline Surface Radiation Network62) by the same procedure
described above. We used the solar position calculated with the model by Reda and A ndreas63 to cut off night-
time solar readings (due to instruments zero offset) and linearly interpolate with the cosine of solar zenith angle
for missing values.
To fill in the gaps in the data series, we linearly interpolated between values for gaps of three hours. To estab-
lish a relation between the measurement campaigns in the city of Darwin and the airport, we used the genetic
algorithms implemented in the heuristic software tool Eureqa64. With the developed correlation, we computed
the urban air temperatures in the unmitigated scenario and then computed the mitigated ambient temperatures
using the correlations found for the dry (May to October) and wet (November to April) periods.
Data collection protocol. Three‑day measurement campaign. We performed the measurement cam-
paign during the wet season from 23rd to 25th March 2017. The aim of short-term monitoring was to identify
the distribution of the urban microclimate in the city by collecting aerial thermal images of the urban surface
and ground-based microclimatic parameters through a mobile sensor network. Local specificities (e.g. materials,
canopy, proximity to the sea) were thus linked to the onset of hot and cool spots to substantiate the design of
bespoke mitigation scenarios. The resulting database provided the necessary information for the first simulation
run in the wet season and was used to compare the patterns of the measured and simulated surface temperatures.
Supplementary Tables 1 to 3 show the equipment specifications.
Aerial monitoring. The ground-based monitoring was performed on 23rd and 24th March 2017. We recorded
the surface temperatures of the materials used in the urban fabric by aerial infrared (IR) imaging with a drone.
The thermal camera collected images and videos to capture extensive, time-aligned visual information on sur-
face temperature consistent with recent studies65,66, with the thermal emittance of typical values for material
classes. It was complemented with the reflectance properties retrieved by a ground-level net radiometer.
Ground‑based monitoring. The ground-based monitoring was performed on 24th and 25th March 2017 from
11:00 to 18:00. We collected air temperature, RH, wind speed and direction, solar radiation and heat flux at 20
points (Supplementary Figure 2). Measurements were taken at 1.1 m above the ground representing the height
erson67. The net radiometer was located at 0.5 m above street level to record ground-level radia-
of a standing p
tive data and optical properties. The analogic outputs of the net radiometer and the serial SDI-12 outputs of the
weather station were connected to a datalogger (DataTaker DT85). The monitoring methods were developed
based on existing literature5,68–74.
Long‑term monitoring campaign. We carried out measurements of air temperature over twelve months from
11th September 2017. The aim was to depict the year-round dynamical modifications of the heat island distribu-
tion across the city, accounting for dry and wet season specificities. The long-term data collection informed a
second simulation run, with extensive time and space-resolved calibration. The resulting database allowed a solid
validation of the model. The ambient temperature was simultaneously recorded every 30 min in 15 locations in
the city of Darwin using LogTag TRIX-16 temperature recorders (Supplementary Figure 2). Each temperature
recorder was placed in radiation shields and mounted to the streetlight poles at a height of approximately 2.5 m
above the ground. The obtained data were analyzed and compared with a reference located in Darwin airport to
determine ΔT(urban-suburban).
Microclimate simulations. We simulated the microclimate and the environmental conditions in Darwin
with the software model ENVI-met V4.1.2. This 3-D microclimate model simulates the all-wave radiative (solar
and infrared), sensible and turbulent latent heat exchanges by means of computational fluid dynamics between
urban surfaces, plants and the atmosphere75 and has been validated in several projects76,77. The simulation
domain had 244 × 166 × 24 (x–y–z) cells with sizes of 6 m, 6 m, and 0.5 m, respectively. The mesh in the vertical
direction was finer near the ground, allowing a better accuracy for edge effects, with a telescoping grid increase
factor of 20%. The telescoping effect allows the highest building height of 80 m in the model to be obtained.
The height of the top of the 3D model was 179.68 m, with sufficient space above the model as recommended78.
The model had a mix of residential and commercial land uses covering an area of over 1 km2 (width 780 m and
length 1,390 m). Floor area ratio in the simulation domain is about 1.3. The model was forced with data out of
the simulation domain (Darwin airport weather s tation61), providing the boundary conditions. We modeled the
Scientific Reports | (2020) 10:14216 | https://doi.org/10.1038/s41598-020-71148-x 11
Vol.:(0123456789)www.nature.com/scientificreports/
unmitigated scenarios with the relevant albedo of buildings and urban surfaces typical of built environments
(Supplementary Table 5). Then, we simulated different mitigation scenarios with the description given below:
– G20% and G30%: increased greenery to occupy 20% and 30% of the open spaces with a plantation of grass and
additional 260 and 477 mature trees with very dense foliage (Height: 15 m; Albedo: 0.2; Transmittance: 0.3),
respectively. Trees and plants were placed in open spaces creating small, medium, and large green spaces;
– ALB0.4 and A LB0.6: the global-scale (city-scale) application of cool materials, yielding an increase in albedo
of all pavements and roofs in the city from 0.2 to 0.4 and 0.6, respectively;
– W: the application of 10 water spray systems at a height of 4 m in the city center commercial district (Droplet
diameter: 10 µm; Droplet density: 1 g/cm3; Emission rate: 5 µ/s);
– CP: the application of cool materials, i.e., reflective pavements, with an albedo of 0.5;
– SH: providing solar control and shading on top of the main streets of Darwin;
– GR: the use of green roofs in all buildings by planting grass as roof top greening;
– CR: the application of cool materials, i.e., reflective roofs with an albedo of 0.85;
– ALB_SH_G: the combination of a precinct-scale increase in albedo to 0.6, application of shading on streets
and parking lots, and 30% increased greenery;
– ALB_SH_G_W: the combination of a precinct-scale increase in albedo to 0.6, application of shading on streets
and parking lots, 30% increased greenery, and the water spray systems.
We assessed the prevailing summertime synoptic conditions (northwesterly wind direction with a speed of
5 m/s) in the unmitigated and mitigated scenarios using the same boundary conditions. In total, 48 simulations
were performed for the northwesterly and southeasterly wind directions with wind speed values of 5 m/s and
1 m/s. These synoptic conditions correspond to the highest and lowest average ambient temperatures. We dis-
cuss the model outputs for the southeasterly synoptic conditions for comparison. For the purpose of analysis,
the microclimate simulations were performed for a typical warm day (20th February 2016) in wet season and a
representative day in dry season (24th June).
Validation of the model. Supplementary Table 6 summarizes the settings for each simulation ran for the
purpose of validation during different seasons with dry and wet surface conditions. In this study, we used coef-
ficient of determination ( R2), root-mean-square error (RMSE) and mean average error (MAE) as measures of
overall model fit. RMSE helps to capture the differences in absolute values between the simulated and measured
data, while R2 determine the strength of relationships between variables.
We simulated the unmitigated scenario based on the conditions in the three-day monitoring campaign from
07:00 for 12 h using climate data obtained from Darwin airport weather s tation61. The predicted T s was close to
the spatial distribution of Ts measured in the ground-based and aerial monitoring (Supplementary Table 7 and
Figure 7 (a and b)). The coefficient of determination (R2) between the simulation and measurement Ts was 0.95.
To compare simulated and measured Ta, the experimental data obtained from the network of 14 tempera-
ture sensors were used to validate the microclimate model of the city of Darwin. We simulated the unmitigated
scenario with the boundary condition of three days during the long-term monitoring campaign. We employed
semi-hourly meteorological data from the BoM weather station to generate the forcing file for the simulation
and adjusted the solar radiation by a factor of 0.90 to match the solar radiation data. We ran the simulation for
46 h for the selected days in wet season starting three hours before sunrise (03:00, 18–19 November 2017) with
updated surface data every 30 s. Then, we used the model output data from 06:00 for analysis. We also ran the
simulation for a day in dry season (14 May 2018) to evaluate the model T a performance in a different season.
Simulations were performed for 15 h and model outputs from 8:00 to 14:00 were compared with the observed
Ta. For the regression analysis, the modeled and observed values were compared independently for each urban
weather station. The evaluation of the model performance using correlation and difference measures are tabulated
in Supplementary Table 8.
Supplementary Figure 7 (c and e) depicts the simulation outputs ( Ta) plotted against the data measured in
Darwin city during wet and dry seasons. The regression analysis between the measured and simulated Ta values
suggests that the ENVI-met model reproduces the measured data and the major features of the temporal and
spatial distributions of the near-ground air temperature in the city. The obtained R2 between the simulation and
measurement results was 0.9 (wet season) and 0.8 (dry season). When measured and simulated Ta for all urban
stations are compared, RMSE was 1.24 °C and 1.20 °C for wet and dry seasons, respectively. The RMSE between
the model estimations and the actual measurements during the wet season varied from 0.93to 1.54 °C and MAE
was between 0.83 and 1.34 °C when data from individual stations were used.
The hourly average T a (average of all urban stations) is shown for the simulated and observed data (Supple-
mentary Figure 7 (d and f)). The mean discrepancy between the average measured and simulated T a over 43 h of
the selected days in wet season is 0.97 °C (Standard Deviation = 0.5), and 0.88 (Standard Deviation = 0.5) in dry
season. The model underestimates measurement at night, which is explained by the initialized boundary condi-
tion of the airport. This is clear from the graph showing spatially averaged T a. The ENVI-met model performance
can be enhanced when locally measured initialization parameters are used80; however, we constructed ENVI-met
model according to the actual geometry of the city and initial boundary condition based on the data obtained
from the airport due to lack of available meteorological data in the city of Darwin.
The simulated data show generally a good agreement with observed meteorological station data, which was
apparent with both R2 and difference indices. The slight discrepancy in the simulated data and the corresponding
errors can be explained by (a) the anthropogenic heat flux resulting from the use of air conditioners, transpor-
tation and other human activities that cannot be taken into account in the model and (b) inaccuracies in the
Scientific Reports | (2020) 10:14216 | https://doi.org/10.1038/s41598-020-71148-x 12
Vol:.(1234567890)www.nature.com/scientificreports/
simulation inputs for surface materials, soil, vegetation conditions, and solar radiation. The stations placed at
the northern boundaries of the model reveal slightly higher temperatures in the simulations than those in the
observations because of the model edge, which performs as an entry door to the warm northeasterly winds. Our
model was deemed reliable for microclimate simulation with a performance similar to other studies in tropical
cities79,80 considering that this study aims to define relative quantities such as air temperature reductions rather
than absolute values.
Impacts of mitigation. The three mitigation strategies of urban greenery (G30%); use of cool materials
(ALB0.6); and the combined scenario of cool pavements, shading, and greenery (ALB_SH_G) were selected.
Calculation of building energy needs. We used dynamic building energy simulations (BESs) to examine the
energy savings of two buildings representative of Australian building stocks for low-rise dwellings and offices
with the application of mitigation strategies. We computed the multizone building energy balance with Ener-
gyPlus as a BES e ngine57, using 2016–2017 weather data. The modeled residential building is a brick veneer
single-story building with a total floor area of 218 m2. The office building has three stories with a total floor area
of 4,840 m2. We used typical building models and simulation settings, which are provided in Supplementary
Figure 8 and Table 9. According to Geoscience Australia – N EXIS60, majority of residential buildings in Darwin
LGA are detached houses with a metal sheeting roof. The average building area is 246 m2 and 91% of buildings
were built before 1980. Further, 40% of commercial buildings in Darwin LGA have 1–3 stories and mostly built
before 1980s. Thus, most of the existing building stock were built before the introduction of the energy conserva-
tion measures in National Construction Code. The two buildings are representative of the non-retrofitted build-
ing stock, which demonstrates a large fraction of existing building stock in Darwin LGA.
We calculated the total, sensible, and latent cooling needs for residential and office buildings on an annual
and seasonal basis using modified weather data for the mitigation scenarios. For the mitigated scenarios, the
ambient temperature in the weather files for the mitigated scenarios is reduced by the different mitigation tech-
nologies whose effect was simulated with the microclimate model, the relative humidity recomputed at the lower
temperature with the same specific humidity and all the other weather parameters unchanged. We computed
the cumulative cooling energy savings for the LGA based on the total floor area of residential and commercial
buildings in the city of Darwin.
Electricity demand statistical information. To quantify the impact of the local climate mitigation strategies on
the electricity demand, we developed a model with the measured electricity data for the unmitigated condition
(see Supplementary Figure 2). We derived the relation between ambient conditions and electricity demand and
thus the impact of local climate mitigation strategies. We computed a correlation between the urban environ-
mental parameters and semi-hourly electricity demand using the Eureqa tool for the dry and wet periods49.
Considering the rapid increase in population in recent years, the variation in the metering system and efficiency,
and the small size of the city with a large number of visitors, the period from February 2016 to December 2017
was analyzed. We developed a parametrization that provides the average urban temperature (Ta,urb) as a func-
tion of the airport air temperature (Ta,airport), global horizontal irradiance (GHI), and wind speed (U) as follows:
Ta,urb = 10.21+0.675×sma Ta,airport , 3 +0.002×GHI+0.055×Ta,airport ×sma(U, 7)−1.729×sma(U, 7)+1.832e−6×GHI2
(1)
where sma(x, n) is the simple moving average of the previous n records of the quantity x. The surrogate model
shows an R2 of 0.93; a median absolute error of 0.3 ºC; and for 99% of the values, the error is less than 2 °C (Sup-
plementary Figure 9).
There were some outliers due to thunderstorms that reached the urban area and the airport inducing a sudden
temperature drop. The surrogate model can reproduce the trend and the peaks in the urban temperature profile,
at times with a time shift of 30–60 min, with most of the discrepancies occurring during nighttime. We derived
a surrogate model to compute the semihourly electricity demand ( ELDem) in MVA as a function of T a,airport, dew
point temperature (Td), and GHI (Supplementary Figure 10) as follows:
ELDem = 3.024 + 0.897 × sma Ta,airport , 54 + 0.0003. Td × sma(GHI, 3)
− 1108/(107.058 + 0.3116 × delay(GHI, 285) + 0.0326 × GHI × delay(GHI, 285) + sma(GHI, 12)
(2)
where sma(x, n) is the simple moving average of the previous n records of the quantity x. Delay(x, n) represents
a delayed variable; namely, for time step t, it considers its value n time steps before.
Equation (1) was used to compute the mitigated temperatures translated to the airport. We used this inverted
approach looking for a correlation between electricity and airport data to minimize error propagation, consid-
ering the performance during the training of the model. We developed the correlation given in Eq. (1) instead
of using measured urban ambient temperatures since the urban temperature data have been collected for one
year (from September 2017) while the electricity demand data relate to an earlier and longer period (February
2016–December 2017). Therefore, a transformation function was necessary.
Based on the results of the surrogate model, humidity has a nonlinear impact on the demand, affecting the
performance of the parametrization in the intermediate temperature range, while the demand is monotonic with
temperature (Supplementary Figure 10). The performance of the surrogate model ( R2 = 0.79) is comparable to that
of Thatcher42, with an r-squared value equal to 0.82. The surrogate model captures the fuzziness in the demand
but shows a strong influence on the humidity level, which explains the peak electricity demand that occurs for
both hot and humid conditions (Supplementary Figure 11).
Scientific Reports | (2020) 10:14216 | https://doi.org/10.1038/s41598-020-71148-x 13
Vol.:(0123456789)www.nature.com/scientificreports/
Heat‑related health statistical information. We calculated the heat-related mortality and morbidity for the miti-
gation scenarios using modified half-hourly temperatures based on the simulation results. Half-hourly tempera-
tures and RH values were obtained from Darwin BoM airport station between January 2002 and June 2017 and
validated using the method described above. The all-cause mortality data (between 2000 and 2015) and the
daily hospital admission data considering only heat-relevant diagnoses (between July 2000 and June 2017) were
provided by the Northern Territory Government Department of Health. We classified hospital admissions as
‘heat-relevant’ based on previous studies81,82.
To estimate the improvement in the whole population’s heat-related health, we developed the relationship
between the weather parameters and daily mortality and morbidity rates. To account for longitudinal, sea-
sonal, and cyclic changes, the time series of mortality and morbidity data were decomposed using exponential
smoothing and Fourier series. Regression analysis was adopted to assess and describe the relationship between
two variables.
Due to a lack of cold-related health issues81, any temperature-related anomalies in morbidity and mortality
can be defined as heat-related. The analysis showed strong relationships between the daily anomalies in hospi-
tal admissions within the Darwin urban health district and both the daily maximum and mean temperatures
between 2002 and 2017 (p = 0.00). An increase of 1 °C in the daily maximum temperature increases hospital
admissions by 7.9%, while a 1 °C rise in the daily mean temperature elevates that by 6.6%. When the dataset was
filtered for days with higher temperatures and RH levels, the strongest significant relations were found on days
with both daily mean temperatures and RH levels above the 80th percentiles calculated for the whole period.
On these hot days with high humidity, a 1 °C increase in the daily maximum temperature raised the number of
hospital admissions by 263%.
We analyzed the relationship between the daily anomalies in deaths and the weather parameters using the
same method18,83. The regression analysis (Supplementary Figure 12) showed relationships between both the
medians and averages of the daily anomalies in deaths and daily maximum temperatures binned in a 1 °C increase
(adjusted R2 = 0.46, p = 0.005 and adjusted R2 = 0.32, p = 0.021, respectively). An increase of 1 °C in daily maximum
temperatures raises the medians and averages of the mortality anomalies by 4.9 and 4.4%, respectively.
The analysis was repeated (Supplementary Figure 13) for the mortality data series aggregated for the Darwin
urban and rural health districts (adjusted R2 = 0.50, p = 0.003 and adjusted R2 = 0.33, p = 0.018, respectively). An
increase of 1 °C in daily maximum temperatures increases the medians and averages of the mortality anomalies
for the whole urban and rural regions by 6.4% and 5.3%, respectively.
Daily mortality data for the age group above 65 were not available for confidentiality reasons. Therefore,
we used the model of Woodruff et al.81,82 corresponding to heat-related mortality of people aged over 65 years.
Both our new models described above and the model from Woodruff et al.81,82 were used to calculate the
impact of mitigations on heat-related health for the whole and the oldest populations in Darwin.
Received: 20 December 2019; Accepted: 10 August 2020
References
1. Ramaswami, A. et al. Sustainable Urban Systems: Articiulating a Long-Term Convergence Research Agenda (2018).
2. Contestabile, M. Future urban research. Nat. Sustain. 1, 114–114. https://doi.org/10.1038/s41893-018-0037-9 (2018).
3. Oke, T. R. The energetic basis of the urban heat island. Q. J. R. Meteorol. Soc. 108, 1–24. https://doi.org/10.1002/qj.49710845502
(1982).
4. McCarthy, M. P., Best, M. J. & Betts, R. A. Climate change in cities due to global warming and urban effects. Geophys. Res. Lett.
37, L09705 (2010).
5. Santamouris, M. Analyzing the heat island magnitude and characteristics in one hundred Asian and Australian cities and regions.
Sci. Total Environ. 512, 582–598 (2015).
6. Santamouris, M. & Kolokotsa, D. Urban Climate Mitigation Techniques (Routledge, Abingdon, 2016).
7. Founda, D. & Santamouris, M. Synergies between Urban Heat Island and Heat Waves in Athens (Greece), during an extremely
hot summer (2012). Sci. Rep. 7, 10973 (2017).
8. Asimakopoulos, D. A. et al. Modelling the energy demand projection of the building sector in Greece in the 21st century. Energy
Build. 49, 488–498. https://doi.org/10.1016/j.enbuild.2012.02.043 (2012).
9. Santamouris, M. Regulating the damaged thermostat of the cities—Status, impacts and mitigation challenges. Energy Build. 91,
43–56 (2015).
10. Santamouris, M. On the energy impact of urban heat island and global warming on buildings. Energy Build. 82, 100–113 (2014).
11. Santamouris, M., Cartalis, C., Synnefa, A. & Kolokotsa, D. On the impact of urban heat island and global warming on the power
demand and electricity consumption of buildings—A review. Energy Build. 98, 119–124 (2015).
12. Santamouris, M. Cooling the buildings—Past, present and future. Energy Build. 128, 617–638. https://doi.org/10.1016/j.enbui
ld.2016.07.034 (2016).
13. Santamouris, M. Recent progress on urban overheating and heat island research. Integrated assessment of the energy, environ-
mental, vulnerability and health impact. Synergies with the global climate change. Energy Build. 207, 109482 (2020).
14. Semenza, J. C. et al. Heat-related deaths during the July 1995 heat wave in Chicago. N. Engl. J. Med. 335, 84–90 (1996).
15. Semenza, J. C., McCullough, J. E., Flanders, W. D., McGeehin, M. A. & Lumpkin, J. R. Excess hospital admissions during the July
1995 heat wave in Chicago. Am. J. Prev. Med. 16, 269–277 (1999).
16. Michelozzi, P. et al. The impact of the summer 2003 heat waves on mortality in four Italian cities. Euro Surveill 10, 161–165 (2005).
17. Kjellstrom, T., Gabrysch, S., Lemke, B. & Dear, K. The ‘Hothaps’ programme for assessing climate change impacts on occupational
health and productivity: an invitation to carry out field studies. Glob. Health Action 2, 2082 (2009).
18. Nicholls, N., Skinner, C., Loughnan, M. & Tapper, N. A simple heat alert system for Melbourne, Australia. Int. J. Biometeorol. 52,
375–384 (2008).
19. Loughnan, M. E., Nicholls, N. & Tapper, N. J. When the heat is on: Threshold temperatures for AMI admissions to hospital in
Melbourne Australia. Appl. Geogr. 30, 63–69 (2010).
Scientific Reports | (2020) 10:14216 | https://doi.org/10.1038/s41598-020-71148-x 14
Vol:.(1234567890)You can also read