Precipitation response to aerosol-radiation and aerosol-cloud interactions in regional climate simulations over Europe
←
→
Page content transcription
If your browser does not render page correctly, please read the page content below
Atmos. Chem. Phys., 21, 415–430, 2021
https://doi.org/10.5194/acp-21-415-2021
© Author(s) 2021. This work is distributed under
the Creative Commons Attribution 4.0 License.

Precipitation response to aerosol–radiation and aerosol–cloud
interactions in regional climate simulations over Europe
José María López-Romero1 , Juan Pedro Montávez1 , Sonia Jerez1 , Raquel Lorente-Plazas1,2 , Laura Palacios-Peña1,2 ,
and Pedro Jiménez-Guerrero1,3
1 Physicsof the Earth, Regional Campus of International Excellence (CEIR) “Campus Mare Nostrum”,
University of Murcia, 30100 Murcia, Spain
2 Department of Meteorology, Meteored, 30893 Murcia, Spain
3 Biomedical Research Institute of Murcia (IMIB-Arrixaca), 30120 Murcia, Spain

Correspondence: Juan Pedro Montávez (montavez@um.es)

Received: 20 April 2020 – Discussion started: 18 May 2020
Revised: 16 November 2020 – Accepted: 25 November 2020 – Published: 14 January 2021

Abstract. The effect of aerosols on regional climate sim-         precipitation decrease occurs for all ranges of precipitation
ulations presents large uncertainties due to their complex        rates. On the other hand, the model produces an increase in
and non-linear interactions with a wide variety of factors,       precipitation over the eastern Mediterranean basin associated
including aerosol–radiation (ARI) and aerosol–cloud (ACI)         with an increase in clouds and rainy days when ACIs are
interactions. These interactions are strongly conditioned by      implemented. Here, the change is caused by the high pres-
the meteorological situation and type of aerosol, but, despite    ence of PM10 (low PM2.5 /PM10 ratios, pointing to natural
their increase, only a limited number of studies have covered     aerosols). In this case, the higher amount of precipitation af-
this topic from a regional and climatic perspective.              fects only days with low rates of precipitation. Finally, there
   This contribution thus aims to quantify the impacts on pre-    are some disperse areas where the inclusion of aerosols leads
cipitation of the inclusion of ARI and ACI processes in re-       to an increase in precipitation, especially for moderate and
gional climate simulations driven by ERA20C reanalysis. A         high precipitation rates.
series of regional climatic simulations (for the period 1991–
2010) for the Euro-CORDEX domain were conducted in-
cluding ARI and ARI + ACI (ARCI), establishing as a ref-
erence a simulation where aerosols were not included inter-       1   Introduction
actively (BASE).
   The results show that the effects of ARI and ACI on time-      The importance of atmospheric aerosols has multiple as-
mean spatially averaged precipitation over the whole domain       pects, all of great scientific and socioeconomic relevance.
are limited. However, a spatial redistribution of precipitation   First, the World Health Organization (WHO, 2013) has rec-
occurs when the ARI and ACI processes are introduced into         ognized that the degradation of air quality by atmospheric
the model, as well do changes in the precipitation intensity      aerosols is a threat to human health. Second, the Fifth Assess-
regimes. The main differences with respect to the base-case       ment Report (AR5) of the Intergovernmental Panel on Cli-
simulations occur in central Europe, where a decrease in pre-     mate Change (IPCC) points to atmospheric aerosols as one
cipitation is associated with a depletion in the number of        of the main sources of uncertainty in current climate simula-
rainy days and clouds at low level (CLL). This reduction          tions (Boucher et al., 2013). Myhre et al. (2013) indicate that
in precipitation presents a strong correlation with the ratio     the uncertainty in the radiative forcing produced by aerosols
PM2.5 /PM10 , since the decrease is especially intense during     greatly exceeds that of all other forcing mechanisms com-
those events with high values of that ratio (pointing to high     bined.
levels of anthropogenic aerosols) over central Europe. The           Despite the increasing number of articles published on
                                                                  the interactions between aerosols and climate over the last

Published by Copernicus Publications on behalf of the European Geosciences Union.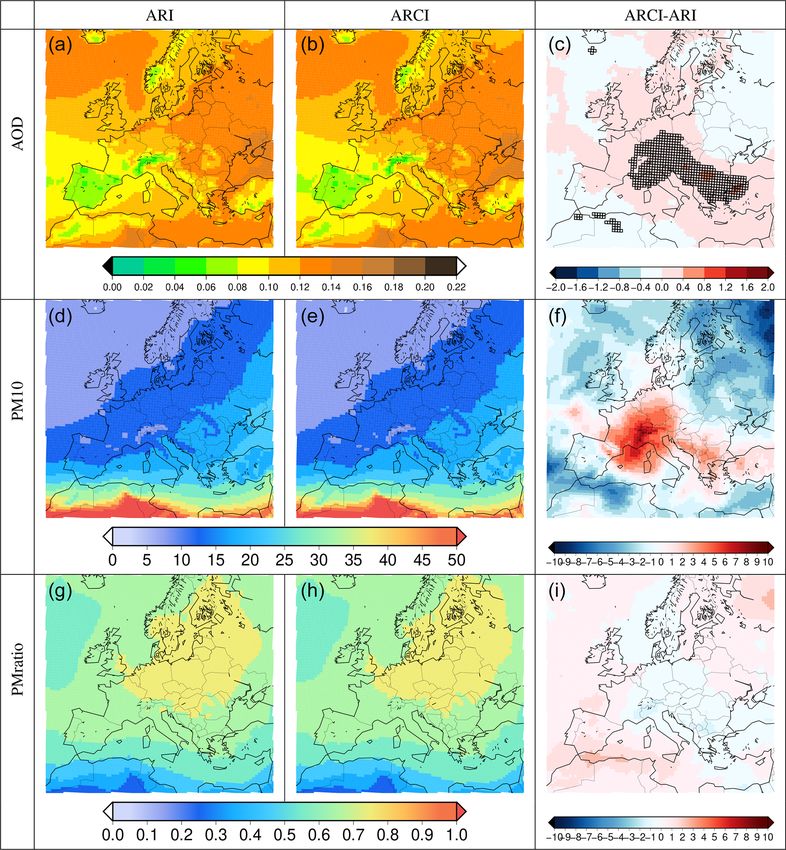
416                                      J. M. López-Romero et al.: Precipitation response to ARI and ARCI over Europe

20 years (Fuzzi et al., 2015), the uncertainty associated with     definition of events associated with precipitation and cloudi-
the estimated radiative forcing attributed to the interactions     ness (Prein et al., 2015; Baró et al., 2018).
between aerosols and clouds has not diminished during the             In regional climate models, representation of the radiative
last four cycles of the IPCC (Seinfeld et al., 2016). One of the   effect of aerosols (ARI) is traditionally established by a con-
main tools for estimating the impact of atmospheric aerosols       stant aerosol optical depth (AOD) value and a predetermined
on climate is the use of global and regional climate mod-          and abundant number of cloud condensation nuclei (CCN)
els (Boucher et al., 2013). However, many of the simulations       (Forkel et al., 2015). Although the lack of CCN is hardly ever
attempting to reproduce both the present climate and future        a limiting factor for cloud formation (this could perhaps hap-
climatic scenarios, or the extreme events that occur in situa-     pen in remote marine locations in very specific conditions),
tions of present or future climates, do not take into account      a low CCN value may result in clouds that precipitate more
the role of aerosol–radiation and aerosol–cloud interactions       readily, which can reduce the cloud lifetime and therefore
(ARIs and ACIs, respectively, in the terminology of AR5).          the average cloud fraction (Stevens and Feingold, 2009). To
   In addition to their radiative effect, aerosols act as con-     obtain a more realistic model, ARI and ACI, which require
densation nuclei for cloud formation and can therefore af-         models in which meteorology–climatology, radiation, clouds
fect precipitation in several ways (Andreae and Rosenfeld,         and aerosol atmospheric chemistry are coupled in a fully
2008; Rosenfeld et al., 2008). Rosenfeld et al. (2008) stud-       interactive way, must be included in the simulation (Grell
ied the role of aerosols in polluted and pristine atmospheres      and Baklanov, 2011; Baklanov et al., 2014). Fully coupled
for tropical areas. In polluted atmospheres, as there is a         climate–chemistry models (on-line) make it possible to ex-
larger amount of condensation nuclei for the same humid-           plain the feedback mechanisms between simulated aerosol
ity, the cloud drops are smaller, and therefore aerosols ham-      concentrations and meteorological variables.
per precipitation. The slower cloud-droplet-to-rain conver-           In simulations including ARI, the number of CCN remains
sion allows the droplets to be transported above freezing          unchanged, but the concentration of aerosols and their impact
level, and thus the latent heat released in freezing inten-        on the radiative balance is dynamically modeled (Houghton
sifies the convection. However, this has no general valid-         et al., 2001; Andreae et al., 2005). A region with a high emis-
ity, since this behavior could change locally, depending on        sion of black carbon will absorb more radiation and increase
the area. Indeed, understanding and characterizing the role        the temperature of that layer of the atmosphere, favoring the
that aerosols play in the development of convective clouds         destruction of clouds. However, an area with emissions of
is today a cutting-edge scientific challenge (Archer-Nicholls      clear natural aerosols (e.g., sea salt) will favor radiative cool-
et al., 2016). Authors such as Seifert et al. (2012) and Fan       ing due to the scattering of radiation (Yu et al., 2006).
et al. (2013) find a very weak effect on precipitation by in-         Also, a further refinement in the configuration of the model
troducing aerosol–cloud interactions. Da Silva et al. (2018)       adds the aerosol–cloud interactions. In this case, on-line es-
analyze the effects on microphysics for the year 2013 for the      timation of aerosol concentrations is conducted in each time
Euro-Mediterranean region and conclude that precipitation          step of the model (as in the previous case), but this dynamical
decreases when there is a higher amount of aerosols.               estimation is used to both calculate the radiative budget (as
   Better understanding of the ARI and ACI is therefore es-        in ARI) and to estimate CCN for cloud formation. This will
sential for identifying climate change and its manifestation       affect the number of drops within the cloud as well as their
through changes in the frequency and severity of precipita-        size, modifying the cloud’s optical properties and thus its ra-
tion events (Huang et al., 2007; Khain et al., 2008; Stevens       diative balance (Twomey, 1977), and whether they reach the
and Feingold, 2009; Fuzzi et al., 2015). Along the same lines,     critical size to precipitate or not (Rosenfeld et al., 2008).
works such as Shrivastava et al. (2013), Forkel et al. (2015),        Introducing ACIs adds a level of complexity that brings the
Turnock et al. (2015), Yahya et al. (2016), Palacios-Peãa          model configuration closer to real processes. However, it has
et al. (2018), Palacios-Peña et al. (2019) and Pavlidis et al.     a great computational cost and can increase calculation times
(2020) highlight that it is necessary to use regional climate–     from 6- to 10-fold (López-Romero et al., 2016; Palacios-
chemical coupled models to investigate ACIs in more detail.        Peña et al., 2020). It is therefore reasonable that most of the
These studies cover mainly the continental US, Asia and Eu-        studies carried out so far with regional models taking into ac-
rope and investigate chemical and meteorological variables         count these interactions have been for episodical case studies
such as precipitation, temperature and radiation. As indicated     (Yang et al., 2012; Brunner et al., 2015; Palacios-Peña et al.,
by Seinfeld et al. (2016), improving the estimation of the         2019), and only a very limited number of contributions cover
aerosol impact on clouds and reducing associated uncertainty       climatic periods with a general analysis (e.g., Witha et al.,
are critical challenges for climate modeling studies. Despite      2019; Pavlidis et al., 2020).
the errors and uncertainties related to the role of aerosols in       Hence, in this work, the role of ARI and ACI in precipi-
the climate system (Jiménez-Guerrero et al., 2013), only a         tation and cloudiness over Europe has been exhaustively ex-
small number of scientific papers have considered the analy-       plored. For this purpose, regional climate simulations (1991–
sis of climatic events using simulations that include ARI and      2010) for the Euro-CORDEX (Jacob et al., 2014) domain
ACI, which may strongly condition the representation and           were carried out with WRF-Chem in order to account for

Atmos. Chem. Phys., 21, 415–430, 2021                                                 https://doi.org/10.5194/acp-21-415-2021
J. M. López-Romero et al.: Precipitation response to ARI and ARCI over Europe                                                 417

the influence of atmospheric aerosols on the aforementioned
variables.

2     Data and methods

2.1    Experimental setup

Regional climate simulations were carried out using the
WRF-Chem model (v.3.6.1), both uncoupled from chemistry
(WRF stand-alone configuration; Skamarock et al., 2008)
and including a full on-line coupling with atmospheric chem-
istry and pollutant transport (for including ARI and ACI pro-
cesses) (Grell et al., 2005).
   Three different experiments were performed in this con-
tribution. The first, BASE, consists of prescribing AOD and
CCN, excluding ARI and ACI. The second, ARI, includes
only aerosol radiation interactions (direct and semidirect ef-
fects). The third, ARCI, includes both aerosol–radiation and
aerosol–cloud interactions (direct, semidirect and indirect ef-
fects). In ARI and ARCI, aerosols are calculated on-line.
These experiments allow the effects of the aerosols on clouds
and precipitation from a climatic perspective to be disentan-     Figure 1. Simulation domains covered in the experiments. The in-
gled.                                                             ner Euro-CORDEX domain is boxed in the figure.
   In the BASE experiment, aerosols are not treated interac-
tively but by using the default WRF configuration, which
considers 250 CCN per cubic centimeter and setting AOD            uniform sigma levels were used, with higher density levels
to 0. In the ARI experiment, aerosols are treated on-line and     near the surface. The upper limit was set at the 50 hPa level.
ARI processes are activated in the model (Fast et al., 2006),        The design of the physical configuration of the model
but CCN remain as in the stand-alone version. The ARCI ex-        was based on the compatibility with the chemical module
periment includes the aforementioned ARI and, in addition,        and previous works (Baró et al., 2015; Palacios-Peña et al.,
permits aerosols to interact with the microphysics processes.     2016, 2017; Baró et al., 2017; Palacios-Peña et al., 2019).
The description of ARCI as implemented in the simulations         In addition to microphysics (Lin scheme), another impor-
can be found in Palacios-Peña et al. (2020), as can valida-       tant parameterization concerns radiation. The interactions of
tion of the AOD fields. To summarize, ARCIs in WRF-Chem           aerosol and clouds with incoming solar radiation were imple-
were implemented by linking the simulated cloud droplet           mented by linking the simulated cloud droplet number with
number with the Lin microphysics scheme (Lin et al., 1983),       the RRTMG scheme and Lin microphysics (further details
turning it into a two-moment scheme. Therefore, the droplet       in Palacios-Peña et al., 2020). Therefore, the droplet num-
number affects both the calculated droplet mean radius and        ber will affect both the calculated droplet mean radius and
the cloud optical depth (Chapman et al., 2009).                   cloud optical depth. This should allow the dynamical treat-
   The spatial configuration consists of two unidirectionally     ment of aerosols and greenhouse gases in order to estimate
nested domains (one-way nesting). The domains used are            the radiative budget. The RRTMG radiative scheme was used
shown in Fig. 1. The inner domain is compliant with Euro-         for both long- and shortwave (Iacono et al., 2008), while
CORDEX recommendations (Jacob et al., 2014). It covers            the Grell 3D scheme was used for the cumulus parameter-
Europe with a spatial resolution of 0.44◦ in latitude and lon-    ization (Grell, 1993; Grell and Devenyi, 2002). The bound-
gitude (∼ 50 km). The outer domain has a spatial resolution       ary layer was modeled with the Yonsei University scheme
of about 150 km and extends southward to a latitude of ap-        (Hong et al., 2006). The surface layer was parameterized us-
proximately 20◦ N. The design of this domain aims to cover        ing the Jiménez et al. (2012) scheme. Finally, the NOAH
the most important dust emission areas of the Saharan desert      model (Tewari et al., 2004) was the land–soil model chosen
(Goudie and Middleton, 2001; Middleton and Goudie, 2001;          to simulate the land–atmosphere interactions.
Rodríguez et al., 2001; Goudie and Middleton, 2006) that             As mentioned above, aerosols are treated on-line; i.e., the
are introduced to the inner domain through boundary con-          model uses changing aerosols originating from anthro-
ditions (Palacios-Peña et al., 2019). Nudging was used for        pogenic emissions and generating natural aerosols through-
the outer domain so that the atmospheric dynamics did not         out the interaction between atmospheric conditions and sur-
significantly vary (Liu et al., 2012). In the vertical, 29 non-   face properties. Regarding the configuration and treatment

https://doi.org/10.5194/acp-21-415-2021                                               Atmos. Chem. Phys., 21, 415–430, 2021
418                                     J. M. López-Romero et al.: Precipitation response to ARI and ARCI over Europe

of aerosols and gases, the gas-phase chemical mechanism          and solar radiation at surface (rsds) as well as mean tempo-
RACM-KPP was used (Stockwell et al., 2001; Geiger et al.,        ral fields of the particulate matter (PM10 , PM2.5 ), BC (black
2003) coupled to the GOCART aerosol scheme (Ginoux               carbon) and AOD. All these fields are presented as a Supple-
et al., 2001a; Chin et al., 2002). The photolysis module Fast-   ment.
J (Wild et al., 2000) was used to feed photochemical re-            The statistical significance of the differences between the
actions. Biogenic emissions were calculated on-line using        climatologies reproduced by the simulations was checked us-
the Model of Emissions of Gases and Aerosols from Nature         ing a bootstrap method with 1000 repetitions and applying a
model (MEGAN) (Guenther et al., 2006). Dust and marine           p value < 0.05. Further details of this method can be found
spray were simulated with GOCART (Ginoux et al., 2001b;          in Milelli et al. (2010).
Chin et al., 2002). Simulated aerosols included five species:       In order to assess the relationship between the obtained
sulfate, mineral dust, sea salt, organic matter and black car-   changes in precipitation and different variables representing
bon. Anthropogenic emissions were taken from the Inter-          the aerosol load PM10 (particulate matter < 10 µm), PM2.5
comparison Project of Atmospheric and Climate Chemistry          (particulate matter < 2.5 µm), AOD at 550 nm, and the ratio
Models (Lamarque et al., 2013) and remained unchanged            between PM2.5 and PM10 (hereinafter called PMratio ), several
during the simulation period (monthly values for 2010). The      events (days) are grouped according to their intensity and ex-
ability of this configuration to represent the aerosol optical   tension. The intensity of an event is defined as the minimum
depth has been already extensively evaluated in Palacios-        value given by a threshold variable that the simulation cells
Peña et al. (2020). More details about the treatment of          must meet; the extension of an event is defined as the number
aerosols and their interactions can be found in Jerez et al.     of cells meeting the previous condition.
(2020b). The mean fields of these aerosols as well as the           The relative differences (ARCI–BASE)/BASEx100 be-
AOD are presented as a Supplement (Figs. S1–S5).                 tween the experiments are shown on a two-dimensional heat
   The simulated historical period for the three simulations     map, where the axes denote extent and intensity. The number
covers the 2 decades from 1991 to 2010. The boundary and         of days on which the criteria defined above are met is indi-
initial conditions were extracted from the ECMWF reanaly-        cated inside each element of the matrix. The total number of
sis ERA20C (ECMWF, 2014; Hersbach et al., 2015), which           days analyzed is 7305, corresponding to the 20 years simu-
has a horizontal resolution of approximately 125 km (T159).      lated. This type of graph allows us to identify whether there
The simulations were run splitting the full period into sub-     is a relationship between the different variables and the mag-
periods of 5 years with a spin-up period of 4 months and         nitude of the change and to establish the relative importance
then beginning with the direct interpolation of the soil data    of each factor involved. In the intervals where a relationship
of the reanalysis. After removing the spin-up period, which      appears, a multiple linear regression fit was made, giving the
was chosen in accordance with the results of Jerez et al.        multiple correlation coefficient as an indicator of the skill of
(2020a), the model outputs were merged. This methodol-           the relationship.
ogy was tested in Jerez et al. (2020a). The boundary con-           On the other hand, the effect of aerosols could depend on
ditions for the outer domain were updated every 6 h and the      the area and affect weak and strong precipitation events dif-
model outputs recorded every hour. The observed evolution        ferently (Rosenfeld et al., 2008). The series of relative differ-
of greenhouse gases CO2 , CH4 and N2 O was incorporated          ences between the ARCI–BASE simulations were generated
as recommended in Jerez et al. (2018), varying CO2 be-           for common and non-common days with rainfall exceeding
tween 353 and 390 over the simulated period.                     a certain threshold for all points in the domain. The thresh-
                                                                 old ranges from 0 to 20 mm d−1 on a non-linear scale (with a
2.2   Methods                                                    higher density of values near 0) with a total of 41 values. In
                                                                 order to investigate areas where the effect of aerosols on pre-
This contribution focuses on the impacts of ARI and ACI          cipitation could be different, a clustering method was applied
on precipitation. Hence, the climatologies for precipitation     to the constructed series. The algorithm used for the spatial
amount, number of days with precipitation over a given           classification is similar to that used in other works (Jiménez
threshold and cloudiness of the different experiments were       et al., 2008; Lorente-Plazas et al., 2015) and is composed of
intercompared for the BASE, ARI and ARCI simulations.            several steps. First, an analysis of the principal components
The ERA5 (Hrarsbach and Dee, 2016) reanalysis data were          (Von Storch, 1999) is made and applied to the correlation ma-
used to calculate the added value of the aerosol experiments,    trix of the constructed series. Second, a two-step clustering
since they have already been validated for precipitation (Al-    method is applied to a number of the retained principal com-
bergel et al., 2018; Christensen et al., 2019; Hwang et al.,     ponents. A hierarchical method is applied as a previous step;
2019). Also represented are the comparison of the annual and     in this case, Ward’s algorithm (Ward, 1963). This classifica-
seasonal climatologies for other atmospheric fields such as      tion provides the number of clusters and initial seeds (also
sea level pressure (slp), geopotential height (Z) and temper-    called centroids) for the final step, application of the non-
ature (T ) at 1000, 750 and 500 mb, maximum and minimum          hierarchical method K means which optimizes the grouping
temperatures (tasmax, tasmin), daily temperature range (dtr),    (Hartigan and Wong, 1979). Further details about the algo-

Atmos. Chem. Phys., 21, 415–430, 2021                                               https://doi.org/10.5194/acp-21-415-2021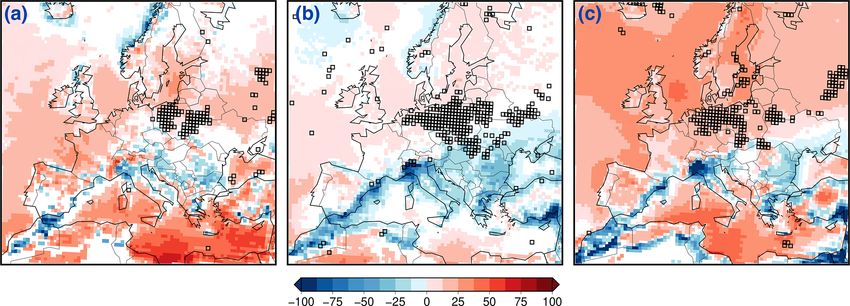
J. M. López-Romero et al.: Precipitation response to ARI and ARCI over Europe                                                   419

rithm can be found in Lorente-Plazas et al. (2015). Finally,        obtained for dtr with a pattern characterized by an impor-
the mean regional series are calculated as the average of se-       tant increase in the north (lower CLL) and a decrease in the
ries belonging to a cluster (which corresponds to a spatial         south (higher AOD) (Fig. S16). The modification of energy
region in this study).                                              fluxes also affects circulation. The SLP fields, as well as Z at
                                                                    several levels, also show statistically significant sensitivity
                                                                    to ARI and ACI effects (Figs. S17–S19). Here, the most re-
3     Results and discussion                                        markable features are the large differences between the ARI
                                                                    and ARCI experiments. ARCI shows a noticeable increase
3.1    Precipitation differences in ARI and ARCI                    in slp in the central and northern parts of the domain with
       simulations                                                  respect to ACI. This behavior is also appreciated for Z. Fi-
                                                                    nally, it is worth highlighting that ARI and ARCI also indi-
The sensitivity of precipitation to the aerosol treatment in        cate a rise in temperature over northern and central Europe.
climate simulations is analyzed by comparing BASE, ARI              This might imply that simulated changes in precipitation can
and ARCI simulations over Europe over a 20-year period.             also be indirectly affected by changes in atmospheric circu-
The differences between ARCI–BASE (ARI–BASE) in spa-                lation. This fact could make it more difficult to establish the
tially averaged total precipitation are limited, around 0.5 %       relationship between changes in precipitation and changes in
(0.1 %). Figure 2 shows the relative differences with respect       the treatment of aerosols in our experiments.
to BASE in the mean annual rainfall. The results depict a              In order to investigate the variations in the regimes of pre-
large spatial variability with differences ranging from 10 %        cipitation, the changes in the number of rainy days are esti-
to −10 %. Two zones with opposite behaviors are identified:         mated. Figure 2 (and Fig. S9) shows the relative differences
(1) the central and eastern part of Europe, with a precipita-       in the number of days with precipitation > 0.1 mm. The pat-
tion decrease of up to 8 % (statistically significant, p < 0.05),   terns of differences are similar to those of averaged precipi-
and (2) the eastern Mediterranean area, with increases of up        tation, implying that the reduction in precipitation is mainly
to 10 % (although the changes are not significant, p > 0.05).       caused by the decrease in the number of rainy days. However,
Other areas, such as the Iberian Peninsula, present a strong        there are some noticeable exceptions. The relationships in the
spatial variability (e.g., rainfall increasing over the Mediter-    two large areas mentioned above are direct; that is, higher
ranean coast and decreasing over northeastern areas). Over-         rainfall is linked to a larger number of precipitation episodes.
all, the fact of introducing ARI and ACI leads to a redis-          However, there are areas where the relationship is inverse, a
tribution of the annual precipitation. The most remarkable          higher (lower) number of days implies less (more) precipita-
difference is a reduction in annual precipitation over central      tion. Analysis of the low clouds in the domain (Figs. 2, S10
Europe for ARI, which is enhanced when the more intense             and S11) shows a pattern similar to the aforementioned ones.
and spatially extended ACIs are included. This reduction            This might indicate that the effects of both ARI and ACI can
in precipitation is linked mainly to a reduction in the num-        play very different roles in cloud properties and therefore in
ber of days with precipitation > 0.1 mm (Np01 ) and clouds at       precipitation, depending on the target area. This issue will be
low level (CLL); indeed, the most significant and widespread        addressed later in this contribution.
changes are obtained for CLL. Moreover, a statistically sig-
nificant increase in Np01 appears over the eastern Mediter-         3.2   Evaluation against ERA5 reanalysis
ranean but in this case only in ARCI experiments linked
to an increase in CLL. At seasonal scale (see Supplement,           The added value of incorporating on-line aerosol interactions
Figs. S6–S11, for further information), the decrease in pre-        and complex aerosol physics into the model was calculated
cipitation, CLL and Np01 in central Europe is reproduced in         by analyzing the differences in precipitation, number of rainy
all seasons but summer. In addition, the increase in the east-      days and low clouds between the simulations and the reanal-
ern Mediterranean is reproduced throughout the year, with           ysis of the European center ERA5 (Fig. 4). Overall, WRF-
the largest absolute changes in winter.                             Chem (in both the BASE and ARCI simulations) tends to un-
   These changes are also related to others in several vari-        derestimate precipitation over the European Mediterranean
ables: for instance, rsds decreases in ARI and ARCI experi-         region and along the coasts of the Nordic countries, while it
ments mainly over the southern half of the domain, due to the       overestimates rainfall in the rest of the domain. These pat-
higher AOD. However, there are some parts of central Europe         terns are analogous for all the variables analyzed. Looking
where rsds rises due to the decrease in clouds, especially in       only at the areas where the differences are significant, the
autumn and spring (Figs. S12 and S13). Changes in tempera-          ARCI simulations slightly reduce the differences in the spa-
ture are different for tasmax and tasmin (Figs. S14 and S15).       tial distribution. However, the differences between ERA5 and
They are larger for tasmax, especially in ARCI, reaching            ARCI are much larger than the differences between ARCI
differences around 0.5 K and presenting quite similar spa-          and BASE.
tial patterns to those of CLL, while tasmin does not present           Despite this, as previously noted (Fig. 2), the ARCI ex-
any correlation with CLL. The most remarkable changes are           periment introduces significant differences with respect to

https://doi.org/10.5194/acp-21-415-2021                                                 Atmos. Chem. Phys., 21, 415–430, 2021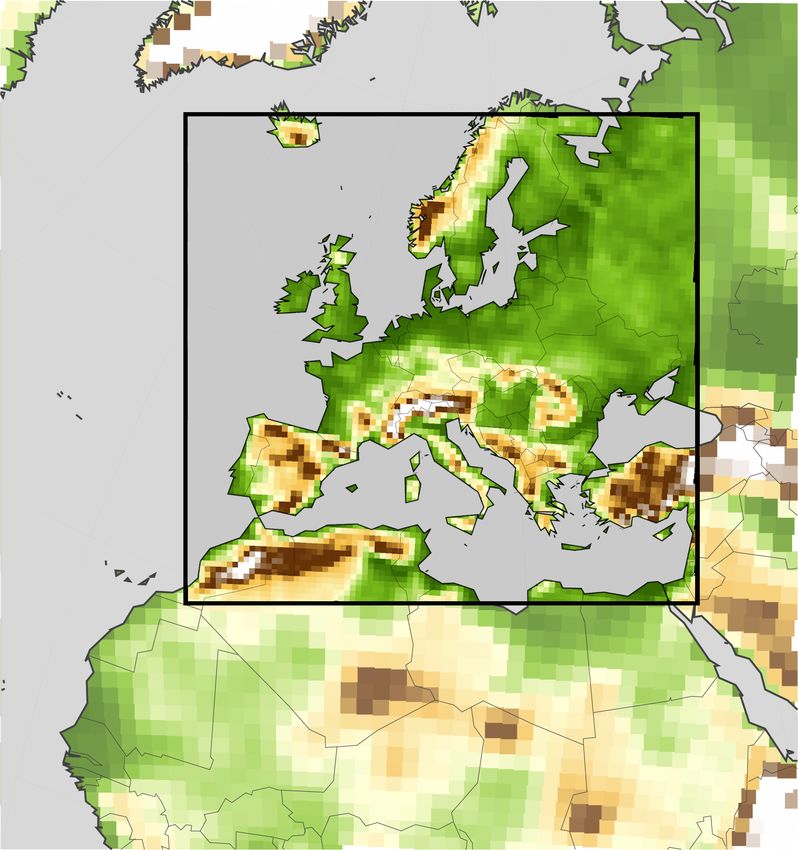
420 J. M. López-Romero et al.: Precipitation response to ARI and ARCI over Europe
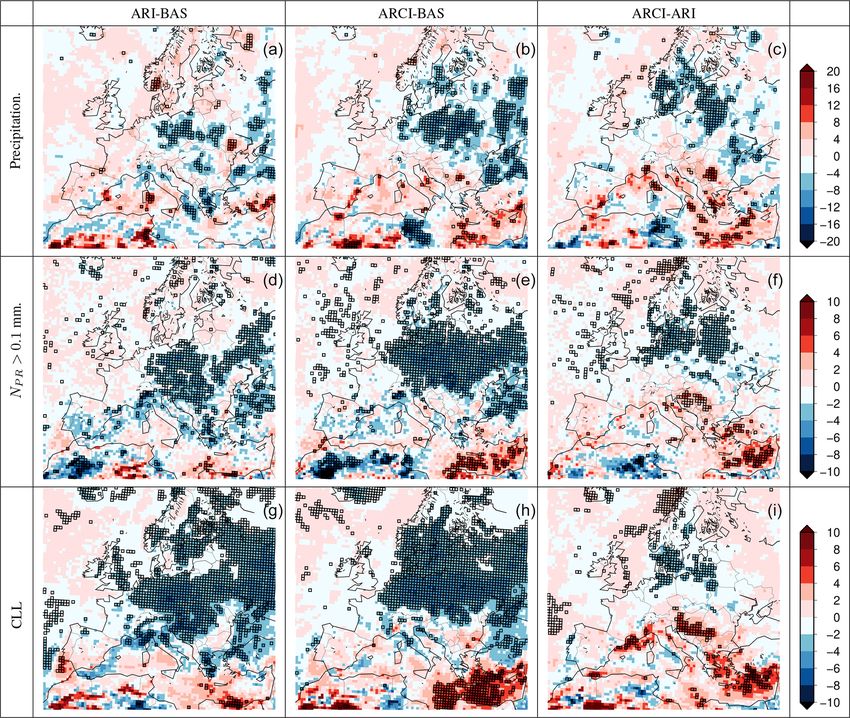
Figure 2. Relative differences for precipitation between ARI and BASE (a, d, g), ARCI and BASE (b, e, h), and ARCI and ARI (c, f, i),
total precipitation (a–c) number of days of precipitation > 0.1 mm (d–f), and low clouds (g–i). Squares indicate points whose differences are
significant for a p value of 0.05. The analysis was conducted for the mean values of the period 1991–2010.
the BASE simulation over central Europe. These differences significant differences (Fig. 2). Figure 5a shows the relative
reach values of about 5 % in the number of rainy days. A changes (ARCI–BASE) in the number of rainy days for dif-
relationship between aerosols in these areas and the afore- ferent sets of episodes, selected by choosing the extension
mentioned changes might therefore be expected in spite of or size of the episode (number of grid points) of the cells ex-
the induced changes in the dynamics. This relationship is ex- ceeding a value of PMratio (values from 0.2 to 0.8). In a range
plored in the following section of this contribution. of intensities, quasi-linear relationships appear. Figure 5b–e
show these relationships for the different variables.
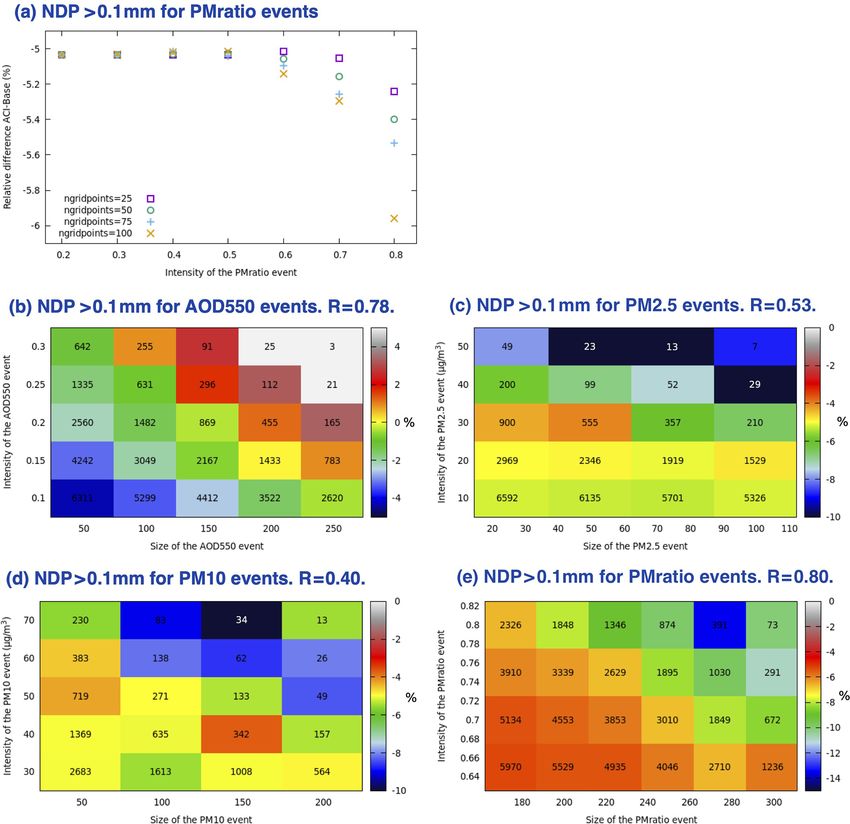
3.3 Relationship between aerosol physical properties The lower left box of Fig. 5e indicates that 5970 out of
and precipitation 7303 d present a PMratio > 0.64 (y axis) achieved in more
than 180 cells of the domain (x axis). When calculating the
In order to understand the contribution to changes in precipi- differences in ARCI–BASE precipitation in the 5970 d meet-
tation of the different types of aerosol, the differences in rain- ing that condition (PMratio > 0.64 in more than 180 cells of
fall were assessed by choosing a set of episodes. These were the domain), the differences in rainy days over those cells
selected according to the value of variables representative of is around 4 %. Thus, e.g., the number of days in which
the size and concentration (PM10 and PM2.5 ), ratio (PMratio ) PMratio is > 0.75 in more than 280 points is 1030 and the
and impacts on radiation (AOD) of the aerosols, as well as reduction in the number of rainy days is 8 %. Following
the spatial extension of the event. with PMratio (Fig. 5e), the higher the intensity, the larger the
Figure 5 shows the relative changes for the different reduction in the number of rainy days; and the greater the
sets of episodes for AOD at 550 nm (AOD550) (Fig. 5b), extent or size of the event, the larger the reduction in rainy
PM10 (Fig. 5d), PM2.5 (Fig. 5c) and the PMratio (Fig. 5d). days (e.g., reaching the maximum reduction around 15 %).
The calculations were conducted using only the points with
Atmos. Chem. Phys., 21, 415–430, 2021 https://doi.org/10.5194/acp-21-415-2021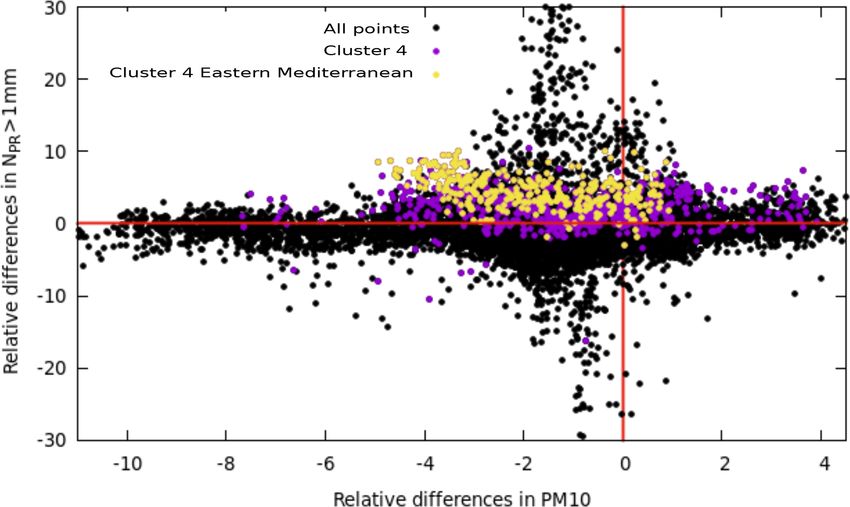
J. M. López-Romero et al.: Precipitation response to ARI and ARCI over Europe                                                  421

Figure 3. AOD, PM10 (µg m−3 ) and PMratio mean annual values for ARI and ARCI and their differences (%).

Indeed, the multiple regression coefficient between the dif-        centration of small particles changing the properties of the
ferent variables is R = 0.80.                                       clouds (mainly low clouds) (Fig. 2; a reduction in low cloudi-
   For AOD550 (Fig. 5b), the results show that higher               ness over central Europe) and leading to a clearer atmo-
AOD550 values lead to a lower reduction in the number of            sphere. This results in higher temperatures and an increase in
rainy days. The changes are small (under 2 %) although the          the condensation level, leading to a reduction in the number
relationship is clear (R = 0.78). The results are analogous for     of rainy days and therefore a decrease in the amount of pre-
PM2.5 (Fig. 5c), but the relationship is less clear (R = 0.53).     cipitation (direct and semidirect effects). As noted in Fig. 2,
For PM10 , the changes are higher but with a less clear re-         the reduction in CLL also occurs in the ARI experiment. This
lationship (R = 0.40). However, the relationships with the          could be explained by the atmospheric warming caused by
PMratio (Fig. 5e) are important and significant (R = 0.80).         the radiation absorption of dark atmospheric aerosols (black
Therefore, an important conclusion is that the variable with        carbon), causing the above effect. The stronger signal in
the largest impact on the number of rainy days is the PMratio       ARCI can be attributed to the addition of both processes. On
in that area.                                                       the other hand, a high concentration episode of PM2.5 can
   The possible physical explanation for this behavior in this      occur together with a PM10 event, decreasing the PMratio .
area is that the higher the PMratio (Fig. 3), the higher the con-   Therefore, the better relationship with PMratio could be re-

https://doi.org/10.5194/acp-21-415-2021                                                 Atmos. Chem. Phys., 21, 415–430, 2021
422 J. M. López-Romero et al.: Precipitation response to ARI and ARCI over Europe
Figure 4. Significant relative differences (colors) between ARCI and ERA5 for (a) precipitation, (b) number of days of precipita-
tion > 0.1 mm and (c) clouds at low levels. Squares indicate statistically significant differences (p < 0.05). The analysis was conducted
for the mean values of the period 1991–2010.
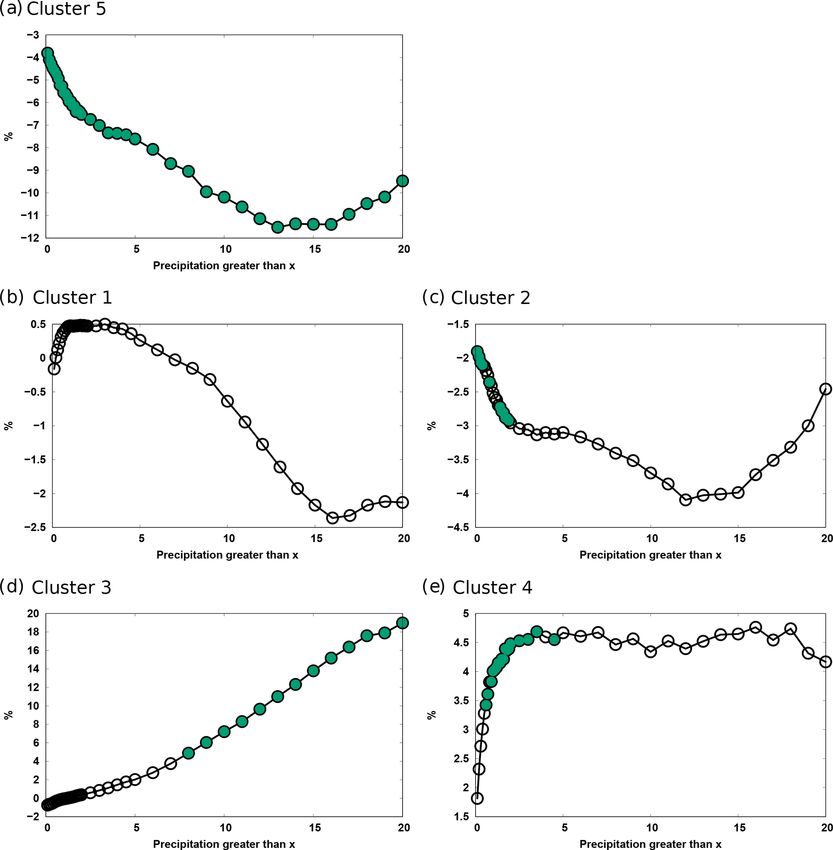
lated to coarse aerosols enhancing precipitation and thereby Cluster 5 almost coincides with the area previously analyzed
counteracting the effect of smaller aerosols. (significant differences, Fig. 2).
Clusters 3 and 4 have a different behavior. In these regions,
an increase in precipitation occurs when including ARCI.
3.4 Regional role of aerosols in precipitation Cluster 3 does not have a clear spatial pattern, with points
scattered along the entire domain. For low thresholds, there
As noted previously, the relationships between changes in are no significant changes; for high thresholds, there is a very
precipitation, number of rainy days and cloudiness are dif- significant increase in precipitation with significant relative
ferent in different regions of our domain. Therefore, the changes (e.g., 5 % for a threshold of 8 mm d−1 ). For higher
role of aerosols, analyzed considering either their nature or thresholds, the relative changes are close to 20 %. However,
their concentration, causes different changes in precipitation this result should be analyzed with caution because of the
regimes. In order to quantify this effect, the series of rela- lack of spatial structure, although from the statistical point
tive changes in the number of rainy days were constructed of view there is a coherent increase in moderate and intense
at each point for different thresholds ranging from 0.1 to precipitation events that can be explained by some physical
20 mm d−1 . The grouping method described in the method- processes presented in the literature (Khain et al., 2008).
ology section was applied to this series, obtaining five dif- Finally, Cluster 4 shows a clear spatial pattern, with
ferent regions (Fig. 6). The clusters are listed according to most of the points concentrated in the eastern Mediter-
the number of grid cells of each group, with Cluster 1 the ranean. Over this area, the range of thresholds between 1 and
most numerous and also the most dispersed. The centroid se- 5 mm d−1 presents significant differences, while for thresh-
ries (average series of regions) are represented in Fig. 7. The olds > 5 mm d−1 , the series remain constant around 4.5 %
(green) filled circles indicate that the relative differences be- and the statistical significance disappears.
tween the ARCI and BASE experiments are significant. Therefore, the role of the aerosols in precipitations shows
Cluster 1 does not present a clear pattern, covering most a clear spatial dependence, affecting strong and weak precip-
of the points of the Atlantic Ocean and southern Europe. itation differently. Over regions 2 and 5, which cover north-
This area has very low, non-significant differences, with val- ern, central and eastern Europe, ARI and ACI tend to re-
ues between 0.5 % and −2.5 %. Therefore, the effect of in- duce precipitation. This reduction is significant for almost all
cluding aerosol–cloud interactions in this area does not prac- events below 15 mm d−1 . In the Mediterranean area, and es-
tically affect precipitation. Clusters 2 and 5 have a simi- pecially in the eastern Mediterranean, rainfall increases in the
lar behavior. In both zones, there is a decrease in precipi- ARCI experiment, mainly due to the increase in the number
tation for almost all thresholds except the most extreme rain- of days with rainfall below 5 mm d−1 . Meanwhile, in Clus-
fall events where precipitation increases. In Cluster 2, the ter 3, the total rainfall undergoes very variable changes but
changes range from −2 % to −4 %, with significant differ- fundamentally an increase in moderate and strong rainfall
ences for low thresholds (up to 2 mm d−1 ). In the case of events.
Cluster 5, the differences are always significant and much
larger. The maximum reduction is obtained for episodes of
precipitation above 14 mm d−1 , reaching relative changes in
the precipitation of the entire area of around 12 %. Note that
Atmos. Chem. Phys., 21, 415–430, 2021 https://doi.org/10.5194/acp-21-415-2021J. M. López-Romero et al.: Precipitation response to ARI and ARCI over Europe 423
Figure 5. Relative difference (colors) in the ARCI–BASE simulations for the 1991–2010 period based on (b) the intensity and size of
AOD550 events, (c) the intensity and size of PM2.5 events, (d) for events of PM10 , and (e) for those of PMratio . The calculation is made
for the domain cells with significant ARCI–BASE differences for the number of days with precipitation > 0.1 mm (Fig. 2b) and only for the
zone where the non-linear behavior begins (> 0.6) in (a) (identical to the other variables). The number inside the boxes indicates the number
of days meeting the corresponding criteria of intensity and extent of events. R denotes the multiple regression coefficient resulting from a
multi-linear adjustment of those values.
3.5 ARI vs. ARCI relevance for modifying BASE and ARCI–ARI analyzing precipitation (number of
precipitation days exceeding 0.1 mm d−1 and total amount) and the cloud
cover at low level. In the case of Cluster 5, both simulations
In order to better understand the processes involved in each provide a reduction in the number of days of precipitation.
of the areas, the absolute annual values and differences be- Therefore, both ARI and ACI affect precipitation in the same
tween ARCI and ARI are analyzed in terms of the concen- direction. ARI causes an increase in temperature at low levels
trations of PM10 , PM2.5 and PMratio (Fig. 3). This will al- (see temperature at 850 hPa, Fig. S21), especially in autumn
low us to discriminate which processes (aerosol–radiation or and spring, leading to a reduction in clouds and precipitation.
aerosol–cloud interactions) are most relevant. As commented A possible explanation would be that the ARCI experiment
above, Fig. 2 shows the differences in ARCI–BASE, ARI–
https://doi.org/10.5194/acp-21-415-2021 Atmos. Chem. Phys., 21, 415–430, 2021424 J. M. López-Romero et al.: Precipitation response to ARI and ARCI over Europe
clouds in ARCI will no longer be counted in PM10 because of
in-cloud scavenging. Therefore, a decrease in PM10 occurs,
and this coincides with an increase in cloudiness. In addition,
the increase in precipitation will also decrease PM10 due to
wet deposition. Note that the patterns do not completely co-
incide, with the precipitation pattern shifted slightly to the
north (see the comparison in Fig. 2). This can be attributed
to the displacement of the cloud masses in such an area. This
behavior can be attributed to the role of giant aerosol parti-
cles in warm rain initiation (Johnson, 1982), increasing strat-
iform precipitation by dust through deposition growth (Gong
et al., 2010) or enhanced drizzle formation in stratocumulus
(Feingold et al., 1999).
4 Conclusions
The effect of atmospheric aerosols on regional climate sim-
ulations nowadays presents many uncertainties due to com-
plex and non-linear processes which depend on a wide va-
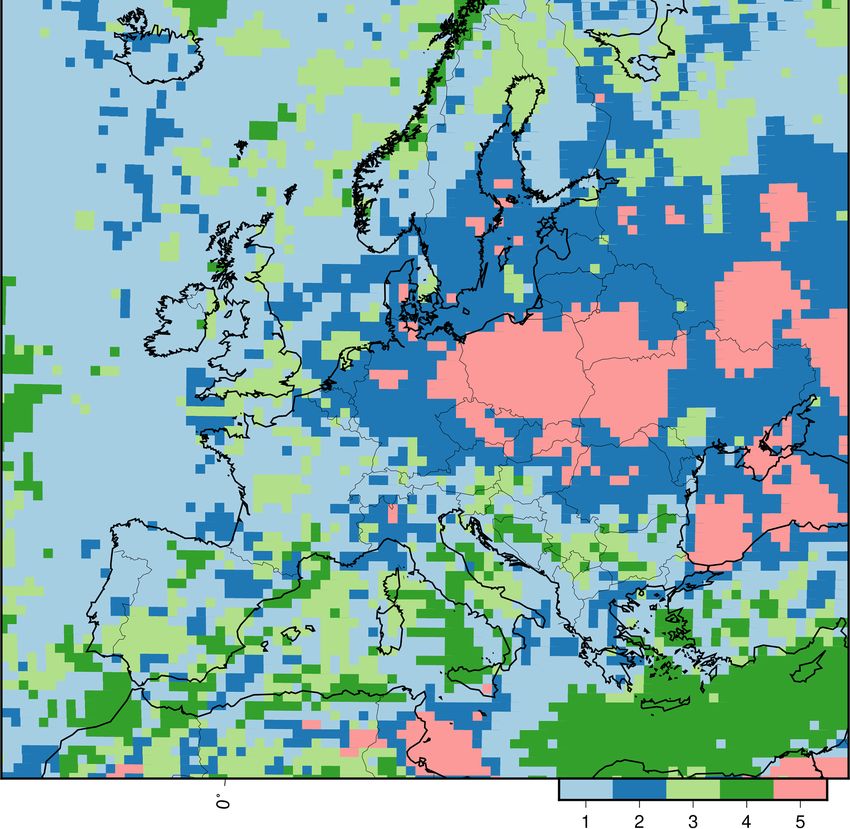
Figure 6. Cluster analysis of rainy days: each color depicts a cluster riety of factors. The quantity, size and optical properties
with different behavior of the ARCI–BASE difference in number of aerosols condition the modification of the radiative bud-
of days of precipitation over a threshold running from 0.1 mm to get and, therefore, many other derived variables such as lo-
20 mm d−1 for the period 1991–2010. cal temperature, cloudiness or precipitation. In addition, the
amount of available moisture determines the size of the wa-
ter droplets based on the amount and type of aerosols avail-
enhances this effect by the higher concentration of small par- able. Atmospheric aerosols also affect the size and optical
ticles modifying the properties of the clouds, inhibiting pre- properties of the clouds, which also modify the radiative bud-
cipitation processes again by reducing clouds due to micro- get. Moreover, these processes can spatially redistribute the
physical processes, since over this area there is a prevalence precipitation regimes, allowing rainfall in different areas or
of small aerosols (see PMratio in Figs. 3 and S1–S5). Another provoking changes in its intensity. Despite the importance of
possible explanation could be linked to the changes in cir- the problem from a climatological point of view, there is a
culation which reduce both cloudiness and precipitation (see scarcity of scientific contributions that have studied these is-
Fig. S17–S22). sues. The large increase in the computational time needed to
Finally, the increase in precipitation and cloudiness in include ACI and ARI in regional climate simulations has tra-
Cluster 4 could be associated with larger values of PM10 ditionally hampered the work covering this analysis from a
(large condensation nuclei). In this case, the ARI effects are climatic perspective.
almost negligible during the year. However, the ARCI ex- In order to address the aforementioned issues, a set of
periment shows a clear positive difference with respect to regional climate simulations was conducted for the pe-
the BASE case and ARI. Figure 8 shows the relative differ- riod 1991–2010 without on-line aerosol–atmosphere interac-
ence in the concentration of PM10 between ARCI and ARI tions (BASE), with ARI and with ARI + ACI (ARCI) pa-
and the differences in the number of rainy days with pre- rameterizations in an on-line coupled model. All the sim-
cipitation > 1 mm d−1 . The points are distributed in a quasi- ulations cover the domain of Europe defined by the Euro-
random way with respect to 0. The cells of the whole of CORDEX initiative. This analysis focused on average pre-
Cluster 4 show a bias towards positive values for changes in cipitation, number of precipitation days over a certain thresh-
precipitation and a decrease for PM10 . Focusing only on the old and cloudiness. In addition, the effects on other variables
eastern Mediterranean of Cluster 4 (yellow points), the rela- such as temperature at different levels, geopotential height,
tionship is clear. Most of the points showing an increase in radiation at surface and sea level pressure are presented as a
precipitation undergo a decrease in PM10 . A plausible expla- Supplement.
nation is that in these areas the PM10 load is high due to the When introducing the ACI and ARI, the spatial average
intrusion of desert dust and sea-salt aerosols. The difference of the total rainfall does not differ from the BASE scenario.
between the ARCI and ARI simulations is the activation of However, there is a spatial redistribution of such precipita-
the aerosol–cloud interaction mechanism, using the aerosols tion. Although there are changes in several places throughout
calculated on-line as CCN to form clouds, while in ARI, the the domain, the largest modification occurs in central Europe,
CCN are prescribed at a fixed value. The PM10 used to form where a decrease in precipitation is found as a result of acti-
Atmos. Chem. Phys., 21, 415–430, 2021 https://doi.org/10.5194/acp-21-415-2021J. M. López-Romero et al.: Precipitation response to ARI and ARCI over Europe 425 Figure 7. Series of relative differences between ARCI and BASE based on different thresholds in rainy days for the different regions (Fig. 6). Green circles denote the thresholds for which the differences are significant (p value < 0.05). vating the aerosol–radiation and aerosol–cloud interactions. shows a highly non-linear behavior, although a regime where The behavior is the opposite in the eastern Mediterranean, the linear approximation is acceptable was also identified. where the effects of aerosol–cloud interactions prevail. These For central Europe, in the linear regime, the intensity and ex- results are reproduced by analyzing the number of days of tension (size) of the PMratio events have a direct relationship precipitation > 0.1 mm, with very similar patterns. However, with the increase in the differences in the number of rainy there are areas where the relationship between precipitation days. and the number of rainy days is not straightforward. Although the previous conclusion is limited to the num- When the results are compared with ERA5, the BASE sim- ber of days of precipitation > 0.1 mm, it becomes interest- ulation tends to overestimate rainfall across the domain ex- ing to check the relationship for other thresholds. Five types cept in some areas of Mediterranean and Nordic countries. of behavior throughout the target domain were identified When the ACIs are incorporated into the modeling setup, by analyzing several precipitation thresholds. Aerosols con- these differences are reduced, although quantitatively this tribute positively or negatively to precipitation depending improvement is limited. on the area and the intensity of precipitation. The avail- The results obtained for the number of precipitation able humidity, efficiency of the CCN and type of aerosol days > 0.1 mm were related to different aerosol variables (size, optical properties, shape) are the most important fac- (AOD550, PM2.5 , PM10 and PMratio ). That relationship tors conditioning the type of behavior. In the experiments https://doi.org/10.5194/acp-21-415-2021 Atmos. Chem. Phys., 21, 415–430, 2021
426                                         J. M. López-Romero et al.: Precipitation response to ARI and ARCI over Europe

                                                                       the inclusion of aerosols in regional climate experiments and
                                                                       (2) better understand the physical and microphysical pro-
                                                                       cesses leading to changes in precipitation. This contribution
                                                                       demonstrates from a modeling approach that changes in the
                                                                       concentration, extension and type of aerosols alter the precip-
                                                                       itation regimes and amount in different ways. These changes
                                                                       are spatially and seasonally dependent and in agreement with
                                                                       other works (e.g., Li et al., 2019). The inclusion in regional
                                                                       climate experiments of on-line aerosols, as well as cloud–
                                                                       aerosol interactions, alter precipitation patterns as well as
                                                                       other surface and upper air variables (Pavlidis et al., 2020;
                                                                       Jerez et al., 2020b) and could differ from other approxima-
                                                                       tions such as using AOD climatologies or prescribed CCN
Figure 8. Relative differences (ARCI–BASE) of the number of days       (Nabat et al., 2015). It would be interesting to see to which
of precipitation > 1 mm vs. PM10 (ARCI) for all the cells of the
                                                                       extent other regional models would reproduce the current re-
domain (black), for Cluster 4 (violet) and Cluster 4 but only in the
                                                                       sults for the Euro-CORDEX region in order to analyze the
Mediterranean (yellow).
                                                                       possible model dependence of the results. Future research
                                                                       aimed at disentangling the effects of aerosols on regional
                                                                       climate simulations should be devoted to understanding the
conducted, the inclusion of ARCI leads to a reduction in               role of regional and large-scale circulation (regimes), possi-
precipitation in all regimes in northern-central and eastern           ble feedbacks, and overlapping processes.
parts of Europe. However, in the eastern Mediterranean, pre-
cipitation increases due to the increase in days with rain-
fall < 5 mm d−1 . Positive changes for moderate and strong             Data availability. All data employed (monthly means) in this study
rainfall regimes are also found over some areas (Cluster 3,            are available at https://doi.org/10.5281/zenodo.4427810 (Mon-
which is a very dispersed area). Although this finding can be          távez, 2021). Data at higher temporal resolution are available upon
identified with the so-called deepening effect (Stevens and            request to montavez@um.es.
Feingold, 2009), relating aerosols to an increase in precipi-
tation for some convective events, this statement should be
                                                                       Supplement. The supplement related to this article is available on-
considered with caution because of the lack of spatial struc-
                                                                       line at: https://doi.org/10.5194/acp-21-415-2021-supplement.
ture of this cluster. The rest of the areas are barely affected.
   Some of the changes obtained can be related to the direct,
semidirect and indirect effects of aerosols on clouds. The re-
                                                                       Author contributions. JMLR, JPM and PJG designed the research.
duction in precipitation over some areas could be linked to            JMLR performed the experiments. JMLR, JPM, SJ and RLP ana-
both atmosphere warming and excess of CCN. The radiative               lyzed the outputs from experiments. LPP contributed to the design
processes have the ability to change the thermodynamic en-             of the numerical experiments, and JMLR and JPM wrote the paper,
vironment due to the absorption of radiation by fine dark par-         with input from all coauthors.
ticles (mainly black carbon), stabilizing the environment or
increasing the condensation level. The excess of CCN leads
to small drops producing a depletion in precipitation. In prin-        Competing interests. The authors declare that they have no conflict
ciple, this would increase the lifetime effect; however, the ex-       of interest.
periments presented here show an extra depletion of cloudi-
ness, possibly related to faster evaporation of the water drops.
All these processes are associated with a high concentration           Acknowledgements. The authors thank the WRF-Chem develop-
of fine aerosols with respect to coarse particles. On the other        ment community and the G-MAR research group at the University
hand, the effects of coarse aerosols (PM10 , giant condensa-           of Murcia for the fruitful scientific discussions.
tion nuclei) seem to be the complete opposite. These parti-
cles seem to enhance precipitation processes, especially in-
                                                                       Financial support. This research was funded by the European
creasing light precipitation events (Feingold et al., 1999) or
                                                                       Regional Development Fund – Fondo Europeo de Desarrollo
accelerating precipitation development. Sometimes both pro-
                                                                       Regional (ERDF-FEDER), the Spanish Ministry of Economy
cesses (semidirect and indirect) overlap, with a negligible net        and Competitiveness (MINECO), the Spanish Ministry of Sci-
effect.                                                                ence and Innovation (MICINN), the Agencia Estatal de Investi-
   In conclusion, the effect of aerosols on climatic variables         gación (AEI) through the projects EASE (grant number RTI2018-
is varied and complex and further studies on this topic are            100870-A-I00, MICINN/AEI/FEDER-ERDF) and ACEX (grant
needed in order to (1) reduce the uncertainty associated with          number CGL2017-87921-R, MINECO/AEI/FEDER-ERDF). Also,

Atmos. Chem. Phys., 21, 415–430, 2021                                                      https://doi.org/10.5194/acp-21-415-2021
J. M. López-Romero et al.: Precipitation response to ARI and ARCI over Europe 427
the Seneca Foundation – Agency for Science and Technology in Boucher, O., Randall, D., Artaxo, P., Bretherton, C., Feingold, G.,
the Region of Murcia funded the CLIMAX project (20642/JLI/18). Forster, P., Kerminen, V.-M., Kondo, Y., Liao, H., Lohmann,
Laura Palacios-Peña is grateful for the FPU14/05505 scholar- U., Rasch, P., Satheesh, S. K., Sherwood, S., Stevens, B., and
ship and to the Spanish Ministry of Education, Culture and Zhang, X. Y.: Clouds and Aerosols in Climate Change 2013: The
Sports. José María López-Romero acknowledges the FPI-BES- Physical Science Basis, in: Contribution of Working Group I to
2015-074062 grant from the Spanish Ministry of Science. IPCC AR5, edited by: Stocker, T. F., Qin, D., Plattner, G.-K.,
Tignor, M., Allen, S. K., Boschung, J., Nauels, A., Xia, Y., Bex,
V., and Midgley, P. M., Cambridge University Press, Cambridge,
Review statement. This paper was edited by Ari Laaksonen and re- UK and New York, NY, USA, 2013.
viewed by two anonymous referees. Brunner, D., Savage, N., Jorba, O., Eder, B., Giordano, L., Badia,
A., Balzarini, A., Baró, R., Bianconi, R., Chemel, C., Curci, G.,
Forkel, R., Jiménez-Guerrero, P., Hirtl, M., Hodzic, A., Honzak,
L., Im, U., Knote, C., Makar, P., Manders-Groot, A., van Mei-
jgaard, E., Neal, L., Pérez, J. L., Pirovano, G., Jose, R. S.,
References Schröder, W., Sokhi, R. S., Syrakov, D., Torian, A., Tuccella,
P., Werhahn, J., Wolke, R., Yahya, K., Zabkar, R., Zhang, Y.,
Albergel, C., Dutra, E., Munier, S., Calvet, J.-C., Munoz-Sabater, Hogrefe, C., and Galmarini, S.: Comparative analysis of mete-
J., de Rosnay, P., and Balsamo, G.: ERA-5 and ERA-Interim orological performance of coupled chemistry-meteorology mod-
driven ISBA land surface model simulations: which one els in the context of AQMEII phase 2, Atmos. Environ., 115,
performs better?, Hydrol. Earth Syst. Sci., 22, 3515–3532, 470–498, https://doi.org/10.1016/j.atmosenv.2014.12.032, 2015.
https://doi.org/10.5194/hess-22-3515-2018, 2018. Chapman, E. G., Gustafson Jr., W. I., Easter, R. C., Barnard,
Andreae, M. and Rosenfeld, D.: Aerosol–cloud–precipitation inter- J. C., Ghan, S. J., Pekour, M. S., and Fast, J. D.: Coupling
actions. Part 1. The nature and sources of cloud-active aerosols, aerosol-cloud-radiative processes in the WRF-Chem model: In-
Earth-Sci. Rev., 89, 13–41, 2008. vestigating the radiative impact of elevated point sources, At-
Andreae, M. O., Jones, C. D., and Cox, P. M.: Strong present- mos. Chem. Phys., 9, 945–964, https://doi.org/10.5194/acp-9-
day aerosol cooling implies a hot future, Nature, 435, 1187, 945-2009, 2009.
https://doi.org/10.1038/nature03671, 2005. Chin, M., Ginoux, P., Kinne, S., Torres, O., Holben, B. N., Duncan,
Archer-Nicholls, S., Lowe, D., Schultz, D. M., and Mc- B. N., Martin, R. V., Logan, J. A., Higurashi, A., and Nakajima,
Figgans, G.: Aerosol–radiation–cloud interactions in a re- T.: Tropospheric aerosol optical thickness from the GOCART
gional coupled model: the effects of convective parameteri- model and comparisons with satellite and Sun photometer mea-
sation and resolution, Atmos. Chem. Phys., 16, 5573–5594, surements, J. Atmos. Sci., 59, 461–483, 2002.
https://doi.org/10.5194/acp-16-5573-2016, 2016. Christensen, M. F., Heaton, M. J., Rupper, S., Reese, C. S., and
Baklanov, A., Schlünzen, K., Suppan, P., Baldasano, J., Brunner, Christensen, W. F.: Bayesian Multi-scale Spatio-temporal Mod-
D., Aksoyoglu, S., Carmichael, G., Douros, J., Flemming, J., eling of Precipitation in the Indus Watershed, Front. Earth Sci.,
Forkel, R., Galmarini, S., Gauss, M., Grell, G., Hirtl, M., Joffre, 7, 210, https://doi.org/10.3389/feart.2019.00210, 2019.
S., Jorba, O., Kaas, E., Kaasik, M., Kallos, G., Kong, X., Ko- Da Silva, N., Mailler, S., and Drobinski, P.: Aerosol indirect ef-
rsholm, U., Kurganskiy, A., Kushta, J., Lohmann, U., Mahura, fects on summer precipitation in a regional climate model for
A., Manders-Groot, A., Maurizi, A., Moussiopoulos, N., Rao, S. the Euro-Mediterranean region, Ann. Geophys., 36, 321–335,
T., Savage, N., Seigneur, C., Sokhi, R. S., Solazzo, E., Solomos, https://doi.org/10.5194/angeo-36-321-2018, 2018.
S., Sørensen, B., Tsegas, G., Vignati, E., Vogel, B., and Zhang, ECMWF: ERA-20C, available at: https://www.ecmwf.int/en/
Y.: Online coupled regional meteorology chemistry models in forecasts/datasets/reanalysis-datasets/era-20c (last access:
Europe: current status and prospects, Atmos. Chem. Phys., 14, 3 March 2020), 2014.
317–398, https://doi.org/10.5194/acp-14-317-2014, 2014. Fan, J., Leung, L. R., Rosenfeld, D., Chen, Q., Li, Z., Zhang, J.,
Baró, R., Jiménez-Guerrero, P., Balzarini, A., Curci, G., Forkel, and Yan, H.: Microphysical effects determine macrophysical re-
R., Grell, G., Hirtl, M., Honzak, L., Langer, M., Pérez, J. L., sponse for aerosol impacts on deep convective clouds, P. Natl.
Pirovano, G., San José, R., Tuccella, P., Werhahn, J., and Žabkar, Acad. Sci. USA, 110, E4581–E4590, 2013.
R.: Sensitivity analysis of the microphysics scheme in WRF- Fast, J., Gustafson Jr., W., Easter, R., Zaveri, R., Barnard,
Chem contributions to AQMEII phase 2, Atmos. Environ., 115, J., Chapman, E., Grell, G., and Peckham, S.: Evolution
620–629, 2015. of ozone, particulates, and aerosol direct forcing in an ur-
Baró, R., Lorente-Plazas, R., Montávez, J. P., and Jiménez- ban area using a new fully-coupled meteorology, chem-
Guerrero, P.: Biomass burning aerosol impact on surface winds istry, and aerosol model, J. Geophys. Res, 111, D21305,
during the 2010 Russian heat wave, Geophys. Res. Lett., 44, https://doi.org/10.1029/2005JD006721, 2006.
1088–1094, https://doi.org/10.1002/2016GL071484, 2017. Feingold, G., Cotton, W. R., Kreidenweis, S. M., and
Baró, R., Jiménez-Guerrero, P., Stengel, M., Brunner, D., Curci, Davis, J. T.: The Impact of Giant Cloud Condensa-
G., Forkel, R., Nea, L., Palacios-Peña, L., Savage, N., Schaap, tion Nuclei on Drizzle Formation in Stratocumulus:
M., Tuccella, P., van der Gon, H. D., and Galmarini, S.: Eval- Implications for Cloud Radiative Properties, J. At-
uating cloud properties in an ensemble of regional online cou- mos. Sci., 56, 4100–4117, https://doi.org/10.1175/1520-
pled models against satellite observations, Atmos. Chem. Phys., 0469(1999)0562.0.CO;2, 1999.
18, 15183–15199, https://doi.org/10.5194/acp-18-15183-2018,
2018.
https://doi.org/10.5194/acp-21-415-2021 Atmos. Chem. Phys., 21, 415–430, 2021You can also read