Evolution of PM2.5 Measurements and Standards in the U.S. and Future Perspectives for China
←
→
Page content transcription
If your browser does not render page correctly, please read the page content below
Aerosol and Air Quality Research, 13: 1197–1211, 2013
Copyright © Taiwan Association for Aerosol Research
ISSN: 1680-8584 print / 2071-1409 online
doi: 10.4209/aaqr.2012.11.0302

Evolution of PM2.5 Measurements and Standards in the U.S. and Future
Perspectives for China

Junji Cao1*, Judith C. Chow1,2, Frank S.C. Lee3, John G. Watson1,2
1
  Key Laboratory of Aerosol Science and Technology, SKLLQG, Institute of Earth Environment, Chinese Academy of
Sciences, Xi’an, China
2
  Division of Atmospheric Sciences, Desert Research Institute, Reno, NV, USA
3
  Department of Civil and Structural Engineering, Hong Kong Polytechnic University, Hong Kong

ABSTRACT

   National Ambient Air Quality Standards (NAAQS) were first established in the United States to protect public health
and welfare, and the concept has been adopted in China and many other countries. For particulate matter (PM), the
NAAQS indicator evolved from total particle mass concentration, to PM10 and PM2.5 mass concentrations as defined by the
PM size-selective properties of the monitoring instrument and human inhalation characteristics. Particle measurements
started with optical microscopy in the early 18th century, and scientific research over the past 300 years has related particles to
adverse environmental and health effects. Several options for PM2.5 measurement and assessment are available to China
and other developing countries as they implement new PM2.5 ambient air quality standards. Although much can be learned
from the experience of North America and Europe, China can leapfrog ahead in terms of PM2.5 monitoring and emission
reduction technology. China-specific guidance documents should be created for network design, equipment selection and
operation, quality control and quality assurance, database management, and interpretation. Future air quality management
and standards will need to consider multiple pollutants and their effects on visibility, climate, materials, and ecosystems in
addition to the primary concerns about public health.

Keywords: PM2.5; PM10; Aerosol sampling; Size-selective inlets; Multipollutant; NAAQS.

INTRODUCTION                                                       particulate matter (PM); 2) review relationships between
                                                                   inhalation properties and their health effects; 3) illustrate
   The Chinese and U.S. National Academies (NRC, 2008),            changes in PM measurement methods and air quality
after examining parallels between the evolution of air             standards; and 4) look to the future of multipollutant air
quality management and energy issues in both countries,            quality management.
recommended China’s adoption of PM2.5 (particles with
aerodynamic diameters [dp] < 2.5 micrometers [μm]) mass            AMBIENT PM SIZE FRACTIONS
concentration as an indicator of adverse health effects. Since
then, China’s State Council has approved PM2.5 national               The basic form of atmospheric PM size distributions
ambient air quality standards (NAAQS) requiring cities to          was elucidated by Whitby et al. (1972) in Los Angeles,
attain concentrations below 35 μg/m3 annual arithmetic             California, using newly developed instrumentation (Liu et
average and < 75 μg/m3 for 24-hr periods beginning in              al., 1974). These researchers originally concluded that
2016 (MEP and AQISQ, 2012). Questions have arisen in               typical particle size distributions could be explained by
the country about how PM2.5 came to be measured and                two log-normal curves superimposed on each other, with a
regulated as an indicator of adverse effects, first in the         minimum in the 1 to 3 μm region. Fig. 1 illustrates current
United States, and later in other parts of the world. The          understanding of ambient particle size distributions with
objectives of this paper are to: 1) provide a brief summary        multiple modes, elaborating on the original Whitby bimodal
of the evolution of size-specific fractions for suspended          distribution. PM2.5 and PM10 (dp < 10 μm), as indicated by
                                                                   the arrows at the top of Fig. 1, are the regulated size fractions
                                                                   in the U.S. and many other countries. PM10 includes PM2.5,
                                                                   and a “coarse” fraction is defined as the difference between
*
    Corresponding author. Tel.: 86-29-8832-6488;                   the two mass measurements (PM10–2.5). The PM2.5 fraction
    Fax: 86-29-8832-0456                                           was often termed the “fine” fraction, but was later given
    E-mail address: cao@loess.llqg.ac.cn                           the PM2.5 designation to specify the 2.5 μm upper size limit.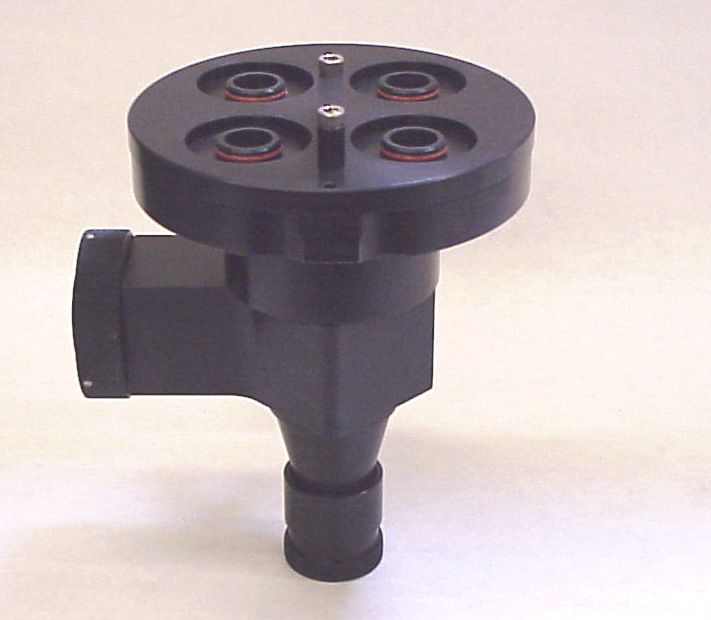
1198                                                     Cao et al., Aerosol and Air Quality Research, 13: 1197–1211, 2013

                                             10
                                                                                                                                                  TSP
                                                                                                                                      PM 10
                                                                                                                         PM 2.5
                                                                                            UP
                                                                     Nano                                                             PM 10-2.5
                                              8                                                                 PM 1.0
               Relative Mass Concentration

                                                                                                                         PM 2.5-1.0

                                                                                        Condensation
                                              6                                            Mode
                                                                                                       Droplet
                                                                                                        Mode

                                                                        Fresh High
                                              4       Condensed        Temperature          Sulfate, Nitrate,
                                                        Organic         Emissions,            Ammonium,
                                                       Carbon or         Organic            Organic Carbon,
                                                     Sulfuric Acid       Carbon,                                             Geological
                                                                                           Elemental Carbon,
                                                     Vapors, Clean     Sulfuric Acid,                                      Material, Pollen,
                                                                                           Heavy Metals, Fine
                                              2      Environment       Metal Vapors                                           Sea Salt
                                                                                              Geological

                                                     Nucleation         Ultrafine           Accumulation                      Coarse

                                              0
                                             0.001              0.01                0.1           1                               10                    100
                                                                           Particle Aerodynamic Diameter (µm)
Fig. 1. Idealized example of an ambient particle size distribution, patterned after Chow (1995) and Watson (2002). TSP =
Total Suspended as measured by a high-volume (hivol) sampler in the particle size range of 0 to ~30–50 μm. Nucleation
and ultrafine modes denote particles less than 0.01 and 0.1 μm, respectively. The accumulation mode contains of most of
the fine particles from ~0.1 to ~2 μm. The ~0.2 μm condensation mode results from gas phase reaction products while the
~0.7 μm droplet mode results from gas absorption and reactions in water droplets. The coarse mode extends from ~2 or 3
μm to 100 μm. UP = Ultrafine Particles. Nano = Nanoparticles.

Relative magnitudes of the nucleation and ultrafine modes                                         2012; Li et al., 2012; Tao et al., 2012; Wang et al., 2012;
are exaggerated in Fig. 1, as ultrafine particles (UP; dp <                                       Xu et al., 2012; Zhang et al., 2012) show that the PM2.5
0.1 μm or 100 nm) dominate particle number counts but                                             size fraction is dominated by sulfate, nitrate, ammonium,
constitute a small (< 5%) fraction of PM2.5 mass.                                                 organic carbon and elemental carbon, with small (< 10%)
   Using low-pressure impactors to obtain better chemical                                         portions from fugitive dust except during Asian dust
resolution within the size distribution, Hering and                                               episodes (Zhao et al., 2010). The PM10–2.5 fraction is
Friedlander (1982) and John et al. (1990) noticed shifts in                                       dominated by geological material, usually in the form of
the maxima of the accumulation mode (~0.1–2 μm) under                                             fugitive dust. PM10–2.5 also contains sea salt (near coastal
different meteorological conditions. They identified a larger                                     areas), bioaerosols (e.g., pollens, spores, and plant parts),
droplet mode, peaking near 0.7 μm, formed from growth of                                          and uncontrolled industrial emissions. Newer industries in
particle nuclei and by aqueous-phase reactions in fogs and                                        China are equipped with pollution control devices (e.g.,
clouds (Penkett et al., 1979). Sulfate, in particular, forms                                      baghouses and precipitators; Hu et al., 2010) that more
from gaseous sulfur dioxide in water droplets, resulting in                                       efficiently remove PM10–2.5 and larger particles than the
larger particles when the droplet evaporates. Under dry                                           smaller accumulation mode particles.
atmospheric conditions, gas-phase conversion of sulfur                                               At the lower end of the size spectrum in Fig. 1, UP are
dioxide and oxides of nitrogen creates smaller particles in                                       both directly emitted by combustion sources and form from
the condensation mode, which peaks at ~0.2 μm. Another                                            condensed gases as secondary aerosols (Watson et al.,
interpretation of these modes for relative humidity (RH)                                          2002; Chang et al., 2004; Chow and Watson, 2006; Watson
> 80% is that the water-absorbing sulfate and nitrate                                             et al., 2006a, b; Chow and Watson, 2007). Coal and biomass
compounds grow into the droplet mode while the water-                                             are the most commonly used solid fuels in combustion.
repellent soot and some organic carbon retain their original                                      Combusted liquid fuels from petroleum refining include
sizes (Zhang et al., 1994).                                                                       residual oil, diesel, kerosene, aircraft, and gasoline. The
   Limited chemical speciation studies in China (e.g.,                                            cleanest burning fuels are gases such as methane, propane,
Zhang and Friedlander, 2000; He et al., 2001; Wu et al.,                                          and butane. Fossil fuels, especially coal, include trace
2003; Ye et al., 2003; Sun et al., 2004; Xu et al., 2004;                                         amounts of sulfur that can be oxidized to sulfuric acid. As
Cao et al., 2005; Louie et al., 2005a, b; Chow et al.,                                            organic gases and sulfuric acid cool upon dilution with
2006a; Duan et al., 2006; Ho et al., 2006; Wang et al.,                                           ambient air, they may condense onto larger particles or
2006; Song et al., 2007; Shen et al., 2007, 2010; Zhang et                                        nucleate into UP. Black carbon soot is produced by
al., 2010; Cao et al., 2011; Deng et al., 2011; Shen et al.,                                      incomplete combustion in oxygen-starved conditions. Some
2011; Yang et al., 2011; Cao et al., 2012a; Huang et al.,                                         of these may be UP, but they often grow due to condensation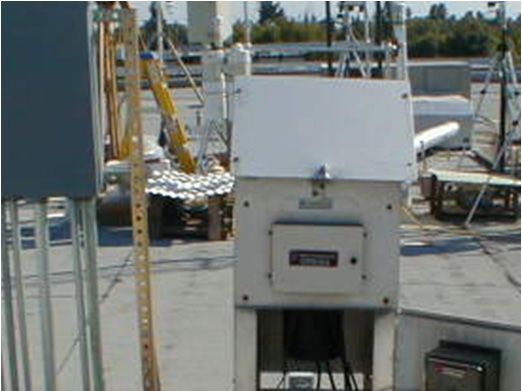
Cao et al., Aerosol and Air Quality Research, 13: 1197–1211, 2013                                    1199

and adsorption of vapors or coagulation with other UP. UP                                                         microscope with different respiratory ailments contracted by
are also produced in clean remote environments. Volatile                                                          workers in 52 different occupations. More detailed studies
organic compounds emitted in the gas-phase by natural                                                             on human inhalation and lung deposition properties were
(e.g., plant life and wildfire) and anthropogenic (e.g., fossil                                                   motivated by increased understanding of the hazards posed
fuel and biofuel combustion) sources transform into semi-                                                         by nuclear testing (Chamberlain and Dyson, 1956). Fig. 2
volatile organic compounds with lower vapor pressures in                                                          summarizes some of the early inhalation and deposition
the presence of sunlight. These gases can nucleate when                                                           efficiencies, determined by measuring inhaled and exhaled
their vapor pressure exceeds the saturation vapor pressure                                                        inert particles. Inhalation and lung deposition estimates
at a given temperature. This nucleation usually occurs when                                                       served as part of the basis toward selecting the PM2.5 and
PM mass concentrations are low, as the vapors preferentially                                                      PM10 size fractions for regulation. Inhalation properties have
condense on larger particles when they are available in                                                           also been measured experimentally using casts of human
sufficient quantities.                                                                                            airways (Gurman et al., 1984a, b; Zhou and Cheng, 2005)
   Both UP and PM10–2.5 have relatively short lifetimes of                                                        and simulated by computational fluid dynamics (CFD)
minutes to a few hours after emission or formation. UP                                                            models (Rostami, 2009), showing the same general patterns
diffuse rapidly to surfaces or grow into the accumulation                                                         as those of Fig. 2.
mode (McMurry, 2000). Coarse particles, including those                                                              Fig. 2 demonstrates that the human nose and mouth do not
> 10 μm, gravitationally deposit to surfaces (Hinds, 2001).                                                       exhibit step-function cut-offs at 2.5 and 10 μm; approximately
PM2.5 in the accumulation mode follows updrafts and can                                                           50% of the particles at these sizes penetrate the nose and
remain suspended for several days, up to a week (Watson                                                           mouth, respectively. The volume and rapidity of breathing
et al., 2000). As a result, PM2.5 mass tends to be more                                                           also affect the inhaled size range, with the cut-point shifting
homogeneously distributed with distance from the emission                                                         to lower sizes during exercise than when at rest. The upper
source and as secondary sulfates and nitrates form over                                                           cut-point for coarse particles was originally believed to be
regional scales (Chow et al., 2002).                                                                              15 μm (Miller et al., 1979), and in the late 1970s the U.S.
                                                                                                                  Inhalable Particulate Network (IPN) characterized the PM15
PM INHALATION PROPERTIES AND HUMAN                                                                                fraction (Watson et al., 1981; Rogers and Watson, 1984).
HEALTH EFFECTS                                                                                                    The 15 μm upper limit for inhalable particles was criticized
                                                                                                                  because a mouthpiece was used to deliver the aerosol to
   People have associated visible air pollution and odors                                                         human subjects that might have minimized the influence of
with displeasure and adverse health effects since the 12th                                                        normal airway obstructions (Swift and Proctor, 1982;
century (Halliday, 1961; Brimblecombe, 1976, 1978; Boubel                                                         Lippmann, 1984; Lodge, 1984; Swift and Proctor, 1984),
et al., 1994). Over 300 years ago, Rammazini (1703) related                                                       and U.S. EPA (1982, 1986) settled on the PM10 indicator
particle number counts measured by an early optical                                                               for regulation.

                                                            120
                                                                       Light Breathing         Normal Breathing            Heavy Breathing
          Fraction Deposited in the Respiratory Tract (%)

                                                            100

                                                            80                                                                                    Mouth (ISO)
                                                                                                                    Nose
                                                                     Lung
                                                            60

                                                            40

                                                            20
                                                                              Trachea

                                                             0
                                                              0.01                       0.1                       1                         10                   100

                                                                                                   Aerodynamic Diameter (µm)
Fig. 2. Inhalation and deposition properties for the human respiratory system. Adapted from Chow (1995) using data from
Phalen et al. (1991). The International Standards Organization (ISO) for mouth breathing is also shown (ACGIH, 1994).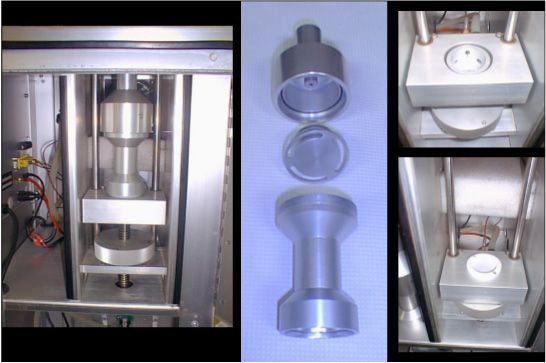
1200                            Cao et al., Aerosol and Air Quality Research, 13: 1197–1211, 2013

   The “fine” fraction had been recognized as another             the volume sampled, and weighing the filter before and
potential indicator of adverse PM health effects (Friedlander,    after sampling to quantify the deposit were first reported
1973; Friedlander and Lippmann, 1994), but ambient data           for London by Russell (1885). This evolved into the high-
were lacking to establish appropriate correlations. The           volume (hivol) sampler in the late 1940s to sample airborne
Harvard Six Cities Study (Spengler and Thurston, 1983;            radioactivity after atmospheric testing of nuclear weapons
Chow and Spengler, 1986a, b; Dockery et al., 1993)                (Robson and Foster, 1962), as illustrated in Fig. 3(a). This
established this relationship using a dichotomous sampler         was further modified into the peaked-roof hivol (Fig. 3(b))
(Evans and Ryan, 1983) with 15 and 2.5 μm 50% cut-points          for total suspended particles (TSP, in the size range 0 to
on its inlets for total (PM15) and fine (PM2.5) particle size     ~30–50 μm) that were operated throughout the U.S. from
fractions, respectively. Subsequent epidemiological studies       the 1960s to the 1980s (Jutze and Foster, 1967) and are
(Chow et al., 2006b; Pope and Dockery, 2006) used similar         still being used to determine attainment of the U.S. TSP
PM2.5 inlets, and PM2.5 was selected as the fine particle         lead (Pb) NAAQS (U.S. EPA, 2008).
indicator for the U.S. PM2.5 NAAQS (U.S. EPA, 1997a).                As knowledge increased about PM inhalation properties
Arguments were made for a 1.0 μm cut-point, since the             (Fig. 2), and as measurement methods were developed to
PM2.5–1.0 fraction is composed of geological material, which      determine the size-selective properties of the hivol and
was also indicated by measurements (Lundgren et al.,              other inlets, it became apparent that the ill-defined hivol
1996). Fig. 2 shows that normal and heavy nose-breathing          cut-point for TSP mass: 1) varied by wind speed and
lower the 50% cut-point closer to 1.0 μm. However, because        orientation into the wind; 2) collected non-inhalable, as
2.5 μm is near the minimum in the particle size distribution      well as inhalable particles; and 3) allowed for substantial
(See Fig. 1), shifts in the cut-point cause only minor (~5%)      particle deposition during passive sampling periods (Chow,
differences in mass concentration (Chow, 1995). In addition,      1995). Based on health effects and inhalation studies
the growing data base for PM2.5 (Chow and Koutrakis,              available at the time, and the development and testing of
1998) with associated epidemiological studies, and the            new inlets, the PM10 NAAQS was promulgated by the U.S.
production of sampler inlets with these size-selective            EPA in 1987 as the best indicator of excessive PM exposure.
properties (Watson and Chow, 2011), resulted in PM2.5             PM10 inlets (Fig. 3(c)) with multiple impaction jets replaced
mass as the selected health indicator. While most of the          the peaked roof hivol inlets for compliance monitoring.
PM2.5 health relationships have been established in North         Part of the motivation in retro-fitting existing hivol samplers
America and Europe, there is increasing evidence of similar       with a new inlet was the large TSP network already in
associations in China (e.g., Venners et al., 2003; Perera et      place and the excessive cost associated with replacing that
al., 2005; Kan et al., 2007; Guo et al., 2009; Huang et al.,      equipment and re-training operators.
2009; Jia et al., 2011; Xie et al., 2011; Cao et al., 2012b,         While adequate for the 1980s, the hivol sampler is not
2012; Langrish et al., 2012).                                     optimal for size-selective sampling or for obtaining more
                                                                  than mass measurements from the filter. The hivol blower
SIZE-SELECTIVE PM MEASUREMENTS                                    has a limited amount of suction, and cannot use membrane
                                                                  filters that are more appropriate to accommodate several
   Much has been written on aerosol sampling and analysis         chemical analyses. The high flow rates (~1000 L/min) could
from North American and European perspectives (e.g.,              load up the inlets, thereby changing the 50% cut-points or
Owens, 1922; Chow, 1995; Spurny, 1998; Landsberger and            re-entraining collected dust back into the air flow (Chow,
Creatchman, 1999; McMurry, 2000; Burtscher, 2002; Wilson          1995). Hivol samplers are also bulky and have high line
et al., 2002; Chow et al., 2007a; Chow and Watson, 2012;          current requirements, thereby limiting the locations in which
Watson and Chow, 2011), and these are still areas of active       they can be conveniently deployed. The U.S. rules also
research. The trend is toward less intrusive and less-costly      provided for a 50% cut-point of 10 ± 0.5 μm (U.S. EPA,
portable samplers, continuous monitoring devices, and             1987), which engendered a race to a lower cut point,
samplers capable of greater chemical speciation (Chow et          toward a PM9.5 fraction, to minimize the odds of exceeding
al., 2006c, d, 2008a, b, 2009, 2010a; Chow and Watson,            the PM10 NAAQS.
2008). As noted above, inhalable particles were first detected       In developing U.S. PM10 State Implementation Plans
and counted by optical microscopy in the 18th century             (SIPs) during the late 1980s, it was soon discovered that
(Rammazini, 1703), but optical microscopy is of limited           more chemical-specific information was needed from the
value when the particle size approaches the wavelength of         PM10 sample than could be obtained from the hivol glass-
light (~0.5 μm), so mostly the coarse fraction was detected.      fiber filters. Low- (e.g., ~10 L/min) and medium- (e.g.,
Large particles (> 10 μm) were characterized in wet and           ~100 L/min) volume filter samplers with single or multiple
dry deposition (Ducros, 1815; Smith, 1852; Russell, 1885)         channels were developed for this purpose to facilitate
in the 19th century. Aitken (1888a, b, 1890) measured             receptor model source apportionment studies which proved
particle numbers (dominated by UP) at the end of the 19th         successful in developing effective emission reduction
century, while the British Smoke method from the 1920s            strategies (Mathai and Stonefield, 1988; Watson, 1989; Chow
quantified the darkening caused by particles drawn through        and Ono, 1992). These studies identified uninventoried
a filter by measuring the attenuation of light reflected from     sources such as road dust, residential wood combustion,
the aerosol deposit (Hill, 1936). PM mass concentrations          and high emitting engines that were not considered in
determined by drawing air through filter paper, measuring         previous control efforts. Through careful network design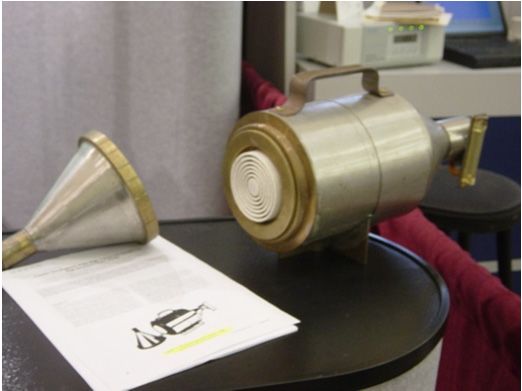
Cao et al., Aerosol and Air Quality Research, 13: 1197–1211, 2013 1201
a) b)
c) d)
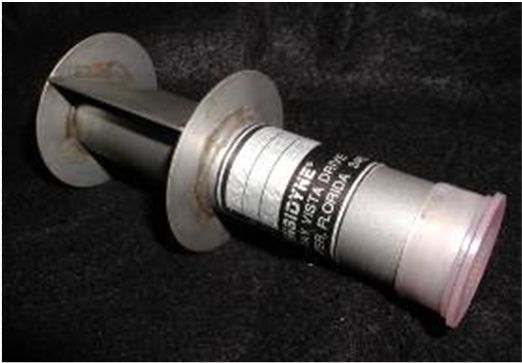
Fig. 3. Examples of: a) the original hivol sampler for total suspended particles (TSP) with pleated filter for radiation
measurements; 2) the peaked-roof hivol inlet for TSP (~1130 L/min); c) the PM10 hivol retrofit (1130 L/min), showing
impaction jets; and d) the PM10 inlet for low-volume (16.7 L/min) samplers. See Watson and Chow (2011) for a complete
listing of PM10 inlet options.
and deployment, source apportionment studies also helped development and testing, the Very Sharp Cut Cyclone
to separate local from regional source contributions to PM (VSCC, Fig. 4(b)) was accepted as an equivalent inlet and
and expanded the geographical areas that needed pollution has replaced the WINS in most U.S. compliance monitoring
control (Chow et al., 2002). More recent PM10 monitors applications. Intercomparison studies (e.g., Chow et al.,
use the low-volume inlet (Fig. 3(d)) with 47 mm diameter 2008a) show that alternatives to the U.S. EPA inlets (Chan
ringed Teflon-membrane filters. and Lippman, 1977; Kenny and Gussman, 1997; John and
The “fine” PM fraction was considered in the mid-1980s, Reischl, 1980; Kenny et al., 2000; Kenny and Gussman,
but it took until 1997 to justify PM2.5 as the new indicator 2000) provide comparable PM2.5 mass measurements in
(U.S. EPA, 1997a). Several commonly used PM2.5 inlets most situations and may be more applicable to non-U.S.
are illustrated in Fig. 4. Instead of specifying performance compliance situations.
criteria for the PM2.5 inlet, U.S. EPA specified the Well-
Impactor Ninety-Six (WINS), illustrated in Fig. 4(a), as the EVOLUTION OF NATIONAL AMBIENT AIR
design standard. This inlet uses a filter soaked in oil as an QUALITY STANDARDS IN THE U.S. AND CHINA
impaction surface to remove particles. It was found that
the oil did not perform well in cold weather or a highly NAAQS (Bachmann, 2007; Chow et al., 2007b) for PM
polluted environment and that the impacted particles would and other ambient air contaminants were first established
accumulate in a conical pile, the tip of which could break in the U.S. and have since been implemented in other
off and be transmitted to the sampled filter. With additional countries. NAAQS consist of an indicator (e.g., PM10 or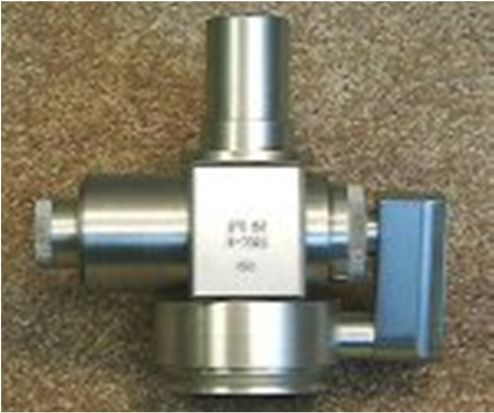
1202                            Cao et al., Aerosol and Air Quality Research, 13: 1197–1211, 2013

    a)                                                                 b)

    c)                                                                 d)

                                              INDEX BAR (PM2.5 B HAS
                                              SPACERS UNDER THE BA
                                              AND LONGE R SCREWS)

Fig. 4. Examples of PM2.5 inlets for: a) Well Impactor Ninety-Six (WINS; 16.7 L/min) initially specified for U.S.
compliance monitoring (Peters et al., 2001; Vanderpool et al., 2001a, b; 2007); b) the Very Sharp Cut Cyclone (VSCC;
16.7 L/min) that has demonstrated equivalence to the WINS (Kenny et al., 2004) and is now implemented in compliance
networks; c) the Air Industrial Hygiene Laboratory (AIHL; John and Reischl, 1980) cyclone (22.8 L/min) used in the U.S.
IMPROVE regional PM2.5 network (Watson, 2002); and d) Bendix/Sensidyne 240 cyclone (113 L/min) used for parallel
sampling on multiple channels for chemical speciation measurements (Chan and Lippmann, 1977; Chow et al., 1993). See
Watson and Chow (2011) for a complete listing of PM2.5 inlet options.

PM2.5 mass), an averaging time (e.g., 5 min, 1-hr, 24-hr, or           The key component for air quality management (i.e., the
1-year), a concentration level, and a statistical form                 center of the circle in Fig. 2 of Bachmann (2007)) is an
(Watson et al., 1995). In the U.S., the 1970 Clean Air Act             active research component that is continually developing new
and its Amendments require the U.S. EPA to re-evaluate                 measurement methods, exploring atmospheric interactions,
the NAAQS every five years to determine the extent to                  establishing relationships between concentrations and
which they provide an adequate margin of safety for the                adverse effects, and inventing less polluting technologies.
most susceptible populations, typically children, the elderly,            China’s Environmental Protection Office (EPO) was
and people with respiratory problems. As noted in Table 1,             established in 1973, evolved into the Chinese State
a more stringent level (12 μg/m3) has been promulgated by              Environmental Protection Administration (SEPA) in 1984,
the U.S. EPA for the annual PM2.5 NAAQS while retaining                and was promoted to the Ministry of Environmental
the indicator, averaging time, and statistical form (U.S. EPA,         Protection (MEP) in 2008 (NRC, 2008). In 1987, the
2013). Bachmann (2007) describes air quality management                Committee of the People’s Congress Council enacted the
as an iterative circle in which: 1) the best information is            Law of the People’s Republic of China (PRC) on the
used to set ambient air quality standards; 2) air is monitored         Prevention and Control of Atmospheric Pollutants (revised
to identify areas that exceed the standards; 3) source                 in 1995 and 2000) along with the PRC Environmental
contributions are identified through source and receptor               Protection Law in 1989 (MEP, 2013).
modeling; 4) emission reduction strategies are formulated                 Table 2 traces the evolution of Chinese PM NAAQS.
and implemented, and 5) long-term measurements are used                The approach was, and still is, to set different limits for
to evaluate the successes and failures of those strategies.            different environments. Class I areas were designated by the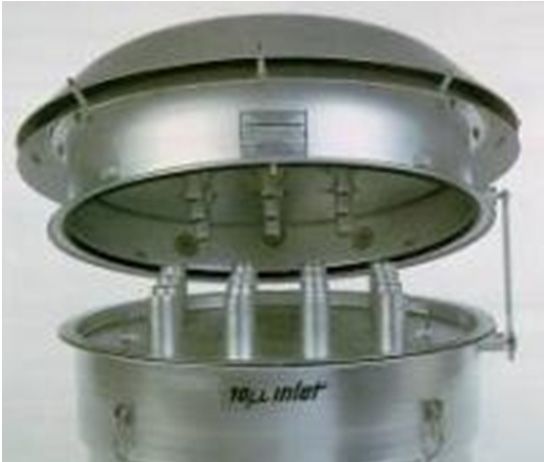
Cao et al., Aerosol and Air Quality Research, 13: 1197–1211, 2013                              1203

Table 1. Summary of particulate matter (PM) National Ambient Air Quality Standards (NAAQS) implemented by the U.S.
Environmental Protection Agency (U.S. EPA).
       Year of                24 hr Average               Statistical Form for      Annual Average         Statistical Form for
                   Indicatora
    Implementation               (μg/m3)                     24 hr Average             (μg/m3)              Annual Average
                                                   Not to be exceeded more than
         1971           TSP            260                                                  75         Annual geometric mean
                                                   once per year
                                                   Not to be exceeded more than
                                                                                                       Annual arithmetic mean
         1987           PM10           150         once per year on average over            50
                                                                                                       averaged over three years
                                                   a three-year period
                                                   98th percentile averaged over                       Annual arithmetic mean
        1997a           PM2.5           65                                                  15
                                                   three years                                         averaged over three years
                                                                                                       Annual average was
         2006           PM10           150         Same as 1987 NAAQS                     None
                                                                                                       vacated
                                                     th
                                                   98 percentile averaged over
         2006           PM2.5           35                                                  15         Same as 1997 NAAQS
                                                   three years
                                                                                                       Annual average was
         2013           PM10           150         Same as 1987 NAAQS                     None
                                                                                                       vacated in 2006
                                                                                                       Annual arithmetic mean
         2013           PM2.5           35         Same as 2006 NAAQS                       12
                                                                                                       averaged over three years.
a
    See Fig. 1 for definition of the particle size mass fraction indicators.

                    Table 2. Evolution of ambient air quality standards for particulate matter (PM) in China.
    Implementation Documenta: EPO (1982)
                                         Daily Averageb (μg/m3)                         Maximum Not to Exceedc (μg/m3)
           Standard                    d
                               Class I          Class IIe     Class IIIf              Class Id   Class IIe       Class IIIf
             TSP                 150              300           500                    300         1000            1500
      Airborne Particlesg         50              150           250                    150          500             700

    Implementation Document: SEPA and STSA (1996)
                                         Daily Average (μg/m3)                           Annual Arithmetic Mean (μg/m3)
           Standard                    d
                               Class I          Class IIe     Class IIIf              Class Id      Class IIe     Class IIIf
             TSP                120               300           500                     80            200           300
      Airborne Particlesg        50               150           250                     40            100           150

  Implementation Document: MEP (2012)
                                           24 hr Average (μg/m3)                      Annual Arithmetic Mean (μg/m3)
          Standard                       d                h
                                 Class I          Class II                         Class Id       Class IIh
             TSP                    120             300                               80            200
             PM10                    50             150                               40             70
             PM2.5                   35              75                               15             35
a
  EPO: Environmental Protection Office; SEPA: State Environmental Protection Administration; STSA: State Technology
Supervision Administration; MEP: Ministry of Environmental Protection.
b
  The daily average for 1982 and 1996 was redefined as a 24-hr average in 2012.
c
  Replaced by annual standards as of 1996.
d
  Applies to national parks, conservation areas, and designated historical sites.
e
  Applies to residential and commercial areas.
f
  Applies to industrial and heavy traffic areas.
g
  Defined as airborne particles with dp < 10 μm; redefined as inhalable particulate matter (PM10).
h
  Applies to residential, commercial, cultural, industrial, and heavily trafficked areas. Previous Class III areas are included
in Class II.

central government, while the Class II and III designations           μm, somewhat equivalent to PM10) by gravimetric mass
were assigned by provincial and local governments                     (EPO, 1982; Siddiqi and Zhang, 1984). Measurement
(Siddiqi and Zhang, 1984; Florig, 2002). The first ambient            methods for PM were not specified until 1986 (SEPA, 1986),
air quality standards issued by the EPO in 1982 included              at which time a 50% cut point of 10 ± 1 μm and geometric
both TSP (dp < 100 μm) and “airborne particles” (dp < 10              standard deviation (σg) of ≤ 1.5 were defined for “airborne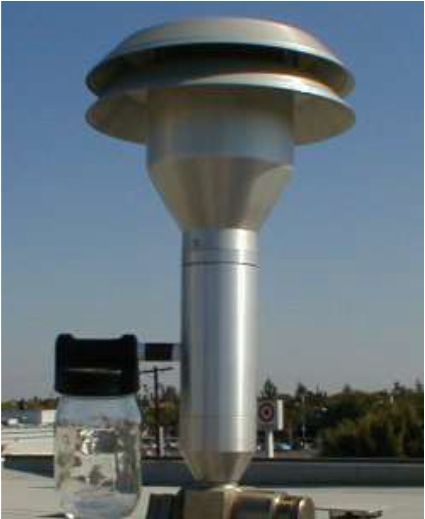
1204                            Cao et al., Aerosol and Air Quality Research, 13: 1197–1211, 2013

particles”, which were renamed “inhalable PM” (PM10) in           ± 0.5 mg for high- and medium-/low-volume samplers,
1996 (SEPA and STSA, 1996). PM10 samplers were later              respectively (MEP, 2011).
specified with a 50% cut point of 10 ± 0.5 μm and σg = 1.5
± 0.1; PM2.5 was introduced with a 50% cut point of 2.5 ±         AIR QUALITY MANAGEMENT IN THE FUTURE
0.2 μm and σg of 1.2 ± 0.1 (MEP, 2011).
   EPO (1982) regulated daily average and maximum not-               Air quality management (AQM) and the reduction of
to-exceed concentrations of TSP and PM10. A minimum               ambient air pollution levels require extraordinary scientific
sampling time of one hour was required to determine the           and technical efforts and commitment from both the
not-to-exceed concentration. To compute a daily average,          government and the community at large. The U.S. experience
at least two intervals with total sample durations > 6 hr were    (Bachmann, 2007; Chow et al., 2007b) provides a basis for
needed for TSP (SEPA, 1988), and at least four intervals          China and other countries to develop their AQM strategies.
with each sample duration > 1 hr required for airborne               With a continuous race between economic development
particles (SEPA, 1986).                                           and environmental pollution, clean air is a major challenge
   SEPA and STSA (1996) replaced the 1982 approach                in China that requires substantial efforts in pollutant
with daily and annual arithmetic average limits for TSP           measurement and control (Zhang et al., 2012). While the
and airborne particles. A sample duration of 12 to 24 hrs         history of establishing and implementing NAAQS in the
was required to compute a daily average. For the annual           U.S. has proven to be effective without hindering economic
average, each month was represented by five or more daily         growth (U.S. EPA, 2012b), there are important shortfalls
averages, and these 12 monthly averages were averaged             that should not be repeated in other countries. For example,
for the year, with the provision of at least 60 daily samples     single pollutant monitoring strategies (U.S. EPA, 2005) for
distributed throughout the year.                                  determining NAAQS compliance are insufficient. Air quality
   Replacement of manual filter samplers (SEPA, 2005a)            networks in China and other countries should specify
with contiuous Beta Attenuation Monitors (BAM) and                multiple objectives including: 1) examination of long-term
Tapered Element Oscillating Microbalances (TEOM) was              trends, source zones of influence, and source apportionment
permitted as of 2005 (SEPA, 2005b, 2007), requiring               modeling, and 2) evaluation of relationships between ambient
averaging of 12 to 24 hourly values to compute the daily          measurements and adverse effects. Instead of focusing on
average, and 12 monthly averages (derived from at least 21        PM abatement at a local level, monitoring networks should
daily averages) to determine the annual average.                  include the measurement of precursor gases such as sulfur
   MEP and AQISQ (2012) added PM2.5 standards, requiring          dioxide, nitrogen oxides, and carbon monoxide. Fig. 5
20 to 24 valid hourly concentrations for the daily average        shows some of the complex interactions among air pollution
and at least 324 daily averages with ≥ 27 days per month          sources, ambient pollutants, and effects that will need to be
(≥ 25 days for February) to compute the annual average.           addressed in the future.
   Measurement methods for the Chinese NAAQS evolved,                Of particular note is the emergence of UP and black
but documentation on this evolution is not as complete as         carbon (BC) as potential future indicators of adverse
that for the U.S. Federal Reference Methods and Federal           effects on health and climate. The European Union is
Equivalent Methods (U.S. EPA, 2012a). “Super-fine glass-          evaluating test methods for certifying engine exhaust UP
fiber filters” were specified by EPO (1982) for gravimetric       emissions (Wang et al., 2010; Giechaskiel et al., 2012),
analysis. Glass-fiber and perchloroethylene filters with          and the California Air Resources Board (CARB, 2011) has
≥ 90% collection efficiency were specified by SEPA (1988).        proposed methods for both UP and BC as engine exhaust
SEPA (2005a) specified flow rates (1050 L/min or 100 L/min        indicators. Research is progressing in continuous monitors
for high- and medium-/low-volume sampling, respectively)          and microsensors that can more cost-effectively monitor
with a 70 mm diameter filter. Sample volumes were to be           multipollutant observables in source emissions and ambient
adjusted to standard temperature and pressure (STP at             air (Chow et al., 2008a, Wang et al., 2012).
273°K and 101.3 kPa, respectively) using “superfine glass-           China has made a good start in adopting PM2.5 as an
fiber” or “organic-fiber” filters with collection efficiencies    indicator of adverse health effects. Although the Class II
of ≥ 99% for 0.3 μm particles and post-sampling storage at        levels are higher than those in the U.S. and other countries,
≤ 4°C (SEPA, 2005a). Additional filter substrates (i.e.,          a more frequent revision cycle would allow them to be
glass-fiber, quartz-fiber, perchloroethylene, polypropylene,      adjusted in the future to conform with emerging science on
and cellulose-fiber) were authorized by MEP (2011).               the multiple adverse effects of excessive PM2.5. The new
   SEPA (1986) had filters placed in a desiccator for 24 hr,      standards should provide motivation to city and provincial
followed by gravimetry with a 0.1 mg sensitivity balance,         Environmental Protection Bureaus (EPBs) to increase their
followed by an additional hour of desiccation and a second        efforts in pollution monitoring and control. Enforcement of
weighing. The difference between the two gravimetric              NAAQS needs to be stringent and centralized by the
analyses was to be within ± 0.4 mg (SEPA, 1986). MEP              government, with specified siting requirements, measurement
(2011) specified a 0.01 mg sensitivity balance for filter         methods (e.g., instrument type, calibration, filter media,
weighing after equilibration at 15–30°C temperature and           sampling duration, and data validation), attainment deadlines,
45–55% relative humidity. A standard filter is used to            consequences, and penalties. A “track and evaluation”
evaluate weighing precision that is equilibrated for 24 hr,       system is needed to assess accountability and long-term
and weighed 10 times with variations less than ± 5 mg and         control measure effectiveness.
Cao et al., Aerosol and Air Quality Research, 13: 1197–1211, 2013 1205
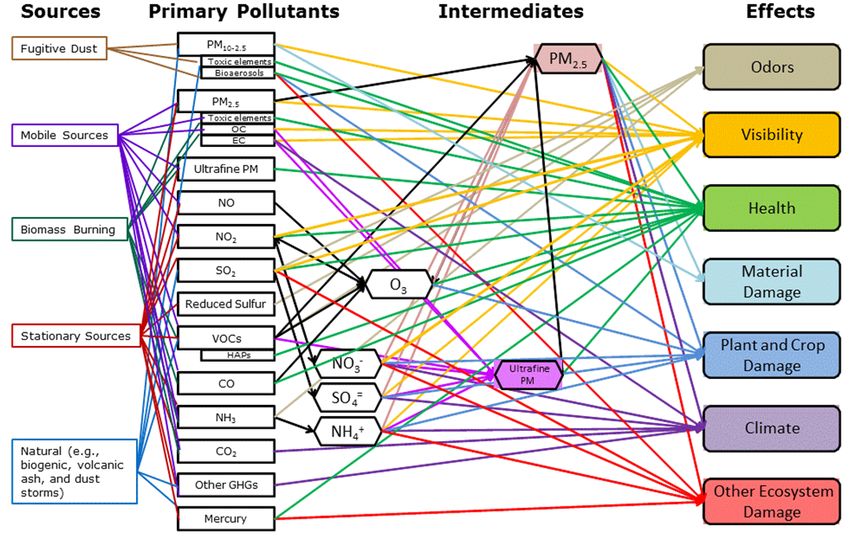
Fig. 5. Multiple pollutants and their multiple adverse effects (Baasel, 1985; Chow et al., 2010a; Hidy and Pennell, 2010;
Mauderly et al., 2010; Chow and Watson, 2011; Hidy et al., 2011). This graph shows simplified relationships and the
interactions among various emission sources, their primary pollutants, the transforming product (Intermediates) in the
atmosphere, and the effects by most dominant pollutants. It should be noted that the residence time of each pollutant varies
(e.g., from minutes to hours for ultrafine PM (UP) to over 100 years for CO2 and some greenhouse gases [GHGs]). In
addition, the exposed concentration level, lag times, and duration dictate the extent of adverse effects. Challenges for PM2.5
air quality management will involve its interaction with these different pollutants and effects.
China-specific guidance documents need to be produced 1994-1995 Threshold Limit Values for Chemical
that can be used by EPB staff to design monitoring networks, Substances and Physical Agents and Biological Exposure
select, operate, and maintain monitoring instruments, Indices, American Conference of Governmental Industrial
implement quality control and quality assurance systems, Hygienists, Cincinnati, OH, p. 43–46.
and interpret the results (U.S. EPA, 1997b, 1998a, b; 2007). Aitken, J. (1888a). On Improvements in the Apparatus for
With consistent and healthy economic growth, China can Counting the Dust Particles in the Atmosphere. Proc. R.
leapfrog (Chow et al., 2010c) ahead of other countries in Soc. Edinburgh XVI: 207–235.
PM2.5 monitoring and control. Aitken, J. (1888b). On the Number of Dust Particles in the
China and all other countries need to devote their resources Atmosphere. Trans. R. Soc. Edinburgh 35: 1–19.
and effort to improving air quality and continue investing Aitken, J. (1890). On a Simple Pocket Dust-counter. Proc.
in the scientific research that provides knowledge for R. Soc. Edinburgh XVIII: 39–53.
future standards and serves as a training ground for future Baasel, W.D. (1985). Economic Methods for Multipollutant
generations of air quality professionals. Analysis and Evaluation, Marcel Dekker, Inc., New York.
Bachmann, J.D. (2007). Will the Circle Be Unbroken: A
ACKNOWLEDGMENTS History of the US National Ambient Air Quality
Standards-2007 Critical Review. J. Air Waste Manage.
This study was supported by the “Strategic Priority Assoc. 57: 652–697..
Research Program” of the Chinese Academy of Sciences Boubel, R.W., Fox, D.L., Turner, D.B. and Stern, A.C.
(XDA05100401). The authors thank Dr. Xiaoliang Wang (1994). Air Quality Criteria and Standards. In
of Desert Research Institute, USA for his assistance with Fundamentals of Air Pollution, 3rd Ed., Academic Press,
manuscript preparation. San Diego, p. 367–381.
Brimblecombe, P. (1976). Attitudes and Responses Towards
REFERENCES Air Pollution in Medieval England. J. Air Pollut. Contr.
Assoc. 26: 941–945.
ACGIH (1994). Appendix D: Particle Size-selective Brimblecombe, P. (1978). Air Pollution in Industrializing
Sampling Criteria for Airborne Particulate Matter, In England. J. Air Pollut. Contr. Assoc. 28: 115–118.1206 Cao et al., Aerosol and Air Quality Research, 13: 1197–1211, 2013 Burtscher, H. (2002). Novel Instrumentation for the A Fine Particle Standard, Air & Waste Management Characterization of Ultrafine Particles. J. Aerosol Med. Association, Pittsburgh, PA. 15: 149–160. Chow, J.C., Engelbrecht, J.P., Watson, J.G., Wilson, W.E., Cao, J.J., Rong, B., Lee, S.C., Chow, J.C., Ho, K.F., Liu, S.X. Frank, N.H. and Zhu, T. (2002). Designing Monitoring and Zhu, C.S. (2005). Composition of Indoor Aerosols at Networks to Represent Outdoor Human Exposure. the Emperor Qin's Terra-Cotta Museum, Xi'an, China, Chemosphere 49: 961–978. during Summer 2004. Particuology 3: 170–175. Chow, J.C. and Watson, J.G. (2006). Overview of Cao, J.J., Li, H., Chow, J.C., Watson, J.G., Lee, S.C., Ultrafine Particles and Human health. WIT Trans. Ecol. Rong, B., Dong, J.G. and Ho, K.F. (2011). Chemical Environ. 99: 619–632, doi: 10.2495/RAV060621. Composition of Indoor and Outdoor Atmospheric Particles Chow, J.C., Watson, J.G., Chen, L.W.A., Ho, S.S.H., at Emperor Qin's Terra-cotta Museum, Xi'an, China. Koracin, D., Zielinska, B., Tang, D., Perera, F., Cao, J.J. Aerosol Air Qual. Res. 11: 70–79. and Lee, S.C. (2006a). Exposure to PM2.5 and PAHs Cao, J.J., Shen, Z.X., Chow, J.C., Lee, S.C., Watson, J.G., from the Tong Liang, China, Epidemiological Study. J. Tie, X.X., Ho, K.F., Wang, G.H. and Han, Y.M. (2012a). Environ. Sci. Health., Part A 41: 517–542. Winter and Summer PM2.5 Chemical Compositions in Chow, J.C., Watson, J.G., Mauderly, J.L., Costa, D.L., 14 Chinese cities. J. Air Waste Manage. Assoc. 62: Wyzga, R.E., Vedal, S., Hidy, G.M., Altshuler, S.L., 1214–1226, doi: 10.1080/10962247.2012.701193. Marrack, D., Heuss, J.M., Wolff, G.T., Pope, C.A., III and Cao, J.J., Xu, H.M., Xu, Q., Chen, B.H. and Kan, H.D. Dockery, D.W. (2006b). 2006 Critical Review Discussion (2012b). Fine Particulate Matter Constituents and - Health Effects of Fine Particulate Air Pollution: Lines Cardiopulmonary Mortality in a Heavily Polluted That Connect. J. Air Waste Manage. Assoc. 56: 1368– Chinese City. Environ. Health Perspect. 120: 373–378. 1380. CARB (2011). Appendix P: LEV III PM Technical Support Chow, J.C., Watson, J.G., Lowenthal, D.H., Chen, L.W.A., Document-Development of Particulate Matter Mass Tropp, R.J., Park, K. and Magliano, K.L. (2006c). PM2.5 Standards for Future Light Duty Vehicles, California Air and PM10 Mass Measurements in California's San Resources Board, Sacramento, CA, http://www.arb.ca. Joaquin Valley. Aerosol Sci. Technol. 40: 796–810. gov/regact/2012/leviiighg2012/levappp.pdf. Chow, J.C., Watson, J.G., Park, K., Lowenthal, D.H., Chamberlain, A.C. and Dyson, E.D. (1956). The Dose to Robinson, N.F. andMagliano, K.L. (2006d). Comparison the Trachea and Bronchi from the Decay Products of of Particle Light Scattering and PM2.5 Mass in Central Radon and Thoron. Br. J. Radiol. 29: 317–325. California. J. Air Waste Manage. Assoc. 56: 398–410. Chan, T. and Lippmann, M. (1977). Particle Collection Chow, J.C. and Watson, J.G. (2007). Survey of Measurement Efficiencies of Sampling Cyclones: An Empirical Theory. and Composition of Ultrafine Particles. Aerosol Air Environ. Sci. Technol. 11: 377–386. Qual. Res. 7: 121–173. Chang, M.C.O., Chow, J.C., Watson, J.G., Hopke, P.K., Chow, J.C., Yu, J.Z., Watson, J.G., Ho, S.S.H., Bohannan, Yi, S.M. and England, G.C. (2004). Measurement of T.L., Hays, M.D. and Fung, K.K. (2007a). The Application Ultrafine Particle Size Distributions from Coal-, Oil-, of Thermal Methods for Determining Chemical and Gas-fired Stationary Combustion Sources. J. Air Composition of Carbonaceous Aerosols: A Review. J. Waste Manage. Assoc. 54: 1494–1505. Environ. Sci. Health., Part A 42: 1521–1541. Chow, J.C. and Spengler, J.D. (1986a). Overview of Chow, J.C., Watson, J.G., Feldman, H.J., Nolan, J., Harvard Air Pollution Respiratory Health Study Program, Wallerstein, B.R., Hidy, G.M., Lioy, P.J., McKee, H.C., Part I: Project Design and Ambient Monitoring. J. Ind. Mobley, J.D., Bauges, K. and Bachmann, J.D. (2007b). Pollut. Control 4: 30–54. 2007 Critical Review Discussion - Will the Circle Be Chow, J.C. and Spengler, J.D. (1986b). Overview of Unbroken: A History of the U.S. National Ambient Air Harvard Air Pollution Respiratory Health Study Program, Quality Standards. J. Air Waste Manage. Assoc. 57: Part II: Chemical Analysis and Quality Control/Quality 1151–1163. Assurance Aspects. J. Ind. Pollut. Control 4: 18–32. Chow, J.C. and Watson, J.G. (2008). New Directions: Chow, J.C. and Ono, D.M. (1992). Transactions-PM10 Beyond Compliance Air Quality Measurements. Atmos. Standards and Nontraditional Particulate Source Controls, Environ. 42: 5166–5168. Air & Waste Management Association, Pittsburgh, PA. Chow, J.C., Doraiswamy, P., Watson, J.G., Chen, L.W.A., Chow, J.C., Watson, J.G., Bowen, J.L., Frazier, C.A., Ho, S.S.H. and Sodeman, D.A. (2008a). Advances in Gertler, A.W., Fung, K.K., Landis, D. and Ashbaugh, Integrated and Continuous Measurements for Particle L.L. (1993). A Sampling System for Reactive Species in Mass and Chemical Composition. J. Air Waste Manage. the Western United States, In Sampling and Analysis of Assoc. 58: 141–163. Airborne Pollutants, Winegar, E.D. and Keith, L.H. Chow, J.C., Watson, J.G., Lowenthal, D.H., Park, K., (Eds.), Lewis Publishers, Ann Arbor, MI, p. 209–228. Doraiswamy, P., Bowers, K. and Bode, R. (2008b). Chow, J.C. (1995). Critical Review: Measurement Methods Continuous and Filter-based Measurements of PM2.5 to Determine Compliance with Ambient Air Quality Nitrate and Sulfate at the Fresno Supersite. Environ. Standards for Suspended Particles. J. Air Waste Manage. Monit. Assess. 144: 179–189. Assoc. 45: 320–382. Chow, J.C., Watson, J.G., Doraiswamy, P., Chen, L.W.A., Chow, J.C. and Koutrakis, P. (1998). Proceedings-PM2.5: Sodeman, D.A., Lowenthal, D.H., Park, K., Arnott,
Cao et al., Aerosol and Air Quality Research, 13: 1197–1211, 2013                         1207

  W.P. and Motallebi, N. (2009). Aerosol Light Absorption,          H.E. (2009). The Association between Fine Particulate
  Black Carbon, and Elemental Carbon at the Fresno                  Air Pollution and Hospital Emergency Room Visits for
  Supersite, California. Atmos. Res. 93: 874–887.                   Cardiovascular Diseases in Beijing, China. Sci. Total
Chow, J.C., Watson, J.G., Green, M.C. and Frank, N.H.               Environ. 407: 4826–4830.
  (2010a). Filter Light Attenuation as a Surrogate for           Gurman, J.L., Lippmann, M. and Schlesinger, R.B. (1984a).
  Elemental Carbon. J. Air Waste Manage. Assoc. 60:                 Particle Deposition in Replicate Casts of the Human
  1365–1375.                                                        Upper Tracheobronchial Tree under Constant and Cyclic
Chow, J.C., Bachmann, J.D., Kinsman, J.D., Legge, A.H.,             Inspiratory Flow. 1. Experimental. Aerosol Sci. Technol.
  Watson, J.G., Hidy, G.M. and Pennell, W.R. (2010b).               3: 245–252.
  Multipollutant Air Quality Management: Critical Review         Gurman, J.L., Lioy, P.J., Lippmann, M. and Schlesinger,
  Discussion. J. Air Waste Manage. Assoc. 60: 1151–1164.            R.B. (1984b). Particle Deposition in Replicate Casts of
Chow, J.C., Watson, J.G. and Cao, J.J. (2010c). Highlights          the Human Upper Tracheobronchial Tree under Constant
  from "Leapfrogging Opportunities for Air Quality                  and Cyclic Inspiratory Flow. 2. Empirical Model. Aerosol
  Improvement". EM 16: 38–43.                                       Sci. Technol. 3: 253–257.
Chow, J.C. and Watson, J.G. (2011). Air Quality                  Halliday, E.C. (1961). A Historical Review of Atmospheric
  Management of Multiple Pollutants and Multiple Effects.           Pollution, World Health Organization, Geneva.
  Air Qual. Clim Change 45: 26–32.                               He, K.B., Yang, F., Ma, Y., Zhang, Q., Yao, X., Chan,
Chow, J.C. and Watson, J.G. (2012). Chemical Analyses               C.K., Cadle, S.H., Chan, T. and Mulawa, P. (2001). The
  of Particle Filter Deposits, In Aerosols Handbook:                Characteristics of PM2.5 in Beijing, China. Atmos.
  Measurement, Dosimetry, and Health Effects, 2, Ruzer,             Environ. 35: 4959–4970.
  L. and Harley, N.H. (Eds.), CRC Press/Taylor & Francis,        Hering, S.V. and Friedlander, S.K. (1982). Origins of
  New York, p. 177–202.                                             Aerosol Sulfur Size Distributions in the Los Angeles
Deng, C., Zhuang, G., Huang, K., Li, J., Zhang, R., Wang,           Basin. Atmos. Environ. 16: 2647–2656.
  Q., Liu, T., Sun, Y., Guo, Z., Fu, J.S. and Wang, Z.           Hidy, G.M. and Pennell, W.R. (2010). Multipollutant Air
  (2011). Chemical Characterization of Aerosols at the              Quality Management: A Critical Review. J. Air Waste
  Summit of Mountain Tai in Central East China. Atmos.              Manage. Assoc. 60: 645–674.
  Chem. Phys. 11: 7319–7332.                                     Hidy, G.M., Brook, J., Demerjian, K., Molina, L., Pennell,
Dockery, D.W., Pope, C.A., III, Xu, X., Spengler, J.D.,             W.R. and Scheffe, R. (2011). Technical Challenges of
  Ware, J.H., Fay, M.E., Ferris, B.G. and Speizer, F.E.             Multipollutant Air Quality Management, Springer, New
  (1993). An Association between Air Pollution and                  York.
  Mortality in Six U.S. Cities. New Engl. J. Med. 329:           Hill, A.S.G. (1936). Measurement of the Optical Densities
  1753–1759.                                                        of Smokestains of Filter Papers. Trans. Faraday Soc.
Duan, F.K., He, K.B., Ma, Y.L., Yang, F.M., Yu, X.C.,               32: 1125–1131.
  Cadle, S.H., Chan, T. and Mulawa, P.A. (2006).                 Hinds, W.C. (2001). Physical and Chemical Changes in the
  Concentration and Chemical Characteristics of PM2.5 in            Particulate Phase, In Aerosol Measurement: Principles,
  Beijing, China: 2001-2002. Sci. Total Environ. 355: 264–          Techniques, and Applications, Second Edition, 2nd ed.,
  275.                                                              Baron, P. and Willeke, K. (Eds.), John Wiley & Sons,
Ducros, M. (1815). Observation d'une Pluie Acide. Jour.             New York, p. 83–97.
  de Pharm. et de Chim. 7: 273–277.                              Ho, K.F., Lee, S.C., Cao, J.J., Chow, J.C., Watson, J.G.
EPO (1982). GB 3095-82: Ambient Air Quality Standard,               and Chan, C.K. (2006). Seasonal Variations and Mass
  Environmental Protection Office, Beijing, China.                  Closure Analysis of Particulate Matter in Hong Kong.
Evans, J.S. and Ryan, P.B. (1983). Statistical Uncertainties        Sci. Total Environ. 355: 276–287.
  in Aerosol Mass Concentrations Measured by Virtual             Hu, H., Yang, Q., Lu, X., Wang, W.C., Wang, S.S. and
  Impactors. Aerosol Sci. Technol. 2: 531–536.                      Fan, M.H. (2010). Air Pollution and Control in Different
Florig, H.K., Sun, G.D. and Song, G.J. (2002). Evolution            Areas of China. Crit. Rev. Environ. Sci. Technol. 40:
  of Particulate Regulation in China - Prospects and                52–518.
  Challenges of Exposure-Based Control. Chemosphere              Huang, W., Cao, J.J., Tao, Y.B., Dai, L.Z., Lu, S.E., Hou,
  49: 1163–1174.                                                    B., Wang, Z. and Zhu, T. (2012). Seasonal Variation of
Friedlander, S.K. (1973). Small Particles in Air Pose a Big         Chemical Species Associated with Short-term Mortality
  Control Problem. Environ. Sci. Technol. 7: 1115–1118.             Effects of PM2.5 in Xi'an, a Central City in China. Am. J.
Friedlander, S.K. and Lippmann, M. (1994). Revising the             Epidemiol. 175:556–566.
  Particulate Ambient Air Quality Standard. Environ. Sci.        Huang, W., Tan, J.G., Kan, H.D., Zhao, N., Song, W.M.,
  Technol. 28: 148A–150A.                                           Song, G.X., Chen, G.H., Jiang, L.L., Jiang, C., Chen,
Giechaskiel, B., Mamakos, A., Andersson, J., Dilara, P.,            R.J. and Chen, B.H. (2009). Visibility, Air Quality and
  Martini, G., Schindler, W. and Bergmann, A. (2012).               Daily Mortality in Shanghai, China. Sci. Total Environ.
  Measurement of Automotive Nonvolatile Particle Number             407: 3295–3300.
  Emissions within the European Legislative Framework:           Jia, Y.L., Stone, D., Wang, W.T., Schrlau, J., Tao, S. and
  A Review. Aerosol Sci. Technol. 46: 719–749.                      Simonich, S.L.M. (2011). Estimated Reduction in Cancer
Guo, Y.M., Jia, Y.P., Pan, X.C., Liu, L.Q. and Wichmann,            Risk Due to PAH Exposures if Source Control Measures
1208                             Cao et al., Aerosol and Air Quality Research, 13: 1197–1211, 2013

   during the 2008 Beijing Olympics were Sustained.                  Composition in Hong Kong: Urban and Regional
   Environ. Health Perspect. 119:815–820.                            Variations. Sci. Total Environ. 338: 267–281.
John, W. and Reischl, G. (1980). A Cyclone for Size-               Louie, P.K.K., Watson, J.G., Chow, J.C., Chen, L.W.A.,
   selective Sampling of Ambient Air. J. Air Pollut. Contr.          Sin, D.W.M. and Lau, A.K.H. (2005b). Seasonal
   Assoc. 30:872–876.                                                Characteristics and Regional Transport of PM2.5 in Hong
John, W., Wall, S.M., Ondo, J.L. and Winklmayr, W.                   Kong. Atmos. Environ. 39: 1695–1710.
   (1990). Modes in the Size Distributions of Atmospheric          Lundgren, D.A., Hlaing, D.N., Rich, T.A. and Marple,
   Inorganic Aerosol. Atmos. Environ. 24A: 2349–2359.                V.A. (1996). PM10/PM2.5/PM1 Data from a Trichotomous
Jutze, G.A. and Foster, K.E. (1967). Recommended                     Sampler. Aerosol Sci. Technol. 25: 353–357.
   Standard Method for Atmospheric Sampling of Fine                Mathai, C.V. and Stonefield, D.H. (1988). Transactions-
   Particulate Matter by Filter Media – High-volume                  PM10: Implementation of Standards, Air Pollution Control
   Sampler. J. Air Pollut. Contr. Assoc. 17: 17–25.                  Association, Pittsburgh, PA.
Kan, H.D., London, S.J., Chen, G.H., Zhang, Y.H., Song,            Mauderly, J.L., Burnett, R.T., Castillejos, M., Ozkaynak,
   G.X., Zhao, N.Q., Jiang, L.L. and Chen, B.H. (2007).              H., Samet, J.M., Stieb, D.M., Vedal, S. and Wyzga, R.E.
   Differentiating the Effects of Fine and Coarse Particles          (2010). Commentary: Is the Air Pollution Health Research
   on Daily Mortality in Shanghai, China. Environ. Int. 33:          Community Prepared to Support a Multipollutant Air
   376–384.                                                          Quality Management Framework? Inhalation Toxicol.
Kenny, L.C. and Gussman, R.A. (1997). Characterization and           22: 1–19.
  Modelling of a Family of Cyclone Aerosol Preseparators.          McMurry, P.H. (2000). A Review of Atmospheric Aerosol
  J. Aerosol Sci. 28: 677–688.                                       Measurements. Atmos. Environ. 34: 1959–1999.
Kenny, L.C. and Gussman, R.A. (2000). A Direct Approach            MEP (2011). Determination of Atmospheric Particles
   to the Design of Cyclones for Aerosol-monitoring                  PM10 and PM2.5 in Ambient Air by Gravimetric Method
   Applications. J. Aerosol Sci. 31: 1407–1420.                      (HJ 618-2011), Published by Chinese Ministry of
Kenny, L.C., Gussman, R.A. and Meyer, M.B. (2000).                   Environmental Protection (MEP), 08 September 2011,
   Development of a Sharp-cut Cyclone for Ambient                    Beijing, China, http://kjs.mep.gov.cn/hjbhbz/bzwb/dqhj
   Aerosol Monitoring Applications. Aerosol Sci. Technol.            bh/jcgfffbz/201109/W020120130460791166784.pdf.
   32: 338–358.                                                    MEP (2013). Environmental Laws, Published by the
Kenny, L.C., Merrifield, T.M., Mark, D., Gussman, R.A.               Chinese Ministry of Environmental Protection (MEP) of
   and Thorpe, A. (2004). The Development and Designation            the People’s Republic of China, Beijing, China, http://en
   Testing of a New USEPA-approved Fine Particle Inlet:              glish.mep.gov.cn/Policies_Regulations/laws/environmen
   A Study of the USEPA Designation Process. Aerosol                 tal_laws/ (accessed 3/13/2013).
   Sci. Technol. 38: 15–22.                                        MEP and AQISQ (2012). Ambient Air Quality Standards
Landsberger, S. and Creatchman, M. (1999). Elemental                 (GB 3095-2012), Chinese Ministry of Environmental
   Analysis of Airborne Particles, Gordon and Breach,                Protection (MEP) and General Administration of Quality
   Newark, NJ.                                                       Supervision, Inspection, and Quarantine (AQISQ) of the
Langrish, J.P., Li, X., Wang, S.F., Lee, M.M.V., Barnes,             People’s Republic of China, Beijing, China, http://kjs.
   G.D., Miller, M.R., Cassee, F.R., Boon, N.A., Donaldson,          mep.gov.cn/pv_obj_cache/pv_obj_id_A2091821758E1F
   K., Li, J., Li, L., Mills, N.L., Newby, D.E. and Jiang, L.X.      0CAD9E86D0D1A83F5E328B0400/filenameW020120
   (2012). Reducing Personal Exposure to Particulate Air             410330232398521.pdf.
   Pollution Improves Cardiovascular Health in Patients            Miller, F.J., Gardner, D.E., Graham, J.A., Lee, R.E., Wilson,
   with Coronary Heart Disease. Environ. Health Perspect.,           W.E. and Bachmann, J.D. (1979). Size Considerations
   120: 367–372.                                                     for Establishing a Standard for Inhalable Particulates. J.
Li, P.H, Han, B., Huo, J., Lu, B., Ding, X., Chen, Li., Kong,        Air Pollut. Contr. Assoc. 29: 610–615.
  S.F., Bai, Z.P. and Wang, B. (2012). Characterization,           NRC (2008). Energy Futures and Urban Air Pollution
  Meteorological Influences, and Source Identification of            Challenges for China and the United States, National
  Carbonaceous Aerosols during the Autumn-winter Period              Academies Press, Washington, DC.
  in Tianjin, China. Aerosol Air Qual. Res. 12: 283–294.           Owens, J.S. (1922). Suspended Impurity in the Air. Proc.
Lippmann, M. (1984). Human Respiratory Deposition of                 R. Soc. London, Ser. A 101: 18–37.
   Particles during Oronasal Breathing. Atmos. Environ.            Penkett, S.A., Jones, B.M.R., Brice, K.A. and Eggleton,
   18: 1038–1039.                                                    A.E.J. (1979). The Importance of Atmospheric Ozone
Liu, B.Y.H., Whitby, K.T. and Pui, D.Y.H. (1974). A                  and Hydrogen Peroxide in Oxidizing Sulfur Dioxide in
   Portable Electrical Analyzer for Size Distribution                Cloud and Rainwater. Atmos. Environ. 13: 123–137.
   Measurement of Submicron Aerosols. J. Air Pollut.               Perera, F., Tang, D.L., Whyatt, R., Lederman, S.A. and
   Contr. Assoc. 24: 1067–1072.                                      Jedrychowski, W. (2005). DNA Damage from Polycyclic
Lodge, J.P. (1984). Human Respiratory Deposition of                  Aromatic Hydrocarbons Measured by Benzo[a]pyrene-
   Particles during Oronasal Breathing. Atmos. Environ. 18:          DNA Adducts in Mothers and Newborns from Northern
   1040–1041.                                                        Manhattan, the World Trade Center Area, Poland, and
Louie, P.K.K., Chow, J.C., Chen, L.W.A., Watson, J.G.,               China. Cancer Epidemiol. Biomarkers Prev. 14: 709–714.
   Leung, G. and Sin, D. (2005a). PM2.5 Chemical                   Peters, T.M., Vanderpool, R.W. and Wiener, R.W. (2001).
Cao et al., Aerosol and Air Quality Research, 13: 1197–1211, 2013                          1209

  Design and Calibration of the EPA PM2.5 Well Impactor           Res. 112, doi: 10.1029/2006JD007991.
  Ninety-Six (WINS). Aerosol Sci. Technol. 34: 389–397.         Shen, Z.X., Cao, J.J., Arimoto, R., Han, Y.M., Zhu, C.S.,
Phalen, R.F., Cuddihy, R.G., Fisher, G.L., Moss, O.R.,            Tian, J. and Liu, S.X. (2010). Chemical Characteristics
  Schlessinger, R.B., Swift, D.L. and Yeh, H.C. (1991).           of Fine Particles (PM1) from Xi'an, China. Aerosol Sci.
  Main Features of the Proposed NCRP Respiratory Tract            Technol. 44: 461–472.
  Model. Radiat. Prot. Dosim. 38: 179–184.                      Shen, Z.X., Wang, X., Zhang, R.J., Ho, K.F., Cao, J.J. and
Pope, C.A., III and Dockery, D.W. (2006). Critical                Zhang, M.G. (2011). Chemical Composition of Water-
  Review: Health Effects of Fine Particulate Air Pollution:       soluble Ions and Carbonate Estimation in Spring Aerosol
  Lines that Connect. J. Air Waste Manage. Assoc. 56:             at a Semi-arid Site of Tongyu, China. Aerosol Air Qual.
  709–742.                                                        Res. 11: 360–386.
Ramazzini, B. (1703). De Morbis Artificum Diatriba (On the      Siddiqi, T.A. and Zhang, C.X. (1984). Ambient Air Quality
  Diseases of Tradesmen), Academie Typographum, Italy.            Standards in China. Environ. Manage. 8: 473–479.
Robson, C.D. and Foster, K.E. (1962). Evaluation of Air         Smith, R.A. (1852). On the Air and Rain of Manchester, In
  Particulate Sampling Equipment. AIHA J. 23: 404.                Memoirs of the Literary and Philosophical Society of
Rogers, C.F. and Watson, J.G. (1984). Potential Causes of         Manchester, Manchester Literary and Philosophical
  Elevated PM10 and PM15 Concentrations in the Inhalable          Society, p. 207–217.
  Particulate Network, Report Number EPA-450/4-84-              Song, Y., Tang, X.Y., Xie, S.D., Zhang, Y.H., Wei, Y.J.,
  016, U.S. Environmental Protection Agency, Research             Zhang, M.S., Zeng, L.M. and Lu, S.H. (2007). Source
  Triangle Park, NC, http://www.epa.gov/nscep/index.html.         Apportionment of PM2.5 in Beijing in 2004. J. Hazard.
Rostami, A.A. (2009). Computational Modeling of Aerosol           Mater. 146: 124–130.
  Deposition in Respiratory Tract: A Review. Inhalation         Spengler, J.D. and Thurston, G.D. (1983). Mass and
  Toxicol. 21: 262–290.                                           Elemental Composition of Fine and Coarse Particles in
Russell, W.J. (1885). On the Impurities of London Air,            Six U.S. Cities. J. Air Pollut. Contr. Assoc. 33: 1162–
  Royal Meteorological Office, London, England.                   1171.
SEPA (1986). Determination of the Concentration of              Spurny, K.R. (1998). Methods of Aerosol Measurement
  Airborne Particulate Matters (GB 6921-1986), Published          before the 1960s. Aerosol Sci. Technol. 29: 329–349.
  by the Chinese State Environmental Protection                 Sun, Y.L., Zhuang, G.S., Ying, W., Han, L.H., Guo, J.H.,
  Administration (SEPA), 10 October 1986, Beijing, China,         Mo, D., Zhang, W.J., Wang, Z.F. and Hao, Z.P. (2004).
  http://www.zjepb.gov.cn/UPLOAD/EPStandard/z280.pdf.             The Air-borne Particulate Pollution in Beijing -
SEPA (1988). Air Quality-Determination of Total Suspended         Concentration, Composition, Distribution and Sources.
  Particulates-Gravimetric Method (GB 9802-1988).                 Atmos. Environ. 38: 5991–6004.
  Published by the Chinese State Environmental Protection       Swift, D.L. and Proctor, D.F. (1982). Human Respiratory
  Administration (SEPA), 15 August 1988, Beijing, China,          Deposition of Particles during Oronasal Breathing.
  http://hbj.zj.gov.cn/UPLOAD/EPStandard/Z052.pdf.                Atmos. Environ. 16: 2279–2282.
SEPA (2005a). Manual Methods for Ambient Air Quality            Swift, D.L. and Proctor, D.F. (1984). Human Respiratory
  Monitoring (HJ/T194-2005), Published by the Chinese             Deposition of Particles during Oronasal Breathing -
  State Environmental Protection Administration (SEPA),           Reply. Atmos. Environ. 18: 1039–1040.
  09 November 2005, Beijing, China, www.zhb.gov.cn/             Tao, J., Cao, J.J., Zhang, R.J., Zhu, L.H., Zhang, T., Shi, S.
  image20010518/5531.pdf.                                         and Chan, C.Y. (2012). Reconstructed Light Extinction
SEPA (2005b). Automated Methods for Ambient Air                   Coefficients Using Chemical Compositions of PM2.5 in
  Quality Monitoring (HJ/T193-2005), Published by the             Winter in Urban Guangzhou, China. Adv. Atmos. Sci.,
  Chinese State Environmental Protection Administration           29: 359–368.
  (SEPA), 09 November 2005, Beijing, China, www.zhb.            U.S. EPA (1971). National Primary and Secondary Ambient
  gov.cn/image20010518/5523.pdf.                                  Air Quality Standards. Fed. Regist. 36: 8186.
SEPA (2007). Guidelines for Ambient Air Quality                 U.S. EPA (1982). Review of the National Ambient Air
  Monitoring, Published by the Chinese State Environmental        Quality Standards for Particulate Matter: Assessment of
  Protection Administration (SEPA), 19 January 2007,              Scientific and Technical Information. OAQPS Staff
  Beijing, China, http://www.zhb.gov.cn/info/gw/gg/2007           Paper, Report Number EPA-450/5-82-001, U.S. EPA,
  01/t20070125_100262.htm.                                        Office of Air Quality Planning and Standards, Research
SEPA and STSA (1996). Ambient Air Quality Standard                Triangle Park, NC.
  (GB 3095-1996), Published by the Chinese State                U.S. EPA (1986). Review of the National Ambient Air
  Environmental Protection Administration (SEPA) and              Quality Standards for Particulate Matter, Updated
  State Technology Supervision Administration (STSA),             Assessment of Scientific and Technical Information,
  18 January 1996, Beijing, China, http://www.es.org.cn/s         Addendum to the 1982 OAQPS Staff Paper, Report
  iteadmin/File/StdView.php?bzlistID=478.                         Number EPA 450/05 86-012, Strategies and Air Standards
Shen, Z.X., Cao, J.J., Arimoto, R., Zhang, R.J., Jie, D.M.,       Div., Ofc. of Air Quality Planning and Standards, US
  Liu, S.X. and Zhu, C.S. (2007). Chemical Composition            EPA, Research Triangle Park, NC.
  and Source Characterization of Spring Aerosol over            U.S. EPA (1987). 40 CFR Parts 51 and 52: Revisions to the
  Horqin Sand Land in Northeastern China. J. Geophys.             National Ambient Air Quality Standards for Particulate
You can also read