2018 Global Metals & Mining Conference - Daniel Fairclough - Member of the Group Management Committee - Head of IR Lisa Fortuna- IR Manager ...

Page created by Anita Sparks
 
CONTINUE READING
2018 Global Metals & Mining Conference - Daniel Fairclough - Member of the Group Management Committee - Head of IR Lisa Fortuna- IR Manager ...
2018 Global Metals & Mining Conference

Daniel Fairclough - Member of the Group Management Committee - Head of IR
Lisa Fortuna– IR Manager
                                                                            February 2018
2018 Global Metals & Mining Conference - Daniel Fairclough - Member of the Group Management Committee - Head of IR Lisa Fortuna- IR Manager ...
Disclaimer
Forward-Looking Statements
This document may contain forward-looking information and statements about ArcelorMittal and its subsidiaries.
These statements include financial projections and estimates and their underlying assumptions, statements
regarding plans, objectives and expectations with respect to future operations, products and services, and
statements regarding future performance. Forward-looking statements may be identified by the words “believe”,
“expect”, “anticipate”, “target” or similar expressions. Although ArcelorMittal’s management believes that the
expectations reflected in such forward-looking statements are reasonable, investors and holders of ArcelorMittal’s
securities are cautioned that forward-looking information and statements are subject to numerous risks and
uncertainties, many of which are difficult to predict and generally beyond the control of ArcelorMittal, that could cause
actual results and developments to differ materially and adversely from those expressed in, or implied or projected by,
the forward-looking information and statements. These risks and uncertainties include those discussed or identified
in the filings with the Luxembourg Stock Market Authority for the Financial Markets (Commission de Surveillance du
Secteur Financier) and the United States Securities and Exchange Commission (the “SEC”) made or to be made by
ArcelorMittal, including ArcelorMittal’s latest Annual Report on Form 20-F on file with the SEC. ArcelorMittal
undertakes no obligation to publicly update its forward-looking statements, whether as a result of new information,
future events, or otherwise.

                                                                                                                            1
2018 Global Metals & Mining Conference - Daniel Fairclough - Member of the Group Management Committee - Head of IR Lisa Fortuna- IR Manager ...
Positioned to deliver value
• Material improvement in results, reflecting strengthening market
  backdrop
• Transformed balance sheet, with continued deleveraging bias
• Unique global portfolio of competitive well-invested assets
• Industry leader in product and process innovation
• Action 2020 continues to structurally improve profitability
• Investing with focus and discipline
• Reinstating base dividend with intention to increase capital returns

            Capital allocation policy to maximise value for shareholders

                                                                           2
2018 Global Metals & Mining Conference - Daniel Fairclough - Member of the Group Management Committee - Head of IR Lisa Fortuna- IR Manager ...
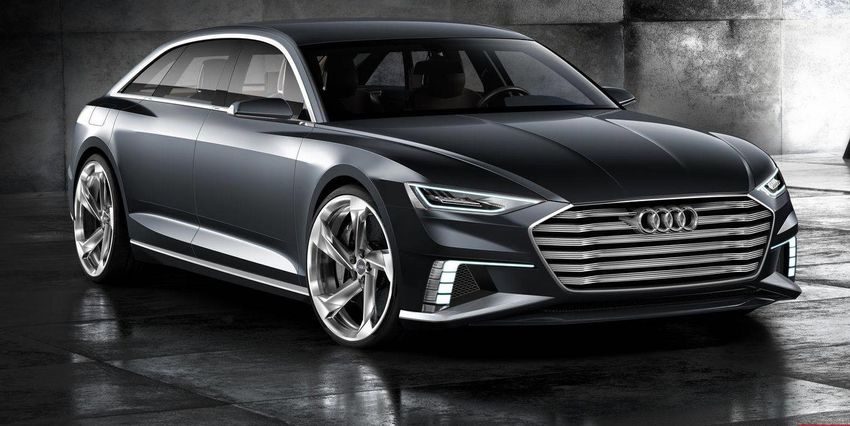
Safety is our priority
Health & Safety Lost time injury frequency (LTIF) rate*
Mining & steel, employees and contractors

                  3.1

                                  2.5

                                                 1.9
                                                                 1.8

                                                                                 1.4

                                                                                                1.0
                                                                                                               0.85            0.85    0.81   0.82   0.78

                2007            2008            2009           2010            2011            2012           2013            2014     2015   2016   2017

                                           Our goal is to be the safest Metals & Mining company
* LTIF = Lost time injury frequency defined as Lost Time Injuries per 1.000.000 worked hours; based on own personnel and contractors                        3
2018 Global Metals & Mining Conference - Daniel Fairclough - Member of the Group Management Committee - Head of IR Lisa Fortuna- IR Manager ...
Significantly improved results

     • EBITDA +34.4% YoY to $8.4bn

     • Steel shipments +1.6% YoY to 85.2Mt

     • Marketable iron ore shipments +6.1% YoY

     • Net income +156.7% YoY to $4.6bn

     • Working capital investment of $1.9bn reflecting stronger markets

     • Free cash flow* $1.7bn ($2.1bn excluding bond premia**)

     • Net debt down to $10.1bn (despite $0.7bn FX headwind)

                                                                       Significantly improved results
* Free cash flow refers to cash flow from operations less capex; ** includes one-time premium paid on early repayment of debt totalling $389m   4
2018 Global Metals & Mining Conference - Daniel Fairclough - Member of the Group Management Committee - Head of IR Lisa Fortuna- IR Manager ...
2017 operating performance highlights
                                                                       EBITDA 2014-2017 ($ billion)

                                                                                                           34.4%
Europe:                             NAFTA:
EBITDA +42.3% to $3.6bn             EBITDA -0.9% to $1.7bn
Shipments +1.7% to 40.9Mt           Shipments +2.6% to 21.8Mt
EBITDA per tonne +39.8% to $87/t    EBITDA per tonne -3.4% to $78/t
                                                                              7.2                                  8.4
                                                                                        5.2         6.3
BRAZIL:                             ACIS:
EBITDA +13.5% to $1.0bn             EBITDA +51.4% to $1.0bn
Shipments +0.8% to 10.8Mt           Shipments -1.3% to 13.1Mt             FY14         FY15         FY16         FY17
EBITDA per tonne +12.6% to $91/t    EBITDA per tonne +53.4% to $78/t
                                                                       2016 to 2017 EBITDA by segment ($ billion)
Mining:                                                                                                    0.6     8.4
EBITDA +84.7% to $1.4bn
Market-priced iron ore shipments +6.1% to 35.7Mt
FCF breakeven level remains at $40/t CFR China 62% Fe                                         1.1   0.1

                                                                                      0.3
                                                                        6.3
                                                                                0.0
                                                                       FY16 NAFTA ACIS Europe Brazil Mining FY17

           EBITDA impacted by improved ASP, steel volumes and Mining profitability
                                                                                                                         5
2018 Global Metals & Mining Conference - Daniel Fairclough - Member of the Group Management Committee - Head of IR Lisa Fortuna- IR Manager ...
Delivering on Action 2020
                                            •   Europe: Transformation progressing well 
• Action 2020 impacted 2017                     savings in procurement/ productivity on track.
  EBITDA by $0.6bn
                                                 •   More integrated centrally co-ordinated
• Volume improvements of $0.3bn                      approach, further reducing costs
  and cost/mix $0.3bn                            •   Enhanced use of digitalisation in the
                                                     manufacturing process, supply chain and
  Action 2020 cumulative EBITDA progress             commercialisation
  (2016-2020 Target) ($billion)             •   NAFTA: Asset optimisation complete; savings from
                                  3.0           No 2 steel shop idling; headcount rationalisation;
                                                Calvert utilisation increasing to 88%
                                            •   Brazil: HAV mix improvement
               1.5
                                            •   ACIS: Kazakhstan record steel production; Ukraine
      0.9                                       savings from new coke oven battery No.6
                                            •   Mining: Remained focussed on service, quality and
                                                asset reliability. FCF breakeven level of $40/t China
     2016     2017               2020           CFR 62% Fe
                                Target

                     Action 2020 driving structural EBITDA improvement

                                                                                                     6
2018 Global Metals & Mining Conference - Daniel Fairclough - Member of the Group Management Committee - Head of IR Lisa Fortuna- IR Manager ...
Continuous innovation
                                                   Jet Vapor Deposition (JVD) line : Jetgal ®                                                   Steel remains material of choice
                                                   • JVD line is a breakthrough technology to
                                                     produce Jetgal®, a new coating for AHSS steels
                                                     for automotive industry

                                                   New press hardenable steels (PHS) Usibor®2000 &
                                                   Ductibor®1000
                                                   • Bring immediate possibilities of 10% weight
                                                     saving on average compared to conventional
                                                     coated PHS produced by ArcelorMittal

                                                   3rd Generation AHSS products
                                                   CR980HF & CR1180HF                                                                               •    Electric vehicles (EV) to favour lightweight
                                                   • HF / Fortiform® provide additional weight
                                                     reduction due to enhanced mechanical properties
                                                                                                                                                         designs (similar to traditional vehicles)
                                                     compared to conventional AHSS                                                                  •    EV employ AHSS to achieve range goals

                                                   Electrical steels                                                                                The mass-market Tesla Model 3 body and
                                                   iCARe®, 2nd Generation                                                                           chassis is a blend of steel and aluminium,
                                                   • Family of electrical steels for electrified powertrain                                         unlike the Tesla Model S which is an aluminium
                                                     optimization and enhanced machine performance,                                                 body (Source: Tesla website+)
                                                     Save*, Torque** and Speed*** are specifically
                                                                                                                                               + https://www.tesla.com/compare
                                                     designed for a typical electric automotive
                                                                                                                                                http://automotive.arcelormittal.com/ElectricVehiclesImpactOnSteel
                                                     application.

                                                            Steel to remain material of choice for automotive
                                                                                                                                                -
* Save (Steels with very low losses): Ideal for the efficiency of the electrical machine. Their key role is maximize the use of the current coming from the battery.
 ** Torque (Steels with high permeability): They achieve the highest levels of mechanical power output for a motor or current supply for a generator
 *** Speed (Steels for high speed rotors): Specific high strength electrical steels which maintain high level of magnetic performance. They allow the machine to be more compact and have a higher power density.   7
2018 Global Metals & Mining Conference - Daniel Fairclough - Member of the Group Management Committee - Head of IR Lisa Fortuna- IR Manager ...
Business outlook remains favourable
      ArcelorMittal Global PMI*                                            ArcelorMittal demand forecasts 2018
       57

       55
                                                                                                +1.5% to +2.5%
                                                                                    US
       53

       51                                                                                     +1.0% to +2.0%
                                                                                 EU28
       49

       47                                                                        China    -0.5% to +0.5%
       45

       43                                                                        Brazil                                +6.5% to +7.5%

       41
                                                                                   CIS            +2.0% to +3.0%
       39

       37                         (latest data point: Jan-2018, 56.0)
                                                                        Global Ex China               +3.0% to +4.0%
       35

                                                                                Global         +1.5% to +2.5%

  Strong global economic fundamentals support further expected steel demand expansion in 2018
* ArcelorMittal estimates

                                                                                                                                   8
2018 Global Metals & Mining Conference - Daniel Fairclough - Member of the Group Management Committee - Head of IR Lisa Fortuna- IR Manager ...
Transformed balance sheet
     Net Debt ($bn)
                                                      -53%                                                      • Net debt lowest since merger
                   21.8
                                 16.1           15.8           15.7
                                                                             11.1           10.1
                                                                                                                • Investment grade rated (S&P)

                                                                                                                • Interest costs declined by
                  2012           2013          2014           2015          2016           2017
                                                                                                                  ~56% since 2012
     Debt adjusted FCF ($bn)                                              FCF*
                                                                          Debt Adjusted FCF**
                                                                                                                • Maximising ability to translate
        3.0                                                                                                       EBITDA to FCF
        2.0

        1.0
        0.0
                                                                                                                   $3bn cumulative FCF since 2012 increases to $8bn
       -1.0                                                                                                        adjusting for 2018F cash interest expense
                  2012           2013          2014           2015          2016           2017

                                                Maintain investment grade rating (through the cycle)
* Free cash flow refers to cash flow from operations less capex; ** Debt adjusted FCF refers to historical FCF adjusted to reflect 2018 forecast interest expense of $0.6bn
                                                                                                                                                                              9
Disciplined capital allocation
                                                                   • Targeting $6bn net financial debt (NFD)

                                                                                                                              Building the strongest platform for consistent
                                                                   ➢ Positive FCF* in all market environments**
          Robust balance sheet                                     ➢ Investment grade metrics secure through the cycle

                                                                                                                                     capital returns to shareholders
                                                                   ➢ Lower cost balance sheet  Maximise FCF potential
                                                                   ➢ Position of strength to return capital to shareholders

                                                                   • Investing in opportunities with focus and discipline
                     Invest in strengths                           ➢ To grow EBITDA and enhance future returns
                                                                          Grow FCF potential of the business

                                  Returns to                       • Reinitiating base dividend at $0.10/share
                                 shareholders                      • Capital returns to shareholders will increase to a
                                                                     portion of FCF once NFD target achieved

                                         Deleveraging bias to continue until net debt target achieved
* Free cash flow refers to cash flow from operations less capex ** Refers to the post merger period
                                                                                                                                                                               10
Focused investment
Capex in 2018 ($ billion)                               • Italy: Restore ILVA as leading Italian steel
                                                          supplier
  Primarily steel projects focusing on
downstream optimisation in Europe and
                                                          •   Underperforming asset requiring turnaround
      HAV in Canada & Europe
                                                          •   Expanded product range with new HAV steel
                                          0.1    3.8          grades
                                    0.3                   •   Synergies €310m of which €50m to benefit
                                                              ArcelorMittal’s existing operations
                                                          •   2018 investment of ~$300m for environmental
                          0.5
                                                              capex (full year basis)
                                                          •   Subject to regulatory approvals

                                                        • Mexico: $1.0bn three-year investment for
               0.1
                                                          construction of a new 2.5Mt HSM
    2.8
                                                          •   High value return project  improved HAV mix
   FY17       2017      ILVA & Various Forex    FY18F     •   Capex investment of ~$350m in 2018 commenced
              carry     Mexico strategic
              over             projects                   •   Increase capability to serve domestic Mexican
                                                              industry
            Capitalising on high-return opportunities; Capex increasing to $3.8bn in 2018

                                                                                                              11
Positioned to deliver value

Strategy delivering       • ~50% of Action 2020 delivered

   Transformed            • Net debt / EBITDA down to 1.2x
  balance sheet           • Deleveraging to continue                            Building the
                          • Ex-China demand growth expected to
                                                                                 strongest
 Industry outlook           continue                                          foundations for
    improving                                                                   sustainable
                          • Global capacity utilization improving
                                                                               value creation
Investing with focus
                          • Leveraging strengths to grow returns
    & discipline

  Commitment to
  return cash to          • Dividends restarted
   shareholders

                    Capital allocation policy to maximise value for shareholders

                                                                                                12
Section 1

APPENDIX
Sustainable development - key to our resilience
• Embedding 10 sustainable development (SD) outcomes into the business gives us long term view
  of risks and opportunities.

• We intend to publish our third step towards integrated reporting in April 2018 – an integrated
  assessment of sustainable development within the ArcelorMittal group business in the short,
  medium and long term

• Customers increasingly expect us to support their sustainability ambitions. We have made good
  progress in 2017 with multiple stakeholders towards a comprehensive third-party certification
  system (ResponsibleSteel™) to reassure steel customers of social and environmental standards
  in their supply chains. We are preparing a number of European sites to comply.

• We are assessed and included in a number of sustainability leadership indices:

                         Leadership in our response to long term trends
                                                                                                   14
Key trade case update: EU & US
Europe Flat, Long and Tubes                                                                              US Flat Rolled
Prod         Exporter             Status                                      Timeline                   Prod   Exporter       Status                                                    Timeline

CRC          AD                   • Definitive measures and retroactive       • Measures in place        Core   AD/CVD         • DOC final determination:                                Measures in
             China                  implementation were voted in favour         for the next 5 years            China            ─ CVD: China: 39.05 – 241.07%, India: 8% - 29.46%;      place for the
             Russia                 on July 7: China: 19.8% to 22.1%,                                           India               Italy: 0.07 – 38.15%; Korea: 0.72-1.19%; Taiwan –    next 5 years
                                    Russia: 18.1% to 35.9%                                                      Italy               de minimus (no duty imposed)
                                                                                                                Korea            ─ AD: China 209.97%; India 3.05-4.44%; Italy 12.63-
                                                                                                                Taiwan              92.12%; Korea 8.75-47.8.5%; Taiwan: 3.77%
                                                                                                                               • ITC voted affirmative on all countries – orders
                                                                                                                                 issued
HRC          AD                   • AD Provisional measures published
             China                  on Oct 17 - duties from 13.2% to                                     CRC    AD/CVD         • DOC final determinations:                               Measures in
                                    22.6%                                                                       Brazil           ─ CVD: Brazil: 11.09%-11.31%; China: 256.44%;           place for the
                                  • AD final measures voted in favour on                                        China                India: 10%; Korea: 3.91%-58.36%                     next 5 years
                                    the10th of Feb 2017 – duties from                                           India            ─ AD: Brazil:14.35%-35.43%; China: 265.79%; India:
                                    18.1% to 36.6%                                                              Korea                7.6%; Japan: 71.35%; Korea: 6.32%-34.33%; UK:
                                                                                                                                     5.4%-25.56%
                                                                                                                AD only        • ITC voted affirmative on Brazil, China, India, Korea,
                                                                                                                Japan            Japan and UK – orders issued
             CVD                  • CVD China final measures approved 9th                                       UK             • ITC voted negative on Russia AD and CVD - no orders
             China                  June 2017                                                                                    will be issued

                                                                                                         HRC    AD/CVD         • DOC final determination:                                Measures in
                                                                                                                Korea            ─ CVD: Brazil: 11.09%-11.30%; Korea: 3.89%-             place for the
             AD
             Iran, Ukraine,       • AD (5 Cs) Investigation started July 7,                                     Brazil               57.04%                                              next 5 years
             Russia & Brazil        2016; the European Commission                                                                ─ AD: Australia: 29.37%, Brazil: 33.14%- 34.28%,
                                    announced in Oct‘17 fixed AD duties on                                      AD only
                                                                                                                Australia            Japan: 4.99%-7.51%, Korea: 3.89%-9.49%,
                                    imports of HRC (duties from €17.6/t to                                                           Netherlands: 3.73%, Turkey: 3.66%-7.15%, UK:
                                    €96.5/t) from Brazil, Iran, Ukraine and                                     Japan
                                                                                                                Netherlands          33.06%
                                    Russia (Serbia excluded)
                                                                                                                Turkey         • ITC voted affirmative on all AD and Korea and Brazil
                                                                                                                UK               CVD – orders issued; the ITC voted negative on Turkey
                                                                                                                                 CVD – no order issued
CRS          AD                   • Initiation of investigation in December
(HDG – non   China                  2016; final duties against China                                     QP     AD/ CVD        • DOC final determinations for cooperating countries:     Measures in
auto)                               announced Dec’17 (duties from 17.2%                                         China                                                                    place for the
                                                                                                                                 ─ CVD: China: 210.50%; Korea 4.31%
                                    to 27.9%)                                                                   Korea                                                                    next 5 years
                                                                                                                                 ─ AD: Austria: 53.72%, Belgium: 5.40%-51.78%,
                                                                                                                AD                   Brazil: 74.52%, China: 68.27%, France: 8.62%-
QP           AD                   • AD Provisional measures published                                           Austria              148.02%, Germany: 5.38%-22.90%, Italy: 6.08%-
             China                  on Oct 17 - duties from 65% to 74%                                          Belgium              22.19%, Japan: 14.79%-48.67%, Korea: 7.39%,
                                  • AD final measures voted in favour on                                        Brazil               South Africa: 87.72%- 94.14%, Taiwan 3.62%-
                                    the 10 Feb 2017 – same level as                                             France               6.95%, Turkey: 42.02%-50%
                                    provisional measures                                                        Germany        • ITC voted affirmative on all countries
                                                                                                                Italy          • Brazil, S. Africa and Turkey orders issued 26 Jan‘17;
             ─ Timelines provided are defined based on regulation maximum limits                                Japan            China order issued 20 Mar’17; all others issued May
Notes:       ─ Provisional AD duties vs Rebar LF from Belarus published 19 Dec at 12.5%                         South Africa     26
             ─ Provisional AD duties vs Seamless tubes (large diameter) from China published 11 th Nov          Turkey
               from 45.4% to 81.1%                                                                              Taiwan                                                                            15
Trade cases: Ongoing focus
          •   Anti-Dumping (AD) and Anti Subsidy (AS) duties are in place on all four flat product
              categories: CORE, CRC, HRC, and plate from key importing countries  measures in
              place for five years from determination
          •   Anti-circumvention investigations initiated by the Department of Commerce (DOC)
              for CRC and CORE imports from China (through Vietnam). DOC affirmative preliminary
   US         determination announced Dec 6, 2017. Importers will be required to post cash deposits for
              potential AD/CVD duties. Final determination expected April 25, 2018
          •   Section 232: April 2017 - initiation of a national security investigation with respect to
              steel imports:
          •   DOC report sent to Trump administration on January 11, 2018 and on February 16, 2018,
              Secretary Ross announced the following recommended alternative remedies to address the
              problem of steel imports:
              o   A global tariff of at least 24% on all steel imports from all countries, or
              o   A tariff of at least 53% on all steel imports from 12 countries (Brazil, China, Costa Rica,
                  Egypt, India, Malaysia, Republic of Korea, Russia, South Africa, Thailand, Turkey and
                  Vietnam) with a quota by product on steel imports from all other countries equal to
                  100% of their 2017 exports to the United States, or
              o   A quota on all steel products from all countries equal to 63% of each country’s 2017
                  exports to the United States.
          •   Each of these remedies is intended to increase domestic steel production from its present
              73% of capacity to approximately an 80% operating rate
          •   Trump has until April 11, 2018 to decide what action to take, if any
                                                                                                           16
Trade cases: Ongoing focus
           •   Final AD duties on CRC imports from China & Russia
           •   Final AD duties on HRC and QP imports from China  approved on Feb 10, 2017 by
               the EU council
Europe     •   AS AD on HRC imports from China  Approved by the EU Council June 9, 2017,
               (duties aligned under the Lesser duty rule with the AD duties to final level from 18.1% to
               35.9%)
           •   AD on HRC imports from four additional countries – the European Commission
               announced in Oct‘17 fixed AD duties on imports of HRC (duties from €17.6/t to €96.5/t)
               from Brazil, Iran, Ukraine and Russia (Serbia excluded)
           •   AD investigation started in December 2016 on imports from China of Corrosion
               resistant steel (HDG non-auto) – final duties against China announced Dec’17 (duties
               from 17.2% to 27.9%)

                                                                                                       17
Action 2020 Progress;$1.5bn achieved to date, half
way to $3.0bn target
   Business                              Drivers                                              2016 progress                                                            2017 progress

                           - Ramp-up of Calvert                                                                                                  Indiana Harbor footprint optimization completed:
                           improved value added mix                       US footprint optimization underway*                                    Headcount rationalization and efficiencies     ✓
  AMERICAS                 - US footprint optimization                    Calvert utilisation rate 79%
                                                                          Portfolio optimized (Sale of LaPlace and
                                                                                                                                                                                                ✓
                                                                                                                                                 following closure of its 84” HSM, idling of No.2
                                                                                                                                                 steel shop, benefits of new caster No.3 steel shop.
                           - Brazil value plan
                                                                          Vinton, closure of Point Lisas)                                                                                       ✓
                                                                                                                                                 Calvert ramp up: cap. utilization (+10% YoY***).

                                                                                                                                                 Integrated centrally coordinated approach,
                                                                          Procurement, reliability & productivity                                reducing costs                                ✓
                                                                          savings on track                                                       Digitalization in the manufacturing process,
    EUROPE                - Transformation program                        Centralisation of key processes underway                               supply chain & commercialization.             ✓
                                                                          Portfolio optimized (closure Zumarraga,                                Volume gains & improved mix with higher HSM
                                                                          partial shut down Sestao & Zaragoza sale)                              production offset lower volumes (longs)       ✓
                          - New coke battery and
                            PCI usage in CIS
                                                                          Capturing benefits of currency devaluation
                                                                          and good operational performance in CIS
                                                                                                                                                 Ukraine: Construction of new coke oven
                                                                                                                                                 battery #6 & PCI/energy savings
                                                                                                                                                                                               ✓
       ACIS               - New iron ore supply                           Quarterly production records achieved in
                            agreement and tariffs in                      the CIS (Combined Ukraine & Kazakhstan                                 Record production in Kazakhstan offset by
                            South Africa                                  production up +6.7% YoY**)                                             lower shipment volumes in Ukraine             ✓

     MINING
                          - 10% reduction in average
                                                                         10% YoY** reduction achieved
                                                                                                                                                 Cash breakeven level - $40/t CFR China         ✓
                            unit iron ore cash costs                                                                                             62% Fe maintained

                             Volume growth remains a key driver for outstanding Action 2020 gains
 * #1 alum. line, 84” hot strip mill, and #5 continuous galv. line idled; new caster at No.3 steel shop complete and running; ** YoY refers to FY’16 v FY’15 *** refers to FY’17 v FY’16         18
Section 2

FINANCIALS
Cash needs of the business
      Cash needs of business ($ billion)
                                                                                5.6

                                                                                1.2                     • Cash needs* to rise in 2018:
                                                        4.4
Taxes**, pension and other                              0.8                     0.6                           – Increase of $1.2bn vs. 2017 reflects

                          Net interest                  0.8                                                         a) higher CAPEX (increase from $2.8bn to
                                                                                                                            $3.8bn largely reflecting Mexico project
                                                                                3.8                                         and anticipated ILVA capex)
                                   Capex                2.8
                                                                                                                    b) expected increases in cash taxes primarily
                                                                                                                            on account of timing impacts
                                                      2017                   2018F

      • Working capital requirements to be driven by market conditions

                                ArcelorMittal remains focussed on controlling its cash requirements
* Cash needs of the business defined as: capex, net interest, cash taxes, pensions and other cash costs but excluding working capital investment
** Estimates for cash taxes in 2018 largely reflect the taxable profits of 2017
                                                                                                                                                                       20
Liquidity and debt maturity profile
 Liquidity at Dec 31, 2017 ($ billion)                                            Debt maturities at Dec 31, 2017 ($ billion)
                                  8.3
                                                                                        Other loans               Commercial paper                   Bonds

                    Cash          2.8                                                                                                                                              0.5

                                                                                        0.8
                                                                                                                                 0.2
                                                                                                                                                     0.4                   0.2
                                                                                        1.1                                                                                        2.8
Unused credit lines               5.5
                                                                                                            0.3                  1.9
                                                                                                                                                     1.4                   1.5
                                                                                        0.9                 0.9

                            Liquidity at                                              2018*                2019                2020                 2021                   2022   >2023
                           Dec 31, 2017
 Liquidity lines:                                                                  Debt maturity:                                                    Ratings:
 • $5.5bn lines of credit refinanced and                                          • Continued strong liquidity                                       • S&P**: BBB-, stable outlook
   extended in Dec 2016; two tranches:                                            • Average debt maturity  4.6 Yrs                                  • Moody’s: Ba1, positive outlook
      • $2.3bn matures Dec 2019                                                                                                                      • Fitch: BB+, positive outlook
      • $3.2bn matures Dec 2021

                                                             Investment grade credit rating achieved
 The 2018 maturities in “other loans” include an additional $298 million of a borrowing base facility in South Africa, which matures in 2020, ** S&P upgrade on 1 Feb’18
                                                                                                                                                                                          21
Balance sheet structurally improved
Net debt* ($ billion)                                                                                         Average debt maturity (Years)
                                    -22.4
                      32.5                                                                                                                                          4.6

                                                                                                                                         2.6

                                                    10.1

                   3Q 2008                      4Q 2017                                                                              3Q 2008                    4Q 2017

Liquidity** ($ billion)                                                                                       Bank debt as component of total debt (%)

                         12.0                                                                                                           75%

                                                    8.3

                                                                                                                                                                   10%

                     3Q 2008                    4Q 2017                                                                              3Q 2008                    4Q 2017

                                                                Balance sheet fundamentals improved
 * Net debt refers to long-term debt, plus short term debt, less cash and cash equivalents, restricted cash and short-term investments (including those held as part of asset/liabilities held for sale);   22
** Liquidity is defined cash and cash equivalents plus available credit lines excluding back-up lines for commercial paper program
EBITDA to free cash flow
2017 EBITDA to free cash flow analysis ($ million)

                                                                                          Includes $0.4bn
                                                                                           bond premium
                                              (1,873)

                                                                            (1,972)

                8,408

                                                                                                                                 (2,819)
                                                                                                           4,563

                                                                                                                                               1,744

              EBITDA                       Change in                  Net financial cost,           Cash flow from               Capex     Free cash flow
                                            working                    tax and others                operations
                                            capital*

                                                                  Strong free cashflow generation
* Change in working capital: cash movement in trade accounts receivable plus inventories less trade and other accounts payable                              23
Net debt analysis
 Dec 31, 2016 to Dec 31 2017 ($ million)
                                                                                                                                                                                        Forex of $715m: Mainly
                                                                                                                                                                                      driven by USD depreciation
                                                                                                                                                                                         against the Eur 13.8%

                                                      (1,744)

                                                                                                                                                                         758

                 11,059                                                                        (72)                                 141

                                                                                                                                                                                                            10,142
                                                                                                                                      Mainly dividends paid
                                                                                                                                     to Posco (AMMC) and
                                                                                                                                             Bekaert

           Net debt at                         Free cash flow                               M&A *                              Dividend                      Forex and other                           Net debt at
          Dec 31, 2016                                                                                                                                                                                Dec 31, 2017

                            Net debt reduction driven by positive free cash flow offset in part by forex
*On August 7, 2017 ArcelorMittal USA and Cliffs Natural Resources (“Cliffs”) agreed that Cliffs would acquire ArcelorMittal USA’s 21% ownership interest in the Empire Iron Mining Partnership for $133m plus assumptions of all   24
partnership liabilities. The payment of the $133m will be in 3 equal instalments with the 1st payment in August 2017 ($44m), with the 2 subsequent payments to be received in August 2018 and 2019.
Section 3

ILVA
New ILVA – a tier 1 steel asset
    • ILVA is the perfect opportunity for
                                                                                                                                                                              97Mt
      ArcelorMittal                                                                          Novi Ligure: Cold rolling mill to serve end-users
                                                                                                                                                                       Total European Flat
                                                                                                                                                                      Steel demand in 2015
                                                                                                 customers (e.g. packaging, white goods)
        – Italy is the 2nd largest steel consuming
          country in Europe (Mt)
        – Large scale, underperforming asset
          requiring turnaround
        – Significant cost improvement potential
          and synergies identified
        – Opportunity to leverage AM strengths in
                                                                                                                                                                             Taranto
          R&D and product leadership and service
        – Ilva will be re-established as a tier one                                                                                                Taranto: Integrated plant for production and sale
                                                                                                   Genova: Cold rolling, hot dip galvanising and
          supplier to European & Italian customers                                                             tin plate capacities
                                                                                                                                                          of HRC, plates, pipes and tubes

    • Minimal balance sheet impact, EBITDA
      accretive in Year 1
    • Next step is regulatory approvals; European
      Commission initiated a Phase II review on 8
      Nov’17; regulatory approval expected
      conclusion April 2018
                             ILVA is a strong fit within ArcelorMittal’s existing business & strategy
SOURCE: World Steel, Steel Statistical Yearbook 2015; Notes: *Iberia defined as Spain + Portugal                                                                                                26
Our vision for ILVA
               ILVA Today                                        ILVA’s Future
                                                  • Become a world-class player in terms
• Significant environmental issues –                of competitiveness, sustainability,
  need to bring ILVA up to and beyond EU            environmental performance, value-add
  environmental standards
                                                  • Leading presence in Italy, adding
• Industrial challenge: investment and              value to the Italian industrial fabric
  expertise to improve operational
  performance of ILVA’s assets                    • A company recognised for
                                                    environmental performance
• Poor financial performance: material              excellence: emissions to be reduced to
  decline in revenue since 2011, loss-              best practice levels, in line with and
  making for the past 4 years                       beyond European environmental
• Low share of high-value added steels              standards and legislation
  in the portfolio of ILVA                        • A sustainably profitable company:
• Need to rebuild client confidence:                one that creates value for all
  product quality, innovation, supply chain         stakeholders, and the Italian economy

                  A clear vision of long-term, sustainable success for ILVA
                                                                                             27
Investment plan to revitalise ILVA
CAPEX commitments through 2024 (€bn)

                                                                       •   €1.15bn environmental investment
                                                                           plan to materially improve
                                                0.3                        performance, including:
                                                                           –   €0.3bn stock pile coverage
                    1.15                                                   –   €0.2bn investment at coke ovens
                                                                           –   €0.2bn in waste water treatment
                                                                           –   €0.3bn environmental remediation
                                                              2.1              (clean-up) which will be financed with
                                   2.4
                                                                               funds seized from the Riva Group

                                                                       •   €1.25bn industrial investment plan to
    1.25                                                                   rapidly restore and improve:
                                                                           –   ‘catch-up’ capex for delayed
                                                                               maintenance
                                                                           –   capex program for blast furnaces
   Industrial   Environmental   Total CAPEX   Riva Funds   Net CAPEX           and steel plants
  2018 - 2024    2018 - 2023    2018 - 2024     utilised
                                                                           –   includes full €0.2bn re-vamping of
                                                                               BF#5

                           Commitment to invest €2.4 billion over the next 7 years
                                                                                                                        28
Industrial plan to restore ILVA’s market
position
                                                                                                Restart
                                                                                                  BF#5
                                                                                               alongside,
             Operating BF#1, BF#2, BF#4 supplemented by imported slabs/coils                  BF#1, BF#4

                                                                                                     9.5
                                             8.5
                                                                                               8.0

              6.0        6.0           6.0            6.0        6.0           6.0

               2018       2019           2020          2021       2022           2023            2024
              2018       2019           2020          2021       2022           2023            2024
                        Production (Mt crude steel)           Shipments (Mt finished steel)

    Crude steel production is limited to 6Mt until environmental capex plan completed
                                                                                                            29
ILVA impact on ArcelorMittal financials

• Acquisition will “complete” following receipt of EU Merger Regulation approval;
  European Commission initiated a Phase II review on 8 November 2017 with
  expected conclusion in April 2018
• Following completion ArcelorMittal will fully consolidate ILVA

• Purchase price of €1.8bn, will be recognized on the BS as a payable, reduced by
  the quarterly instalments of €45mn that will flow through investing activities in CF
• New ILVA will be transferred with circa €1bn of net working capital and free of long
  term liabilities and financial debt
• New ILVA will be transferred to ArcelorMittal with a re-calibrated labor force

• ArcelorMittal will immediately commence the environmental capex plan and other
  investments
• ILVA is expected to be accretive to ArcelorMittal EBITDA in Year 1 and
  accretive to ArcelorMittal cash flow in Year 3 (based on 2016 steel spreads)
               On completion ILVA will be fully consolidated by ArcelorMittal
                                                                                         30
Section 4

STEEL INVESTMENTS
Investments completed in 2017
Furthering our downstream capabilities for
automotive and industrial applications

 • Calvert: Phase 2: Slab yard expansion Bay 5 
   Increase coil production from 4.6mt/pa to                        Calvert: Slab Yard bay 5
   5.3mt/pa (completed 2Q’17)

 • Dofasco: increased shipments of galvanized
   sheets by ~130ktpy, along with improved mix
   and optimized cost (completed 2Q’17)
                                                                    Dofasco galvanizing line
 • Poland: Investment in the downstream
   operations:
   ➢ Increase of the HSM mill capacity by 0.9Mtpa
      (completed 2Q’17)
    ➢ Increasing the HDG capacity by 0.4Mtpa
      (completed 2Q’17)
                                                                            HDG2 Krakow

                    Continuous shift towards higher added value products
                                                                                               32
Europe: UHSS Automotive Program
Upgrade of capabilities to produce new steels
 Fortiform® grades offer a 20% weight saving on identified application
 Commercial benefits of additional ~400kt UHSS (Ultra High Strength Steel)
The project is executed in several sub projects in Gent cluster (Liège and Gent plants):
Gent:
• Upgrade of Gent HSM completed end 2016
• Erection of new furnace for Gent HDG expected completion in 1Q’18
Liège:
• 1st step of annealing line transformation (cooling zone) - completed 3Q’15
• JVD 1st trial coils were produced in 3Q’16
• Second step of annealing line transformation - completed 1Q’17
• Remaining process optimizations & modifications on CAL expected completion in 1Q’18

           Top rolls of new direct flaming      New stand F1 in front of line –     Cooling water plant -
                          furnace - Liege                          Gent HSM                        Gent

                               Investments to enhance UHSS capabilities
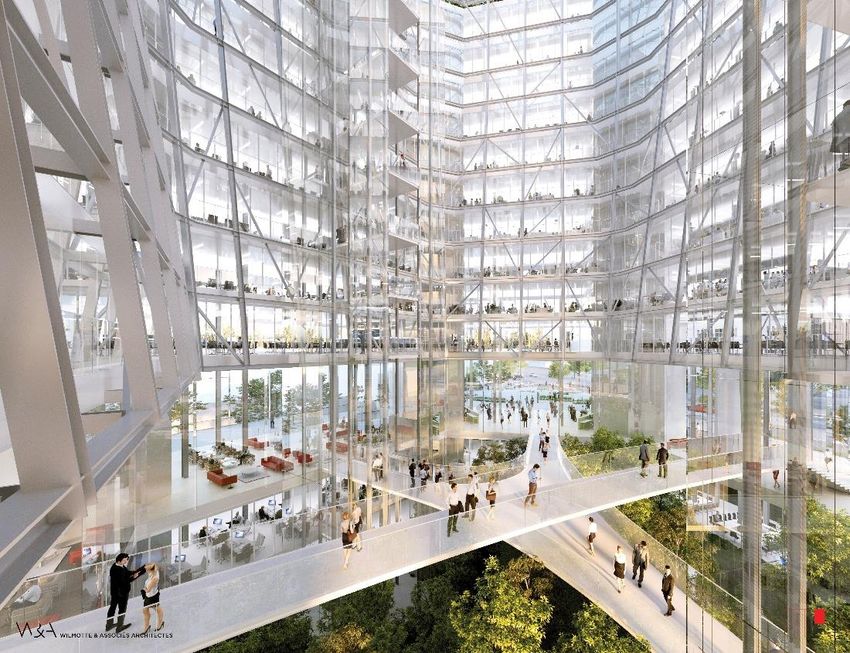
                                                                                                      33
ArcelorMittal Differdange: Investing in Grey mill:
Modernization of rolling mill
•   ArcelorMittal Differdange Grey Mill (Luxembourg) ranks among the
    leader for heavy and jumbo beams.
•   It produces a unique portfolio of heavy sections. Contribute to some
    of the most prestigious landmarks over the world (ie. Manhattan
    skyline in New York)
•   Aim to supply the most advanced structural steel products and
    solutions for construction and high rise buildings
•   We are installing the largest straightener in the world for sections in
    Luxembourg

                                                                                                                                             Freedom Tower-
•   Investment features:                                                                                                                     New York
    – new cooling bed; new cold saw; new gag press                                                                      No. 3SP: New #2 Caster
•   Customer benefits:
                     Indiana Harbor Plant
    – improved service   in terms of lead time and reliability
    – highest quality for the most demanding grades & largest
      sizes thanks to improved straightness and surface
      quality
•   Expected completion in 1Q 2018

                                                                           Roller straightener in pre-assembly stage
                                                                      One Bank street construction: October 2017, U.K   One Bank street after completion in 2018

                              Improving and growing high added value products
                                                                                                                                                                   34
Kryvyi Rih - New LF&CC 2&3
•   Facilities upgrade to switch from ingot to continuous casting route; additional billets capacity of
    290kt/y
    • Industrial target: Step-by-step steel plant modernization with state-of-art technology:
       – Product mix development
    • Supportive target:
       – Cost reduction
       – Billet quality improvement for sustaining customers
       – Better yield and productivity
•   Project completion expected in 4Q’18
                                                                       AM Kryvyi Rih LF&CC 1

                                                          Site
                                                     preparation for
                                                      LF&CC 2&3

                                Entry section o Continuous Annealing Line

             Kryvyi Rih investments to ensure sustainability & improve productivity
                                                                                                          35
Indiana Harbor - USA Footprint
Indiana Harbor “footprint optimization project”:
• Current configuration uncompetitive  structural changes
  required across all cost elements
• #1 aluminize, 84” hot strip mill (HSM), #5 continuous galvanizing
  line (CGL), and steel shop No.2 now idled; all planned asset
  consolidation now complete
• Planned investments totalling ~US$200m:
  − New caster at No.3 steelshop installed & commissioned 4Q’16
  − Restoration of 80” hot strip mill and IH finishing, and logistics
      ongoing
  − Project completion expected in 2018                                              No. 3SP: New #2 Caster

               Indiana Harbor Plant     80”HSM: 5 Walking Beam Furnace   No. 3SP: New  #2 Caster
                                                                                   No. 3SP: New commissioning
                                                                                                 Downcomer

     ArcelorMittal USA progressing with a “footprint optimization project” at Indiana Harbor
                                                                                                         36
ArcelorMittal Poland Sosnowiec - Wire Rod Mill
modernization
•   Sosnowiec is a double strand rolling mill located in
    Sosnowiec, Poland.
•   The investment will introduce new and innovative
    techniques for the production of high quality wire rod for high
    demanding applications (automotive app., steel cords,
    welding wires, cold heading screws, suspension springs,
    special ropes)
•   Detailed engineering for the installation of the new
    equipment is expected in 1H 2018
•   Full project completion expected in 2019.

Investment features and benefits:
• New independent stands with motors & drives avoiding
   material twisting
• Modernized finishing blocks for improvement of final product
   diameter tolerance
• New state of art air & water cooling system with accurate
   process control
•  Project implementation will result in increased production
   of high quality wire rod for demanding applications.

                                Long products strategy to grow HAV grades
                                                                            37
Disciplined capital allocation focused on value
driven strategic initiatives: Mexico HSM
• US$1.0 billion three-year investment
  commitment
  ➢ Construction of a new 2.5Mt hot strip mill
    initiated late 4Q 2017
  ➢ Investments to sustain the competitiveness
    of mining operations
  ➢ Modernizing its existing asset base
                                                   ArcelorMittal Mexico:
  ➢ Estimated ~$350m capex in 2018                • Current production 4Mt increasing to ~5.3Mt
• Enable full production capacity to be             (2.5Mt flat; 1.8Mt long and 1Mt semi-finished
  achieved and significantly enhance proportion     slabs)
  of HAV mix                                      • Vertically integrated with flat and long product
                                                    capabilities
• Will benefit from Lázaro Cárdenas designation
                                                  • ArcelorMittal Lazaro Cardenas’s raw materials
  as one of 5 new Special Economic Zones in
                                                    and slabs shipped through a dedicated port
  Mexico
                                                    facility (Mexico’s largest bulk handling port)
• In-line with Action 2020 plan
   Mexico currently heavily reliant on imports of value-added steel; high growth expected
                                                                                                       38
Burns Harbor - New Walking Beam Furnaces
Burns Harbor Hot Mill - New Walking Beam
Furnaces:
• Install 2 latest generation walking beam
  furnaces, including recuperators & stacks,
  building extension & foundations for new units

• Benefits associated to the project:
  • Hot rolling quality and productivity
  • Sustaining market position
  • Reducing energy consumption

• Project completion expected in 2021

AM USA expands surface critical capability at Burns Harbor to provide a sustained automotive footprint
                                                                                                     39
Section 5

MACRO HIGHLIGHTS
Demand in core markets is growing
     Steel shipment split by segment FY’17                                                             End market growth prospects in US (2007=100)

                                                                                                       120
                                                                                                       110
                                                                                                       100
                       Brazil                                                                           90
                                                       ACIS                                             80
                                                                                                        70
                             12%                  15%                                                   60
                                                                                                        50
                                                                                                        40

                                                                                                                 2007
                                                                                                                         2008
                                                                                                                                2009
                                                                                                                                       2010
                                                                                                                                              2011
                                                                                                                                                     2012
                                                                                                                                                            2013
                                                                                                                                                                    2014
                                                                                                                                                                            2015
                                                                                                                                                                                    2016
                                                                                                                                                                                            2017
                                                                                                                                                                                                    2018
                                                                                                                                                                                                             2019
                                                                                                                                                                                                                      2020
                                                                                                                 Construction*                              Machinery**                                    Auto***
                                                               25% NAFTA
                                                                                                        End market growth prospects in EU28 (2007=100)

                    47%                                                                                 110
                                                                                                        105
       Europe                                                                                           100
                                                                                                         95
                                                                                                         90
                                                                                                         85
                                       75% of shipment to                                                80
                                                                                                         75
                                       developed markets                                                 70       2007
                                                                                                                         2008
                                                                                                                                2009
                                                                                                                                       2010
                                                                                                                                              2011
                                                                                                                                                     2012
                                                                                                                                                            2013
                                                                                                                                                                   2014
                                                                                                                                                                           2015
                                                                                                                                                                                   2016
                                                                                                                                                                                           2017
                                                                                                                                                                                                   2018
                                                                                                                                                                                                           2019
                                                                                                                                                                                                                    2020
                                Demand recovery in core markets has been offset by high imports…
Source: * & ** Oxford Economics Global Industry Forecasts; *** Oxford Economics Global Industry Forecasts, and LMC Automotive Global Car and Truck Forecasts; (latest update: 2Q 2017)
                                                                                                                                                                                                                             41
Global steel demand for 2017
   Global ASC 2017 v 2016*                                                                                    ArcelorMittal ASC demand estimates 2017

     • Global apparent steel consumption                                                                                       1.3%
                                                                                                               US**
       increased by +3.2% in 2017
     • Healthy demand backdrop maintained in                                                                 EU28               1.5%
       Europe and US
     • China: Positive demand growth due to                                                                 China                        3.5%
       strength in automotive and machinery
     • Brazil: Positive demand with growth in                                                                Brazil                             4.6%
       automotive offset by ongoing weakness
       in construction                                                                                          CIS                                     5.4%
     • CIS: Reflecting stronger economic growth
       in Russia                                                                                           Global                      3.2%

                                               2017 ASC growth of +3.2%; positive outlook for 2018
Source: *ArcelorMittal estimates ** Excludes tubular demand. ASC growth in 2017 in the US including pipes and tubes of +6.1%                                   42
Global ASC rates
 Global apparent steel consumption (ASC)* (million                                               US and European apparent steel consumption
 tonnes per month)                                                                               (ASC)* (million tonnes per month)
                    China             Developing ex-China                  Developed
                                                                                                 19                      US     EU28
65
                                                                                                 17
60
                                                                                                 15
55
50                                                                                               13

45                                                                                               11
40                                                                                                9
35
                                                                                                  7
30
                                                                                                  5
25                                                                                                                              (latest data point: Dec-2017)
                                                                 (latest data point: Dec-2017)
20                                                                                                3

     •       Global ASC -3.9% in 4Q’17 vs. 3Q’17                                                      •   US** ASC -5.2% in 4Q’17 vs. 3Q’17
     •       Global ASC +2.6% in 4Q’17 vs. 4Q’16                                                      •   US** ASC +6.3% in 4Q’17 vs. 4Q’16
     •       Global ASC +3.2% in 12M’17 vs. 12M’16                                                    •   US** ASC +6.1% in 12M’17 vs. 12M’16

     •       China ASC -5.9% in 4Q’17 vs. 3Q’17                                                       •   EU ASC +2.9% in 4Q’17 vs. 3Q’17
     •       China ASC +1.7% in 4Q’17 vs. 4Q’16                                                       •   EU ASC +1.6% in 4Q’17 vs. 4Q’16
     •       China ASC +3.5% in 12M’17 vs. 12M’16                                                     •   EU ASC +1.5% in 12M’17 vs. 12M’16

                                                    Global ASC improvement of +3.2% 2017 vs 2016
 * Source: AISI, Eurofer and ArcelorMittal estimates; ** includes pipes and tubes                                                                               43
Construction markets in developed market
United States                                                                            US residential and non-residential construction
                                                                                         indicators (SAAR) $bn*
• 2017 housing permits increased to 3.9% from 2.0% in                                                                Residential
  2016, boding well for residential construction in 2018.                                 700                        Non residential

• Although non-residential construction spending slowed                                   600
  in 2Q’17 - 3Q’17, it showed signs of recovery in 4Q’17.
                                                                                          500
• Architecture Billings Index (ABI) for 2017 came in
  strong, with 10 out of 12 months reading >50 and                                        400

  4Q’17 at 53.2.                                                                          300
• Continued uncertainty over the ability of the new                                                                        (latest data point: Nov-2017)
                                                                                          200
   administration to pass an infrastructure bill means the
   pick-up in infrastructure spending delayed until 2019
Europe                                                                                    Eurozone and US construction indicators**
• European construction accelerated to an estimated                                         65               Architecture Billings Index (USA)

  3.5% in 2017 from 1.8% in 2016.                                                           60               Eurozone construction PMI

• Growth in construction was led by Eastern European                                        55

  countries, particularly Poland and Hungary, with both                                     50

  growing double digits.                                                                    45

• Overall, construction activity in 2017 was supported by                                   40

  the fastest GDP growth in a decade at 2.5% yoy.                                           35                               (latest data point: Dec-2017)
• Eurozone construction PMI now >50 for 14 months                                           30

                                                        Construction growth accelerating in 2017
* Source: US Census Bureau; ** Source: Markit and The American Institute of Architects
                                                                                                                                                             44
Regional inventories
German inventories (000 Mt)*                                                                       US service centre total steel inventories (000 Mt)
                Germany flat stocks
                Months Supply (RHS)                         (latest data point: Jun 2017)                                          (latest data point: Dec-2017)
                                                                                                   13,000                                                          3.6
 2,200                                                                                       4.5   12,000                                                          3.4
                                                                                                                                USA (MSCI)
                                                                                                   11,000                                                          3.2
 2,000                                                                                       4.0                                Months Supply (RHS)
                                                                                                   10,000                                                          3.0
 1,800                                                                                       3.5
                                                                                                    9,000                                                          2.8
 1,600                                                                                       3.0    8,000                                                          2.6

 1,400                                                                                       2.5    7,000                                                          2.4
                                                                                                    6,000                                                          2.2
 1,200                                                                                       2.0
                                                                                                    5,000                                                          2.0

Brazil service centre inventories (000 Mt)                                                         China service centre inventories** (Mt/mth) with
                   Flat stocks at service centres            (latest data point: Dec 2017)
                                                                                                   ASC%                        (latest data point: Dec-2017)
1,400              Months Supply (RHS)                                                       7.0              Flat and long
                                                                                                   25                                                              50%
                                                                                                              % of ASC (RHS)
1,200                                                                                        6.0
                                                                                                   20                                                              40%
1,000                                                                                        5.0
                                                                                                   15                                                              30%
  800                                                                                        4.0
  600                                                                                        3.0   10                                                              20%

  400                                                                                        2.0    5                                                              10%
  200                                                                                        1.0    0                                                              0%

                                                                                       Inventory trends
* Last source updated Jun 2017                                                                                                                                           45
** Source: WSA, Mysteel, ArcelorMittal Strategy estimates
China overview
 China                                                                                                  China construction % change YoY, (3mth moving av.)*
• GDP growth slowing gradually after a modest                                                          100%                                     Residential floor space sold (6 month lag)
  tightening of monetary conditions, as the government                                                                                          Residential floor space started
                                                                                                        80%
  seeks to control financial risks but valuing stability,
                                                                                                        60%
  no major policy change
                                                                                                        40%
• Non-financial corporate debt remains an issue
  (>150% of GDP), mainly SOE’s – therefore the                                                          20%
  government will continue to focus on capacity cuts of                                                   0%
  heavy industry to improve profitability and reduce                                                   -20%
  environmental concerns                                                                                                                                         (latest data point: Nov-2017)
                                                                                                       -40%
• Despite slowing as expected in 3Q’17, real estate                                                        2008 2009 2010 2011 2012 2013 2014 2015 2016 2017 2018
  sales and new starts growth rebounded in Nov/Dec,                                                     Crude steel finished production and inventory (mmt)
  potentially leading to stronger real estate demand in
                                                                                                                      Steel inventory at warehouses (RHS)
  2018                                                                                                   75
                                                                                                                      Steel inventory at mills (RHS)
                                                                                                                                                                                                 25

• 2018 ASC to be broadly stable with machinery                                                                        Finished steel production (LHS)                                            20
                                                                                                         65
  helped by rising exports due to strong global demand
                                                                                                                                                                                                 15
  and without a drag from declining construction
                                                                                                         55
• Chinese exports down over 30% in 2017; we expect                                                                                                                                               10
  production cuts to constrain exports in the short term                                                 45
                                                                                                                                                                                                 5
• Inventories lower than usual due to policy restricted                                                                                                       (Latest data point: Dec-2017)
  output                                                                                                 35                                                                                      0

       China ASC demand grow 3.5% in 2017; more stable in 2018 with growth of -0.5% to +0.5%
 * Source: China National Bureau of Statistics, China Real Estate Index System (via Haver) and ArcelorMittal estimates; Source: NBS, CISA, WSA, Mysteel, ArcelorMittal Strategy estimates            46
China supply reform ahead of schedule
• Chinese government committed to tackle overcapacity
                                                                     115Mt permanent capacity
  and environmental issues                                             closed  further 25Mt
                                                                          targeted in 2018
• Capacity reduction ahead of expectations: net capacity
  reduction achieved vs. 140Mt target
• Steel replacement policy in favour of EAF v BF; no                  Additional ~120Mt illegal
                                                                     induction furnace capacity
  new capacity to be built  ratio 1:1 for EAF and 1:1.25                      closed
  for BF-BOF
• Industry operating at high rates of capacity utilisation
   higher domestic steel spreads                                        Industry capacity
                                                                             utilization
• Stronger domestic fundamentals plus global trade                         ~85-90% today

  restrictions  reduced incentive to export
• “Winter shutdowns” supporting fundamentals through                   Steel exports reduced
  seasonally weaker demand period
• Domestic capacity must reflect demand outlook

    Supply side reform progressing well; China ahead of initial plans to close steel capacity
                                                                                                  47
China addressing its excess capacity
         11th 5-year plan                            2009                         12th 5-year plan                  2013 September                     2016 February                       2018 January

     • Eliminate capacity               • Eliminate capacity                  • Eliminate capacity               • Reduce 80mt                    • Reduce 100-150mt                  • 115Mt net capacity
       below following                    below following                       below following                    capacity                         capacity over 5 years               reduction of the
       standard:                          standard by 2011:                     standard :                       • Increase financial             • No projects of new                  140Mt target (65Mt
       - BF < 300m3                         - BF < 400m3                        - BF < 400m3                       incentives in                    capacity                            in 2016 and 50Mt in
       - BOF < 20t                          - BOF < 30t                         - BOF < 30t                        capacity reduction             • There will be a                     2017)
       - EAF < 20t                          - EAF < 30t                         - EAF < 30t                        or volume swap                   “mandatory” part and              • In 2018, ~25Mt left to
     • By 2005, overall                 • By 2011, overall                    • By 2015, overall                   proposals                        a “voluntary” part                  be cut
       energy consumption                 energy consumption                    energy                           • Implement                      • The “mandatory” part              • Elimination of
       < 0.76 tons of coal                < 0.62 TCE; water                     consumption < 0.58                 penalties through                uses same criteria as               ~120Mt induction
       equivalent; water                  consumption < 5t per                  TCE; water                         high electricity &               earlier policy but                  furnaces (IF) in June
       consumption < 12t                  ton; dust emission                    consumption < 4                    water prices for                 adds criteria for                   2017
       per ton                            per ton < 1 kilogram;                 m3; SO2 emission                   those companies                  product quality and               • Winter shut downs
     • By 2010, overall                   CO2 emission per                      per ton < 1                        that fail to meet                for safety                          from Nov’17 to
       energy consumption                 ton < 1.8 kilogram                    kilogram                           environmental                  • The “voluntary” part                Mar’18; utilization
       < 0.73 TCE; water                                                                                           standard                         will rely upon                      rates cut to 50% in 2
       consumption < 8t                                                                                                                             financial incentives to             + 26 cities
     • By 2012, overall                                                                                                                             cut capacity. Special             • Steel replacement
       energy consumption                                                                                                                           funds will be used                  policy in favour of
       < 0.7 TCE; water                                                                                                                             for redeployment                    EAF v BF; no new
       consumption < 6t                                                                                                                             incentives and debt                 capacity to be built 
                                                                                                                                                    restructuring                       ratio 1:1 for EAF and
                                                                                                                                                                                        1:1.25 for BF-BOF
                                                                                                                                                                                        for key areas*

                         Previous capacity closures more than offset by rapid capacity additions

     China steel capacity rationalisation will take time… trade action to protect during this transition
* *The ratio 1:1.25 BF-BOF is for so-called “the environmentally-sensitive areas”, which means population-intensive and pollution-intensive as well, including Beijing-Tianjin-Hebei area, Yangtze-River-Delta
area (Shanghai, Jiangsu Province and Zhejiang Province) and Zhujiang-River-Delta area (9 key cities including Guangzhou in Guangdong province).                                                                  48
Lower Chinese exports

                         • Full year 2017 finished steel exports were ~76Mt, approx. 31% below 2016 levels
                           (109Mt) and 33% below the 2015 peak (112Mt)
                         • January 2018 exports down 18% MoM and 37% YoY, lowest since February 2013
                         • Production cuts should constrain exports in short term

                                                         2017 exports lower by ~31% YoY
Source: ArcelorMittal Corporate Strategy team analysis    Highly Restricted
                                                                                                              49
                                                                                                             49
Section 6

AUTOMOTIVE
No1 in automotive steel: Maintaining
leadership position
                                                          S-In-Motion SUV/Mid-Size Sedans
• ArcelorMittal is the global leader in steel for
  automotive 40% market share in our core markets
• Global R&D platform sustains a material
  competitive advantage
• Proven record of developing new products and
  affordable solutions to meet OEM targets
• Advanced high strength steels used to make
                                                          AM/NS Calvert
  vehicles lighter, safer and stronger
• Automotive business backed with capital with
  ongoing investments in product capability and
  expanding our geographic footprint:
    • AM/NS Calvert JV: Break-through for NAFTA
      automotive franchise
    • VAMA JV in China: Auto certifications progressing
    • Dofasco: Galvanizing line expansion

                 Continue to invest and innovate to maintain competitiveness
                                                                                            51
Global presence and reach
                                                                                                                                                       Automotive production facilities
                                                                                                                                                       Alliances & JVs
                                                                                                                                                       Commercial teams
                                                                                                                                                       R&D centres

               Vehicle production 2017

                 > 20 M veh
                 > 15 M veh & < 20 M veh
                 > 10 M veh & < 15 M veh
                 > 5 M veh & < 10 M veh
                 > 2.5 M veh & < 5 M veh
                 > 1 M veh & < 2.5 M veh
                 < 1 M veh

                                    Global supplier with increasing emerging market exposure
  Source: LMC figures for Western and Eastern Europe and Russia; IHS figures for all other regions; personal cars and light commercial vehicles < 6t                                      52
Automotive growth in developed world

  USA / Canada and EU28 + Turkey vehicles production
  million units
                                                                  • USA and Canadian automotive
  23
                                      20.5
                                                                   production stabilized
  21

  19                                                                  • Stability supported by replacement
  17
                                       13.2
                                                                       (average age of fleet 11.5 years),
  15
                                                                       continued economic and population
  13

  11
                                                                       growth
   9
                                                                  • EU28 and Turkey production reached
   7
                                                                   record highs in 2017 and further growth
   5
                                                                   expected

       USA+CANADA (LMC)   USA+CANADA (IHS)    EU28+Turkey (LMC)

             USA/Canadian production stable, EU28 & Turkey continue to recover
                                                                                                            53
Automotive emerging market growth
    China vehicle production (‘000s)
 40,000                                                  33,506
 35,000
              China                                               • China production to grow steadily by +6mvh
                                          27,636
 30,000
 25,000                                                            in 2017 to ~33mvh by 2025
 20,000
 15,000                                                           • India production to increase ~80% by 2025
 10,000
  5,000                                                            (from 4.5mvh in 2017 to 8mvh in 2025)
       0

                                                                  • Mexico production is expected to increase
    Brazil, India, Russia & Mexico vehicle production (‘000’s)     by 6.3% (2017 vs 2025)
  9,000
  8,000
              Russia   India   Brazil       Mexico      8,027     • Brazil production growth expected to
  7,000
  6,000
                                                                   continue and reach 3.9mvh in 2025
                                        4,456           4,193
  5,000
  4,000                                                           • Russia production is expected to recover
                                                3,946
  3,000                                                 3,928
  2,000                                         2,637              and reach 2013 level in 2022
  1,000                                                 2,327
                                           1,446
       0

                               Strong growth expected in India, China and Brazi
Source: IHS                                                                                                     54
ArcelorMittal’s S-in motion®
Demonstrating the weight saving potential of new products

  ArcelorMittal generic steel solutions includes body-in-white, closures, and chassis parts

                From steel provider to global automotive solutions provider
                                                                                              55
Continued investment in R&D supports
Portfolio of Next Generation Auto Steels
Fortiform®        Third-generation UHSS for cold           MartINsite®     A family of cold rolled fully
                                                                           martensitic steels with current
HF Grades         stamping. Fortiform® and HF steel
                  grades allow OEMs to realize                             tensile strengths from 900 to 1700
                  lightweight high-strength structural                     MPa. ArcelorMittal’s martINsite®
                  elements using cold forming                              cold roll family of fully martensitic
                  methods such as stamping.                                steels is perfect for anti-intrusion
                  Commercially launched in Europe                          parts such as bumper and door
                  in 2014 and available in North                           beams. Some are also available
                  America at Calvert undergoing                            in with an electrogalvanized
                  customer qualifications                                  coating (ArcelorMittal’s
                                                                           Electrosite® family of martensitic
                                                                           steels) or with Jetgal®.

                  Press hardenable steels (PHS) / hot                      JVD is a breakthrough process, In
 Usibor® 2000     stamping steels offer strengths up to    JVD® -Jetgal®   production and product
                                                                           development.
                  2000 MPa. Usibor® 2000 and
 Ductibor®1000    Ductibor® 1000 can also be               Jetskin™        Jetgal®: JVD zinc coating applied
                  combined thanks to laser welded                          to steel grades for the automotive
                  blanks (LWB) to reduce weight while                      industry. Developed for steels
                  achieving optimal crash behavior.                        including UHSS Fortiform®;
                  Both currently available in Europe;                      Jetskin™: JVD zinc coating
                  Usibor ® 2000 is commercially                            applied to steel grades for
                  available in Europe and available for                    industrial applications such as
                  qualification testing in North America                   household appliances, doors,
                  ; Ductibor® 1000 is commercially                         drums and interior building
                  available in Europe and Nafta                            applications.

  Widest offering of AHSS steel grades which can be implemented into production vehicles
                                                                                                                   56
Automotive Industry Leadership

                                                                                                    Audi coming
                                                                                                    back to steel

                                                                                                    Over 40% of the
                                                                                                    materials in the
                                                                                                    2018 Audi A8
                                                                                                    body structure
                                                                                                    will be steel, of
                                                                                                    which 17% will
                                                                                                    be press
                                                                                                    hardenable steel

The head of Audi’s ‘Lightweight Construction Centre’ is quoted as saying that “There will be no cars made of
aluminium alone in the future. Press hardened steel will play a special role in this development. If you compare the
stiffness to weight ratio, PHS is currently ahead of aluminium”.

                      Leveraging R&D for new products, solutions and processes
                                                                                                                       57
ArcelorMittal preferred AHSS supplier
                     AHSS evolution*                                                     ArcelorMittal market share**
                               40%
   AHSS share of total steel

                               35%
                               30%
                               25%
          demand

                               20%
                               15%
                               10%
                               5%
                                                                                              NAFTA
                               0%
                                 2005   2010               2015            2020   2025

• ArcelorMittal is maintaining overall market share
  in Europe, and increasing in NAFTA
• Our AHSS share is higher than overall market
  share
• As the technology requirements to develop and
                                                                                            Europe
  produce new AHSS like Fortiform® are higher,
  our share in these products has further growth
  potential

                                                             Market share in AHSS exceeds overall share
* Source: Ducker **Source: Regional ArcelorMittal Marketing Intelligence
                                                                                                                        58
VAMA greenfield JV facility in China
• 1.5 MT state-of-the-art production facility
                                                                                                                                VAMA: Valin ArcelorMittal Automotive target
• Well-positioned to serve growing automotive market                                                                            areas and markets
• China 2017 output 27.6mvh (IHS) +3.2% YoY
• VAMA has successfully completed homologation on                                                                                                                                     FAW-VW &
                                                                                                                                                                                      BMW
  UHSS/AHSS with key tier 1 auto OEMs (~60% complete)
                                                                                                                                                                         Daimler &
                                                                                                                                                                         Nissan
Latest development:
• Strong sales & order book for licensed USIBOR 1500                                                                                                                    Beijing

• VAMA started the first commercial supply of exposed
  products in 4Q 2017
• Start of production ceremony for downstream ATSs                                                                                  BYD, Changan,
                                                                                                                                                                                     Geely, VW, GM, KIA,
                                                                                                                                                                                     SAIC & Chery
                                                                                                                                    Suzuki, CFMA &
  project in 4Q 2017                                                                                                                FAW-VW                                                   Shanghai

                                                                                                                                                                                     Changfeng, Fiat,
                                                                                                                                                                                     DPCA, Dongfeng,
                                                                                                                                                                          VAMA       Honda, JMC & Suzuki
                                                                                                                                                             Loudi

                                                                                                                                                  SAIC, Toyota, GM,
                                                                                                                                                  Honda, Nissan & BYD             Guangzhou

      Furnace of CGL and CAL on both sides                         VAMA HQ in Loudi city, Hunan Province                                 •       Central office in Changsha with satellite offices in proximity
                                                                                                                                                 to decision making centers of VAMA’s customers

                                      VAMA well positioned to supply growing Chinese auto market
BYD: Build Your Dreams; CFMA: Changan Ford Mazda Automobile; SAIC: Shanghai Automotive Industry Corporation; JMC: Jiangling Motors Corporation                                                             59
INDIA auto JV with SAIL
Passenger vehicles                                                                                  AHSS++ penetration
production                                                                                                        (%)                                             INDIA AUTO OUTLOOK
Million
                                                                                                                                      30                          ▪ 2017-2025: India passenger vehicle segment is
                                                                                                                28%                                                 expected to grow at 8-8.5% CAGR
10
                                                                                                                                                                  ▪ New safety regulation would accelerate
                                                                                                                                      25                            penetration of AHSS+ UHSS steel in passenger
                                                                                23%
                                                                                                                 8.2                                                vehicles and LCV to meet safety norms*
 8
                                                                                                                  2.2                 20 PV
                                                                                                                                         exports                  INDIA AUTO JV with SAIL
 6                                                                               5.8                                                                              ▪ ArcelorMittal & SAIL entered into a MoU on May
                                                14%                                                                                   15                            22, 2015 for setting up an automotive steel
                                                                                  1.0
                                                                                                                                                                    facility under a joint venture agreement.
 4              10%                              3.8                                                                                              ▪ Venture to offer technologically advanced steel
         3.2                                     0.6                                                              5.1                 10 PV
                                                                                                                                         domestic   products to rapidly growing automotive industry
                 0.5                                                              4.0                                                               in India.
 2                2.2                             2.7                                                                                 5           ▪ Feasibility study currently underway for 1.5Mtpa
                                                                                                                                                    in phase 1 incl. PLTCM, CAL & CGL (Pickling
                  0.6                             0.5                             0.7                             0.9                    LCV        Line & Tandem Cold Mill, Continuous Annealing
 0                                                                                                                                    0             Line, Continuous Galv. Line)
               2010                            2015                            2020                            2025

                2.4                             2.7                              4.2                            5.8

               Medium to high grade steel demand from auto sector, MT

     Robust automotive growth / new regulation will drive demand for high grade automotive steel
*(BNVSAP) & emission standards (BS VI): Bharat New Vehicle Safety Assessment Program is a proposed new car assessment program for India; BS-VI is the last norm on emission standard (Bharat Stage Emission Standards BSES)   60
Section 7

GROUP HIGHLIGHTS
Steel demand by end market
China steel demand split                                                                US steel demand split
                                                                                                             Machinery and equipment
                                                                                                                                10% Other
                                   Shipbuilding                                                                                      3%
                           Railway                                                                                                      Energy
                                   1%
                               1%                                                                       Construction                    10%
                                            Machinery
                                            19%                                                                40%

                                                        Automobiles
                                                        8%                                                                             Automobile
                                                                                            Defense & Homeland Security
                                                        Household appliances                                                           26%
                                                                                                                   3%
                                                        2%                                                                   Container
                                                                                                                  Appliances
Construction                                                                                                                 4%
                                                                                            Metal goods                  4%
       68%                                                                                                                    Europe & NAFTA
                                                                                                   14%
                                                                                                        Other
                                                                       Construction                     2%
                                                                              35%
                                                                                                         Tubes
                                                                                                         13%
                                                  Europe steel demand split
                                                                                                         Other transport
                                                                                                         2%
                                                                                                        Domestic appliances
                                                                                                        3%
                                                                    Mechanical enginering         Automobiles
                                                                                    14%           18%

                                                            Regional steel demand by end markets
Sources: China-Bloomberg, Europe: Eurofer, US: AISI                                                                                                 62
Global scale, regional leadership
                       Key performance data 12M 2017

                                                                    NAFTA                         Brazil*                      Europe                         Mining                       ACIS

                      Revenues ($bn)                                   18.0                           7.8                        36.2                           4.0                            7.6
                      % Group**                                        24%                           11%                         49%                           6%                              10%

                      EBITDA ($bn)                                      1.7                           1.0                         3.6                           1.4                            1.0
                      % Group**                                        20%                           11%                         41%                          16%                              12%

                      Shipments (M mt)                                 21.8                         10.8                         40.9                       57.4***                            13.1
                      % Group                                          25%                          12%                          48%                                                           15%

                            ~197,100 employees serving customers in over 160 countries

                                                                                     Global scale delivering synergies
 * Brazil includes neighboring countries ** Percentage calculation for Revenue and EBITDA exclude others and eliminations; *** Iron ore shipments only (market price plus cost plus tonnage)          63
Group performance FY17 v FY16
FY17 v FY16 analysis:                                                  EBITDA ($ Millions) and EBITDA/t
                                                                         $83/t       $89/t           $102/t   $75/t            $99/t
• Crude steel production increased 2.6% to 93.1Mt with increases in
  NAFTA (+5.7%), BRAZIL (+0.7%) and Europe (+2.7%) offset in part                           11.2%                     +34.4%
  by a decline in ACIS (-0.8%)
• Steel shipments increased 1.6% primarily due to increases in           1,661      1,924            2,141                    8,408
                                                                                                              6,255
  NAFTA (+2.6%), BRAZIL (+0.8%) and Europe (+1.7%) offset in part
                                                                         4Q’16      3Q’17        4Q’17        FY’16           FY’17
  by a decline in ACIS (-1.3%)
• Sales increased 20.9% to $68.7bn vs. $56.8bn for FY’16, primarily    Average steel selling price $/t
  due to higher average steel selling prices (ASP) (+20.4%), higher                         +2.7%                     +20.4%
  steel shipments (+1.6%), higher seaborne iron ore reference prices
  (+22.3%) and higher marketable iron ore shipments (+6.1%).               589       690              709      567             682
• EBITDA improved 34.4% primarily due higher volumes and ASP in
  the steel and mining businesses as well as the benefits of Action       4Q’16     3Q’17            4Q’17    FY’16           FY’17

  2020 cost savings                                                    Steel shipments (000’t)
                                                                                             -3.3%                    +1.6%

                                                                         20,045    21,705        20,996       83,934       85,242

                                                                         4Q’16      3Q’17            4Q’17    FY’16           FY’17

                                               Group profitability increased YoY
                                                                                                                                      64
You can also read