7 GLOBAL RESOURCES CONFERENCE 2019, LONDON - MARCH 6TH, 2019 - ARCELORMITTAL
←
→
Page content transcription
If your browser does not render page correctly, please read the page content below
7

                                                          Daniel Fairclough, Head of Global IR
Global Resources Conference 2019, London                     Hetal Patel, General Manager IR
March 6th, 2019
                                      Highly Restricted                                          0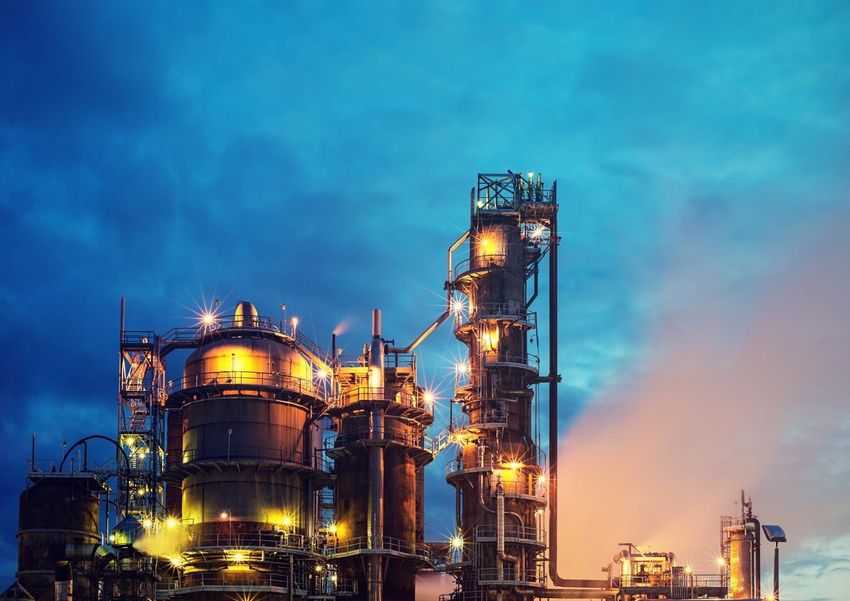
Disclaimer
Forward-Looking Statements
This document may contain forward-looking information and statements about ArcelorMittal and its subsidiaries.
These statements include financial projections and estimates and their underlying assumptions, statements
regarding plans, objectives and expectations with respect to future operations, products and services, and
statements regarding future performance. Forward-looking statements may be identified by the words “believe”,
“expect”, “anticipate”, “target” or similar expressions. Although ArcelorMittal’s management believes that the
expectations reflected in such forward-looking statements are reasonable, investors and holders of
ArcelorMittal’s securities are cautioned that forward-looking information and statements are subject to numerous
risks and uncertainties, many of which are difficult to predict and generally beyond the control of ArcelorMittal,
that could cause actual results and developments to differ materially and adversely from those expressed in, or
implied or projected by, the forward-looking information and statements. These risks and uncertainties include
those discussed or identified in the filings with the Luxembourg Stock Market Authority for the Financial Markets
(Commission de Surveillance du Secteur Financier) and the United States Securities and Exchange Commission
(the “SEC”) made or to be made by ArcelorMittal, including ArcelorMittal’s latest Annual Report on Form 20-F on
file with the SEC. ArcelorMittal undertakes no obligation to publicly update its forward-looking statements,
whether as a result of new information, future events, or otherwise.

                                                                                                                     1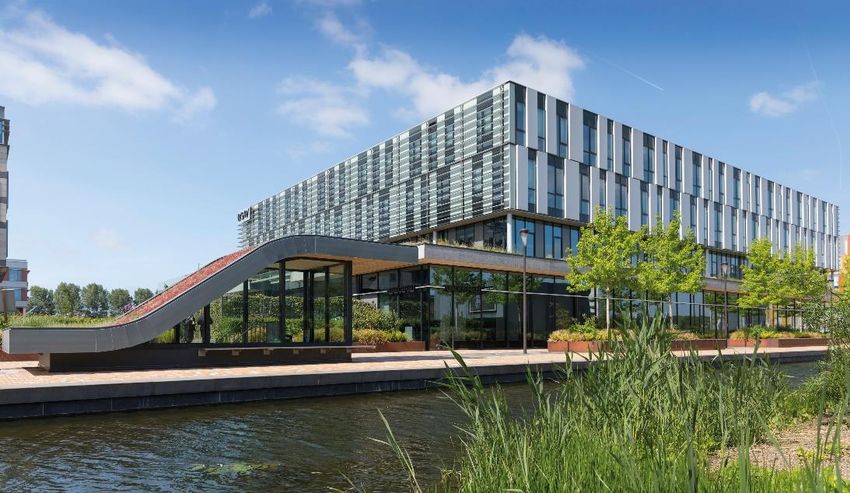
Structural transformation
Improved business and improved industry means ArcelorMittal well positioned for success

     Global Steel Industry              ArcelorMittal Balance sheet              ArcelorMittal Portfolio

    ▪ Trade responses to                   ▪ Net debt reduced                        ▪ Action2020
       unfair competition                                                       ▪ Votorantim acquired
                                          ▪ IG rating recovered
     ▪ Capacity reduced                                                             ▪ ILVA acquired
                                            ▪ Deleveraging to
 ▪ Consolidation occurring                       continue                         ▪ Essar in process

        Strengthened                           Strengthened                          Strengthened

                                                                                                           2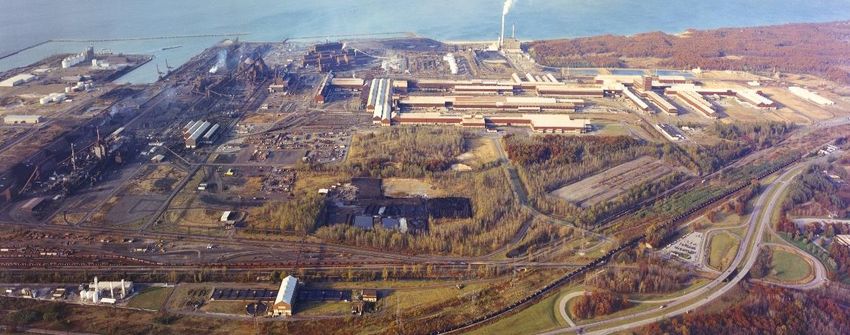
Safety is our priority
LTIF* rate in 2018 was the lowest since the ArcelorMittal merger

  3.1

                   2.5

                                   1.9
                                                   1.8

                                                                   1.4

                                                                                    1.0
                                                                                                   0.85            0.85            0.81             0.82            0.78
                                                                                                                                                                                    0.69

 2007            2008            2009            2010             2011            2012            2013             2014            2015            2016            2017           2018**
  * LTIF = Lost time injury frequency defined as Lost Time Injuries per 1.000.000 worked hours; based on own personnel and contractors; A Lost Time Injury (LTI) is an incident that causes an
 injury that prevents the person from returning to his next scheduled shift or work period. Lost Time Injury Frequency Rate (LTIFR) is the number of Lost Time Injuries per million man-hours.
 ** Data does not include the LTIFR for Ilva, which came into the scope as from November 1, 2018. Ilva LTIFR for the final two months of 2018 was 8.2, and the total LTIFR for the group inclusive
 of this was 0.73x for the FY 2018
                                                                                                                                                                                                     3
Sustainable Development – key to our resilience
Driven by our vision to make steel the material of choice for the low carbon and circular economy
• Product innovation including S-in-motion® solutions for automotive
R&D Driven
Innovation • Steligence®, a radical new concept for the use of steel in construction awarded Steelie
award for ‘Excellence in Life Cycle Assessment’
• To low carbon and circular economy through Carbon Smart technology like the LanzaTech
project on Carbon Capture and utilisation at Gent, Belgium
Contribution
• Design of our new headquarters in Luxembourg showcasing that steel components in are
re-usable
• Drive the development of environmental and social certificate schemes for steel and
Development mining production
• Providing customers new levels of complete mine-to-metal reassurance
4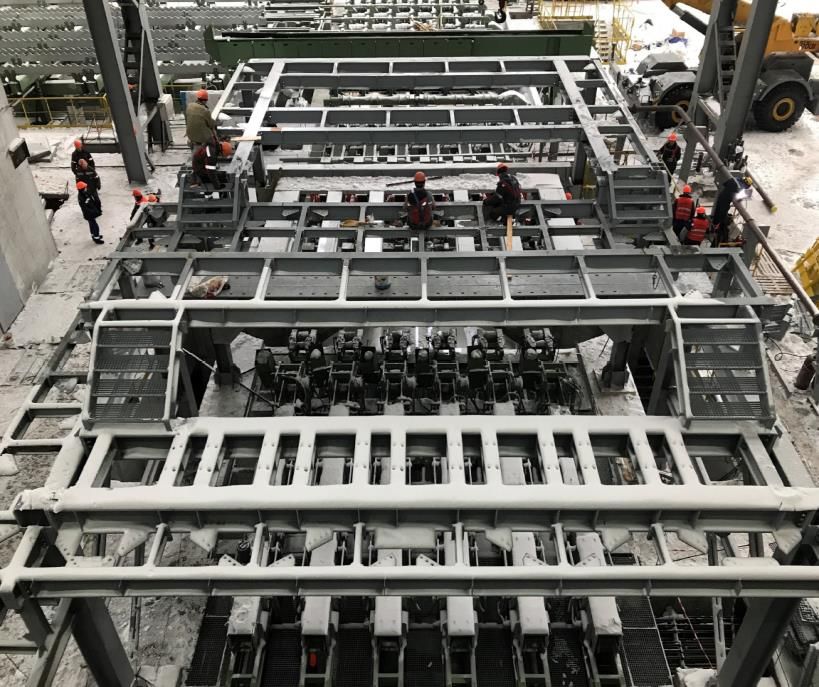
2018: strategic progress and improved financials
Improved operating conditions more than offset operational disruptions

           Financial Highlights
                                         IG rating
                                         Recovered investment
• 20.3% increase in operating income
                                         grade credit rating with
• 22.1% improvement in EBITDA            all 3 agencies
• Steel shipment volumes declined
  1.6% (-3.0% adjusted for scope)        0.69x LTIF rate
• Net income of $5.1bn, representing a   Best safety performance since
  12% ROE                                ArcelorMittal’s merger

• Shareholders’ equity increased to
  $44.1bn                                $4.4bn                 $0.6bn
                                         Investment in          Net Pension and
• Net debt/ LTM EBITDA now 1.0x
                                         working capital        OPEB liability
• Recommended increase in base                                  reduced
  dividend to $0.20/sh                                          significantly

                                                                                  5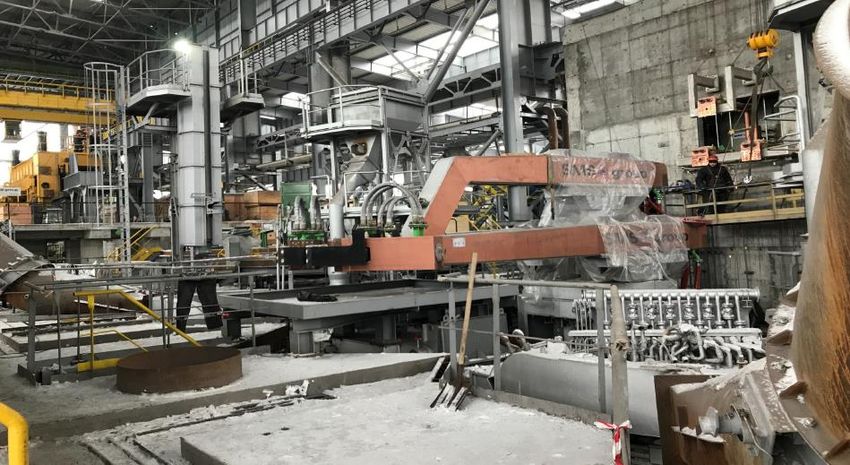
2018 financial results reflect better markets
Steel divisions benefitted from improved steel spreads partially offset by lower volumes

       •   2017 to 2018 EBITDA by segment ($bn)

                             0.5                          NAFTA:                          Europe:
                                                   10.3
                                                          EBITDA +45.1% to $2.5bn         EBITDA +7.0% to $3.8bn
                                    -0.1                  Shipments +1.0% to 22Mt         Shipments +0.2% to 41Mt

                      0.3                                 EBITDA/t +43.7% to $112/t       EBITDA/t +6.8% to $93/t

               0.4                                        BRAZIL:                         ACIS:
                                                          EBITDA +55.4% to $1.5bn         EBITDA +36.9% to $1.4bn
                                           12-15
                                                          Shipments +5.8% to 11.5Mt       Shipments -10.3% to 11.7Mt
        0.8
                                                          EBITDA/t +46.9% to $134/t       EBITDA/t +52.7% to $120/t

                                                          Mining:
                                                          EBITDA -9.2% to $1.3bn
                                                          Iron ore shipments +5.5% to 37.6Mt; Coal shipments -10.7%
 8.4
                                                          FCF breakeven level remains at $40/t CFR China 62% Fe

 FY17 NAFTA ACIS Europe Brazil Mining Others FY18

                                                                                                                       6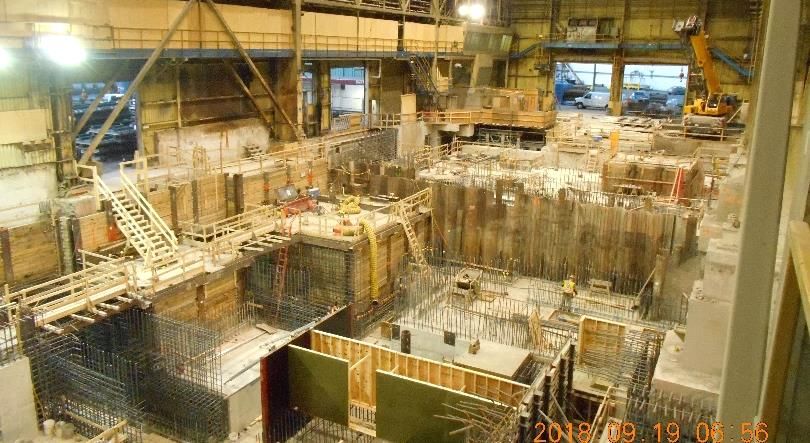
Production impacted by operational disruptions
Nonrecurrence should provide support for 2019 volumes
• Crude steel production in 2018 v 2017
• Estimated disruption loss of ~2Mt in 2018
• (scope adjusted for Votorantim and Ilva acquisitions) (Mt)
• 1.0Mt of production losses identified as
project related and 0.9Mt as unplanned NAFTA -0.9
outages
Brazil 0.5
• Operational issues faced largely in ACIS
and NAFTA during 2018 Europe 0.2
• Volume disruptions incurred at other
ACIS -1.7
segments earlier in 2018 were recovered
• Focus in 2019 to ensure non recurrence
of such issues which should provide
support for 2019 volumes
Unplanned outages 0.9
Project related 1.0
2018
7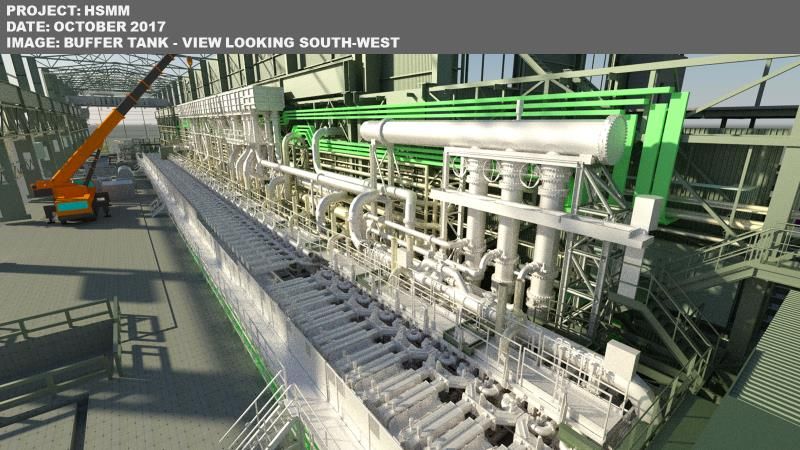
Volumes impacted Action2020 progress
Continued gains in cost/mix improvement offset in part by shipment losses
• 3 years into the Action 2020 improvement plan to Action 2020 cumulative EBITDA improvement ($bn)
structurally improve EBITDA by $3bn
• 2018 cost/mix gains of $0.4bn:
Volume
➢ Digital transformation in Europe 3.0
Cost/Mix
➢ Ukraine (coke oven battery savings)
1.0
➢ Brazil (cost & mix improvement)
➢ South Africa (improved efficiencies from
debottlenecking production and top line 1.5 1.6
optimisation) 0.3
• Volume progress reversed due to operational 0.9 2.0
1.6
disruptions loss of $0.3bn 1.2
0.9
• $1.6bn cumulative savings from Action 2020 plan
• Company remains focussed on achieving its 2016 2017 2018 2020F
Action2020 targets Target
8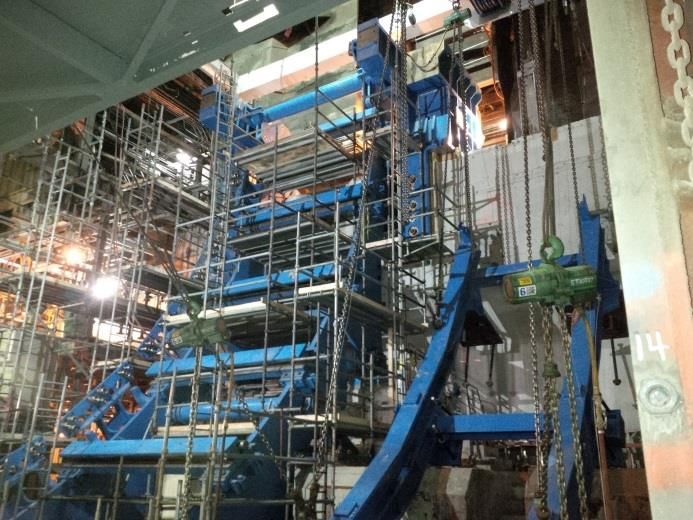
Stronger balance sheet
 Significant working capital investment in 2018; release expected in 2019

                    Capital deployment in 2018

                                                                                 Net debt to EBITDA
 Investment
  in working                  ~$4.4bn                                                              3.0
      capital                                                              2.8

                                                           2.3
   Net M&A       $0.4bn
     spend                                                         2.2             2.3     2.2              1.8

                                                                                                                   1.2
     Growth                                                                                                                1.0
      capex     $0.3bn

        Cash
  returned to
ArcelorMittal   $0.3bn
shareholders                                              Dec 31, Dec 31, Dec 31, Dec 31, Dec 31, Dec 31, Dec 31, Dec 31, Dec 31,
                                                           2010 2011 2012 2013 2014 2015 2016 2017 2018

                                                                                                                               9
CAPITAL ALLOCATION
10Capital allocation to support strategic goals
Building strong foundations for future returns
Building the strongest platform for consistent capital returns to shareholders
Targeting $6bn net debt – a level of debt
Resilient
Robust balance sheet that should support positive FCF* and IG
credit metrics at all points of the cycle platform
Whilst investing in high-return
To grow FCF
Invest in strengths opportunities with focus and strict
discipline potential
Progressively increase base dividend with
Returns to Consistently
a commitment to returning a percentage
shareholders of FCF on attainment of debt target return cash
* Free cash flow refers to cash flow from operations less capex
11Investment plan focussed on high-return projects
Additional capex planned in 2019 to fund ILVA as well as mix & cost improvement projects
Committed to high-return projects (capex, $bn)
UNIQUE opportunities
in CORE markets
0.4 0.1
0.5
Move MIX to most
attractive end markets
4.3
Incremental budget approved including carry-over
3.3
Increase
COMPETITIVENESS 2018 ILVA Brazil & Other 2019F
Mexico Strategic
Projects
12Mexico: HSM project
High return mix improvement with future optionality
Project summary: US$1.0bn 3Yr investment commitment
Construction of a new 2.5Mt hot strip mill
• HSM project to optimize capacity and improve mix
➢ $1bn project initiated in 4Q’17; expected completion in 2020 (Mt) ASC (Million tonnes; flat products)
➢ New 2.5Mt hot strip mill to increase share of domestic market (domestic 20
17.2 16.6
15.7 16.2
HRC spreads are significantly higher vs. slab exports) 15
John Deere India54%
➢ Includes investments to sustain the competitiveness of mining operations 52% 50% 50%
10
and modernizing its existing asset base
5
• ArcelorMittal Mexico highly competitive low cost domestic slab Share captured by Imports
• Growth market, with high import share 0
2015 2016 2017 2018
➢ Mexico is a net importer of steel (50% flat rolled products import share)
➢ ASC estimated to grow 2.0% CAGR 2015-25; growth in non-auto +2.2%,
supported by industrial production and public infrastructure investment
• Potential to add $250 million in EBITDA on completion
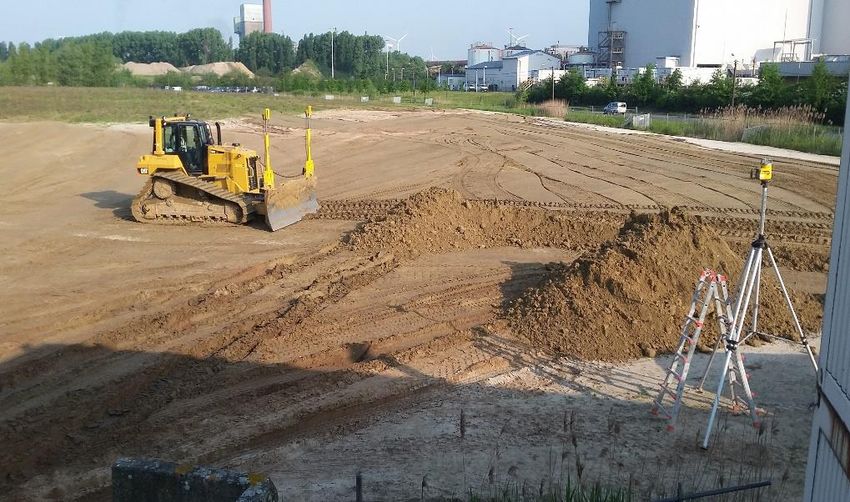
Project status:
• Deep foundations nearly complete (demobilizing in February); building
erection progressing on schedule; mill cranes on site, other equipment in
transit
13Brazil: Vega high added value capacity expansion
High return mix improvement in one of the most promising developing markets
Project summary: 3Yr investment to expand rolling capacity →
increase Coated / CRC capacity and
• HAV expansion project to improve mix construction of a new 700kt continuous
➢ Completion expected 2021 with total capex spend of ~$0.3bn annealing line (CAL) and
John continuous
Deere India galvanising
combiline (CGL)
➢ Increase Galv/CRC capacity through construction of 700kt continuous
annealing and continuous galvanising combiline
➢ Optimization of current facilities to maximize site capacity and
competitiveness; utilizing comprehensive digital/automation technology
➢ To enhance 3rd generation AHSS capabilities and support our growth in
automotive market and value added products to construction
• AM Vega highly competitive on quality and cost, with strategic location and
synergies with AM Tubarão
• Investment to sustain ArcelorMittal Brazil growth strategy in cold rolled and
coated flat products to serve domestic and broader Latin American markets
• Strengthening ArcelorMittal’s position in key markets as automotive and
construction through value added products
• Potential to add >$100mn to EBITDA
14Votorantim consolidates our position in Brazil longs
Multi-year acquisition project concluded in April 2018
• Culmination of a multi-year process that
Creating the new market leader in Brazil longs
began in 2014
• Consolidating the Brazil long products
market
Minas Gerais
• ArcelorMittal now the #1 long products
producer with annual crude steel capacity of Monelevade
5.1Mt.
Juiz de Fora
• Acquired production facilities are
geographically complementary, enabling Rio de Janeiro
Sao Paulo
higher service level to customers, economies Piracicaba
of scale, higher utilization and efficiencies.
Resende plant Barra Mansa plant
• ~$110m of identified synergies on track to be
fully captured in 2019
Resende Barra Mansa
15ILVA project to turnaround and restore tier-1 status
Multi-year acquisition project concluded in November 2018
• Culmination of a multi-year process that began in 2014 ILVA capex commitment through 2024 (€ bn)
• Improvement plan now underway to:
2.40
• Increase production to 6Mt near term; then to 8Mt 2.10
0.30
post completion of environmental plan 1.25
• Capture identified synergies (€310m) and realise 1.15
asset’s potential Industrial capex
includes annual
• Focus on: maintenance
Enviromental Industrial Total capex Riva funds Net capex
• Health and safety: Top priority to improve H&S utilised
performance underway
• Investment program underway: Coverage of the
raw materials stockyards progressing in-line with
the accelerated timetable
• Performance and operations: identify gaps with
ArcelorMittal sites and take actions; adopt Progress at the raw material stock yard
ArcelorMittal commercial approach
• Integration: use benchmarking
16Essar: Adding a new high-growth pillar
Essar brings scale, turnaround opportunity and growth optionality
• Essar provides ArcelorMittal an opportunity to buy a producing, Essar Steel main production
profitable, cash generating asset at below replacement costs facilities at Hazira, Gujarat;
10Mtpa nominal capacity (current
• ArcelorMittal received approval for acquisition of Essar* production 6.5Mtpa)
• Upfront payment of $5.7bn** to ESIL creditors with a further
$1.1bn** capital injection into the business to kickstart
turnaround
• ArcelorMittal aims to increase shipments to 8.5Mt in medium
term, with long term target of 12-15Mt through additional
brownfield capacity expansion
• Iron ore pelletising integration in East India provides optionality:
14Mtpa pellet capacity → currently being expanded to 20Mtpa
• ArcelorMittal & NSSMC to finance their “India JV” through
combination of partnership equity (1/3) and debt (2/3)
• Investment in the “India JV” expected to be equity accounted
1 2 3 4 5
One of the largest single Service centres in
Complete basket of flat Access to Port
High quality raw material Largest pellet capacity in India location for flat steel in India competitive locations
steel produtcs
* In-line with Essar Steel India Limited’s (ESIL) corporate insolvency process, the Company’s Resolution Plan must now be formally accepted by India’s National Company Law Tribunal
(‘NCLT’) before completion **at 73.2 Indian rupees / $1 .
17OUTLOOK
18Global steel demand
Global Apparent Steel Consumption (ASC) growth of +0.5% to +1.0% forecast in 2019F
Estimated ASC growth 2018 v 2017* Forecast ASC growth 2019F v 2018*
US +1.7% US +0.5% to +1.5%
EU28 +2.9% EU28 +0.5% to +1.0%
China +3.5% China -0.5% to -1.5%
Brazil +7.3% Brazil +3.5% to +4.5%
CIS +1.8% CIS +1.0% to +2.0%
Global ex China +2.1% Global ex China +2.0% to +3.0%
Global +2.8% Global +0.5% to +1.0%
Source: *ArcelorMittal estimates
19Position to Deliver Value
Global diversified industry leader focussed on maximising per-share value
• Unique global portfolio ArcelorMittal
Secure position in mature developed markets High-growth, with attractive Access to
• Industry leader in product and (with growth exposure e.g. Mexico) with
emphasis on HAV leadership
market structure and gradual
evolution towards HAV
growth
markets
process innovation
• Action2020 plan to structurally
EUROPE
BRAZIL
NAFTA
improve profitability
INDIA
ACIS
• Investing with focus and discipline
in high return opportunities
• Investment grade balance sheet
Mining
• Progressively returning cash (capturing the full value-in-use chain)
Investment Grade Balance Sheet
20APPENDIX
21Appendix
• SECTION 1 | Cash needs.……………………………………………………. 23
• SECTION 2 | Trade.………………………………………………………....... 25
• SECTION 3 | Financials results..…………………………………………….. 29
• SECTION 4 | Steel investments..…………………………………………………… 40
• SECTION 5 | Macro highlights……………………………………………….. 46
• SECTION 6 | Industry leadership……………………………………………. 49
• SECTION 7 | Auto ……………………………………………………………. 54
• SECTION 8 | Group highlights ………………………..…………………..…. 67
22CASH NEEDS
23Cash needs
Cash needs* to increase in 2019 largely due to increased capex spend on high return opportunities
• Cash needs to increase to $6.4bn in Below-EBITDA cash needs ($ billions)
2019 6.4
• The $1.4bn increase Vs. 2018 reflects:
1) $1bn increase in capex (including 1.5
5.0
$0.4bn carryover from 2018)
Taxes**, pension and other 1.1 0.6
2) Cash taxes deferred from 2018
3) Non recurrence of certain cash Net interest 0.6
gains in 2018
• Unplanned working capital investment in
2018 is expected to be released in 2019 4.3
Capex 3.3
• As a result, Company should achieve
more significant net debt progress in
2019
2018 2019F
* Cash needs of the business consisting of capex, cash paid for interest and other cash payments primarily for taxes and excluding for these purposes working capital investment
** Estimates for cash taxes in 2019 largely reflect the taxable profits of 2018
24TRADE
25EU trade Comprehensive solution for unfairly trade imports required Trade cases (Flat steel): • All key flat rolled steel products Anti-dumping and countervailing duty cases have been implemented • Monitoring for unfairly traded imports ongoing Safeguard duties: • On January 17, 2019, EU Member states approved the European Commission’s (EC’s) final safeguard measures on steel with implementation to begin February 4, 2019 • Final measures include immediate “relaxation”, increasing quota by 5% (calculated on base years of 2015-2017), with further 5% relaxation in July 2019 and another 5% in July 2020, subject to review • Final measure give country-specific quotas to main steel exporters to EU; remaining residual quote for other countries to be quarterly, however countries with own quota can consume residual quote once they have used up their own • Certain 'developing' countries with a share of imports of
NAFTA trade
Comprehensive solution for unfairly trade imports required

Trade cases:
•   All key flat rolled steel products AD/CVD cases have been implemented.
•   Anti-circumvention investigations initiated by DOC for CRC and CORE imports from China (through Vietnam); final affirmative
    determination received May 17, 2018
•   On June 12, 2018, the US industry filed anti-circumvention petitions with DOC for CRC and CORE imported from Korea and Taiwan
    (through Vietnam).

Section 232 US:
•   March 23, 2018: 25% tariffs imposed on all steel product categories began for most countries
•   June 1, 2018: 25% tariffs imposed on steel products in Europe, Canada & Mexico (no change despite agreement on NAFTA as still
    awaiting Canada) with the following exceptions:
    • South Korea: Quota of 70% of 2015-2017 av. export volumes into US
    • Brazil: Quota of 2015-2017 average export volumes into US - 70% for finished products; 100% for semi-finished products
    • Argentina: Quota of 135% of 2015-2017 average exports
    • Australia: completely exempt from tariffs and quotas
    • August 30, 2018: Trump issued a proclamation whereby there is now a product exclusion request process in place for countries
       where there is a quota, i.e. S. Korea, Argentina and Brazil
    • Turkey: duties doubled to 50% from 25% due to currency devaluation

Canada and Mexico response to Section 232:
•   Canada: 25% retaliatory tariffs on US imports for most steel products, Provisional safeguard measures announced on October 11,
    2018 on 7 steel products (hot rolled, prepaint, rebar, wire rod, energy tubulars, plate and stainless wire)
•   Mexico: 15-25% retaliatory tariffs on US imports for most steel products; Safeguard duties of 15% already in place for countries with
    no free trade agreement
                                                                                                                                            27
FINANCIAL RESULTS
28Operating results for 4Q’18
Quarterly results impacted by sequential seasonal slowdown and operational issues
• EBITDA: $2.0bn (-8.9% vs.4Q’17); 12M’18 $10.3bn
EBITDA progression ($bn)
(+22.1% YoY)
• Steel performance lower QoQ: impacted by negative
price-cost effect and lower steel shipments (-1.5%) to +22.1%
20.2Mt
10.3
• Mining performance higher QoQ: Impacted by -8.9%
higher marketable iron ore shipments (+16.8% QoQ);
2.7 8.4
12M’18 at 37.6Mt (+5.5% YoY)
• Net income: at $1.2bn vs $0.9bn in 3Q’18 2.1
2.0
• Working capital release of $0.4bn in 4Q’18
$102/t $133/t $96/t $99/t $122/t
• Net debt of $10.2bn as of Dec 31, 2018 as compared
to $10.1bn as of Dec 31, 2017
4Q’17 3Q’18 4Q’18 12M’17 12M’18
Note: YoY refers to 12M’18 vs. 12M’17; QoQ refers to 4Q’18 v 3Q’18; 29Steel performance for 4Q’18
Steel-only EBITDA increased YoY but declined QoQ (in all segments)
12M’18 steel-only EBITDA up +28.4% YoY primarily Steel only EBITDA ($bn) and EBITDA/t ($/t)
due to positive price-cost effect (PCE) with all segments
improving -34.3%
+28.4%
2.4
4Q’18 steel-only EBITDA down 34.3% vs. 3Q’18 9.0
1.9
• ACIS: EBITDA down -55.7% Negative price-cost 1.6 7.0
effect and lower shipments (operational issues in
Kazakhstan) $89/t $119/t $79/t $82/t $107/t
• Brazil: EBITDA down -37.2% Negative price-cost
effect 4Q’17 3Q’18 4Q’18 12M’17 12M’18
• NAFTA: EBITDA down -33.2% Lower steel
shipments and negative price-cost effect 3Q’18 to 4Q’18 steel only EBITDA ($mn)
• Europe: EBITDA down -14.0% Performance
primarily impacted by negative price-cost effect
-247
2,448 -165
-122 -57
-249 1,608
3Q’18 NAFTA Brazil Europe ACIS Others 4Q’18
Note: YoY refers to 12M’18 vs. 12M’17; QoQ refers to 4Q’18 v 3Q’18 30Mining performance for 4Q’18
Mining profitability positively impacted by higher shipment volumes and iron ore prices
• Mining performance:
Mining EBITDA ($mn)
• 4Q’18 EBITDA improved 22% QoQ primarily due
to higher market priced iron ore shipments
(+16.8% QoQ) +22% -9.2%
• FY’18 EBITDA declined 9.2% YoY primarily due to 343 1,407
weaker coal performance driven by lower 281
volumes. 1,278
• Growth: Market priced iron ore shipments grew
5.5% in 2018 YoY
3Q’18 4Q’18 12M’17 12M’18
• Focus on quality: ongoing commitment on quality,
service and delivery
Marketable iron ore shipments (Mt)
• Cost focus maintained: FCF breakeven remains
$40/t
+16.8% +5.5%
10.0 37.6
8.5
35.7
3Q’18 4Q’18 12M’17 12M’18
Note: YoY refers to 12M’18 vs. 12M’17; QoQ refers to 4Q’18 v 3Q’18 314Q 2018 EBITDA to net results
Positive net income in 4Q 2018
BASIC EPS 4Q’18
($million) Weighted Av. No. of shares (in millions) 1,014
Earnings per share $1.18
Includes $0.1bn in
currency translation
gains following disposal Includes $0.8bn deferred tax
of MacSteel benefits recorded mainly in
(723) Luxembourg on expected higher
future profits
227 (140)
(215)
29
1,951
(556) 620
Related to
acquisition of 1,193
ILVA and ILVA 1,042 Primarily
remedies
MTM on
MCB 573
EBITDA D&A Impairment Exceptional Operating Income Net interest Forex Pre-tax Taxes and Net income
net of items income from expense and other income non-
purchase investments fin. result controlling
gains interests
324Q 2018 EBITDA to free cashflow
FCF positive $1.0bn
($million)
(211)
430
(1,156)
2,170
1,951
1,014
EBITDA Change in Other Cash flow from Capex Free cash flow
working financing operations
capital* costs
* Change in working capital: cash movement in trade accounts receivable plus inventories less trade and other accounts payable
333Q’18 v 4Q’18 Net debt
Net debt declined – September 30, 2018 vs. December 31, 2018
($million)
32 37
1,014
Includes
699 $0.1bn forex
gain
10,516
10,196
Primarily includes $1bn
investment for the Uttam
Galva and KSS Petron debts,
offset by MacSteel disposal
($0.2bn)
Net debt at Free cash flow M&A Minority dividends Forex and other Net debt at
Sept 30, 2018 Dec 31, 2018
34FY 2018 EBITDA to net results
Healthy net results for the full year 2018
BASIC EPS 2018
($million) Weighted Av. No. of shares (in millions) 1,015
Include $0.6bn for
Earnings per share $5.07
acquisition of ILVA and
ILVA remedies and
remedy package required
Includes income from
for Votorantim acquisition Includes $0.8bn
(2,799) Calvert and Chinese
deferred tax benefits
investees and
Erdemir dividend recorded mainly in
Luxembourg on
expected higher
(810) 652 (615) future profits
(117)
(1,595)
10,265 168
BF dismantling in Florange
($0.1bn); new CLA in US Primarily forex and MTM on
(including signing on bonus) 6,539 MCB partially offset by
($0.1bn); settlement fees premium on early repayment 5,149
($0.1bn); offset in part by $0.2bn
4,981
of bonds
PIS/Cofins tax credits in Brazil
EBITDA D&A Impairment Exceptional Operating Income Net interest Forex Pre-tax Taxes and Net income
net of items income from expense and other income non-
purchase investments fin. result controlling
gains interests
35FY 2018 EBITDA to free cashflow
FCF positive $0.9bn despite $4.4bn investment in working capital in 2018
($million)
(4,384)
10,265 (1,685)
(3,305)
4,196
891
EBITDA Change in Other Cash flow from Capex Free cash flow
working financing operations
capital* costs
* Change in working capital: cash movement in trade accounts receivable plus inventories less trade and other accounts payable
36FY 2017 v FY 2018 Net debt
Net debt stable - December 31, 2017 vs. December 31, 2018
($million)
76
119
101
226
891
423
10,142 10,196
Primarily includes $1bn
investment for the Uttam
Galva and KSS Petron debts,
offset by MacSteel disposal
($0.2bn) and sale of
tangibles assets ($0.2bn)
Net debt at Free M&A ArcelorMittal Dividend Minority Forex Net debt at
Dec 31, 2017 cash flow Share buy paid to AM dividends and other Dec 31, 2018
back shareholders 37Liquidity and debt maturity
Investment grade rated by all three rating agencies
Liquidity at Dec 31, 2018 ($bn) Debt maturities at Dec 31, 2018 ($bn)
7.9
Other loans
Cash 2.4 1.0 Commercial paper
1.3
Bonds
0.3
1.3 0.5 0.2
Unused credit lines 5.5
1.9
1.5 0.3 1.6
1.3
0.9
0.5
Liquidity at 2019 2020 2021 2022 2023 ≥2024
Dec 31, 2018
Liquidity lines Debt Maturity: Ratings*:
• $5.5bn lines of credit refinanced with • Continued strong liquidity • S&P: BBB-, stable outlook
5 year maturity Dec 19, 2023
• Average debt maturity →
• Moody’s: Baa3, stable outlook
4.0 years
• Fitch: BBB-, stable outlook
*Investment grade credit rating upgrades: S&P in February 2018, Moody’s in June 2018 and Fitch in July 2018
38STEEL INVESTMENTS
39Indiana Harbor - USA Footprint
Footprint optimization complete
• Current configuration uncompetitive structural
changes required across all cost elements
• #1 aluminize, 84” hot strip mill (HSM), #5 continuous
galvanizing line (CGL), and steel shop No.2 now idled;
all planned asset consolidation now complete
• Investments totalling ~US$200m:
• New caster at No.3 steelshop installed &
commissioned 4Q’16 and restoration of 80” hot strip
mill and IH finishing complete
• Project completed in 2018
No. 3SP: New #2 Caster
Indiana Harbor Plant 80”HSM: 5 Walking Beam Furnace No. 3SP: New #23SP:
No. Caster
Newcommissioning
Downcomer
40Kryvyi Rih – New LF&CC 2&3
Kryvyi Rih investments to ensure sustainability & improve productivity
• Facilities upgrade to switch from ingot to continuous casting
route; additional billets capacity of 290kt/y
• Industrial target:
• Step-by-step steel plant modernization with state-of-art
technology
• Product mix development
• Supportive target:
• Cost reduction
• Billet quality improvement for sustaining customers
• Better yield and productivity
• Project completion expected in 2019
Construction
site of LF&CC
2&3
41ArcelorMittal Poland Sosnowiec Wire Rod Mill
Long products strategy to grow HAV
• Sosnowiec is a double strand rolling mill located in Sosnowiec, Poland.
• The investment will introduce new and innovative techniques for the
production of high quality wire rod for high demanding applications
(automotive app., steel cords, welding wires, cold heading screws,
suspension springs, special ropes)
• Investment features and benefits:
• Splitting intermediate mill stands / new motors / drives avoiding twisting
• Modernized finishing blocks for rolling speed increasing up to 100m/s
• New state of art air distribution system and ring distributor
• New water boxes with accurate process control
• Reduced tensile strength variation, improved grain size/ surface quality
• Scope of equipment to be installed in WRM Sosnowiec in 2018:
• New guiding equipment for finishing blocks, new water boxes (traversing
type), new laying heads (new type), new fans for air cooling conveyors, new
air distribution system for fans, new automation control system for water
boxes and fans (water and air cooling)
• Project completion expected in 2019
42Dofasco - Hot strip mill modernisation
Investments to modernize strip cooling & coiling flexibility to produce full range of target products
• Replace existing three end of life coilers with two state
of the art coilers and new runout tables. The strip
cooling system will be upgraded and include
innovative power cooling technology to improve
product capability
• Benefits of the project will be:
• Improved safety
• Increased product capability to produce higher
value products
PROJECT: HSMM
• Cost savings through improvements to coil quality, DATE: OCTOBER 2018
unplanned delay rates, yield and improved energy IMAGE: COILER AND INSPECTION AREA CIVIL CONSTRUCTION
efficiency
• Project completion expected in 2020
43Burns Harbour – Walking beam furnaces
Expands surface capability to provide sustained automotive footprint
• Install 2 latest generation walking beam furnaces,
including recuperators & stacks, building extension &
foundations for new units
• Benefits associated to the project:
• Hot rolling quality and productivity
• Sustaining market position
• Reducing energy consumption
• Project completion expected in 2021
44MACRO HIGHLIGHTS
45Regional inventory
Inventory levels in key regions in line with historical averages
German inventories (000 Mt)* US service centre total steel inventories (000 Mt)
(latest data point: Dec-2018) 5.0 (latest data point: Dec-2018)
1,400 Germany Stocks 13,000 3.4
4.0 USA (MSCI)
Months supply (RHS) 3.2
1,200 Months Supply (RHS)
11,000 3.0
3.0
1,000 2.8
9,000
800 2.0 2.6
7,000 2.4
600 1.0
2.2
400 0.0 5,000 2.0
Brazil service centre inventories (000 Mt) China service centre inventories** (Mt/mth) with ASC%
Flat stocks at service centres Flat and long (latest data point: Dec-2018)
1,400 (latest data point: Dec-2018) 7.0
25 50%
Months Supply (RHS)
1,200 6.0 20 40%
1,000 5.0
15 30%
800 4.0
10 20%
600 3.0
400 2.0 5 10%
200 1.0 0 0%
* German inventories seasonally adjusted **Source: WSA, Mysteel, ArcelorMittal Strategy estimates
46Chinese exports
Chinese exports declined 8% YoY to 70Mt in 2018
(latest data point: Jan-2019)
12
Exports of steel products
Imports of steel products
10
Net-trade
8
6
4
2
0
-2
-4
2007 2008 2009 2010 2011 2012 2013 2014 2015 2016 2017 2018 2019
• Jan’19 finished steel exports of 6.2Mt up +11.0% MoM (Dec’18 at 5.6Mt)
• Jan’19 exports up +33.1% vs Jan’18 (4.7 Mt)
• 12M’18 finished steel exports of 70Mt down 8.0% vs 12M’17
Source: ArcelorMittal Corporate Strategy team analysis 47China addressing capacity issues
Supply side reform progressing – global overcapacity still a concern
• Chinese government committed to tackle overcapacity and
environmental issues
Target achieved to cut 140Mt
• Capacity reduction target met: 140Mt capacity cut achieved permanent capacity by end of
by end of 2018 2018
• Steel replacement policy in favour of EAF v BF; no new
capacity to be built → ratio 1:1 for EAF and 1:1.25 for BF-
BOF
• Industry operating at high rates of capacity utilisation → Additional ~120Mt illegal
higher domestic steel spreads induction furnace capacity
closed
• Stronger domestic fundamentals plus global trade restrictions
→ reduced incentive to export
• 3yr Blue Sky Campaign (2018-2020) with stringent emissions
standards
• Winter capacity constraints supporting fundamentals through Steel exports reduced
seasonally weaker demand period; delayed start in 2018, but
overall expectation that 2018/2019 policy will be broadly
similar YoY
48INDUSTRY LEADERSHIP
49Leadership through innovation continues
R&D strength to drive innovation and maintain industry leadership position
Revolutionary technology in Carbon
Steligence®: A radical new concept for
Capture & Utilization (CCU) to convert
the use of
BF carbon gas into bioethanol
steel in construction
• In partnership with LanzaTech, €150m project
• Aims to deliver significant architectural and
in Gent, Belgium, broke ground Jun’18 with
sustainability benefits to construction
commissioning expected in mid 2020
customers
• Significant potential to revolutionize blast
• Awarded the Steelie in the ‘Excellence in Life
furnace carbon emissions capture and
Cycle Assessment’ category in October 2018
support decarbonization of the transport
sector
Automotive: Recognized leader
by automotive customers
• Consistently ranked #1 in technology
by the majority of OEMs
• Addressing automotive platforms of
the future with new projects for rapidly
growing Electric Vehicle (EV) market
50Industry Leadership: Automotive
Global leader in automotive steel and solutions
• 2018 R&D spend $0.3bn
• Automotive R&D ~1/3 of this budget
• 1,400 full time researchers
• 10 worldwide research centres in Europe / Americas
including 6 dedicated to automotive
• Majority of OEMs in EU & NAFTA rank ArcelorMittal #1
in Technology – Steel will remain key material for the
body structure application
• Leader in AHSS* in both EU & NAFTA with the broadest
12-15
portfolio of AHSS grades
• Achieved significant recognition from automakers for
commitment to innovation, performance, quality and
supplier diversity:
• (Ford; Honda R&D Americas Award; GM Supplier IMPACT
Diamond Award; GM Supplier Quality Excellence for AM/NS
Calvert; Nissan’s Supplier Diversity Award; and Automotive World’s first inner & outer door ring system – a co-engineering feat
between ArcelorMittal, Honda R&D Americas and Magna - unveiled
News’ PACE Award Finalist for inner and outer door ring at WCX18 for 2019 Acura RDX
system in 2019 Acura RDX
ArcelorMittal Tailored Blanks Division produced 2 millionth door
ring on Oct. 26, 2018
*AHSS: Advanced High Strength Steels
51Industry Leadership: Steligence®
A radical new concept for the use of steel in construction
• Steligence® is based on extensive scientific research,
independently peer-reviewed
• Makes the case for a holistic approach to construction
that breaks down barriers, encouraging collaboration
between construction industry professionals
• Designed to resolve the competing demands of
creativity, flexibility, sustainability and economics
• Delivers efficiencies, benefits and cost savings to
architects, engineers, construction companies, real
12-15
estate developers, building owners, tenants and urban
planners
• Will facilitate the next generation of high performance
buildings and construction techniques, and create a
more sustainable life cycle for buildings
• Our new Headquarters building is designed to
showcase the Steligence® concept
52Industry Leadership: Transformation technologies
Technology to potentially revolutionise the capture of BF carbon gas and convert it into bioethanol
• €150million project between ArcelorMittal & LanzaTech in Gent, Belgium, broke ground June 2018
• Technology to potentially revolutionise the capture of BF carbon gas and convert it into bioethanol
• Licensed by LanzaTech, a proprietary microbe feeds on carbon monoxide to produce bioethanol, to be used as
transport fuel or potentially in the production of plastics
• Annual production of bioethanol from this demonstration expected to reach around 80m litres, which will yield an
annual CO2 saving equivalent to 600 flights from London to New York
• The new installation will create up to 500 construction jobs over the next two years and 20 to 30 new permanent
direct jobs. Commissioning and first production is expected by mid-2020
12-15
53AUTO
54No1 in automotive steel: Maintaining leadership position
Group continues to invest and innovate to maintain leadership
• ArcelorMittal is the global leader in steel for automotive with S-in motion®
strongest position in Europe and North America
• Global R&D platform provides a material competitive
advantage
• Proven record of developing new products and affordable
solutions to meet OEM targets
• Advanced high strength steels used to make vehicles lighter,
safer and stronger
• Automotive business backed with capital with ongoing
investments in product capability and expanding our
geographic footprint: AM/NS Calvert
• AM/NS Calvert JV: Enhancing our NAFTA automotive
franchise
• VAMA JV in China: Auto certifications progressing
• Dofasco: Galvanizing line expansion
• Europe: AHSS investments
55Global presence and reach
Global supplier with increasing emerging market exposure
Locations, by region
Automotive production facilities
Alliances & JV
Commercial teams
R&D centers
Vehicle production 2018
by region
> 20 M veh
> 15 M veh & < 20 M veh
> 10 M veh & < 15 M veh
> 5 M veh & < 10 M veh
> 2.5 M veh & < 5 M veh
> 1 M veh & < 2.5 M veh
> 1 M veh & 0.1 M veh
< 0.1 M veh
Source: LMC figures for Western and Eastern Europe and Russia; IHS figures for all other regions; personal cars and light commercial vehicles < 6t
NB: Middle East & North Africa region: Iran, Uzbekistan, Kazakhstan, Morocco, Egypt
South East Asia region: Indonesia, Philippines, Thailand, Vietnam, Pakistan 56Automotive growth in developed world
North American production at healthy levels,
EU28 & Turkey production with modest growth
North America and EU28 + Turkey vehicles production
million units
• North American production:
- modest decline in the short term
but still healthy production levels
- expected to regain the 17m unit
production level around 2022
driven by population growth,
portfolio expansion and
localization
• EU28 & Turkey production: modest
growth expected with uncertainty linked
to Brexit and US Tariffs
57Automotive emerging market growth
Strong growth expected in India, China and Brazil
China vehicle production (‘000s)
35,000 33,940
China
33,000 • China production to grow by ~26% by 2026
31,000
(from 27mvh in 2018 level 34mvh by 2026)
29,000
27,000
26,955 • India production to increase ~70% by 2026
25,000
(from 4.8mvh in 2018 to 8.2mvh in 2026)
Brazil, India & Russia vehicle production (‘000’s)
9,000 • Brazil production growth expected to
8,000 Russia India Brazil 8,230
7,000
continue and reach 3.9mvh in 2026 (~40%)
6,000
5,000 4,754
4,000
3,952 • Russia production is expected to recover
3,000
2,748
2,000 2,395 and reach 2.4mvh in 2026 (~46%)
1,000 1,635
0
Source: IHS 58ArcelorMittal S-in motion®
Demonstrating the weight saving potential of new products
› ArcelorMittal generic steel solutions include BIW, closures, chassis parts and seats
S-in motion® S-in motion® S-in motion® S-in motion® S-in motion® S-in motion® S-in motion® S-in motion® S-in motion®
ICE C-Segment Electric Plug-in Hybrid D-Segment Mid-size Mid-size Light Pick-up Truck
C-Segment C-Segment EU market Sedan SUV Commercial Trucks Cabs
NA market
-70kg (-18%) vs -60kg (-15%) vs -50 kg (-16%) vs -98 kg (-25%) vs -86 kg (-23%) vs -102 kg (-20%) -45kg (-20%) -174 kg (-23%) -54 kg (-17%)
current ICE current ICE current PHEV BIW and closures current Mid-size vs current SUV About 140 parts vs current vs current
baseline baseline baseline current baseline sedan baseline baseline upgraded Pick-up baseline cab baseline
Twist beam Suspension Control arms Front subframes Pick-up frame NA rear subframe Front seat
Up to 17% of -4 kg (-18%) Up to 26% of potential Up to 15% -55 kg (-23%) vs -5.9 kg (-20%) vs -2 kg (-18%) vs
mass-savings for using flat and weight-savings of mass-savings current Pick-up current D-segment current C-segment
C-segment long products on C-segment frame baseline baseline seat baseline
vehicles vehiclesContinuous innovation
Steel to remain material of choice for automotive
Jet Vapor Deposition (JVD) line : Jetgal ® Steel remains material of choice
• JVD line is a breakthrough technology to
produce Jetgal®, a new coating for AHSS steels
for automotive industry
New press hardenable steels (PHS) Usibor®2000 &
Ductibor®1000
• Bring immediate possibilities of 10% weight
saving on average compared to conventional
coated PHS produced by ArcelorMittal
• Electric vehicles (EV) to favour lightweight
3rd Generation AHSS products (CR/GI/GA) designs (similar to traditional vehicles)
980HF & 1180HF • EV employ AHSS to achieve range goals
• HF / Fortiform® provide additional weight
reduction due to enhanced mechanical properties
compared to conventional AHSS
The mass-market Tesla Model 3 body and
chassis is a blend of steel and aluminium,
Electrical steels
unlike the Tesla Model S which is an aluminium
iCARe®, 2nd Generation body (Source: Tesla website+)
• Family of electrical steels for electrified powertrain
+ https://www.tesla.com/compare
optimization and enhanced machine performance,
Save*, Torque** and Speed*** are specifically http://automotive.arcelormittal.com/ElectricVehiclesImpactOnSteel
designed for a typical electric automotive
application.
* Save (Steels with very low losses): Ideal for the efficiency of the electrical machine. Their key role is maximize the use of the current coming from the battery.
** Torque (Steels with high permeability): They achieve the highest levels of mechanical power output for a motor or current supply for a generator
*** Speed (Steels for high speed rotors): Specific high strength electrical steels which maintain high level of magnetic performance. They allow the machine to be more compact and have a higher power density. 60
-Continued investment in R&D
Supports portfolio of next generation auto steels
Fortiform® Third-generation UHSS for cold
MartINsite® A family of cold rolled fully
stamping. Fortiform® and HF steel martensitic steels with current
HF Grades grades allow OEMs to realize tensile strengths from 900 to 1700
lightweight high-strength structural MPa. ArcelorMittal’s MartINsite®
elements using cold forming cold roll family of fully martensitic
methods such as stamping. steels is perfect for anti-intrusion
Commercially launched in Europe parts such as bumper and door
in 2014 and available in North beams. Some are also available
America at Calvert in with an electrogalvanized
coating or with Jetgal®.
Press hardenable steels (PHS) / hot JVD is a breakthrough process, In
Usibor® 2000 stamping steels offer strengths up to JVD -Jetgal® production and product
development.
2000 MPa. Usibor® 2000 and
Ductibor®1000 Ductibor® 1000 can also be combined Jetskin® Jetgal® : JVD zinc coating applied
thanks to laser welded blanks (LWB) to steel grades for the automotive
to reduce weight while achieving industry. Developed for steels
optimal crash behavior. Both currently including UHSS Fortiform®;
available in Europe; Usibor® 2000 is Jetskin® : JVD zinc coating
commercially available in Europe and applied to steel grades for
available for qualification testing in industrial applications such as
North America; Ductibor® 1000 is household appliances, doors,
commercially available in Europe and drums and interior building
North America applications.
612019 Chevy Silverado
reduces weight and increases strength with AHSS
• Chevrolet claims its all-new 2019 Silverado is 450 pounds (204 kg)
lighter, supported by extensive use of mixed materials.
• For example, a higher-grade alloy is used in the
roll-formed, high-strength-steel bed floor,
contributing to a bed that is more functional
and lighter weight.
• The safety cage features significant use of
advanced high strength steels, each
tailored for the specific application.
“This use of mixed materials and advanced
manufacturing is evident throughout the
Silverado, resulting in a significant reduction
in total vehicle weight and improved
performance in many measures.”
Source: Chevrolet’s press release about its all-new Silverado, December 2017.
62Automotive Industry Leadership
Audi switched back to steel for its new A8 model
• Audi switched back to steel
for its 2018 A8 model, with a
body structure made up of
more than 40% steel
including 17% PHS
New Audi A8 2018 model
“There will be no cars made of aluminium alone in the future.
Press hardened steels (PHS) will play a special role in this development.
PHS grades are at the core of a car’s occupant cell, which
protects the driver and passengers in case of a collision.
If you compare the stiffness-weight ratio,
PHS is currently ahead of aluminium.”
Dr Bernd Mlekusch, head of Audi’s Leichtbauzentrum
63Volvo XC40
2018 European Car of the Year, makes use of AHSS and boron steels for safety
Hot-formed boron steel accounts for 20% of the XC40’s total body weight
• The safety cage around the occupants of Volvo’s new XC40 is almost entirely
made from steel including hot-formed boron grades.
• The steel cage provides maximum occupant protection in all types of crash
scenarios.
Volvo Car Group President & CEO Håkan AHSS makes up most of the XC40’s safety cage
Samuelsson at the European Car of the [Images courtesy Volvo Car Group]
Year award ceremony
64RAM pick-up truck
2019 Dodge RAM 1500 frame uses 98% high-strength steel
• “New (Ram 1500) frame features
98% high-strength steel to improve
durability, weight, and rigidity for
improved handling.”
“The new 2019 Ram includes 54% AHSS in the
truck bed and cab, and 98% in the frame, and is
credited with a 225 lb. (102 kg) weight savings
overall, along with 25% fuel economy and 20%
towing capacity improvements,” Mike Manley,
head of Ram brand during 2019 NAIAS press
conference
Source: RAM 1500 announcement
65VAMA greenfield JV facility in China
Well positioned to supply growing Chinese auto market
VAMA: Valin ArcelorMittal Automotive target
• State-of-the-art production facility capacity of 1.5Mt
areas and markets
• Well-positioned to serve growing automotive market
FAW-VW &
• VAMA has successfully completed homologation on UHSS/AHSS BMW
with most key auto OEMs Daimler &
Nissan
Latest developments 2018:
Beijing
• VAMA top products (Usibor® 1500, Ductibor®500, DP980 and
DP780) are approved by large number of end users and sold to
Tier 1 stamper market.
• Overall positive progress in product development and
Geely, VW, GM, KIA,
homologation by auto OEMs. VAMA started series supply of BYD, Changan,
SAIC & Chery
Suzuki, CFMA &
exposed products since 2017Q4 FAW-VW Shanghai
• VAMA received Best Supplier award from International & local Changfeng, Fiat,
stamper DPCA, Dongfeng,
VAMA Honda, JMC & Suzuki
Loudi
SAIC, Toyota, GM,
Honda, Nissan & BYD Guangzhou
• Central office in Changsha with satellite offices in proximity
to decision making centers of VAMA’s customers
Furnace of CGL and CAL on both sides VAMA HQ in Loudi city, Hunan Province
BYD: Build Your Dreams; CFMA: Changan Ford Mazda Automobile; SAIC: Shanghai Automotive Industry Corporation; JMC: Jiangling Motors Corporation 66GROUP HIGHLIGHTS
67Group performance FY18 v FY17
Improved performance driven by positive price-cost effect offset by lower volumes
• Crude steel production decreased by 0.6% to 92.5Mt with decreases in ACIS (-
EBITDA ($ Millions) and EBITDA/t
11.3%, due to operational disruptions in Ukraine and Kaz.) and NAFTA (-3.9%, $102/t $133/t $96/t $99/t $122/t
including BF reline delay in Mexico), offset in part by Brazil (+9.4%, scope effect of
Votorantim) and Europe (2.1%, scope effect of ILVA). +22.1%
• Steel shipments for FY18 were 83.9Mt, - 1.6% vs FY17, primarily due to lower steel -28.5%
shipments in ACIS (-10.3%) offset in part by Brazil (+5.8%, including Votorantim), 10,265
8,408
NAFTA (+1.0%) and Europe (+0.2%, including Ilva offset by impact of a flood in 2,141 2,729 1,951
Asturias (Spain), power outage in Fos (France) and slower ramp-up after BF reline in FY17 FY18
4Q17 3Q18 4Q18
Poland).
• Steel shipments for FY18 excl. Votorantim (in 2Q18) and Ilva (in 4Q18) were 82.5Mt, Average steel selling price $/t
-3.0% vs. FY17, driven by lower ACIS shipments (-10.3%) and Europe (-1.2%), +13.5%
offset in part by Brazil (+0.5%) and NAFTA (+1.0%).
-1.4%
• Sales for FY18 increased by 10.7% to $76bn, primarily due to higher average selling
709 779 768 682 775
prices (ASP) (+13.5%) offset in part by lower steel shipments (-1.6%).
• Impairment charges net of purchase gains for FY2018 were $810m (include $0.7b
primarily related to Ilva and the remedy asset sales for the Ilva acquisition and 4Q17 3Q18 4Q18 FY17 FY18
Votorantim remedies). Exceptional items for FY18 were charges of $117m: $113m in Steel shipments (000’t)
charges related to a BF dismantling in Florange (France), $60m in charges related to
-1.5% -1.6%
the new collective labour agreement in the US (including a signing bonus), a $146m
provision taken in 1Q18 in respect of a litigation case that was paid in 3Q18 offset in
part by PIS/Cofins tax credits related to prior periods recognized in Brazil of $202
20,996 20,538 20,236 85,242 83,854
million.
• EBITDA up 22.1% primarily driven by improved operating conditions (positive price-
cost effect), offset by the impact of lower market priced iron ore prices.
4Q17 3Q18 4Q18 FY17 FY18
68Group performance 4Q18 v 3Q18
Performance declined primarily driven by lower volumes
• Crude steel production decreased by 2.2% to 22.8Mt with decreases in ACIS (-
EBITDA ($ Millions) and EBITDA/t
16.4%, due to operational disruptions in Kazakhstan) and NAFTA (-12.2%, $102/t $133/t $96/t $99/t $122/t
including BF reline delay in Mexico), offset in part by Europe (6.8%, scope effect of
ILVA) +22.1%
• Total steel shipments in 4Q18 were 1.5% lower at 20.2Mt primarily due to lower -28.5%
steel shipments in ACIS (-10.6%, impacted by operational issues in Temirtau, 10,265
2,729 8,408
Kazakhstan), NAFTA (-6.2%) and Brazil (-1.4%), offset in part by a 4.0% 2,141 1,951
improvement in Europe (due Ilva acquisition consolidated Nov 1, 2018). Excluding FY17 FY18
the impacts of Ilva, steel shipments were 4.2% lower as compared to 3Q18
4Q17 3Q18 4Q18
• Sales in 4Q18 declined 1.0% to $18.3bn primarily due to lower steel shipments (- Average steel selling price $/t
1.5%) and lower ASP (-1.4%), offset in part by higher market-priced iron ore +13.5%
shipments (+16.8%)
-1.4%
• Impairment charges net of purchase gains for 4Q18 and 3Q18 were $215m and
709 779 768 682 775
$509m, respectively, and primarily relate to Ilva and the remedy asset sales for the
Ilva acquisition
4Q17 3Q18 4Q18 FY17 FY18
• Exceptional gains for 4Q18 were $29m primarily related to $202 million for
PIS/Cofins tax credits related to prior periods recognized in Brazil, offset in part by Steel shipments (000’t)
$113m in charges related to a BF dismantling in Florange (France), and $60m
-1.5% -1.6%
related to the new collective labour agreement in the US (including a signing
bonus).
• EBITDA declined 28.5% primarily due lower volumes 20,996 20,538 20,236 85,242 83,854
4Q17 3Q18 4Q18 FY17 FY18
69NAFTA performance 4Q18 v 3Q18
Performance declined due to lower steel shipments and negative price-cost effect
EBITDA ($ Millions) and EBITDA/t
• Crude steel production decreased by 12.2% to 5.0Mt in 4Q18, $57/t $135/t $96/t $78/t $112/t
primarily due to market slowdown and blast furnace reline delay
in Mexico +45.1%
-33.2%
• Steel shipments in 4Q18 decreased by 6.2% to 5.2Mt, primarily
due to seasonality and weak market conditions in the US 2,471
744 1,703
292 497
• Sales in 4Q18 decreased by 9.5% to $4.9bn, primarily due to 4Q17 3Q18 4Q18 FY17 FY18
lower steel shipments and lower ASP -1.5% (flat products down
-0.7% and long products down -4.0%) Average steel selling price $/t
+14.8%
• Exceptional charges for 4Q18 were $60m primarily related to -1.5%
the new collective labour agreement in the US (including a
signing bonus) 852
748 896 882 742
• EBITDA in 4Q18 decreased by 33.2% to $496m, primarily due
to lower steel shipment volumes and negative price-cost effect 4Q17 3Q18 4Q18 FY17 FY18
Steel shipments (000’t)
-6.2% +1.0%
5,150 5,512 5,173 21,834 22,047
4Q17 3Q18 4Q18 FY17 FY18
70NAFTA
Improvement
leading producer with 28.1Mt /pa installed capacity
Crude steel achievable capacity (million Mt)
16.3 100.0%
Flat 82.0%
Flat
6.2 5.6
Long Long 18.0%
USA Canada Mexico NAFTA
Number of facilities (BF and EAF)
NAFTA No. of BF No. of EAF
USA 7 2
Canada 3 4
Mexico 1 4
Total 11 10
Note: IH Bar facility closed in June 2015; Georgetown wire rod facility closed in August 2015, Vinton and LaPlace sold in 2Q 2016 71Brazil performance 4Q18 v 3Q18
Performance declined primarily due to a negative price-cost effect
EBITDA ($ Millions) and EBITDA/t
• Crude steel production increased by 1.0% to 3.2Mt in 4Q18 $112/t $144/t $92/t $91/t $134/t
• Steel shipments in 4Q18 decreased by 1.4% to 3.1Mt, driven +55.4%
by seasonally weak domestic demand -37.2%
• Sales in 4Q18 increased by 15.5% to $2.4bn, due to the 445 990
1,538
341 280
negative impact of hyperinflation accounting in Argentina in
3Q18 (recorded as a nine-month year-to-date accumulated 4Q17 3Q18 4Q18 FY17 FY18
impact), offset in part by lower ASP (-3.7%) and lower steel
shipments (-1.4%). Average steel selling price $/t
+7.7%
• Exceptional gain for 4Q18 was $202m related to PIS/Cofins tax -3.7%
credits related to prior periods recognized in Brazil.
685 714 687 667 719
• EBITDA in 4Q18 decreased by 37.2% to $280m, primarily due
to a negative price-cost effect. 4Q18 includes a one-time
provision of $17 million for employee related charges in Brazil. 4Q17 3Q18 4Q18 FY17 FY18
Steel shipments (000’t)
-1.4% +5.8%
3,052 3,097 3,053 10,840 11,464
4Q17 3Q18 4Q18 FY17 FY18
72You can also read