Aditya Mittal, President and CFO - 14 May 2019
←
→
Page content transcription
If your browser does not render page correctly, please read the page content below
ArcelorMittal Vega

                                         Aditya Mittal, President and CFO
                                                                 14 May 2019

                     Highly Restricted                                         0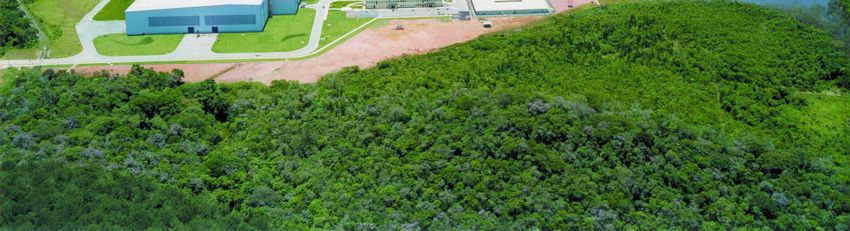
Disclaimer
Forward-Looking Statements
This document may contain forward-looking information and statements about ArcelorMittal and its subsidiaries. These statements
include financial projections and estimates and their underlying assumptions, statements regarding plans, objectives and
expectations with respect to future operations, products and services, and statements regarding future performance. Forward-
looking statements may be identified by the words “believe”, “expect”, “anticipate”, “target” or similar expressions. Although
ArcelorMittal’s management believes that the expectations reflected in such forward-looking statements are reasonable, investors
and holders of ArcelorMittal’s securities are cautioned that forward-looking information and statements are subject to numerous
risks and uncertainties, many of which are difficult to predict and generally beyond the control of ArcelorMittal, that could cause
actual results and developments to differ materially and adversely from those expressed in, or implied or projected by, the forward-
looking information and statements. These risks and uncertainties include those discussed or identified in the filings with the
Luxembourg Stock Market Authority for the Financial Markets (Commission de Surveillance du Secteur Financier) and the United
States Securities and Exchange Commission (the “SEC”) made or to be made by ArcelorMittal, including ArcelorMittal’s latest
Annual Report on Form 20-F on file with the SEC. ArcelorMittal undertakes no obligation to publicly update its forward-looking
statements, whether as a result of new information, future events, or otherwise.

Non-GAAP/Alternative Performance Measures
This document includes supplemental financial measures that are or may be non-GAAP financial/alternative performance
measures, as defined in the rules of the SEC or the guidelines of the European Securities and Market Authority (ESMA). They may
exclude or include amounts that are included or excluded, as applicable, in the calculation of the most directly comparable financial
measures calculated in accordance with IFRS. Accordingly, they should be considered in conjunction with ArcelorMittal's
consolidated financial statements prepared in accordance with IFRS, including in its annual report on Form 20-F, its interim financial
reports and earnings releases. Comparable IFRS measures and reconciliations of non-GAAP/alternative performance measures
thereto are presented in such documents, in particular the earnings release to which this presentation relates.

                                                                                                                                         1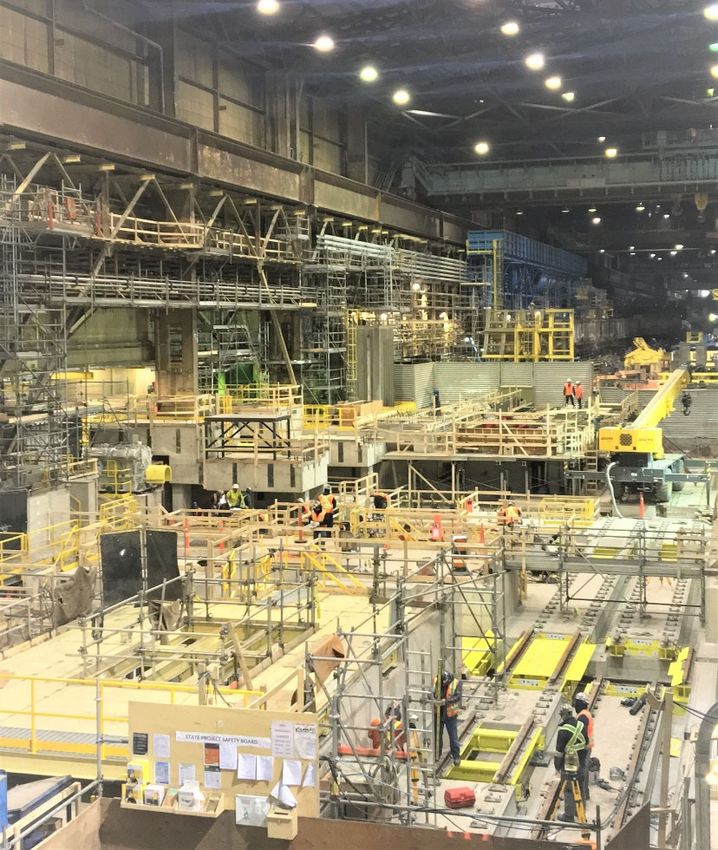
Safety is our priority
LTIF* rate

                                                                                                                           Health & Safety performance

                                                                                                                           • LTIF rate of 1.14x (including ArcelorMittal Italia)**
  3.1                                                                                                                      • The Company’s efforts to improve the Group’s
                                                                                                                             Health and Safety record will continue

                2.5                                                                                                        • The Company is focused on further reducing the
                                                                                                                             rate of severe injuries and fatality prevention

                              1.9
                                             1.8
                                                                                                                                                                          ArcelorMittal
                                                                                                                                                                    Incl. ArcelorMittal Italia
                                                           1.4
                                                                                                                                                                              1.14
                                                                          1.0
                                                                                       0.85           0.85          0.81           0.82          0.78
                                                                                                                                                                0.69

                                                                                                                                                                                           ArcelorMittal
                                                                                                                                                                              0.66       Excl. ArcelorMittal
                                                                                                                                                                                                Italia

 2007         2008           2009          2010           2011          2012           2013          2014           2015          2016           2017          2018          1Q19

  * LTIF = Lost time injury frequency defined as Lost Time Injuries per 1.000.000 worked hours; based on own personnel and contractors; A Lost Time Injury (LTI) is an incident that causes an
 injury that prevents the person from returning to his next scheduled shift or work period. ** ArcelorMittal Italia previously known as ILVA. LTIF excluding ArcelorMittal Italia of 0.66x in 1Q’19 vs.
 0.70x in 4Q’18 and 0.62x in 1Q’18. From 1Q’19 onwards, the methodology and metrics used to calculate health and safety figures for ArcelorMittal Italia have been harmonized with those of
 ArcelorMittal.                                                                                                                                                                                           2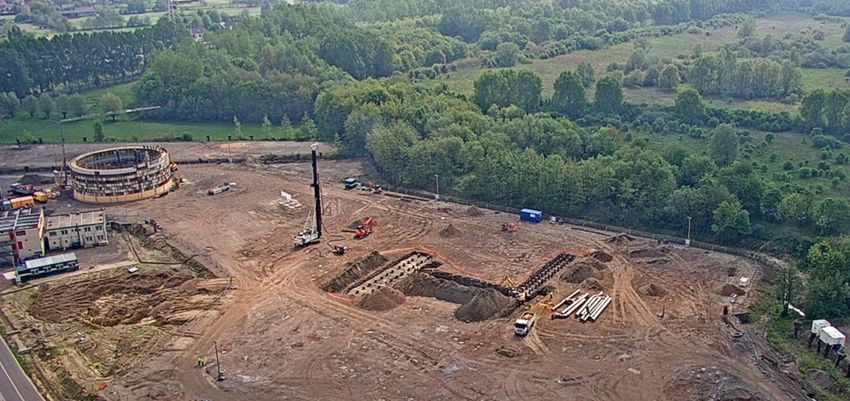
Sustainable Development – key to our resilience
Driven by our vision to make steel the material of choice for the low carbon and circular economy

   Board oversight                      • Board oversight of Sustainable Development via ARCGS*

                                        • Focus on continual energy efficiency improvements; technology innovation and policy
                                          engagement to create the conditions enabling us to meet Paris agreement objectives.
   Carbon strategy
                                        • Towards low-emissions steelmaking with circular carbon, carbon capture, hydrogen and
                                          electrolysis technologies

                                        • Completed independent pre-audit against ResponsibleSteel - a multistakeholder standard
        Customer
                                          due to be launched at the end of 2019
       reassurance
                                        • Providing customers new levels of complete mine-to-metal reassurance

* ARCGS refers to appointments, remuneration, corporate governance and sustainability committee.                                 3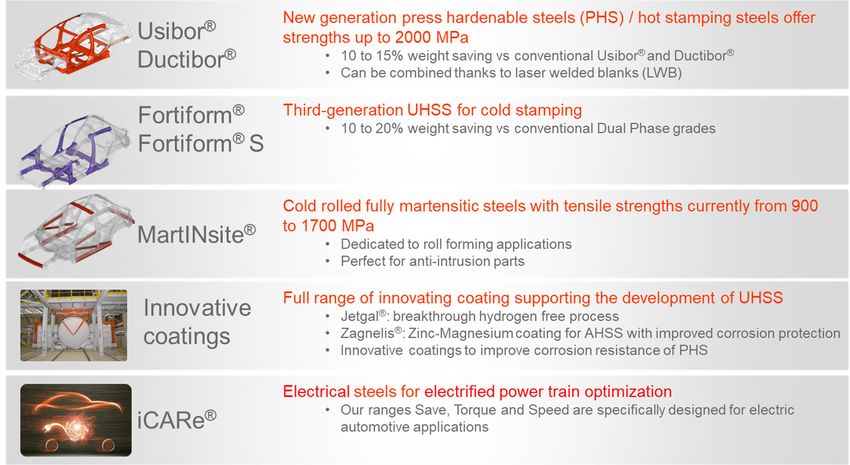
PATHWAY TO SUSTAINABLE VALUE CREATION

                                        4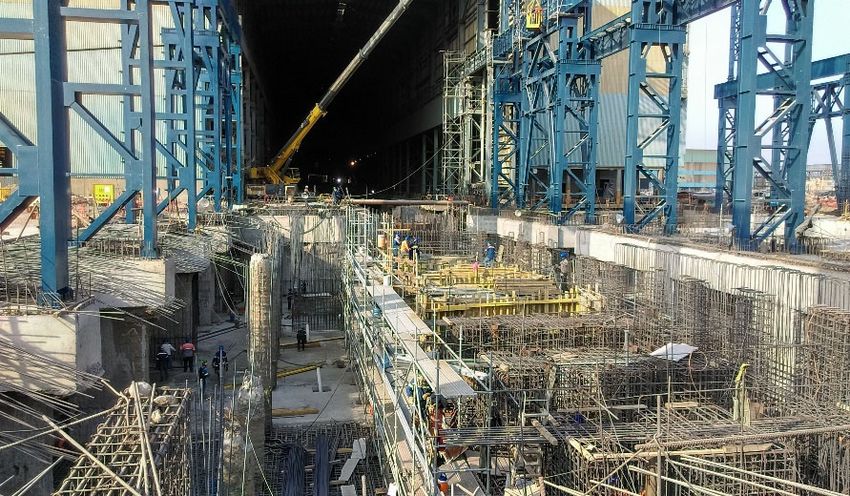
A structurally improved China steel industry
   Supply side reform has led to healthier China steel capacity utilisation levels

                                      China steel capacity utilisation rates based on installed crude steel capacities*, %

100%
                                                                   Pre-crisis health        Post crisis weakness             Recovery to health

90%

80%

70%

60%

50%
             2000 2001 2002 2003 2004 2005 2006 2007 2008 2009 2010 2011 2012 2013 2014 2015 2016 2017 2018

* Installed capacity includes idled capacity, excludes mothballed capacity
Source: ArcelorMittal Corporate Strategy team analysis                                                                                            5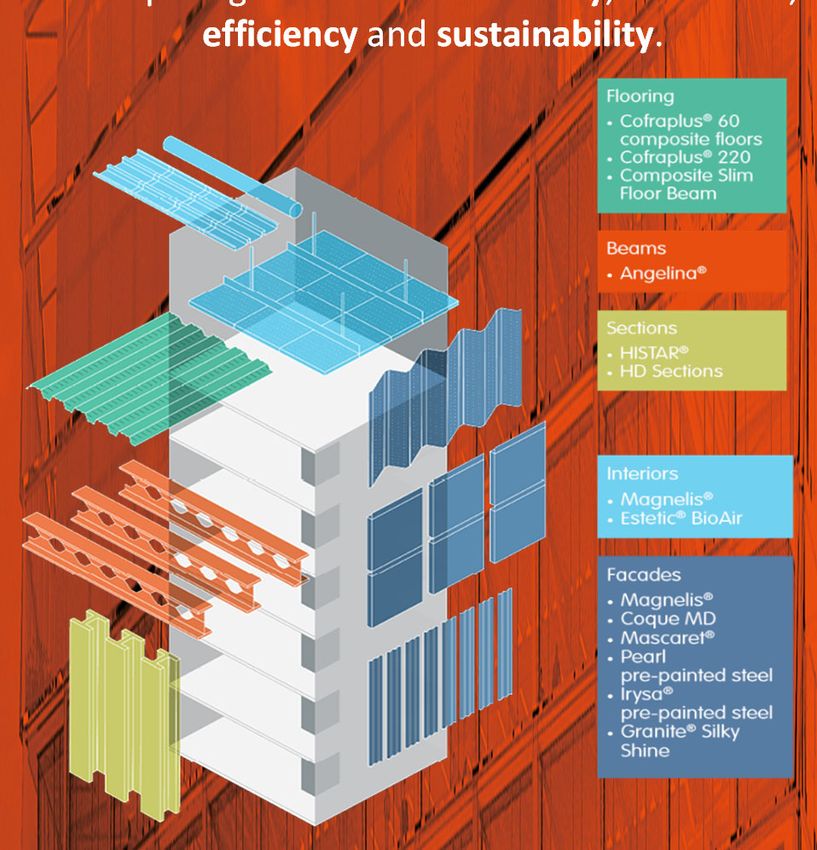
Ex-China flat steel utilisation healthy
     Flat steel capacity ex-China now at 80-85% utilisation rates

                                Ex-China flat steel capacity utilisation rates based on installed crude steel capacities*, %

90
                                                            Pre-crisis health             Post crisis weakness                 Recovery to health

85

80

75

70

65

0
 2000 2001 2002 2003 2004 2005 2006 2007 2008 2009 2010 2011 2012 2013 2014 2015 2016 2017 2018

* Installed capacity includes idled capacity, excludes mothballed capacity
Source: ArcelorMittal Corporate Strategy team analysis                                                                                              6
A structurally improved balance sheet
  Investment grade balance sheet to minimise cost of interest and optimise FCF conversion

                   Dramatically stronger balance sheet                                                             Structurally supports EBITDA conversion to FCF

                         Net financial debt evolution ($bn)                                                                               Net interest costs ($bn)

 21.8                                                                                                           1.9          1.8
            16.1 15.8 15.7                                                                                                                1.5
                                                                                                                                                       1.3
                                                                                                                                                                    1.1
                                            11.1 10.1 10.2
                                                                                                                                                                                0.8
                                                                                        6.0                                                                                                  0.6

  2012       2013      2014       2015       2016      2017       2018                Target*                   2012         2013         2014        2015         2016         2017         2018

  • Investment grade (with stable outlook) from all 3                                                 • Lower net debt means lower interest costs and
    major credit rating agencies secured in 2018                                                        improved FCF conversion
  • Net debt targeted at a level that supports                                                        • Improved credit profile and IG rating supports
    investment grade metrics even at the lowest points                                                  competitive incremental financing costs
    of the cycle
* The adoption of IFRS 16 leases increased net debt by $1.2bn to the reported $11.2bn as of March 31, 2019. Accordingly, the net debt target has been adjusted to $7bn to reflect this accounting change.   7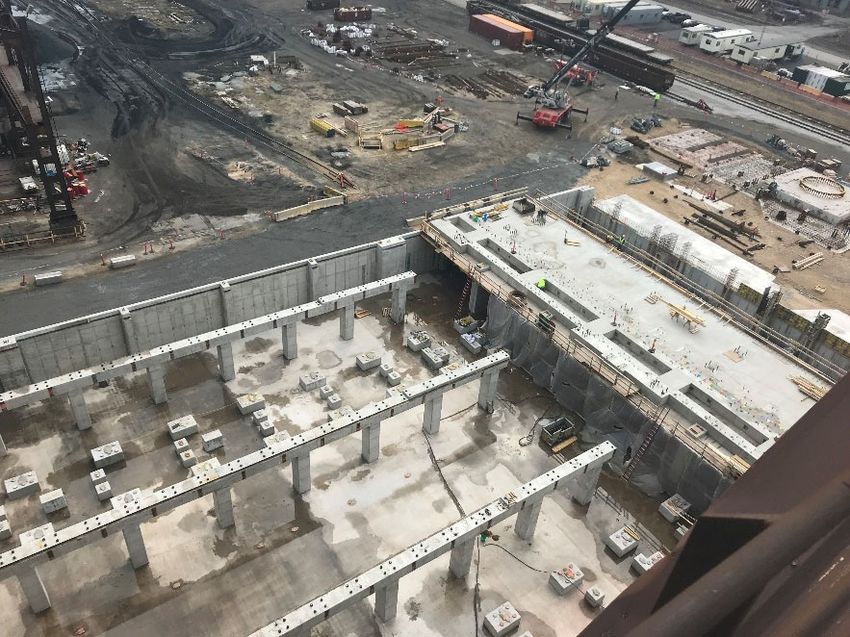
Positive on the structural industry outlook
Global steel industry continues to benefit from supply side reform
China HRC prices and “spreads” recovering Europe – China HRC price differential exceptionally low
China HRC domestic (incl. VAT) spread over China domestic (excl. VAT) Southern Europe HRC vs China FOB export differential ($/t)*
RM basket ($/t)
700 300 240
600
600 532 250 180
500 200
219 120
400 181 150
China price $/t (LHS) 60
300 China steel spread (RHS)
100
200 50 0
1Q15
2Q15
3Q15
4Q15
1Q16
2Q16
3Q16
4Q16
1Q17
2Q17
3Q17
4Q17
1Q18
2Q18
3Q18
4Q18
1Q19
1-Jan
7-Jan
14-Jan
21-Jan
28-Jan
4-Feb
11-Feb
18-Feb
25-Feb
4-Mar
11-Mar
18-Mar
25-Mar
1-Apr
8-Apr
15-Apr
22-Apr
29-Apr
-60
1Q06
2Q06
3Q06
4Q06
1Q07
2Q07
3Q07
4Q07
1Q08
2Q08
3Q08
4Q08
1Q09
2Q09
3Q09
4Q09
1Q10
2Q10
3Q10
4Q10
1Q11
2Q11
3Q11
4Q11
1Q12
2Q12
3Q12
4Q12
1Q13
2Q13
3Q13
4Q13
1Q14
2Q14
3Q14
4Q14
1Q15
2Q15
3Q15
4Q15
1Q16
2Q16
3Q16
4Q16
1Q17
2Q17
3Q17
4Q17
1Q18
2Q18
3Q18
4Q18
1Q19
Apr-19
May-19
• China operating with higher levels of capacity • Rising China domestic/export prices not yet reflected
utilisation in our core markets
• Supporting improved steel spreads and positive • Europe-China price differential unusually low despite
earnings required to deleverage and invest in the safeguard measures now in place
environmental improvement • This disconnection does not typically have duration
* Updated to May 3, 2019
8
Sustainable free cash flow to support returns
Positioning the business to deliver consistent positive FCF
• $1.4bn still to be achieved out of $3bn
Action2020 target
• ArcelorMittal Italia synergies and turnaround
EBITDA a significant improvement opportunity
$2bn
• Mexico + Brazil mix improvement represents
~$350mn annual FCF
• Deleveraging to continue to reduce net
interest costs
Cash needs
• Normalised capex +/-$1bn lower than 2019
levels
Increased
returns to
• Targeting ~$4bn net debt reduction to
achieve target of $7bn
shareholders
Balance sheet • $1bn of “excess” working capital to be
released in 2019 with further optimisation
potential
9Positioned to Deliver Value
Global diversified industry leader focussed on maximising per-share value
• Unique global portfolio ArcelorMittal
Secure position in mature developed markets High-growth, with attractive Access to
• Industry leader in product and (with growth exposure e.g. Mexico) with
emphasis on HAV leadership
market structure and gradual
evolution towards HAV
growth
markets
process innovation
• Action2020 plan to structurally
EUROPE
improve profitability
BRAZIL
NAFTA
INDIA
ACIS
• Investing with focus and discipline
in high return opportunities
• Investment grade balance sheet
Mining
(capturing the full value-in-use chain)
• Progressively returning cash
Investment Grade Balance Sheet
10CAPITAL ALLOCATION
11Capital allocation to support strategic goals
Building strong foundations for future returns
Building the strongest platform for consistent capital returns to shareholders
Targeting $7bn net debt*– a level of debt
Resilient
Robust balance sheet that should support positive FCF** and IG
credit metrics at all points of the cycle platform
Whilst investing in high-return
To grow FCF
Invest in strengths opportunities with focus and strict
discipline potential
Progressively increase base dividend with
Returns to Consistently
a commitment to returning a percentage
shareholders of FCF on attainment of debt target return cash
* Previous target of $6bn adjusted to reflect impact of IFRS 16 ** Free cash flow refers to cash flow from operations less capex 12Mexico: HSM project
High return mix improvement with future optionality
Project summary: US$1.0bn 3Yr investment commitment
Construction of a new 2.5Mt hot strip mill
• HSM project to optimize capacity and improve mix
$1bn project initiated in 4Q’17; expected completion in 2020 (Mt) ASC (Million tonnes; flat products)
New 2.5Mt hot strip mill to increase share of domestic market (domestic 20 17.2 16.6
15.7 16.2
HRC spreads are significantly higher vs. slab exports) 15
John Deere India54%
Includes investments to sustain the competitiveness of mining operations 52% 50% 50%
10
and modernizing its existing asset base
5
• ArcelorMittal Mexico highly competitive low cost domestic slab Share captured by Imports
• Growth market, with high import share 0
2015 2016 2017 2018
Mexico is a net importer of steel (50% flat rolled products import share)
ASC estimated to grow 2.0% CAGR 2015-25; growth in non-auto +2.2%,
supported by industrial production and public infrastructure investment
• Potential to add $250 million in EBITDA on completion
Project status:
• Deep foundations complete; structural fabrication progressing on plan
• Main and auxiliary equipment arriving on site
• Installation of reheat furnace commenced / civil work continues, recovery
plan ongoing including second shift and additional workforce
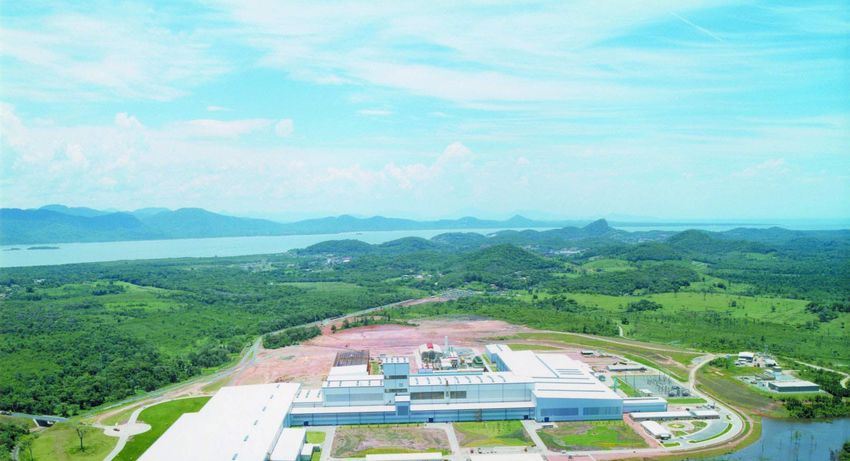
13Brazil: Vega high added value capacity expansion
High return mix improvement in one of the most promising developing markets
Project summary: 3Yr investment to expand rolling capacity →
increase Coated / CRC capacity and
• HAV expansion project to improve mix construction of a new 700kt continuous
Completion expected 2021 with total capex spend of ~$0.3bn annealing line (CAL) and
John continuous
Deere India galvanising
combiline (CGL)
Increase Galv/CRC capacity through construction of 700kt continuous
annealing and continuous galvanising combiline
Optimization of current facilities to maximize site capacity and
competitiveness; utilizing comprehensive digital/automation technology
To enhance 3rd generation AHSS capabilities and support our growth in
automotive market and value added products to construction
• AM Vega highly competitive on quality and cost, with strategic location and
synergies with AM Tubarão
• Investment to sustain ArcelorMittal Brazil growth strategy in cold rolled and
coated flat products to serve domestic and broader Latin American markets
• Strengthening ArcelorMittal’s position in key markets as automotive and
construction through value added products
• Potential to add >$100mn to EBITDA
14Votorantim consolidates our position in Brazil longs
Multi-year acquisition project concluded in April 2018
• Culmination of a multi-year process that began in 2014
Creating the new market leader in Brazil longs
• Consolidating the Brazil long products market
• ArcelorMittal now the #1 long products producer with
annual crude steel capacity of 5.1Mt.
Minas Gerais
• Acquired production facilities are geographically
complementary, enabling higher service level to Monelevade
customers, economies of scale, higher utilization and
Juiz de Fora
efficiencies.
Rio de Janeiro
• ~$110m of identified synergies on track to be fully Sao Paulo
captured in 2019 Piracicaba
Current status:
Resende plant Barra Mansa plant
• Reinforced positioning on construction sector,
increasing market share
• Synergies and saving from headcount reduction,
operational KPIs improvements and procurement
renegotiation
Resende Barra Mansa
15ArcelorMittal Italia turnaround to restore tier-1 status
Multi-year acquisition project concluded in November 2018
• Improvement plan: ArcelorMittal Italia capex commitment to 2024 (€ bn)
• Ramp-up to 6Mt run-rate (previously expected by 2H’19) has been
slowed down due to weak market conditions Environmental capex
includes: €0.3bn stock
• Focus on improved quality and service pile coverage; €0.2bn at
coke ovens; €0.2bn
• Capture identified synergies (€310m) and realise asset’s potential waste water treatment; 2.40
€0.3bn environmental
remediation* 0.30 2.10
Focus on:
1.25
• Health & safety: 1.15
• Completed audit on FPS in Taranto, Genova, Novi; implementing new Industrial capex
includes annual
monitoring activities; developing H&S mindset across the plant maintenance
• LTIF rate still considerably behind group average, so improvement still Enviromental Industrial Total capex Riva funds Net capex
necessary utilised
• Investment program underway:
• Met the April 30 deadline to complete the coverage of the first three
modules corresponding to 50% of the mineral park
• Environmental interventions are progressing in line with the accelerated
timetable
Progress at the raw material stock yard
• Restarting of the first galvanizing line of the cold rolling mill after 12
months of stop
*€0.3bn environmental remediation (clean-up) will be financed with funds seized from the Riva Group 16Essar: Adding a new high-growth pillar
Essar brings scale, turnaround opportunity and growth optionality
• Essar provides ArcelorMittal an opportunity to buy a producing,
Essar Steel main production
profitable, cash generating asset at below replacement costs facilities at Hazira, Gujarat;
10Mtpa nominal capacity (current
• ArcelorMittal received approval for acquisition of Essar*
production 6.5Mtpa)
• Upfront payment of $5.7bn** to ESIL creditors with a further
$1.1bn** capital injection into the business to kickstart
turnaround
• ArcelorMittal aims to increase shipments to 8.5Mt in medium
term, with long term target of 12-15Mt through additional
brownfield capacity expansion
• Iron ore pelletising integration in East India provides optionality:
14Mtpa pellet capacity → currently being expanded to 20Mtpa
• ArcelorMittal & NSSMC to finance their “India JV” through
combination of partnership equity (1/3) and debt (2/3)
• Investment in the “India JV” expected to be equity accounted
• Transaction closing expected 2Q 2019 / 3Q 2019
1 2 3 4 5
One of the largest single Service centres in
Complete basket of flat Access to Port
High quality raw material Largest pellet capacity in India location for flat steel in India competitive locations
steel produtcs
* In-line with Essar Steel India Limited’s (ESIL) corporate insolvency process, the Company’s Resolution Plan must now be formally accepted by India’s National Company Law Tribunal
(‘NCLT’) before completion **at 73.2 Indian rupees / $1 . 17OUTLOOK
18Global steel demand expected to grow in 2019
ArcelorMittal and World Steel Association (WSA) forecast 2019 v 2018
EU28
US
ArcelorMittal CIS China
ArcelorMittal
‐1.0% to 0.0% ArcelorMittal
+0.5% to +1.5% ArcelorMittal
WSA +1.0% to +2.0%
WSA 0.0% to +1.0%
+0.3% WSA
+1.3% WSA
+1.4%
+1.0%
World ex‐China
Brazil ArcelorMittal
ArcelorMittal +1.0% to +2.0%
+3.0% to +4.0% WSA
WSA ‐ Central & South America +1.7%
+3.6%
World
ArcelorMittal
+1.0% to +1.5%
WSA
+1.3%
Source: ArcelorMittal Corporate Strategy estimates; World Steel association (WSA) Short range outlook, April 2019 19Position to Deliver Value
Global diversified industry leader focussed on maximising per-share value
• Unique global portfolio ArcelorMittal
Secure position in mature developed markets High-growth, with attractive Access to
• Industry leader in product and (with growth exposure e.g. Mexico) with
emphasis on HAV leadership
market structure and gradual
evolution towards HAV
growth
markets
process innovation
• Action2020 plan to structurally
EUROPE
improve profitability
BRAZIL
NAFTA
INDIA
ACIS
• Investing with focus and discipline
in high return opportunities
• Investment grade balance sheet
Mining
(capturing the full value-in-use chain)
• Progressively returning cash
Investment Grade Balance Sheet
20Responding to weak European flat market
Lacklustre demand and increased imports negatively impacting market
Elevated imports in to Europe – annualized HRC imports, Mt
ArcelorMittal Flat Europe
Basis for 12.0 cutting production
Safeguards
by 3Mt annualized rate
8.6 9.0
7.8 8.3 8.6 8.3
7.0
4.8 5.2 – Idling Krakow (Poland)
4.1
– Reducing production at Asturias (Spain)
– Slowing down ramp-up at Taranto (Italy)
2012 2013 2014 2015 2016 2017 2018 2019 Jan- Feb- Mar-
quota* 19 19 19**
• HRC imports in to Europe are running higher YoY
• HRC safeguards not effective given lack of country-
specific measurement
* Quota period from 1.7.2019 to 30.6.2020; ** March 2019 data preliminary 21APPENDIX
22Appendix
• SECTION 1 | Trade.……………………………………………………………………. 24
• SECTION 2 | Financials and liquidity……………………………………………....... 28
• SECTION 3 | Macro highlights..………………………………………………………. 35
• SECTION 4 | Industry leadership..……………………………………………………………. 39
• SECTION 5 | Auto………………………………………………….…………………... 43
• SECTION 6 | Steel investments……………………………………………………… 55
• SECTION 7 | Group highlights ………………………..…………………..………….. 60
23TRADE
24EU trade Comprehensive solution for unfairly trade imports required Trade cases (Flat steel): • All key flat rolled steel products Anti-dumping and countervailing duty cases have been implemented • Monitoring for unfairly traded imports ongoing Safeguard duties: • On January 17, 2019, EU Member states approved the European Commission’s (EC’s) final safeguard measures on steel with implementation to begin February 4, 2019 • Final measures include immediate “relaxation”, increasing quota by 5% (calculated on base years of 2015-2017), with further 5% relaxation in July 2019 and another 5% in July 2020 Quota relaxation can still be challenged/discussed with EC both by industry/users • Current quota levels are below 2018 levels; 5% quota relaxation in July 2019 and July 2020 • Final measure give country-specific quotas to main steel exporters to EU; remaining residual quote for other countries to be quarterly, however countries with own quota can consume residual quote once they have used up their own • Certain 'developing' countries with a share of imports of
Level playing field to avoid “carbon leakage”
Discussions on Carbon Inclusion Mechanism ongoing

                  Rationale                                         The proposal

 • ETS (Emission Trade System) growing
   restriction to CO2 allocations access
   significantly increasing price and affecting
   companies’ costs                                 • For Europe’s climate policy to be both
 • European steel players cannot pass-on their        effective and credible, a carbon neutral
   cost as it would cause lack of                     policy must avoid circumvention (“Carbon
   competitiveness vs. Non-EU players which           Leakage”).
   are not subject to ETS rules
                                                    • Realistic benchmarks based on verified
 • With higher costs, European players will
                                                      emissions should be applied.
   increase acquisition of slabs only relocating
   the CO2 generation to countries not subject      • To levy steel imports in to Europe with a
   to ETS, i.e., causing carbon leakage with no       CO2 cost in line with that incurred by
   significant impact to World’s CO2 emissions        domestic producers would equalise the
 • To level the playing field among European          conditions for local players and those
   players and foreign players selling in             exporting to Europe.
   Europe, CO2 costs should also be applied
   to imports

                                                                                                  26
US trade
Comprehensive solution for unfairly trade imports required
Trade cases:
• All key flat rolled steel products AD/CVD cases have been implemented.
• Anti-circumvention investigations initiated by DOC for CRC and CORE imports from China (through Vietnam); final affirmative
determination received May 17, 2018
• On June 12, 2018, the US industry filed anti-circumvention petitions with DOC for CRC and CORE imported from Korea and Taiwan
(through Vietnam).
Section 232 US:
• March 23, 2018: 25% tariffs imposed on all steel product categories began for most countries
• June 1, 2018: 25% tariffs imposed on steel products in Europe, Canada & Mexico (no change despite signing of USMCA trade
agreement) with the following exceptions:
• South Korea: Quota of 70% of 2015-2017 av. export volumes into US
• Brazil: Quota of 2015-2017 average export volumes into US - 70% for finished products; 100% for semi-finished products
• Argentina: Quota of 135% of 2015-2017 average exports
• Australia: completely exempt from tariffs and quotas
• August 30, 2018: Trump issued a proclamation whereby there is now a product exclusion request process in place for countries
where there is a quota, i.e. S. Korea, Argentina and Brazil
• Turkey: duties doubled to 50% from 25% due to currency devaluation
Canada and Mexico response to Section 232:
• Canada: 25% retaliatory tariffs on US imports for most steel products, Provisional safeguard measures announced on October 11,
2018 on 7 steel products (hot rolled, prepaint, rebar, wire rod, energy tubulars, plate and stainless wire)
• Mexico: 15-25% retaliatory tariffs on US imports for most steel products; Safeguard duties of 15% already in place for countries with
no free trade agreement
27FINANCIALS AND LIQUIDITY
281Q 2019 EBITDA to net results
Positive net income in 1Q 2019
BASIC EPS 1Q’19
($million) Weighted Av. No. of shares (in millions) 1,014
Includes IFRS 16
Earnings per share $0.41
impact Includes Erdemir
dividend declared
$93m and contribution
from Chinese investees
(733) and Calvert
Includes IFRS 16
impact
208 (161)
1,652 (150)
(231)
Related to the
remedy asset (171)
sales for the 769
ArcelorMittal Italia
acquisition
585
414
EBITDA D&A Impairment Operating Income from Net interest Forex Pre-tax Taxes and Net income
charges income investments expense and other income non-
fin. result controlling
interests
291Q 2019 EBITDA to free cashflow
FCF marginally positive despite $0.6bn investment in working capital
($million)
(553)
(128)
1,652
971 (947)
24
EBITDA Change in Net financial Cash flow from Capex Free cash flow
working cost, tax and operations
capital* others
* Change in working capital: cash movement in trade accounts receivable plus inventories less trade and other accounts payable
30IFRS 16 Leases
New IFRS 16 standard requires all operating leases to be recognised on balance sheet as debt
Net debt $m
• Balance sheet:
– Total assets increased under property, plant and equipment by
$1.2bn with corresponding liability shown as debt (short term
$0.3bn and long term $0.9bn) 11,133 11,159
– Net debt increased by $1.2bn
10,478 10,516
– Net debt target under capital allocation policy restated to $7bn
10,196 1,193
(from $6bn previously) to reflect this change
• Income statement:
– Positive EBITDA impact of $56m (majority in segment others) in 9,966
1Q 2019
– Net interest higher (new FY 2019 guidance of $0.65bn from
$0.6bn previously)
– Higher depreciation (new FY 2019 guidance of $3.1bn)
• Cash flow statement: 1Q’18 2Q’18 3Q’18 4Q’18 1Q’19
– The repayments of the principal portion of operating leases are
presented in financing activities (previously reported under IFRS 16 impact
operating activities)
Net debt excluding IFRS 16 impact
• The cash needs of the business remain unchanged at $6.4bn for FY
2019
31Net debt analysis
Net debt declined March 31, 2019 v December 31, 2018 excluding IFRS 16 impact
($million)
24 51
292
1,193 90 101
46
Includes rollover of
Indian rupee hedge
10,196 Dividends paid by 11,159
AMMC to POSCO
Net debt IFRS 16 Free ArcelorMittal M&A Minority Share Forex Net debt
at Dec impact cash flow Italia lease dividends buy back and other at Mar
31, 2018 payment 31, 2019
32Liquidity and debt maturity
Investment grade rated by all three rating agencies
Liquidity* at Mar 31, 2019 ($bn) Debt maturities at Mar 31, 2019 ($bn)
7.7
Other loans 0.6
Cash 2.2
Commercial paper
Bonds
1.1 0.5
0.6 0.3 3.3
Unused credit lines 5.5
1.8
1.5 1.3 1.5 0.3
0.6
Liquidity at 2019 2020 2021 2022 2023 ≥2024
Mar 31, 2019
Liquidity lines Debt Maturity: Ratings:
• $5.5bn lines of credit refinanced with • Continued strong liquidity • S&P: BBB-, stable outlook
5 year maturity Dec 19, 2023
• Average debt maturity →
• Moody’s: Baa3, stable outlook
4.9 years
• Fitch: BBB-, stable outlook
* Liquidity is defined as cash and cash equivalents plus available credit lines excluding back-up lines for the commercial paper program. 33Cash needs
Cash needs* to increase in 2019 largely due to increased capex spend on high return opportunities
• Cash needs to increase to $6.4bn in Below-EBITDA cash needs ($ billions)
2019 6.4
• The $1.4bn increase Vs. 2018 reflects:
1) $1bn increase in capex (including 1.5
5.0
$0.4bn carryover from 2018)
0.65
2) Cash taxes deferred from 2018 Taxes**, pension and other 1.1
3) Non recurrence of certain cash
Net interest 0.6
gains in 2018
• Unplanned working capital investment in
2018 is expected to be released in 2019 4.3
Capex 3.3
• As a result, Company should achieve
more significant net debt progress in
2019
2018 2019F
* Cash needs of the business consisting of capex, cash paid for interest and other cash payments primarily for taxes and excluding for these purposes working capital investment
** Estimates for cash taxes in 2019 largely reflect the taxable profits of 2018
34MACRO HIGHLIGHTS
35Regional inventory
Inventory levels in key regions in line with historical averages
German inventories (000 Mt)* US service centre total steel inventories (000 Mt)
13,000 (latest data point: Mar‐2019) 3.4
Germany Stocks (latest data point: Mar‐2019) 5.0
1,400 12,000 USA (MSCI) 3.2
Months supply (RHS)
4.0 11,000 Months Supply (RHS)
1,200 3.0
10,000
3.0 2.8
1,000 9,000
2.6
800 2.0 8,000
7,000 2.4
600 1.0
6,000 2.2
400 0.0 5,000 2.0
Brazil service centre inventories (000 Mt) China service centre inventories** (Mt/mth) with ASC%
Flat stocks at service centres
1,400 7.0 Flat and long
Months Supply (RHS) (latest data point: Mar‐2019) 25 (latest data point: Mar‐2019) 50%
% of ASC (RHS)
1,200 6.0 20 40%
1,000 5.0
15 30%
800 4.0
10 20%
600 3.0
400 2.0 5 10%
200 1.0 0 0%
* German inventories seasonally adjusted **Source: WSA, Mysteel, ArcelorMittal Strategy estimates
36Chinese exports
Chinese exports up Y-o-Y
• Apr’19 finished steel exports of 6.3Mt up stable MoM
• Apr’19 exports down 2% vs Apri’18 (6.5Mt)
• Jan–Apr 2019 YTD exports +8.0% above 2018 YTD
Source: ArcelorMittal Corporate Strategy team analysis 37China focussed on capacity issues
Global overcapacity still a concern
• Chinese government committed to tackle overcapacity and
environmental issues Permanent and illegal capacity targets in
2018 met though overcapacity still exists Permanent and illegal
capacity cuts achieved by
• Steel replacement policy in favour of EAF v BF; no new capacity end of 2018 overcapacity
to be built ratio 1:1 for EAF and 1:1.25 for BF-BOF* still exists
• Stronger domestic fundamentals plus global trade restrictions
reduced incentive to export; current exports levels picking up
• 3yr Blue Sky Campaign (2018-2020) - stringent emissions 2019 steel exports picking up
standards Apr’19 YTD exports +8.0%
YoY
• Winter capacity constraints supporting fundamentals through
seasonally weaker demand period; delayed start in 2018
2019
Constraints expected to
• Winter capacity constraints expected Oct/Nov’19 – Mar’20 - based restart Oct/Nov’19-Mar’20 on
on ‘one-mill-one-policy’ principle (less impactful as more steel one-mill-one policy;
mills achieve the ultra-low emission standard and become moderately less impactful
exempted)
* In the key regions (e.g. Jing-Jin-Ji, Fen-Wei area and Yangtze Delta Area, which take account 55% of overall crude steel capacity in China), 1:1 BF-BOF for non-key regions; ratio 1:1 for EAF no
matter where the facilities are located 38INDUSTRY LEADERSHIP
39Leadership through innovation continues
R&D strength to drive innovation and maintain industry leadership position
• Global 2018 R&D spend $0.3bn (Automotive ~1/3); 1,400 full time researchers; 10 research centres EU/Americas
• Majority EU/NAFTA OEMs rank ArcelorMittal #1 in Technology: Steel to remain material for body structure application
• Leader in AHSS in both EU & NAFTA with the broadest portfolio of AHSS grades
40Industry Leadership: Steligence®
A radical new concept for the use of steel in construction
Launched in June 2018 by ArcelorMittal Europe,
• Steligence® is based on extensive scientific Steligence® champions sustainable steel as the best in
research, independently peer-reviewed class solution for building materials. It addresses the
• Makes the case for a holistic approach to key issues in the construction sector including the
competing demands of flexibility, aesthetics,
construction that breaks down barriers,
efficiency and sustainability.
encouraging collaboration between construction
Product portfolio
industry professionals
• Designed to resolve the competing demands of
creativity, flexibility, sustainability and economics
• Delivers efficiencies, benefits and cost savings
12-15 to
architects, engineers, construction companies, real
estate developers, building owners, tenants and
urban planners
• Will facilitate the next generation of high
performance buildings and construction techniques,
and create a more sustainable life cycle for
buildings
• Our new Headquarters building is designed to
showcase the Steligence® concept
41Industry Leadership: Transformation technologies
Technology to potentially revolutionise the capture of BF carbon gas and convert it into bioethanol
• €150million project between ArcelorMittal & LanzaTech in Gent, Belgium, broke ground June 2018
• Technology to potentially revolutionise the capture of BF carbon gas and convert it into bioethanol
• Licensed by LanzaTech, a proprietary microbe feeds on carbon monoxide to produce bioethanol, to be used as
transport fuel or potentially in the production of plastics
• Annual production of bioethanol from this demonstration expected to reach around 80m litres, which will yield an
annual CO2 saving equivalent to 600 flights from London to New York
• The new installation will create up to 500 construction jobs over the next two years and 20 to 30 new permanent
direct jobs. Commissioning and first production is expected by mid-2020
12-15
42AUTO
43No1 in automotive steel: Maintaining leadership position
Group continues to invest and innovate to maintain leadership
• ArcelorMittal is the global leader in steel for automotive with S-in motion®
strongest position in Europe and North America
• Global R&D platform provides a material competitive
advantage
• Proven record of developing new products and affordable
solutions to meet OEM targets
• Advanced high strength steels used to make vehicles lighter,
safer and stronger
• Automotive business backed with capital with ongoing
investments in product capability and expanding our
geographic footprint: AM/NS Calvert
• AM/NS Calvert JV: Enhancing our NAFTA automotive
franchise
• VAMA JV in China: Auto certifications progressing
• Dofasco: Galvanizing line expansion
• Europe: AHSS investments
44Global presence and reach
Global supplier with increasing emerging market exposure
Locations, by region
Automotive production facilities
Alliances & JV
Commercial teams
R&D centers
Vehicle production 2018
by region
> 20 M veh
> 15 M veh & < 20 M veh
> 10 M veh & < 15 M veh
> 5 M veh & < 10 M veh
> 2.5 M veh & < 5 M veh
> 1 M veh & < 2.5 M veh
> 1 M veh & 0.1 M veh
< 0.1 M veh
Source: LMC figures for Western and Eastern Europe and Russia; IHS figures for all other regions; personal cars and light commercial vehicles < 6t
NB: Middle East & North Africa region: Iran, Uzbekistan, Kazakhstan, Morocco, Egypt
South East Asia region: Indonesia, Philippines, Thailand, Vietnam, Pakistan 45Automotive growth in developed world
North American production at healthy levels, EU28 & Turkey production with modest growth
North America and EU28 + Turkey vehicles production
million units
• North American production:
22.0 22.2
21.0
- modest decline in the short term
20.1
20.2
but still healthy production levels
20.0
19.0
- driven by population growth,
18.0
portfolio expansion and
17.2 localization
17.0
17.0
16.0 • EU28 & Turkey production:
15.0
- expect a modest growth with
14.0
uncertainty linked to Brexit and
US Tariffs
North America (IHS) EU28 +Turkey (IHS) EU28 +Turkey (LMC)
46Automotive emerging market growth
Strong growth expected in India, China and Brazil
China vehicle production (‘000s)
35,000
33,823
China • China production to grow by ~26% by
33,000
2026 (from 27mvh in 2018 level 34mvh
31,000
29,000
by 2026)
27,000 • India production to increase ~60% by
26,853
25,000 2026 (from 4.7mvh in 2018 to 7.7mvh in
2026)
Brazil, India & Russia vehicle production (‘000’s) • Brazil production growth expected to
9,000 continue and reach 3.97mvh in 2026
8,000 Russia India Brazil
7,680
7,000 (~40%)
6,000
5,000 4,720 • Russia production is expected to
4,000 3,970
3,000 2,780 recover and reach 2.2mvh in 2026
2,000
1,635
2,220 (~36%)
1,000
0
Source: IHS 47ArcelorMittal S-in motion®
Demonstrating the weight saving potential of new products
ArcelorMittal generic steel solutions include BIW, closures, chassis parts and seats
S-in motion® S-in motion® S-in motion® S-in motion® S-in motion® S-in motion® S-in motion® S-in motion® S-in motion®
ICE C-Segment Electric Plug-in Hybrid D-Segment Mid-size Mid-size Light Pick-up Truck
C-Segment C-Segment EU market Sedan SUV Commercial Trucks Cabs
NA market
-70kg (-18%) vs -60kg (-15%) vs -50 kg (-16%) vs -98 kg (-25%) vs -86 kg (-23%) vs -102 kg (-20%) -45kg (-20%) -174 kg (-23%) -54 kg (-17%)
current ICE current ICE current PHEV BIW and closures current Mid-size vs current SUV About 140 parts vs current vs current
baseline baseline baseline current baseline sedan baseline baseline upgraded Pick-up baseline cab baseline
Twist beam Suspension Control arms Front subframes Pick-up frame NA rear subframe Front seat
Up to 17% of -4 kg (-18%) Up to 26% of potential Up to 15% -55 kg (-23%) vs -5.9 kg (-20%) vs -2 kg (-18%) vs
mass-savings for using flat and weight-savings of mass-savings current Pick-up current D-segment current C-segment
C-segment long products on C-segment frame baseline baseline seat baseline
vehicles vehicles
48Continuous innovation
Steel to remain material of choice for automotive
Jet Vapor Deposition (JVD) line : Jetgal ®
• JVD line is a breakthrough technology to Steel remains material of choice
produce Jetgal®, a new coating for AHSS steels
for automotive industry
New press hardenable steels (PHS) Usibor®2000 &
Ductibor®1000
• Bring immediate possibilities of 10% weight
saving on average compared to conventional
coated PHS produced by ArcelorMittal
• Electric vehicles (EV) to favour
3rd Generation AHSS products (CR/GI/GA) lightweight designs (similar to traditional
980HF & 1180HF vehicles)
• HF / Fortiform® provide additional weight
• EV employ AHSS to achieve range goals
reduction due to enhanced mechanical properties
compared to conventional AHSS
The mass-market Tesla Model 3 body and
Electrical steels chassis is a blend of steel and aluminium,
iCARe®, 2nd Generation unlike the Tesla Model S which is an
• Family of electrical steels for electrified powertrain aluminium body (Source: Tesla website+)
optimization and enhanced machine performance,
Save*, Torque** and Speed*** are specifically + https://www.tesla.com/compare
designed for a typical electric automotive http://automotive.arcelormittal.com/ElectricVehiclesImpactOnSteel
application.
* Save (Steels with very low losses): Ideal for the efficiency of the electrical machine. Their key role is maximize the use of the current coming from the battery.
** Torque (Steels with high permeability): They achieve the highest levels of mechanical power output for a motor or current supply for a generator
49
-
*** Speed (Steels for high speed rotors): Specific high strength electrical steels which maintain high level of magnetic performance. They allow the machine to be more compact and have a higher power density.2019 Chevy Silverado
Reduces weight and increases strength with AHSS
• Chevrolet claims its all-new 2019 Silverado is 450 pounds (204 kg) lighter, supported by
extensive use of mixed materials.
• For example, a higher-grade alloy is used in the
roll-formed, high-strength-steel bed floor,
contributing to a bed that is more functional
and lighter weight.
• The safety cage features significant use of
advanced high strength steels, each
tailored for the specific application.
“This use of mixed materials and advanced
manufacturing is evident throughout the
Silverado, resulting in a significant reduction in
total vehicle weight and improved performance
in many measures.”
Source: Chevrolet’s press release about its all-new Silverado, December 2017.
50Automotive Industry Leadership
Audi switched back to steel for its new A8 model
• Audi switched back to steel
for its 2018 A8 model, with a
body structure made up of
more than 40% steel including
17% PHS
New Audi A8 2018 model
“There will be no cars made of aluminium alone in the future.
Press hardened steels (PHS) will play a special role in this development.
PHS grades are at the core of a car’s occupant cell, which
protects the driver and passengers in case of a collision.
If you compare the stiffness-weight ratio,
PHS is currently ahead of aluminium.”
Dr Bernd Mlekusch, head of Audi’s Leichtbauzentrum
51Volvo XC40
2018 European Car of the Year, makes use of AHSS and boron steels for safety
Hot-formed boron steel accounts for 20% of the XC40’s total body weight
• The safety cage around the occupants of Volvo’s new XC40 is almost entirely
made from steel including hot-formed boron grades.
• The steel cage provides maximum occupant protection in all types of crash
scenarios.
Volvo Car Group President & CEO Håkan AHSS makes up most of the XC40’s safety cage
Samuelsson at the European Car of the [Images courtesy Volvo Car Group]
Year award ceremony
52RAM pick-up truck
2019 Dodge RAM 1500 frame uses 98% high-strength steel
• “New (Ram 1500) frame features
98% high-strength steel to improve
durability, weight, and rigidity for
improved handling.”
“The new 2019 Ram includes 54% AHSS in
the truck bed and cab, and 98% in the frame,
and is credited with a 225 lb. (102 kg) weight
savings overall, along with 25% fuel economy
and 20% towing capacity improvements,” Mike
Manley, head of Ram brand during 2019
NAIAS press conference.
Source: RAM 1500 announcement
53VAMA greenfield JV facility in China
Well positioned to supply growing Chinese auto market
VAMA: Valin ArcelorMittal Automotive target
• State-of-the-art production facility capacity of 1.5Mt
areas and markets
• Well-positioned to serve growing automotive market
FAW-VW &
• VAMA has successfully completed homologation on UHSS/AHSS with BMW
most key auto OEMs
Daimler &
Nissan
Latest developments :
Beijing
• VAMA top products (Usibor® 1500, Ductibor®500, DP980 and DP780)
are approved by large number of end users and sold to Tier 1 stamper
market.
• Overall positive progress in product development and homologation by Geely, VW, GM, KIA,
auto OEMs. VAMA started series supply of exposed products since BYD, Changan,
SAIC & Chery
Suzuki, CFMA &
2017Q4 FAW-VW Shanghai
• VAMA has started development of Usibor®2000 and CP800.
Changfeng, Fiat,
• VAMA received Best Supplier award from International & local stamper DPCA, Dongfeng,
VAMA Honda, JMC & Suzuki
Loudi
SAIC, Toyota, GM,
Honda, Nissan & BYD Guangzhou
• Central office in Changsha with satellite offices in proximity
to decision making centers of VAMA’s customers
Furnace of CGL and CAL on both sides VAMA HQ in Loudi city, Hunan Province
BYD: Build Your Dreams; CFMA: Changan Ford Mazda Automobile; SAIC: Shanghai Automotive Industry Corporation; JMC: Jiangling Motors Corporation 54STEEL INVESTMENTS
55Kryvyi Rih – New LF&CC 2&3
Kryvyi Rih investments to ensure sustainability & improve productivity
• Facilities upgrade to switch from ingot to continuous casting
route; additional billets capacity of 290kt/y
• Industrial target:
• Step-by-step steel plant modernization with state-of-art
technology
• Product mix development
• Supportive target:
• Cost reduction
• Billet quality improvement for sustaining customers
• Better yield and productivity
• Project completion expected in 2019
Construction
site of LF&CC
2&3
56ArcelorMittal Poland Sosnowiec Wire Rod Mill
Long products strategy to grow HAV
• Sosnowiec is a double strand rolling mill located in Sosnowiec,
Poland.
• The investment is introducing new and innovative techniques
for the production of high quality wire rod for high demanding
applications (automotive app., steel cords, welding wires, cold
heading screws, suspension springs, special ropes)
• Phase 1 modernization has been done during the Nov 2018
stoppage. Then, the fine tuning has been done during the ramp
up phase which is today completed with a much better product
quality capability (narrow geometry dispersion and narrow
mechanical properties dispersion)
• Phase 2 modernization expected in Oct 2019 with focus on
volume productivity (+10%) and reliability via intermediate
stands and motors controlled by new automation system.
• Project completion expected end of 2019
57Dofasco - Hot strip mill modernization
Investments to modernize strip cooling & coiling flexibility to produce full range of target products
• Replace existing three end of life coilers with two state
of the art coilers and new runout tables
• Benefits of the project will be:
• Improved safety
• Increased product capability to produce higher
value products
• Cost savings through improvements to coil quality,
unplanned delay rates, yield and improved energy
efficiency
Current Status:
• Engineering and equipment manufacturing is complete.
• Construction activities for coiler are on track
• Runout table installation works originally scheduled for April
2019, will be effectively carried out during April 2020 shut
down due to change in design and delay in manufacturing
project completion will be now expected 2021
MARCH 2019 - COILER AND INSPECTION AREA
58Burns Harbour – Walking beam furnaces
Expands surface capability to provide sustained automotive footprint
• Install 2 latest generation walking beam furnaces,
including recuperators & stacks, building extension &
foundations for new units
• Benefits associated to the project:
• Hot rolling quality and productivity
• Sustaining market position
• Reducing energy consumption
• Project completion expected in 2021
59GROUP HIGHLIGHTS
60Group performance 1Q19 v 4Q18
Performance deteriorated driven by negative steel price-cost effect offset by higher volumes
• Crude steel production increased by 5.8% to 24.1Mt with NAFTA increases 7.2% EBITDA ($ Millions) and EBITDA/t
primarily in the US and following the restart of BF in Mexico. 1Q19 US production
increased despite being negatively impacted by power outage at Burns Harbour. Europe
$118/t $96/t $76/t
increased by 6.8% due in part to the ArcelorMittal Italia acquisition following its
consolidation as from Nov. 1, 2018; ACIS +11.7% primarily due to the restart of
operations in Temirtau (Kazakhstan) following an explosion at a gas pipeline in 4Q18;
offset in part by decreased Brazil production.
-15.3%
• Total steel shipments in 1Q 2019 were 7.9% higher primarily due to higher steel 2,512 1,951 1,652
shipments in Europe (+14.4%, due in part to full scope effect of ArcelorMittal Italia) and
NAFTA (+2.8%), offset in part by lower steel shipments in Brazil (-5.7%). Excluding
1Q18 4Q18 1Q19
ArcelorMittal Italia, steel shipments were 5.0% higher vs. 4Q18.
• Sales in 1Q19 were $19.2bn, +4.7% higher primarily due to higher steel shipments Average steel selling price $/t
(+7.9%) and higher seaborne iron ore reference prices (+15.2%), offset in part by lower
average steel selling prices (ASP) (-3.1%) and seasonally lower market-priced iron ore -3.1%
shipments (-8.2%).
• Impairment charges for 1Q19 were $150m related to the remedy asset sales for the
ArcelorMittal Italia acquisition. Impairment charges net of purchases gains for 4Q18 were 768 768 744
$215m and primarily related to ArcelorMittal Italia and the remedy asset sales for the
ArcelorMittal Italia acquisition 1Q18 4Q18 1Q19
• Operating income for 1Q19 was lower at $0.8bn vs $1.0bn in 4Q18 primarily driven by
weaker operating conditions (negative price-cost effect (PCE) in the steel segments) Steel shipments (000’t)
reflecting both the lagged impact of the decline in steel prices from 4Q18 and higher raw
material prices, offset in part by the impact of higher seaborne iron ore reference prices
+7.9%
and higher steel shipments.
• EBITDA declined 15.3% primarily due to negative PCE in NAFTA, Europe and ACIS
offset in part by positive PCE in Brazil and improved Mining segment. 21,349 20,236 21,826
1Q18 4Q18 1Q19
61NAFTA performance 1Q19 v 4Q18
Performance deteriorated driven by negative price-cost effect offset in part by higher steel volumes
• Crude steel production increased by 7.2% to 5.4Mt. This increase reflects higher EBITDA ($ Millions) and EBITDA/t
production in the US, despite c.100kt loss due to a power outage at Burns Harbor, $79/t $96/t $66/t
and to a much lesser extent the eventual restart of the blast furnace in Mexico
which had suffered delays following scheduled maintenance in 4Q’18. -29.6%
• Steel shipments in 1Q19 increased by 2.8% to 5.3Mt with improvements in the flat
business (+7.8%) offset by weaker long product shipments (-19.0%) , primarily in
Mexico due to less availability of material due to delayed restart of the blast 440 497
350
furnace as discussed above.
• Sales in 1Q19 increased by 4.7% to $5.1bn vs. $4.9bn in 4Q’18, primarily due to 1Q18 4Q18 1Q19
high steel shipments (+2.8%) offset in part by lower ASP (-0.9%, flat products
were down -2.3% whilst long products increased 1.7%). Average steel selling price $/t
• Exceptional charges for 4Q18 were $60m related to the new collective labour
agreement in the US (which included a signing bonus). -0.9%
• Operating income in 1Q19 of $216m was lower vs $310m in 4Q18 and $308m in
1Q’18. Operating results for 4Q18 were impacted by the exceptional charges as 779 882 874
discussed above.
• EBITDA in 1Q19 decreased by 29.6% to $350m primarily due to negative PCE 1Q18 4Q18 1Q19
offset in part by higher steel shipment volumes. EBITDA in 1Q19 was also
negatively impacted by $32m on account of the Burns Harbor power outage Steel shipments (000’t)
discussed above.
+2.8%
5,559 5,173 5,319
1Q18 4Q18 1Q19
62Improvement
NAFTA
Leading producer with 28.1Mt /pa installed capacity
Crude steel achievable capacity (million Mt) Geographical footprint and logistics
16.3 100%
Flat 82%
Flat
6.2 5.6
Long Long 18%
USA Canada Mexico NAFTA
Number of facilities (BF and EAF)
NAFTA No. of BF No. of EAF
USA 7 2
Canada 3 4
Mexico 1 4
Total 11 10
Note: IH Bar facility closed in June 2015; Georgetown wire rod facility closed in August 2015, Vinton and LaPlace sold in 2Q 2016 63Brazil performance 1Q19 v 4Q18
Performance improved driven by positive price-cost effect
• Brazil segment crude steel production decreased by 5.6% to 3.0Mt in 1Q19 EBITDA ($ Millions) and EBITDA/t
• Steel shipments in 1Q19 decreased by 5.7% to 2.9Mt, due to lower export $149/t $92/t $107/t
volumes for both flat and long products, partially offset by increased domestic
shipments of flat products.
+10.6%
• Sales in 1Q19 decreased by 11.2% to $2.2bn vs. $2.4bn in 4Q18, due to lower
steel shipments offset in part by 2.4% higher ASP (mainly due to improvement in 370
long products). 280 309
• Exceptional gain for 4Q18 was $202m related to PIS/Cofins tax credits related to
1Q18 4Q18 1Q19
prior periods recognized in Brazil.
• Operating income in 1Q19 was lower at $239m vs. $398m in 4Q’18 but higher Average steel selling price $/t
than $215m in 1Q18. Operating results for 4Q18 were impacted by the
exceptional gain as discussed above. Operating income in 1Q18 was impacted by +2.4%
impairment of $86m (Cariacica and Itaúna industrial plants in Brazil) related to the
agreed remedy package required for the approval of the Votorantim acquisition. 752 687 704
• EBITDA in 1Q19 increased by 10.6% to $309m primarily due to a positive PCE.
4Q18 included a one-time provision of $17m for employee related charges. 1Q18 4Q18 1Q19
Steel shipments (000’t)
-5.7%
2,483 3,053 2,880
1Q18 4Q18 1Q19
64Improvement
Brazil
Brazil leading producer with 13.7t /pa installed capacity
Crude steel achievable capacity (million Mt) Geographical footprint and logistics
12.3 100%
Flat Flat 54%
Monlevade
Long Long 46%
1.4 Tubarao
Votorantim
Juiz de Flora
Brazil Argentina Brazil Vega
Number of facilities (BF and EAF)
Acindar
No. of BF No. of EAF
BRAZIL facilities
Flat 3 -
Flat
Long 3 7 Long
Total 6 7
The map is showing primary facilities excl. Pipes and Tubes.
Note: The figures in the tables include Votorantim
65Europe performance 1Q19 v 4Q18
Performance deteriorated primarily driven by negative price-cost effect offset in part by higher volumes
• Europe segment crude steel production increased by 6.8% to 12.4Mt in 1Q19 due EBITDA ($ Millions) and EBITDA/t
in part to the ArcelorMittal Italia acquisition (consolidated as from Nov. 1, 2018). $98/t $74/t 41/t
• Steel shipments in 1Q19 increased by 14.4% to 11.6Mt. Excluding the impact of
ArcelorMittal Italia, steel shipments increased by 9%, but were 2.8% lower than
1Q 2018. -37.3%
• Sales in 1Q’19 were $10.5bn, 7.5% higher vs. $9.8bn in 4Q18, with higher steel
1,044
shipments, as discussed above, offset in part by 5.4% lower ASP (both flat and 749
470
long products declining).
1Q18 4Q18 1Q19
• Impairment charges net of purchase gains for 1Q19 and 4Q18 were $150m and
$215m, respectively, primarily relate to ArcelorMittal Italia acquisition and the Average steel selling price $/t
associated remedy asset sales for the ArcelorMittal Italia.
• Exceptional charges for 4Q18 were $113m related to a blast furnace dismantling -5.4%
in Florange (France). Exceptional charges for 1Q18 were $146m related to a
provision taken in respect of a litigation case that was paid in 3Q18. 801 771 729
• Operating income in 1Q19 was $11m vs. $98m in 4Q18 and $580m in 1Q18.
Operating results were impacted by impairment charges net of purchase gains 1Q18 4Q18 1Q19
and exceptional items as discussed above.
Steel shipments (000’t)
• Despite higher steel shipments, EBITDA in 1Q19 decreased by 37.3% to $470m
primarily due to negative price-cost effect. +14.4%
10,697 10,098 11,553
1Q18 4Q18 1Q19
66Europe
Improvement
Leading producer with ~51.4Mt /pa installed capacity
Crude steel achievable capacity (million Mt) Geographical footprint and logistics
51.4
Hamburg
100% Bremen EHS
Dabrowa
Duisburg
Ghent Krakow
Dunkirk Liège
Flat
Florange
Flat 76% Belval; Differdange
Zenica
Asturias Fos
ArcelorMittal Italia
Long Long 24%
Europe
Number of facilities (BF and EAF)
EUROPE No. of BF No. of EAF
EUROPE facilities
Flat (*) 21 5 Flat
Long
Long 1 8
Flat and Long
Total (*) 21 13
(*) Excludes 2BF’s in Florange
The map is showing primary facilities excl. Pipes and Tubes.
ArcelorMittal Italia consolidated from 1.11.18.
Number of BF/EAF table and crude steel achievable capacity include ArcelorMittal Italia and exclude remedy assets
67You can also read