Maryborough Water Supply Strategy 2010 - Fraser Coast ...
←
→
Page content transcription
If your browser does not render page correctly, please read the page content below
Maryborough
Water Supply
Strategy 2010

                1|Pa g e
TABLE OF CONTENTS
1.0       INTRODUCTION ............................................................................................................................. 3
1.1       Study Area .................................................................................................................................................. 3
2.0       OBJECTIVES.................................................................................................................................... 4
2.1       Objectives of the Study ............................................................................................................................... 4
2.2       Standards of Service.................................................................................................................................... 4
3.0       EXISTING SYSTEM .......................................................................................................................... 5
3.1       System Overview ........................................................................................................................................ 5
3.2       Bulk Supply System ..................................................................................................................................... 7
3.3       Distribution System..................................................................................................................................... 8
3.4       Reticulation Network .................................................................................................................................. 8
4.0       POPULATION PROJECTIONS AND WATER DEMAND ..................................................................... 10
4.1       Existing ED Demand .................................................................................................................................. 10
4.2       Future ED Demand .................................................................................................................................... 10
4.3       Demand Allocation ................................................................................................................................... 11
4.4       Demand Types .......................................................................................................................................... 11
4.5       Peaking Factors ......................................................................................................................................... 11
4.6       Diurnal Profiles ......................................................................................................................................... 12
5.0       RAW WATER SOURCE .................................................................................................................. 15
6.0       TREATMENT................................................................................................................................. 17
6.1       Teddington Water Treatment Plant ‐ Overview ......................................................................................... 17
7.0       TRUNK DISTRIBUTION.................................................................................................................. 20
7.1       Pump Stations ........................................................................................................................................... 20
7.2       Reservoirs ................................................................................................................................................. 21
8.0       DISCUSSION ................................................................................................................................. 24
8.2       Raw Water Pump station .......................................................................................................................... 25
8.3       Clear Water Pump Station Upgrade ........................................................................................................... 25
8.4       Treatment Capacity ................................................................................................................................... 25
8.5       Trunk Distribution ..................................................................................................................................... 26
8.5.1     Granville Security of Supply ................................................................................................................................ 26
8.5.2     Storage in Tinana DMA ...................................................................................................................................... 28
8.5.3     Elevated tanks in Maryborough ......................................................................................................................... 28
8.6       Reticulation .............................................................................................................................................. 29
8.7       DMA Boundaries ....................................................................................................................................... 30
8.8       Operational Issues .................................................................................................................................... 30
9.0       TIARO OVERVIEW ........................................................................................................................ 31
10.0      20 YEAR CAPITAL WORKS PROGRAM ........................................................................................... 33
10.1      Unit Rates for Water Mains ....................................................................................................................... 33
10.2      Proposed Capital Works Programme ......................................................................................................... 33
11.0 CONCLUSION ................................................................................................................................. 1
12.0 Recommendations ......................................................................................................................... 2
13.0 REFERENCES .................................................................................................................................. 3
APPENDIX 1 – CAPITAL EXPENDITURE PROGRAMME ................................................................................ 4
APPENDIX 2: TEDDINGTON WATER TREATMENT PLANT PROCESS REVIEW ............................................. 12
APPENDIX 2 – TIARO WATER SUPPLY 2010 REPORT ................................................................................ 12
APPENDIX 3 – WATER SOURCES .............................................................................................................. 13
APPENDIX 4 – WATER INFRASTRUCTURE ................................................................................................ 18

                                                                                                                                                           2|Pa g e
1.0     INTRODUCTION
This Water Supply Strategy’s main objective is to evaluate the existing water supply’s capacity to meet projected
population and water consumption forecasts and to identify infrastructure requirements to satisfactorily manage
these demands to the year 2031.

The primary objectives of this Report are to:

6     Assess the existing water supply demand based on recent flow data under the current demand management
      regimes;
6     Assess the projected demand to 2031 based on population projections that are consistent with Office of
      Economic and Statistical Research (OESR) projections;
6     Identify the capacity of the existing raw water sources and determine the most appropriate method of
      augmentation to meet community and demand growth if required;
6     Consider the impacts of climate change on potential raw water supplies;
6     Identify the future water treatment requirements for the Maryborough area and determine the most
      appropriate method of supply for treated water to the community;
6     Evaluate the impacts that the revised population projections and development sequencing will have on the
      major water supply infrastructure components (e.g. treatment plants, pump stations, reservoirs, trunk mains);
6     Allocate the revised water supply demands to an hydraulic model, identify where the system ‘fails’ and
      determine the most efficient options for augmentation;
6     Identify the additional water supply infrastructure options and appropriate construction timing required to
      deliver the desired Standards of Service (SOS) to Wide Bay Water Corporation customers;
6     Establish a preferred strategy from the options proposed for water supply infrastructure planning up to 2031;
6     Identify any areas that require further investigation.

1.1      Study Area

The study area incorporates all reticulated water supply networks located within the former Maryborough City
Council and Tiaro Shire Council local government areas, as controlled by Wide Bay Water Corporation. The study
area consists of Maryborough City and its environs and the town of Tiaro.

                                                                                                         3|Pa g e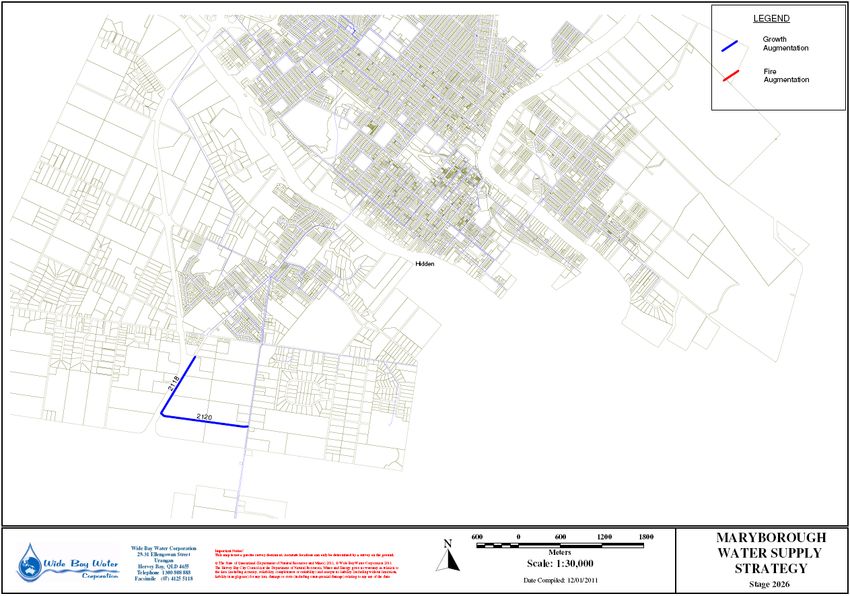
2.0       OBJECTIVES
2.1       Objectives of the Study

The aim of the investigation was to review existing and projected population projections and water consumption
within the study area. This will enable the development of a strategic infrastructure plan and associated capital
works program with a 20 year planning horizon to the year 2031.

Underpinning the work required to achieve these aims, a population model and a detailed water network model
have been prepared. These models will allow Wide Bay Water Corporation to periodically undertake system analyses
on the water supply system to verify and amend the 20 year works program as necessary.

The principal objectives of the study were to:

•     build a population model, which is capable of determining existing equivalent dwelling (ED) population and
      predicting future populations for nominated development or planning horizons;

•     review the performance of the existing water supply scheme and identify areas which do not provide the
      adopted Standards of Service to consumers;

•     develop water network models for the existing water supply system and for each of the five (5) year planning
      steps to the year 2031 system;

•     produce a 20 year capital works program based on the results of the hydraulic modelling and determine the
      capital requirements associated with the various augmentation options developed;

2.2       Standards of Service
A Statement of Corporate Intent has been adopted between Fraser Coast Regional Council and Wide Bay Water
Corporation to identify the commercial relationship between the two entities and to ensure an acceptable standard
of service is provided to all customers. This document sets the quantity, quality and reliability requirements of the
scheme. The main requirements that affect the preparation of this report are as follows:

•     the number of permissible hours of water discontinuity – maximum 5 hours;
•     99% of all premises will have water pressure of 20 metres or greater for 90% of the year;
•     all premises will have a flow available of 20 L/min or greater for 90% of the year; and
•     the quality of water at the point of delivery is to meet NHMRC guidelines for 95% of the time.
•     Wide Bay Water also aims to satisfy the following standards of service contained within the QWRC Guidelines,
      commonly known as the “DNR Guidelines”:

      •   maximum residual pressure should not exceed 80 metres;
      •   the reticulation network shall be capable of providing a fire flow in residential areas during the peak demand
          period of 15 L/s while maintaining a minimum residual pressure of 12 metres; and
      •   the reticulation network shall be capable of providing a fire flow in commercial areas during the peak
          demand period of 30 L/s while maintaining a minimum residual pressure of 12 metres.

                                                                                                             4|Pa g e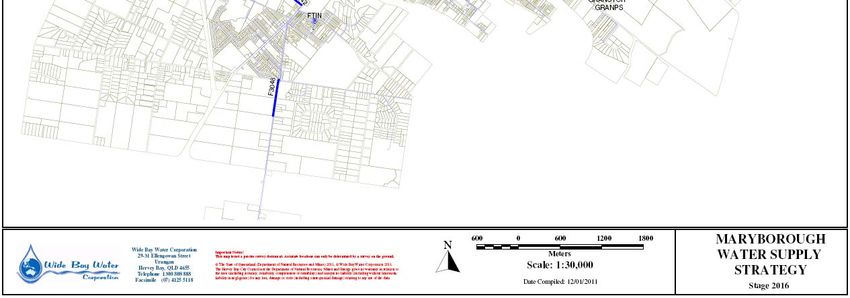
3.0     EXISTING SYSTEM
3.1     System Overview
The City’s existing raw water supply is sourced from Tinana Creek, a tributary of the Mary River, where two storages
have been constructed; Teddington and Tallegalla Weirs.

Teddington Weir is located approximately 16 km south of the city and has a full supply volume of 3,710 ML at 8.66 m
AHD. Tallegalla Weir is approximately 22km south of Teddington Weir and has a full supply volume of 400 ML.
Following amalgamation Teddington and Tallegalla Weirs are now owned by Fraser Coast Regional Council and are
under the control of WBWC. WBWC has an annual High Priority Allocation of 6,819 ML/annum from DERM to draw
raw water from Teddington Weir to supply Maryborough and its environs.

Teddington Weir also provides irrigation water to farmers located adjacent to Tinana Creek upstream of the Weir.
There are 21 irrigation licences on the Weir with a total water allocation of 2798 ML. Sugar cane is the primary land
use around the Maryborough district and is the biggest user of water from Tinana Creek. Plans to increase the area
under cane cultivation are dependent on the availability of irrigation water. The capacity of Teddington Weir is
expected to be adequate until well after the 2031 planning horizon assuming the current low growth in
Maryborough continues.

Raw water is drawn from Teddington Weir and is treated at the Teddington WTP located adjacent to the weir.
The treated water is transferred from Teddington WTP via DN600 and DN525 transmission mains to Maryborough
where it is distributed to town reservoirs at 2 Mile Reservoir (4.5ML), Aberdeen Ave Reservoir (4.5ML), Anne St
Reservoir (4.5ML) and Boys Ave Reservoirs (10ML and 9.1ML).

While most of the customers are supplied through reticulation pipework, there are a number of customers that are
connected directly to transmission mains.

To regulate the flow of water throughout the reticulation network, Maryborough has established six (6) separate
demand management areas (DMA). The original DMA’s were created to regulate pressures within the separate
zones and more recently have been used for demand management and to monitor and reduce system leakage.
Despite the introduction of these DMA’s Maryborough has approximately 150L/connection/day (114 L/ED/day) of
unaccounted for water. This equates to approximately 17% of total water usage in Maryborough.

                                                                                                          5|Pa g e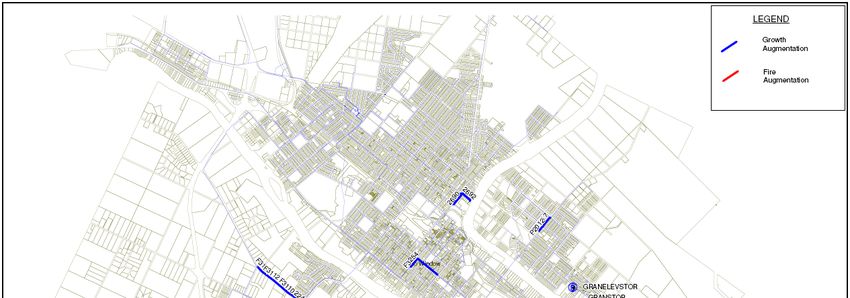
Additional storages are located at the Mary River Barrage on the Mary River upstream from Maryborough (full
supply = 4770ML) and on Tinana Creek downstream from Teddington Weir. These storages are owned and operated
by SunWater Projects (SWP) as part of the Lower Mary River Irrigation Scheme (LMRIS). The LMRIS supplies water to
farmers within the Maryborough City area and those rural areas that were within the former Shires of Woocoo and
Tiaro. Under this scheme water is transferred via open channel and pipeline from the pondage behind the Mary
River Barrage to Tinana Creek Barrage for delivery to farmers in the Walkers Point, Bidwill and the Maryborough City
areas. In 1993 a pipeline was installed to transfer Mary River water directly to Teddington Weir via the Owanyilla
channel to augment irrigation allocations from Teddingtom Weir and to increase the reliability of Council’s raw
water source. These allocations provide 2500 ML/annum of Medium Priority water for irrigation and 1000
ML/annum of High Priority water for the Maryborough City area.

Cyanobacteria (blue‐green algae) and attendant water quality and health problems have become one of the region’s
key issues in water resource management, urban and irrigation water supply. While acknowledging irrigation needs
for water, there are concerns over potential threats to the town water supply from cyanobacterial blooms and
impacts on the water quality of Teddington Weir by potential transfers of algal laden waters from the Mary River.
During transfers through the Owanyilla Channel from the Mary River to Tinana Creek, continuous monitoring of
water quality is undertaken to ensure the potential for algal blooms to impact on the Tinana Creek catchment is
minimised.

The main differences in water quality between the Mary River and Tinana Creek waters are that the Mary River has:

•     alkalinity levels greater than 100 mg/L (as CaCO 3 ) compared with 20 mg/L (as CaCO 3 ) in Tinana Creek;
•     lower apparent and true colour;
•     higher conductivity and hence dissolved solids;
•     higher hardness associated with higher levels of calcium and magnesium;
•     higher pH;

                                                                                                            6|Pa g e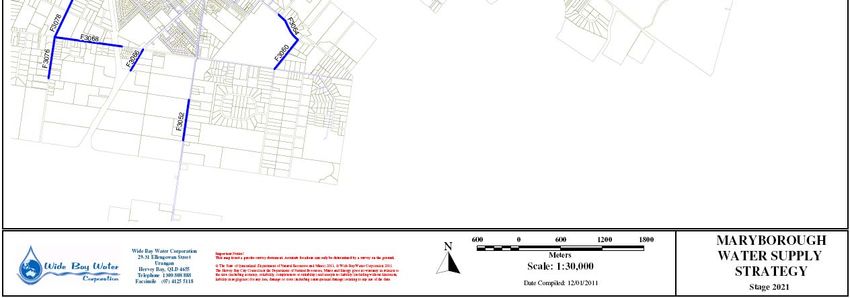
•      lower iron and manganese.

The biodiversity of the Teddington Weir pool is expected to change with the introduction of Mary River water.
Changes that can be expected are an increased level of algae in the weir pool due to increased levels of alkalinity and
reduced levels of colour. This is likely to result in higher levels of transmittance of UV light in the water body and
produce conditions favourable for algal production.

The prevalence of water weed in the catchments contributes to the high level of organic matter within the Tinana
Creek. Work is currently in progress to remove blankets of hyacinth and salvinia weeds from the water storage. This
is to minimise the levels of decomposing organic material that needs to be removed during the water treatment
process.

Officers of the former Maryborough City Council had developed operating rules for the Teddington Weir based on
releases from Tallegalla Weir (Hunter Water Australia) and the implementation of staged water restrictions.
Council’s consulting engineer in 1998 developed operating rules for water transfers from the Mary River to
Teddington Weir based on cyanobacteria levels in the Mary River. A blue‐green algae (cyanobacterial) contingency
plan was also developed for Teddington Weir (update of a contingency plan previously developed in 1993
(Simmonds and Bristow).

Another major problem with the Teddington storage is the incidence of higher than desirable levels of iron and
manganese in the water which ultimately results in water discolouration problems in Maryborough. An artificial
destratification system was installed in the Teddington Weir pool in 1995 to reduce peaks of iron and manganese in
the raw water. This system is providing lower, more consistent levels of iron and manganese although problems still
occur occasionally with stratification.

As part of a review of water discolouration problems (SKM, 1998) the former Maryborough City Council
commissioned a consulting engineer to evaluate the performance of the destratification system. The review
concluded that:

•      the installed diffuser arrangement did not address the issue of protecting the intake structure from drawing
       un‐aerated water;
•      the diffuser holes appear larger and too close together to develop mixing;
•      the air flow rate is in the appropriate range; and
•      the destratification system requires modification (cost estimate ‐ $10,000 for modelling and design and
       $10,000 for construction). This activity is included in the 10 year Capital Works Program.

Water quality and quantity issues in the Lower Mary River Area are increasingly being addressed in a more
catchment‐wide regional basis involving the major stakeholders. WBWC has been involved with the Mary Basin
Water Resource Plan which, in part, forms the basis for future licence conditions;

The allocation of water is divided into high priority users including WBWC’s water use for public water supplies.
Irrigation users are categorised as medium priority users meaning that their allocation is reduced or ceased when
certain predetermined weir level triggers are met.

Furthermore the introduction of announced allocations specified in licences will dictate the percentage of allocation
allowed in any particular year. This announced allocation is calculated using a formula and takes into account factors
including usable volume available, high priority demands, environmental release requirements and losses.

3.2      Bulk Supply System
The bulk supply system consists of the following assets:

1.    A pump station facility (owned by SunWater Projects) that extracts water from the Mary River and pumps into
      Teddington Weir.
2.    Teddington and Tallegalla Weirs.
                                                                                                            7|Pa g e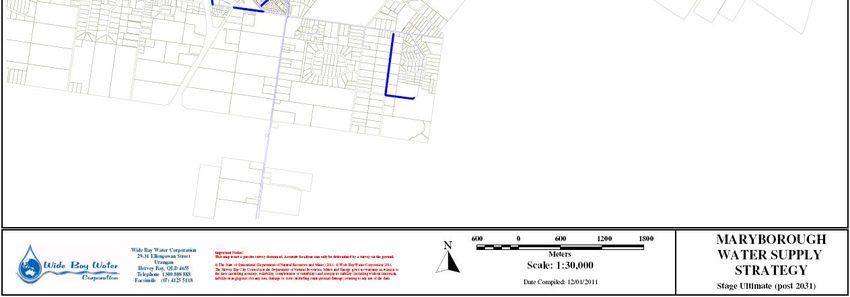
3.              Teddington Water Treatment Plant (WTP), clear water storage and raw and treated water pumping stations.
4.              Bulk treated water delivery mains 2 x DN525 to Two Mile Reservoir thereafter consisting of a DN525 and DN600
                to the town reservoirs.
5.              Two Mile Reservoir with a volume of 4.5ML.
6.              Tinana pump station and elevated reservoir with a capacity of 0.5ML.
7.              A DN525 transmission main to Aberdeen Reservoir with a volume of 4.5ML and associated

                •     low level pump station and elevated reservoir with a capacity of 0.45ML.
                •     high level pump station and elevated reservoir with a capacity of 0.45ML. This also supplies a 1ML
                      elevated storage at the Showgrounds.

8.              2 x DN600 Transmission mains to Boys Ave Reservoirs No. 1 and No. 2 with volumes of 10 ML and 9.1 ML
                respectively.
9.              A DN300 transmission main to Anne Street reservoir with a capacity of 4.5ML and associated PS and Elevated
                reservoir with a capacity of 0.45ML.

Table : Length (km) of Bulk Supply mains in Maryborough by material and diameter

          Material           AC        CI       DICL       PVC     uPVC       MS       FRC        TOTAL
           Type
               500            ‐         ‐        2.0        ‐         ‐         ‐        ‐         2.0
Diameter
  (mm)

               525            ‐         ‐       10.8        ‐         ‐       15.9       ‐         26.7
               600            ‐        0.2      14.8        ‐         ‐        0.7      0.7        16.4

3.3                 Distribution System
In this report, the distribution system has been defined as that infrastructure that delivers water from the bulk
supply assets to the individual water districts. These mains are typically required to deliver the maximum hour
demands throughout the system.

Table : Length (km) of distribution pipe in Maryborough by material and diameter

         Material            AC           CI     DICL       PVC      uPVC      MS       FRC       TOTAL
          Type
               300           3.9       10.1       1.6       2.1           ‐     ‐             ‐    17.7
 Diameter
   (mm)

               375            ‐         ‐         2.2        ‐            ‐     ‐             ‐    2.2
               450           0.6       3.0        1.4        ‐            ‐    1.4            ‐    6.4

3.4                 Reticulation Network
The network’s reticulation system comprises DN100, DN150, DN200, DN 225 and DN250 water mains to which the
majority of service connections are made. These mains are required to provide both maximum hour demands and
fire fighting flows. The distribution of water mains is shown in the table below by size and by material type.

Table : Length (km) of reticulation pipe in Maryborough by material and diameter

         Material            AC        CI       DICL       PVC     uPVC       MS       FRC        TOTAL
          Type
Diameter (mm)

                                                                                                  117.5
                    100     40.5      40.3        ‐       36.5       0.2       ‐          ‐
                    150     11.6      14.4       1.2      18.1       0.1       ‐         ‐        45.4
                    200      5.2       1.3       0.1       5.0       1.0       ‐          ‐       12.6
                    225      3.1       1.9       0.6       0.7        ‐        ‐          ‐       6.3
                                                                                                                     8|Pa g e
250   1.1   3.9   2.1   ‐   ‐   ‐   ‐   7.1

                                              9|Pa g e
4.0     POPULATION PROJECTIONS AND WATER DEMAND
4.1     Existing ED Demand
Maryborough City had a residential population of approximately 27,217 in 2006 (Census Data), and based on the
Queensland Treasury’s Office of Economic and Statistical Research (OESR) Urban Centre and Locality (UCL) estimates
that will rise to 29023 in 2011. OESR growth forecasts going forward are that Maryborough will continue to grow at
0.8% per annum which is consistent with previous PIFU Medium Series Growth Projections. This growth forecast has
been used throughout this report.

Wide Bay Water has carried out a number of consumption analyses based on consumption data from residential
property water meters. From this analysis it has been determined that the current average daily demand for a
residential property or Equivalent Dwelling (ED) in Maryborough is 680 L/ED/day. This average demand includes an
allowance of approximately 17% for unaccounted water and system leakage and is considered to be an appropriate
demand to be used as the basis for future planning purposes in Maryborough. Leakage and unaccounted for water
has been determined to be 114L/ED/day (150 L/connection/day) in Maryborough. Further work on leakage
management and water usage has the potential to significantly reduce the current level of unaccounted for water.

4.2     Future ED Demand
For modelling purposes the estimated consumption per ED has been assumed to remain at 680 L/ED/day although
the distribution of demands will change with changing population and development density.

The planning scheme for Maryborough allows for expansion of residential areas in Tinana, and some infill in
Maryborough Central and Granville. Growth in non‐residential development has been provided for in the North
Maryborough area and limited areas in Tinana and Granville. These non‐residential areas have been assumed to
grow at the same rate as Residential growth over the planning period to 2031.

Total ED projections for each of the 5 year design horizons from the year 2010 to the year 2031 are detailed below.

Table : Equivalent Dwelling (ED) Projections
     Year                Residential           Non‐Residential Demand                Total
                          Demand                                                    Demand
    2010                    9990                         2781                        12772
    2011                   10172                         2796                        12968
    2016                   11014                         2869                        13883
    2021                   11559                         2944                        14503
    2026                   12119                         3021                        15140
    2031                   12665                         3100                        15766

Table : Equivalent Dwelling (ED) Figures per DMA
  Year       Granville    Newtown Maryborough            Tinana     Bell Hilltop    Maryborough
                           Central          CBD                                        West
  2010         1252          3451           3557          1666          780            2003
  2011         1268          3457           3562          1818          782            2019
  2016         1362          3531           3617          2447          798            2065
  2021         1421          3622           3670          2787          817            2122
  2026         1461          3715           3722          3120          840            2218
  2031         1517          3845           3781          3383          859            2316

                                                                                                         10 | P a g e
Table : Estimated Daily Water Requirements (ML/Day)
Year Average Day Mean Day Maximum Month Peak Day
2010 8.7 12.2 16.5
2011 8.8 12.3 16.8
2016 9.4 13.2 17.9
2021 9.9 13.8 18.7
2026 10.3 14.4 19.6
2031 10.7 15.0 20.4
4.3 Demand Allocation
Demand allocation is dependent upon the number of equivalent dwellings (ED’s) either existing or permitted under
the planning scheme for a particular site. Over the twenty year strategy the amount of residential and non‐
residential development will increase.
The number persons/dwelling was obtained from the Australian Bureau of Statistics data from 2006 which indicated
a population density of 2.8 persons/dwelling.
4.4 Demand Types
For modelling purposes demand types have been simplified into two categories, residential and non‐residential:
(i) Residential demand encompasses all residential development including low, medium and high density
residential development;
(II) Non‐residential development includes commercial, industrial, educational, sporting, recreational and health
related premises.
The relative percentage of each demand type within each Demand Management Area varies throughout
Maryborough. Areas that have a high percentage of residential demand include Tinana, Maryborough CBD and
Newtown Central. Maryborough West, and the Maryborough CBD have a high percentage of non‐residential
demands.
4.5 Peaking Factors
Peaking factors for the Average Day (AD), Mean Day Maximum Month (MDMM), Peak Day (PD) and Peak Hour (PH)
hydraulic analyses were derived from an analysis of water production and consumption data.
A report by Cardno (2009) which was based on water production data prior to 2005 indicated that the PD and the
MDMM factors should be 1.9 and 1.4 respectively. A more recent review of the water production figures from 2008
through to 2010 (post introduction of water meters) indicates that the PD and MNMM factors are 1.7 and 1.3
respectively.
The lower factors may be attributable to water restrictions, the drought in 2008‐09 and a particularly wet year
during 2009‐10. At this early stage it is uncertain whether the lower factors are sustainable into the future.
Therefore the figures proposed by Cardno (2009) have been adopted for modelling purposes.
Average Day Demand is equal to the total consumption recorded for the year divided by the number of days in the
year.
Average Day (AD) = 680 L/ED/D x Number of Equivalent Dwellings(ED)
Peak Day Demand is the maximum demand expected to occur on one day (usually in summer) every year. It is
calculated by multiplying Average Day demand by 1.9.
Peak Day (PD) = Average Day x 1.9 (Peaking Factor)
11 | P a g eMean Day Maximum Month Demand is the average daily demand expected to be experienced over the maximum
month of the year. Mean day maximum month for domestic connections is calculated by multiplying average day
demand by 1.4. This ratio is representative of the Maryborough City water consumption data.
Mean Day Maximum Month (MDMM) = Average Day x 1.4 (Peaking Factor)
4.6 Diurnal Profiles
Diurnal profiles are used to account for variations of demand for different land uses throughout the day. In the
model, the profiles apply diurnal factors on an hourly basis to establish a snapshot of the flow rate at any given time.
Figure: Residential and Non Residential Diurnal Curves
Adopted Diurnal Curves
2.5
2
1.5
1
0.5
0
00:00:00
01:00:00
02:00:00
03:00:00
04:00:00
05:00:00
06:00:00
07:00:00
08:00:00
09:00:00
10:00:00
11:00:00
12:00:00
13:00:00
14:00:00
15:00:00
16:00:00
17:00:00
18:00:00
19:00:00
20:00:00
21:00:00
22:00:00
23:00:00
Residential Non Residential
The peaking factors for Peak Day and Mean Day Maximum Month were applied to these curves to estimate demand.
Based on the estimated design horizon populations and the demand criteria detailed above, the average day, mean
day maximum month, and maximum day demands have been plotted and compared at each 5‐year time interval.
12 | P a g eDemand L/s Demand L/s
0
0
50
100
150
200
250
300
350
50
100
150
200
250
00:00:00 00:00:00
01:00:00 01:00:00
02:00:00 02:00:00
2010
2010
03:00:00 03:00:00
04:00:00 04:00:00
05:00:00 05:00:00
06:00:00
2011
06:00:00
2011
07:00:00
Figure: Average Day Demand per Year
07:00:00
08:00:00 08:00:00
09:00:00
Figure: Mean Day Maximum Month Demand
09:00:00
2016
10:00:00
2016
10:00:00
11:00:00
11:00:00
12:00:00
12:00:00
13:00:00
2021
13:00:00
2021
Average Day Demands
14:00:00
14:00:00
15:00:00
15:00:00
16:00:00
16:00:00
2026
17:00:00
2026
Mean Day Maximum Month Demand (L/s)
17:00:00 18:00:00
18:00:00 19:00:00
19:00:00 20:00:00
2031
2031
20:00:00 21:00:00
21:00:00 22:00:00
22:00:00 23:00:00
23:00:00
13 | P a g eDemand L/s
0
50
100
150
200
250
300
350
400
450
00:00:00
01:00:00
02:00:00
2010
03:00:00
Figure: Peak Day Demand
04:00:00
05:00:00
06:00:00
2011
07:00:00
08:00:00
09:00:00
2016
10:00:00
11:00:00
12:00:00
Peak Day Demand
13:00:00
2021
14:00:00
15:00:00
16:00:00
2026
17:00:00
18:00:00
19:00:00
2031
20:00:00
21:00:00
22:00:00
23:00:00
14 | P a g e5.0 RAW WATER SOURCE
WBWC has an annual High Priority Allocation of 6,819 ML to draw raw water from Teddington Weir. An additional
High Priority allocation of 1000 ML is also available from Teddington Weir although this is a transfer from the Mary
River. Teddington Weir has an Historical No Failure Yield of 4120 ML. The draft Resource Operating Licence for the
Mary River provides for the transfer of the additional 1000ML of High Priority water allocation from the Mary River
and to date has only been used as a critical water supply supplement in times of drought.
Total annual demand has reduced significantly since 2002 due in part to the drought and also the introduction of
water meters around 2004. Assuming this demand reduction is sustainable through pricing structures and demand
management iniatives, total annual demand is forecast to rise from a low of 3170 ML in 2010 to 4589 ML in 2051.
The previous highest annual demand was 4769 ML in 2001.
The following table summarises the annual treated water requirement determined from the Average Day Demand,
and the graph below shows historical and projected total annual demand in Maryborough.
Figure : Summary of Treated Water Demand (ML)
Year Average Day Peak Day MDMM Annual Requirement
(ML/Annum)
2010 8.7 16.5 12.2 3170
2011 8.8 16.8 12.3 3219
2016 9.4 17.9 13.2 3446
2021 9.9 18.7 13.8 3600
2026 10.3 19.6 14.4 3758
2031 10.7 20.4 15.0 3913
2036 11.2 21.2 15.6 4072
2041 11.6 22.1 16.3 4238
2046 12.1 23.0 16.9 4410
2051 12.6 23.9 17.6 4589
Based on these projections the current allocations are adequate for the foreseeable future.
Graph needs tidying up.
15 | P a g eMaryborough Water Allocation, Historical
Production and Projected Demands
9000
8000
7000
6000
ML/Annum
5000
4000
3000
2000
1000
0
1990
1993
1996
1999
2002
2005
2008
2011
2014
2017
2020
2023
2026
2029
2032
2035
2038
2041
2044
2047
2050
Year
High Priority Water Allocation 2010 ML Historical demand/annum (ML)
Teddington Weir current THNFY Projected demand/annum (ML)
16 | P a g e6.0 TREATMENT
6.1 Teddington Water Treatment Plant ‐ Overview
The Teddington Water Treatment Plant (WTP) is located at Teddington Weir, a weir pool on Tinana Creek. The plant
consists of two identical conventional treatment processes providing aeration, coagulation, clarification, filtration,
pH correction and disinfection. Raw water supply to the plant is pumped from the weir via one of two available
pumping configurations depending on which process stream is to be used. The plant is hydraulically capable of
treating 460L/s which is equivalent to 36ML/day per day for a 22 hr operating day, however treated water demand
has historically reached only a maximum of approximately 22ML/day prior to 2008 and there are significant issues
with treated water quality at higher production rates.
Raw water is firstly dosed with lime and then alum is added at the top of the aerator. The dosed water is then fed to
a reactivator type clarification process where a coagulant aid polymer is dosed to improve settling. Supernatant from
the clarifier then flows into two sand pressure filters consisting of eight cells per filter. The plant has been upgraded
to include facilities for PAC dosing and the pre‐chlorination coated media process for manganese removal. Filtered
water is dosed with lime and chlorine before flowing into either of two treated water storage tanks on site prior to
being pumped into the distribution system.
In October 2002, Maryborough City Council (MCC) requested Hunter Water Australia (HWA) to perform a chemical
dosing review of its Teddington WTP to determine if the treatment process could be improved in terms of treated
water quality, plant operability and operating costs. The main issues of concern were the costs associated with the
use of both hydrated lime and aluminium sulphate (alum) which are both delivered to the plant dry in 25kg bags.
Delivery of these chemicals in bulk would offer reduced annual chemical expenditure, minimise manual handling and
provide both time savings and improved safety. Further improvements could be also achieved if the coagulant and
alkali used at the plant were in liquid form as this simplifies the dosing systems required saving on capital
expenditure and maintenance costs.
17 | P a g eFigure : Teddington Water Treatment Plant Process Plan
Improvement in water quality from the plant can be achieved through optimisation of the existing processes. New
control systems will be required to achieve this outcome. In the longer term, additional processes will also be
required to meet water quality standards and increased production rates.
Subsequent to the introduction of water meters and consumption based charges in Maryborough, water
consumption has dropped significantly. The treated water production between 2008 and 2010 ranges between 5
and 15ML/day in line with seasonal fluctuations. The following graph shows the recent production figures from the
Teddington WTP.
18 | P a g eProduction (ML)
0
2
4
6
8
10
12
14
16
07‐2008
08‐2008
09‐2008
10‐2008
11‐2008
12‐2008
01‐2009
02‐2009
03‐2009
04‐2009
05‐2009
Figure: Treated Water Production Teddington WTP
06‐2009
07‐2009
08‐2009
09‐2009
10‐2009
Filter Production (ML)
11‐2009
Teddington Water Production 2008‐2010
12‐2009
01‐2010
02‐2010
03‐2010
04‐2010
05‐2010
06‐2010
19 | P a g e7.0 TRUNK DISTRIBUTION
7.1 Pump Stations
Teddington WTP Clearwater Pumpstation
Located at Teddington WTP, this pump station has the capacity to supply in excess of 400L/s into the Maryborough
Township. These pumps are manually activated to supply and fill Two Mile Reservoir. They automatically shut down
once the reservoir is full. The pump station consists of four pumps each with individual capacities shown in the table
below.
Table: Teddington Clearwater Pumpstation
Pump Elevation Output L/s Operation
Pump 1 20 110 Manual on
Auto off
Pump 2 20 110 Manual on
Auto off
Pump 3 20 277 Manual on
Auto off
Pump 4 20 225 Manual on
Auto off
Tinana Pump Station
These pumps provide water directly to the suburb of Tinana. There are two pumps installed in this pump station and
each pump has a capacity of 48L/s at a head of 36.5m. The pump station supplies water directly into the reticulation,
but also supplies water to the Tinana elevated reservoir. This pump station services approximately 1300 customers.
This pump station will require upgrading in 2016 with the projected water demand increases.
Aberdeen Avenue Low Level Pump Station
This pump station located at Aberdeen Avenue services the Newtown Central DMA and Bell Hilltop DMA. This pump
station consists of 3 pumps and each has a capacity of 227L/s at 21.3m head. This area services approximately 4000
customers. Water is pumped directly to the system and the Aberdeen Avenue low level elevated tank with a capacity
of 0.45ML.
Aberdeen Avenue High Level Pump Station
This pump station located at Aberdeen Avenue services the Maryborough West DMA. It also provides water to the
Showgrounds elevated reservoir. This pump station consists of 2 pumps and has a capacity of 285L/s at 50.7m head.
This area services approximately 1700 customers. Water is pumped directly to the system and to the high level
elevated tank with a capacity of 0.45ML.
Anne Street Pump Station
This pump station services the Maryborough CBD DMA and also supplies water to the Granville DMA. This pump
station consists of 2 pumps and each has a capacity of 115L/s at a head of 31.6m. The pump station services
approximately 3500 customers.
The pumps supply water directly to the reticulation and to the Anne Street Elevated Reservoir (0.45ML). This pump
station had previously provided water to the Granville elevated reservoir (0.05ML). Since the Granville reservoir has
been decommissioned (November 2010) water supply reliability to that DMA needs to be improved.
It is understood that the Anne Street Pump station is not currently being used due to noise issues and damage to
mains when it is operated. There are also reported leakage issues with the Anne St reservoir. The decommissioning
of Granville Elevated reservoir may intensify any issue of over pressurising the system mains and variable speed
drives fitted to the pumps may be required to reduce damage to the reticulation. This pump station and the Anne
20 | P a g eStreet Facility are essential components in the Maryborough Strategy and it is recommended that this pump station
be recommissioned as soon as practical.
7.2 Reservoirs
Ground level Reservoirs:
The existing ground level reservoirs are detailed in the following table.
Table ‐ Ground Level Reservoirs
Reservoir Construction Year Storage Volume (ML) Top Water Level Bottom Water Level
(mAHD) (mAHD)
Two Mile 4.5 48.0 no information
Aberdeen Avenue 1933 4.5 31.95 25.85
Anne Street 1998 4.5 30.3 24.05
Boys Avenue No. 1 1969 9.1 30.52 24.57
Boys Avenue No. 2 1983 10 30.8 24.8
Total 32.6
For the purposes of this report, Maryborough can be separated into three zones defined by the Mary River and
Tinana Creek.
Maryborough zone is the area bordered by the Mary River to the south and east and contains the greatest portion of
Maryborough. It is also the location of four of the five ground level reservoirs, including Boys Avenue reservoirs 1
and 2, Ann Street reservoir and Aberdeen Avenue Reservoir. These have a combined storage volume of 28.1ML.
The area bordered by the Mary River to the north and Tinana Creek to the east is Tinana zone. This area is supplied
directly from 2 Mile Reservoir from the existing DN525 trunk mains. This zone includes 2 Mile reservoir with a
storage capacity of 4.5ML.
The area bordered by the Mary River to the west and south is Granville which relies on supply from the
Maryborough area via a single water main across the Mary River. The Granville zone does not have a dedicated
reservoir located within the zone.
Table: Storage requirements for Major Zones by Projected Planning Horizon
Reservoir Type Storage Zone Capacity Storage Required (ML)
Volume (ML) (ML) 2010 2011 2016 2021 2026 2031
Whole of town Ground Level 32.60 32.60 21.27 21.60 23.13 24.16 25.22 26.26
Maryborough Zone Ground Level 28.10 28.10 12.97 13.00 13.24 13.51 13.79 14.14
Granville Ground Level 0.00 0.00 2.09 2.11 2.27 2.37 2.43 2.53
Tinana Ground Level 4.50 4.50 2.97 3.13 4.18 4.75 5.08 5.74
It can be seen that if considering Maryborough as a whole the town storage is adequate to meet the overall demand
projections to beyond 2031. However, if we consider each individual zone then the shaded areas indicate where the
existing storage is deficient within the zone.
Granville has no existing storage and only a single supply main into the zone. This presents a risk to the corporation
should failure of this supply main occur.
21 | P a g eLikewise Tinana is separated from the Maryborough storage by the Mary River and requires additional storage
augmentation by 2021.
Elevated Reservoirs:
Maryborough has five elevated reservoirs which provide limited storage to the Maryborough water supply system.
The elevated reservoirs are;
• Aberdeen Avenue High and Low level elevated reservoirs which are supplied from the Aberdeen, Boys Avenue 1
and 2 ground level reservoirs;
• Anne Street elevated reservoir which is supplied from the Anne Street ground Level reservoir;
• Tinana elevated reservoir which is supplied from the Two Mile ground level reservoir.
Granville elevated reservoir was decommissioned in November 2010. While the capacity of this reservoir was only
50kL, it provided a small amount of security of supply to the Granville area.
The elevated reservoir at the Showgrounds, while being the largest elevated reservoir in Maryborough, is located on
the periphery of the town and therefore has limited benefit until growth occurs in that area.
Table ‐ Elevated Reservoirs
Reservoir Construction Year Storage Volume (ML) Top Water Level Bottom Water Level
(mAHD) (mAHD)
Aberdeen Ave Low 1970 0.45 50.60 43.74
Aberdeen Ave High 1971 0.45 57.00 50.14
Anne Street 1970 0.45 49.10 42.24
Show Grounds 1991 1.00 61.00 53.00
Tinana 1981 0.5 62.00 54.78
Granville Tank* 0.05 42.73 38.16
Total 2.85
*Granville Tank was decommissioned in November 2010
The NRM standards for the sizing of service reservoirs, has been used to determine the future storage requirements.
An analysis of the required reservoir capacities for the projected demands is summarised below:
Table ‐ Storage requirements for Elevated Reservoirs by Projected Planning Horizon
Reservoir Type Storage Zone Storage Required (ML)
Volume (ML) Capacity 2010 2011 2016 2021 2026 2031
(ML)
Aberdeen Ave Low Elevated 0.45 0.45 1.09 1.09 1.10 1.12 1.14 1.16
Aberdeen Ave High Elevated 0.45
Show Grounds Elevated 1
1.45 1.45 0.69 0.69 0.70 0.70 0.71 0.72
Anne Street Elevated 0.45 0.45 0.78 0.78 0.78 0.79 0.80 0.81
Tinana Elevated 0.5 0.50 0.70 0.73 0.83 0.89 0.94 0.99
Granville* Elevated 0.05 0.05 0.64 0.64 0.65 0.66 0.67 0.68
*Granville Tank was decommissioned in November 2010
The shaded cells in the table above indicate the elevated reservoirs that fail when compared with the NRM
guidelines which include allowances for fire fighting and/or emergency. It appears that the elevated reservoirs in
Maryborough have been sized to store fire fighting flows only and make no allowance for the domestic storage
component. However provision of additional elevated storage to meet the NRM guidelines is deemed uneconomical
and an alternative option has been investigated.
22 | P a g eThe elevated reservoirs in Maryborough “float” on the system, meaning that pump stations pump directly into the
reticulation system and the elevated reservoirs which serve to ensure that pressures are not excessive by buffering
pressure surges. These reservoirs also provide limited storage at a suitable pressure should maintenance of the
pump station be required.
Proposed Developments:
Major new development is expected in the Tinana area. Depending on transport access to the Granville area, this
may also be an area of high growth. The remaining areas of Maryborough are mainly infill development and
development of existing vacant lots.
Maryborough Demand Management Areas (DMA’s)
6 Maryborough CBD DMA
6 Bell Hilltop DMA
6 Granville DMA
6 Maryborough West DMA
6 Tinana DMA
6 Newtown Central DMA – Currently being assessed as a potential future DMA
Of the above DMA’s, a number are predicted to have a significant increase in population as a result of new
development (e.g. Tinana and Granville) or densification of the existing development areas (e.g. Maryborough CBD
and Maryborough West). This additional demand on the water supply system will necessitate upgrades to the
network and may affect the DMA boundaries.
Generally the DMA’s are isolated from one another by the installation of boundary valves which can be manually
opened in times of emergency. Because Maryborough is relatively flat, the primary operational use of the DMA’s is
to provide isolated sections of network where leak detection and monitoring can occur on a permanent basis.
23 | P a g e8.0 DISCUSSION
Now that Wide Bay Water has the responsibility for both the Maryborough and Hervey Bay systems an opportunity
exists to look at the benefits of a water grid servicing both systems. Transfer of treated water and/or raw water
between the two systems should be considered to maximise the use of existing assets such as water treatment
plants. A water grid also has the potential to offer water source security to both systems and deferred capital
expenditure on major infrastructure assets. Options for upgrading the Teddington Water Treatment Plant should
therefore be considered on a regional basis rather than simply for the Maryborough community. For this reason this
report will be recommending that an investigation be undertaken into the benefits of a water grid before any
decisions are taken on additional process stream units and design plant capacity at Teddington.
Utilisation of some of the available water allocation from the Mary River to supply Hervey Bay is consistent with the
outcomes of the Hervey Bay Strategy Report where a supply from the Mary River is identified as the preferred
option for future water supply.
Connection of the Maryborough and Hervey Bay systems would provide increased supply capacity in Hervey Bay for
the future and also improved reliability of supply to both the townships. Currently both townships rely on a single
source of water supply. Contamination or other source failure issues could mean isolation of the source and
subsequently Maryborough would only have a limited amount of storage (1‐2 days) in its storage reservoirs to rectify
the problem.
The graph below indicates the combined system capacity if a water grid were to be established. This option could
utilise the available capacity at Teddington WTP and transfer treated water to Hervey Bay via Burgowan, or
conversely to transfer treated water from Burgowan WTP to Maryborough. Linking the two systems will require
some major transmission infrastructure including approximately 30km of transmission main which could cost in the
order of $30m depending upon size and route. (The Hervey Bay Strategy Report indicated that a pipeline to transfer
7800 ML/annum of raw water from the Mary River to Burgowan WTP would cost $38.35m.)
Maryborough & Hervey Bay combined Water
Demand and Production Data
35000
30000
25000
ML/annum
20000
15000
10000
5000
0
2006 2011 2016 2021 2026 2031 2036 2041 2046 2051
Population
Marborough & Hervey Bay combined predicted demand ML/annum
Maryborough & Hervey Bay combined total production capacity ML/annum
Maryborough & Hervey Bay combined total water allocation
24 | P a g e8.1 Raw Water Pump station
Vertical line‐shaft pumps transfer water from the weir to the Teddington WTP. These shaft driven pumps are nearing
the end of their useful life. It is proposed that the 6 existing pumps be replaced with fewer but more efficient pumps
that meet the design capacity and operating regime of the Teddington Water Treatment Plant.
Table: Raw Water Pump Station Upgrade
Item Description Size Year Capital Cost
Proposed approx
1 Replace pumps Match 2012 $330,000
Plant
Capacity
TOTAL $330,000
8.2 Clear Water Pump Station Upgrade
Operating procedures and control systems for the clear water pumps need further investigation. The pumps are
currently manually activated by the operators with automatic shut‐off. Options include variable frequency drives and
and/or improved control systems. It is proposed to allow for a planning report in 2011 to review water transfer
arrangements throughout Maryborough to determine the best option. An allowance has been included for budget
purposes in 2012 for the installation of VFD’s although the final configuration will be dependant upon the outcome
of the Planning Report.
8.3 Treatment Capacity
The MDMM is forecast to increase from 12.2ML/day to 15.0ML/day in 2031. The nominal capacity of the treatment
plant at Teddington is 36ML/day. However, there are severe limitations on plant production capacity due to
deteriorating water quality with increased production rates. In order to produce 36 ML/day significant upgrades will
be required at the plant. These improvements are not required to meet the projected demand in Maryborough but
need to be assessed as part of a regional approach to water supply. This is beyond the scope of this report and forms
one of the recommendations.
25 | P a g eTreatment Capacity
40.0
35.0
30.0
25.0
Volume (ML)
20.0
15.0
10.0
5.0
0.0
2011 2016 2021 2026 2031 2036 2041 2046 2051
Year
Mean Day Max Month Treatment Capacity Teddington WWTP
Issues have been identified at Teddington WTP and these include:
1. High manganese levels.
2. High DOC (dissolved organic carbon) which results in THM formation.
3. High THM (trihalomethanes) levels which is a result of chlorine disinfection and high DOC.
4. Sludge management, for both liquid and solids disposal.
5. Water stabilisation; the water is currently corrosive.
6. Inlet structure located on the weir, the design poses a risk to supply continuity and accessibility is a WH&S issue.
7. Raw water pumps rationalisation.
8. Lack of critical alarm generation due to aged or non‐existent SCADA.
More detailed Information can be found in the Teddington WWTP, Asset Report (January 2011) in Appendix .
Consideration of a regional approach to water supply is necessary before a decision can be made on the scale of
augmentation of the Teddington Water Treatment Plant.
8.4 Trunk Distribution
8.4.1 Granville Security of Supply
Granville is isolated from the remainder of the Maryborough network by the Mary River. The sole supply main
(DN450) to Granville crosses the existing Tiger Street Bridge.
An elevated reservoir of 50kL has recently been decommissioned because of its poor condition. This storage was well
under the capacity required for the area that it serviced.
Several options are available for the improvement of security of supply to Granville.
OPTION A1 ‐ New reservoirs
To improve the security of supply to this area one option is to install a new ground level reservoir and associated
pump station to this area (and possibly a new elevated reservoir). This option would provide limited volume of water
to the Granville area should the DN450 main remain out of service for an extended period, say by failure of either
26 | P a g ethe main or the bridge during a major flood event. The sizing of the ground level and elevated reservoirs (under
NRM guidelines) would be 3.2ML and 0.8ML respectively.
The estimated costs are:
Table: Granville DMA Water Supply Infrastructure – Option A1 – New Reservoirs and PS
Item Description Size Unit Length/Size Year Capital Cost
Rate Proposed approx
1 Granville GL Reservoir 3.2 ML ‐ ‐ $1,350,000
2 Granville Elevated Reservoir 0.8ML ‐ ‐ $2,210,000*
3 Local MH Booster Pump Station 56 L/s ‐ ‐ $700,000
TOTAL $4,300,000
* Cost extrapolated from cost database
OPTION A2 – New River Crossing
An alternate supply main to Granville crossing the Mary River had previously been considered by Maryborough City
Council and is a more economical option. The alternative feed across the Mary River would also provide security of
supply should the DN450 feed be inoperable. The alternative feed should be a minimum of DN300 the sizing being
dependent upon the future growth and development in Granville.
The estimated costs are;
Table: Granville DMA Water Supply Infrastructure – Option A2 – New Water Supply Main
Item Description Size Unit Length/Size Year Capital Cost
Rate Proposed
1 DN300 bored main under Mary DN300 $3572/ 300m $1,080,000
River m
2 DN300 from Lennox Street to DN300 $317/m 1450m $530,000*
Odessa St (excluding river
crossing)
TOTAL $1,610,000
* includes a compensation factor of 1.15 for poor soil (High WT) in urban areas
OPTION A3 – Alternate site for River Crossing
An alternative route for a river crossing is upstream from the Tiger Street Bridge from Kent Street via Ajax and
Hoffmann Streets and offers potential cost advantages over Option A2. This route is considerably shorter and has the
advantage of supplying water close to the highest area of Granville. Preliminary costs for this proposal are shown
below:‐
Table: Granville DMA Water Supply Infrastructure – Option A2 – New Water Supply Main
Item Description Size Unit Length/Size Year Capital Cost
Rate Proposed
1 DN300 bored main under Mary DN300 $3572/ 300m $1,080,000
River m
2 DN300 from Kent Street to DN300 $317/m 405m $150,000*
Cambridge
TOTAL $1,230,000
* includes a compensation factor of 1.15 for poor soil (High WT) in urban areas
27 | P a g eOption A2
Option A1
Option A3
8.4.2 Storage in Tinana DMA
Tinana is currently the high growth area in Maryborough and is likely to remain so in the foreseeable future.
Improved access through construction of a second river crossing may well be the limiting factor on growth in
Granville. The Tinana area is supplied directly from the transmission mains from 2 Mile Reservoir. While the Two
Mile Reservoir services the entire Maryborough area it has been assumed for modelling purposes that it provides
water storage for the Tinana area.
Tinana can also be supplied from the elevated reservoirs at Aberdeen Ave, but this is a more expensive alternative.
Additional storage in the area of Two Mile Reservoir (or at Tinana Pump station site) south of the Mary River is
required to meet demand. A 1.5ML storage at either the Tinana PS site (Option B1) or the existing Two Mile
Reservoir site (Option B2) is estimated to cost approximately $1,100,000. Utilisation of the existing decommissioned
ground level reservoir at Two Mile Reservoir should be considered in evaluation of the options available to provide
additional storage for Tinana.
Table: Tinana DMA Water Supply Infrastructure
Item Description Size Unit Length/Size Year Capital Cost
Rate Proposed
1 Tinana GL Reservoir 1.5 ML ‐ ‐ $1,100,000
TOTAL $1,100,000
8.4.3 Elevated tanks in Maryborough
Analysis shows that the elevated storages in Maryborough do not meet the DNR guidelines. Most tanks are sized at
0.45ML with the exception being the showground elevated tank at 1.0 ML (the 0.05 ML Granville elevated reservoir
has been decommissioned). The 0.45ML elevated reservoirs appear to be sized to provide storage for fire flows and
do not make sufficient allowance for domestic storage requirements.
28 | P a g eIt is uneconomical to upgrade the elevated tanks. If pump failure occurs, the tanks’ current capacities will provide
limited storage to meet domestic demands. It should be noted that existing storage equates to no more than a peak
hour’s flow.
To meet fire fighting and domestic demands it is proposed that the fire fighting capacity be included in the ground
level reservoirs in each zone. When fire flows are required the existing pumps will ramp up and pump directly into
the system to meet the required demand.
To facilitate this it is required that the pump stations be made reliable by:‐
‐ providing backup power supply to each of the pump stations by way of a standby generator set, and,
‐ providing standby pumps in all stations.
8.5 Reticulation
Hydraulic Network Models were developed for each 5 year increment from 2011 (base position) through to 2031
taking into account:
• Average Water demand of 680L/ED/day;
• Population growth as defined in Section 4.0 of this document. Growth was allocated across the city where
current zoning under the Maryborough City Plan permitted.
• Peaking factors and diurnal profiles as defined in section 4.0 of this document;
• Existing network operating procedures (pump start/ stop, reservoir levels etc.);
• No failure scenario of 3 consecutive days of maximum day demand (i.e. Average day x 1.9);
• Fire Flow allowance of 15 L/s (residential)and 30L/s (commercial) at peak hour demand at each node in the in
accordance with zonings indicated in the Maryborough City Plan.
Where a pipeline failed under the above scenarios during any 5 year time step, that pipeline was identified and an
additional (or replacement) pipeline provided to that area. Failure of a pipeline was due either to excessively high
velocities or head losses resulting in failure to meet the levels of service specified within the service agreement.
Where a pump station failed to meet the required demand or a reservoir ran out of water, additional pumping
capacity or storage was provided.
Modelling was carried out for the ultimate development anticipated by the planning scheme and for intermediate
timesteps in 5 year intervals to 2031. Growth rates used in the underlying demand model are consistent with those
outlined in section 4, and development sequencing has favoured the Tinana area with infill development throughout
the city.
As a starting point, the reticulation layout for the ultimate planning horizon was adopted from the Cardno (2009)
Report. This pipeline layout was verified with the demands determined in section 4. Two analyses were carried out,
one to meet domestic supply requirements and one to meet fireflow requirements. Any pipes that were determined
unnecessary in the ultimate model were removed from the ultimate scenario.
Modelling was conducted in three stages. Demands appropriate to the time step were applied to the reticulation
network and the results of the model run were analysed to identify any level of service deficiencies. Where areas
failed to meet level of service requirements, pipes were placed consistent with the ultimate scenario. Where
additional pump(s) or storage were required, these were placed at the appropriate timestep. The scenario was then
re‐run to ensure that the required levels of service were achieved.
Residential and commercial fire flow runs were then conducted and any additional deficiencies in system capacity
were identified and rectified before moving on to the next time step.
IT was assumed throughout the fire flow analyses that commercial fire flows (30 L/s) would only be provided within
the Commercial, Industrial, High and Medium Density Residential Zones within the City of Maryborough. All other
hydrants were tested for residential fire flows (15 L/s). Whilst there are a small number of hydrants that do not meet
the desired standards, they are generally located on 100mm diameter or smaller dead end mains, in courts, or at
DMA boundaries on 100mm diameter mains where flow is only available to the hydrant from one direction. Failure
29 | P a g eYou can also read