Growth and mortality of Norway spruce and European beech in monospecific and mixed species stands under natural episodic and experimentally ...
←
→
Page content transcription
If your browser does not render page correctly, please read the page content below
Trees
https://doi.org/10.1007/s00468-020-01973-0

 ORIGINAL ARTICLE

Growth and mortality of Norway spruce and European beech
in monospecific and mixed‑species stands under natural episodic
and experimentally extended drought. Results of the KROOF
throughfall exclusion experiment
H. Pretzsch1 · T. Grams2 · K. H. Häberle2 · K. Pritsch3 · T. Bauerle4 · T. Rötzer1

Received: 14 November 2019 / Accepted: 19 March 2020
© The Author(s) 2020

Abstract
Key message Under severe drought, growth of Norway spruce suffered much more than European beech. Norway
spruce benefited from growing in the environment of beech, and both species acclimated slightly to 5 years of experi-
mentally extended drought.
Abstract Recent studies show that the detrimental effects of drought on stand growth are mitigated when the stand contains
mixed tree species. We analysed the growth responses of Norway spruce and European beech to episodic and experimentally
extended drought in intra- and inter-specific mature stands. We used annual diameter growth records dating back to 1998
to determine the impact of the natural episodic drought in 2003 and 2015. To analyse extended drought, spruce and beech
trees were exposed to extreme drought under automatic throughfall exclusion roofs from 2014 to 2018. The growth of spruce
in an inter-specific environment with beech was 20–50% less affected by natural episodic drought compared with an intra-
specific constellation. When beech grew in an inter-specific environment, it was by 23% more affected by drought compared
to intra-specific conditions, but seemed to recover faster. The induced drought from 2014 to 2018 resulted in a strong growth
reduction in the first year particularly for spruce, followed by a slight acclimation to the dry conditions. Beech acclimated
and recovered faster than spruce across all growing conditions, while spruce only acclimatized faster in the environment of
beech. Both species showed a higher mortality under induced drought compared with the controls; for spruce, the mortality
rate was fivefold higher compared to the long-term mortality. The long-term moderate-growth stabilization and the growth
increase after the 5-year exposure to drought suggest a gradual acclimation to drought by beech. The resistance and acclima-
tion to drought of spruce when growing in mixture should be considered when designing resource efficient and productive
mixed conifer-broadleaved stands for future climates.

Keywords Drought · Picea abies · Fagus sylvatica · Mortality · Mixed forests

Communicated by Heckathorn. Introduction
* H. Pretzsch Severe drought events in Central Europe in 1976, 2003, and
 H.Pretzsch@lrz.tum.de
 2015 triggered multiple studies on the effects of episodic
1
 Chair for Forest Growth and Yield Science, TU München, drought on the growth and mortality of forest tree species
 Hans‑Carl‑von‑Carlowitz‑Platz 2, 85354 Freising, Germany (Allen et al. 2015; Bréda et al. 2006; Ciais et al. 2005). The
2
 Ecophysiology of Plants, TU München, findings suggest that tree species cultivated at or beyond
 Hans‑Carl‑von‑Carlowitz‑Platz 2, 85354 Freising, Germany the border of their natural range, such as Norway spruce
3
 German Research Center for Environmental Health, Institute (Picea abies [L.] Karst) and European larch (Larix decidua
 of Biochemical Plant Pathology, Helmholtz Zentrum Mill), in Central Europe show severe growth reduction and
 München, Ingolstädter Landstraße 1, 85764 Neuherberg, mortality (Kölling et al. 2009; Lévesque et al. 2013) during
 Germany
 extreme drought events. To mitigate the effects of drought
4
 School of Integrative Plant Science, Cornell University, on tree productivity and survival, silviculture practices aim
 Ithaca 14853, USA

 13
 Vol.:(0123456789)
Trees to select better acclimated species and provenances (Atzmon H3: Tree mortality does not differ between the treatment et al. 2004; Arend et al. 2011; Zang et al. 2011). Scots pine and control plots. (Pinus silvestris L.) and sessile oak (Quercus petraea L.), We also further discuss the ecological and practical sil- for instance, are less susceptible to drought (Walentowski vicultural implications of growth responses to episodic and et al. 2007; Zang et al. 2011, 2012) than Norway spruce and extended drought. becoming more suitable for forestry in Central Europe under climate change scenarios that predict future warm and dry conditions. Possible silvicultural practices in view of climate Materials and methods change include down regulating stand density (D’Amato et al. 2013; Sohn et al. 2016), modified thinning practices Description of the study sites (Gebhardt et al. 2014; Pretzsch et al. 2018; Rodríguez-Cal- cerrada et al. 2011), and the promotion of mixed tree species Kranzberg Forest (longitude: 11° 39′ 42″ E, latitude: 48° plantings (Ammer 2017). The latter’s efficacy, however, has 25′ 12″ N, altitude 490 m a.s.l) is located in Southern Ger- yet to be assessed for drought mitigation (Grossiord 2018). many, approximately 35 km Northeast of Munich. Average Most current knowledge on tree responses to drought is annual precipitation is 750–800 mm yr−1 with 460–500 mm derived from the analyses of episodic drought events like during the growing season (May–September). The average those in 1976, 2003, and 2015. However, the effects of annual air temperature is 7.8 °C and 13.8 °C on a seasonal extended drought periods on tree growth, as expected under basis. At the site, monospecific and mixed-species stands of future climate scenarios, are still unknown. It is currently Norway spruce and European beech stock grow on luvisol thought that the ability of trees to acclimate to drought is originating from loess over Tertiary sediments that provide a underestimated (Lapenis et al. 2005; Reich et al. 2016). For- high nutrient and water supply (Göttlein et al. 2012; Pretzsch ests may acclimate to extended drought by physiological, et al. 1998). Depending on soil depth, the water holding morphological, and allometric adjustment at the tree level capacity for plant available water ranges between 17 and (Aasamaa et al. 2004; Pretzsch et al. 2013; Schuldt et al. 28% of volumetric soil water content, while soil pHH2O var- 2016), and by density reduction, structural, and species com- ied between 4.1 and 5.1. positional changes at the stand level (Lapenis et al. 2005). We characterized the water supply for each year by calcu- Here, we analysed and compared the growth responses of lating the index of de Martonne (1926) (M = precipitation/ Norway spruce (Picea abies [L.] Karst.) and European beech (temperature + 10)) on the basis of the precipitation (in mm) (Fagus sylvatica [L.]) to natural episodic and experimentally and temperature (in °C) for the whole year (My) and for the extended drought in mature monospecific and mixed-species growing season from April to September (Mgs). Because of stands of Norway spruce and European beech in the Kran- its minimal data requirement, this index has been widely zberg Forest. This study utilized the throughfall exclusion used in the recent studies to describe the drought conditions experiment KROOF in the Kranzberg Forest (Pretzsch et al. or aridity for a given region (Rötzer et al. 2012; Pretzsch 2014; Tomasella et al. 2018; Hesse et al. 2019) and addi- et al. 2013; Quan et al. 2013). The water supply for plant tional long-term tree measurements nearby (Pretzsch et al. growth improves with increasing M index. Within our study, 1998). To better understand the long-term effects of drought Mgs varied between 12 and 24 and My between 30 and 65. on tree growth in intra- and inter-specific environments, we concentrated on the following questions and hypotheses: Throughfall exclusion experiment and control plots Q1: How do species react to natural drought events (rep- resented by the years 2003 and 2015) in intra- versus inter- We established 12 experimental plots in Kranzberg, i.e., 6 specific environments? throughfall exclusion (TE) plots and 6 control plots (CO). H1: The growth adjustments of Norway spruce and Euro- Plot sizes varied between 110 and 200 m 2. Summed over all pean beech do not differ and are equal in intra-specific and plots, the total area was 868 m and 862 m2 for the CO and 2 inter-specific environments. TE plots, respectively. Q2: How do species respond to extended (5-year-long) Before starting the throughfall exclusion experiment, soil experimentally induced drought? What drives adjust- and root trenching was performed in spring 2010. Soil was ments in growth with a focus on intra- versus inter-specific trenched to about 1 m deep and 15 cm wide and lined with environments? a heavy-duty plastic tarp, impermeable to water and root H2: The growth of Norway spruce is equal to European growth, and refilled with the original soil material (Pretzsch beech; intra-specific responses do not differ from inter-spe- et al. 2016). At about 1 m depth, a dense clay layer of ter- cific responses; and all trees in a stand react similarly. tiary sediments limits further downward-rooting (Häberle Q3: How does the extended (5-year-long) experimentally et al. 2015). In the six TE plots, roofs were installed about induced drought affect the tree mortality? 3 m from the ground, completely underneath the stand 13
Trees canopy, to exclude all forms of precipitation. Roofs were were similar between the plots. The tallest trees (as used first closed in 2014. for calculating height of the dominant trees by Assmann Roofs closed automatically in response to precipita- and Franz 1963) had heights of 34.3 m (spruce) and 33.0 m tion, and only stayed closed during precipitation events (beech) indicating optimal growing conditions, i.e., site to prevent micro-meteorological and physiological effects indexes of O40 according to the yield table of Assmann (Pretzsch et al. 2014). Because the aim of the experiment and Franz (1963, 1965) for Norway spruce and I. site class was to induce summer drought, the roofs were kept open in according to Schober (1975) for European beech. the winter months. This resulted in small annual precipita- The quadratic mean stem diameters at breast height tion amounts for the throughfall exclusion plots in the years were 27.1–36.4 cm, with mean heights of 27.2–36.4 m. 2014–2018. The winter precipitation amounts for the 5 years Dominant tree diameters measured 41.4–44.9 cm. The of the experimental drought were below 150 mm (Fig. 1). stem diameters were the lowest in the monospecific stands; Due to the natural drought in 2015 a bark beetle infesta- in the beech by 20% lower than in spruce. Stem diameters tion was observed across the entire Kranzberg Forest. There- were the highest in mixed-species stands; with beech again fore, starting within the year 2015, bark beetle damage was by about 20% lower than in spruce. The tree heights were confined through annually spraying the spruce crowns and similar in monospecific and mixed species stands; on aver- stem surfaces with the contact insecticide Karate Forst liquid age, beech is by 5 m lower than spruce. Collectively, there using the canopy crane. were 639–926 trees per hectare with a stand basal area Stand water was variable in the study years 1998–2018. of 54.0–60.1 m2 ha−1, standing stem volume of 802–981 Extreme dry years in 2003 and 2015 had significantly lower m3 ha−1, and a mean periodic volume growth (1998–2016) precipitation amounts compared to the rather moist years of 19.4–26.3 m3 ha−1 yr−1. The lower values of the given of 2001–2002 and 2005–2013. Accordingly, the Martonne ranges for tree number, stand basal area, standing volume, index varied from 30 (2003) to 65 (2001) for the whole year and volume growth of the monospecific beech stands, the and from 15 (2003) to 25 (2005) for individual growing sea- upper values of the monospecific spruce stands, and the sons. Meteorological data were acquired from a nearby for- mixed species stands lie in between (for more stand infor- est weather station “Freising”, which is part of the Bavarian mation, see Pretzsch et al. 2014, 2018). Environmental Monitoring System (LWF 2017). For further We utilized two data sources to evaluate tree diameter. information about the Kranzberg Forest, see Göttlein et al. Since 1998, all trees of the Kranzberg Forest site were (2012); Häberle et al. (2012), and for more details about the equipped with permanent diameter tapes with Vernier KROOF experiment, see Pretzsch et al. (2014, 2018). scales for circumferential recording to a 1 mm resolution (UMS, Germany). These data, excluding those from the Dendrometric survey throughfall exclusion experiment, were used to analyse the natural episodic drought in 2003 and 2015 to answer ques- A full survey of the Kranzberg Forest experimental plots tion Q1. Thus, diameter and circumferential stem growth in 2016 determined Norway spruce was 65 and European at breast height were recorded for 268 spruce and 141 beech was 85 years old. Mean and dominant tree sizes Fig. 1 Temperature (left), precipitation (middle), and Martonne index 2014 to 2018 (TE plots). The years 2003 and 2015 are indicated by (right) since 1998 by years (black line) and growing seasons (May– broken vertical lines and represent years with extremely low water September, grey line) for the Kranzberg Forest site. The thin lines availability represent to conditions on the plots with throughfall exclusion from 13
Trees beech trees for 2003 and for 214 spruce and 108 beech Based on the stem diameter, d i at the beginning of trees for 2015 (Table 1). each year i and the annual circumferential growth ic i, To analyse species response to extended drought (Ques- equal to the annual diameter growth id i = ic i/π within tion Q2), another 51 Norway spruce and 51 European beech the year i, we calculated the annual basal area growth were equipped with girth tapes and first measured in 2011. ibai = ∕4 × (di + idi )2 − ∕4 × d2i = ∕4 × (2 × di × idi + Half of the trees were under the throughfall exclusion roofs idi 2) (Assmann 1961, p. 52). to mimic extreme summer drought conditions from 2014 to 2018, the other half served as controls (Pretzsch et al. 2016) Methods (Table 2). To compare the mortality of Norway spruce and Euro- Quantification of intra‑ and inter‑specific environments pean beech under episodic and extended drought (Question 3), we utilized both data sets, the long-term records from Species composition within each tree’s environment was 1998–2018 (episodic droughts) and the time series from quantified via an algorithm that counted the species identity 2014 to 2018 (experimentally extended drought) (Table 4). of its six nearest neighbours (Fig. 2). The neighbours were Table 1 Characteristics of Norway spruce and European beech in response to episodic droughts in 2003 and 2015 Year 2003 n d2002 cm h2002 m SDI2002 ha-1 iba2000–2002 cm2 iba2003 cm2 Rt iba2004–2006 year-1 year-1 cm2 year-1 N. spruce 268 Mean 28.12 26.79 860 21.19 8.6 0.41 13.64 ± SE 0.56 0.26 18 1.01 0.4 0.71 E. beech 141 Mean 22.76 24.59 805 8.95 6.84 0.76 8.58 ± SE 0.69 0.37 20 0.96 0.7 0.93 Year 2015 n d2014 cm h2014 m SDI2014 ha-1 iba2012–2014 cm2 iba2015 cm2 Rt iba2016–2018 year-1 year-1 cm2 year-1 N. spruce 214 Mean 34.26 32 1009 16.84 8.58 0.51 11.02 ± SE 0.61 0.29 22 0.97 0.44 0.65 E. beech 108 Mean 27 21.1 898 6.53 7.03 1.08 6.75 ± SE 0.84 0.45 24 0.75 0.8 0.74 The mean stem diameter d, tree height h, and local stand density index, SDI, are given for autumn 2002 and 2014, i.e., before the start of the drought. The annual basal area increment, iba, is reported for the 3-year period before the drought, the drought year, and the 3-year period after the drought (PreDr, Dr, and PostDr, respectively). The ratio (bold letters) between the basal area in the 3-year periods before the drought and the dry year represents the drought resistance Rt Table 2 Characteristics of the Norway spruce and European beech trees included in the throughfall exclusion experiment from 2011 to 2018 (throughfall exclusion from 2014 to 2018) Species Group N d2013 cm h2013 m SDI2013 ha-1 iba2011–2013 cm2 iba2014–2018 cm2 iba2014–2018 / year-1 year-1 iba2011–2013 N. spruce CO 25 Mean 35.8 31.8 777 17.4 13.4 0.77 ± SE 1.56 0.37 73 1.3 0.8 TE 26 Mean 35 32 816 19.9 4.6 0.23 ± SE 1.8 0.42 35 1.7 0.4 Growth loss 0.30 E. beech CO 25 Mean 28.2 28.3 851 6.8 8.5 1.25 ± SE 1.8 0.68 44 0.9 0.9 TE 26 Mean 28.8 27.9 823 7.1 4.9 0.69 ± SE 1.8 0.65 43 1.1 0.5 Growth loss 0.55 The current mean stem diameter d, and tree height h, and the local stand density index, SDI, are given for autumn 2013, i.e., before the start of the throughfall exclusion. The annual tree diameter increment, id, and basal area increment, iba, are reported for the 3-year period before the drought (2011–2013) and for the throughfall exclusion period (2014–2018) 13
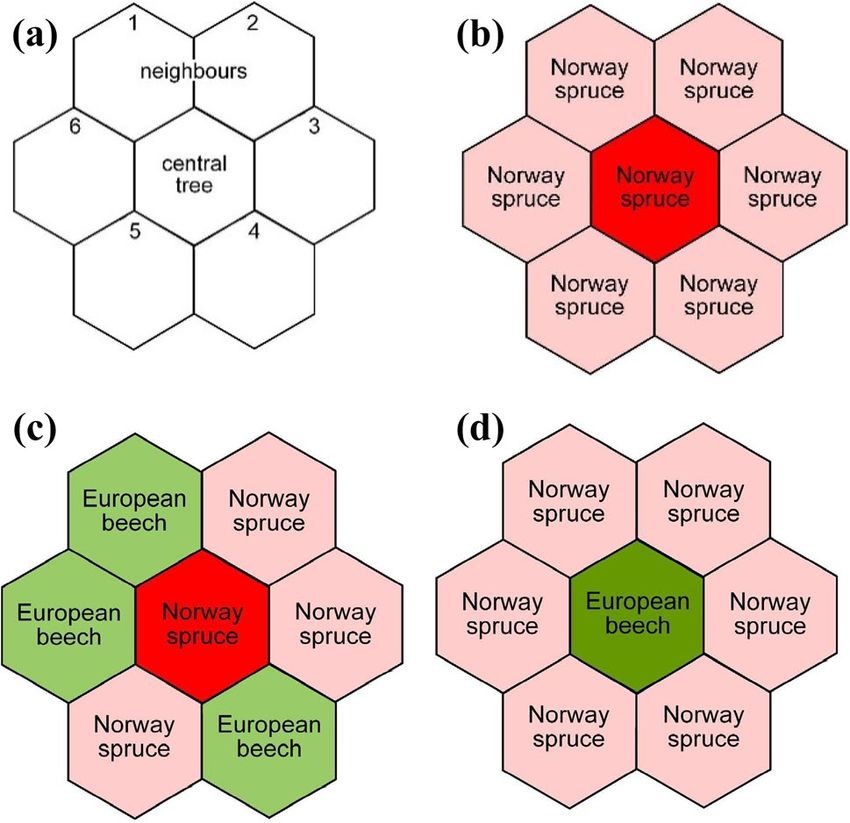
Trees In other words, only completely pure tree groups were char- acterized as ss or bb. Calculation of resistance and resilience The response of tree basal area increment, iba ( cm2 yr−1), to the natural drought stress events in the years 2003 and 2015 was characterized by three different phases: (a) the growth PreDr in the 3-year-periods before the drought years 2003 and 2015, respectively, (b) the growth Dr during the drought years 2003 and 2015, respectively, and (c) the 3-year growth PostDr after the two drought years 2003 and 2015, respectively (Lloret et al. 2011). Indices for resistance, Rt = Dr/PreDr, recovery, Rc = PostDr/Dr, and resilience, Rs = postDr/PreDr, were used for the characterization of the stress response patterns. Resistance quantifies the growth decrease from the pre-drought period to the drought period. Rt = 1 indicates complete resistance; the further the value decreases below Rt = 1, the lower the resistance. Recovery Fig. 2 Method of characterizing a central tree’s (tree in the middle describes the tree growth response after the drought period. of the respective hexagons) intra- or inter-specific environment; this Rc = 1 indicates a persistence at the low-growth level even approach was developed as an algorithm for automatic sorting into after the drought period, values of Rc < 1 indicate a further the groups ss, sb, bs, and bb. a In mature stands, trees grow in a hex- decline, and values Rc > 1 represent a recovery from the agonal distribution pattern and have 6 direct neighbours (no. 1…6) on average. b In this case, Norway spruce is in the centre and the drought period. Resilience is defined as tree growth after environment is by 100% (6 trees/6 trees × 100), the category is ss. c the drought period compared to the tree growth before the Here, Norway spruce is surrounded by three Norway spruce and three drought period. Rs values > = 1 indicate high resilience with European beech, the admixture of another species apart from Norway growth levels that are equal to or above the level before the spruce is > 0 and the group is sb. d Here, the grouping is bs, as beech is surrounded by Norway spruces (ss Norway spruces in neighbour- drought event; Rs values < 1 indicate low resilience with hood of Norway spruces, sb Norway spruces in neighbourhood of growth levels below the one before the drought period. For European beeches, European beeches in neighbourhood of European a more detailed description of these indices, see Lloret et al. beeches, bs European beeches in neighbourhood of Norway spruces) (2011). chosen irrespectively of their size and social position; due to Indexing, trend elimination, and smoothing its advanced development state, the stand mainly consisted of codominant and dominant trees. Based on the results, To evaluate the individual tree growth response to drought, we assigned each tree to one of four groups, ss = spruce we used the original annual iba data from the permanent surrounded by spruce, sb = spruce surrounded by beech, girth tapes. We used the original data without trend elimi- bb = beech surrounded by beech, and bs = beech surrounded nation, smoothing, etc. due to the following reasons. (i) in by spruce. contrast to the annual diameter or tree ring width growth, In an advanced stand development phase like Kranzberg the trends of the annual iba growth rates tracked more or Forest, the trees in even-aged stands grow more or less in less parallel to the x-axis, except near drought years (2003, a hexagonal pattern (Prodan 1968a, b), i.e., each tree has 2015) and the throughfall exclusion period (2014–2018). on average six direct neighbours (n = 1…6) (Fig. 2a). Fig- Therefore, no significant up- or down-age trends would ure 2b shows an ss constellation where the central tree is a bias the resistance or resilience analyses. (ii) The time span spruce tree surrounded by spruces. The proportion of other from 1998–2018 was too short to smooth or eliminate any tree species in its environment is 0% as. The constellation trend, since in this time span, there were two natural drought in Fig. 2c results analogously in a group membership of sb events (2003, 2015) and one experimentally induced growth and mother = 3∕6 × 100 = 50 %. Figure 2d shows a constel- decline resulting from water limitation. Any attempt to fit a lation of bs where beech is surrounded just by spruces, so smooth curve through the 20-year-period would be question- that mother = 6∕6 × 100 = 100 %. We choose a rather strict able as the period was too short and more than a quarter of separation between monospecific and mixed environments. the period would have been overlayed by non-age-related As soon as the environment included another species other disturbances; (iii) because the stands are even-aged and the than the species of the central tree, it was re-characterized. trees all show more or less the same age trend. This applies 13
Trees especially for the trees of the precipitation exclusion experi- long-term trend in annual basal area (± se) growth from ment, as they were all dominant and even more homogene- 1998 to 2018 decreased slightly for Norway spruce and ous in the growing conditions and trends than the full data remained stable for European beech (Fig. 3). This long- set. (iv) We compared the results only between groups with term trend, however, was interrupted by dips in annual the same general age trend (Norway spruce vs. European growth in 2003 and 2015, especially for Norway spruce. beech, intra- inter-specific growth, TE vs. CO), so any influ- In general, European beech was much more resistant to ence of the age on the resistance or resilience indices should the drought years. be eliminated as the trends in both groups were similar. Norway spruce had reduced growth in both drought years (2003 and 2015), while European beech was only Estimation of mortality rates slightly reduced in 2003 and even increased in 2015 (see bold printed ratios of resistance Rt in Table 1). These data Mortality rate calculations were based on the tree num- clearly show that the growth of Norway spruce is severely bers, N, at the beginning Nb, and end Ne, of the obser- negatively impacted (50–60%) by drought, while European vation periods. Using the compound interest formula, beech trees are much less effected. Ne = Nb × 1.0mn , the mortality rates, m, and percent of The basal area increment of Norway spruce, in general, mortality, m% = m × 100, were calculated for defined groups grew twice as much as European beech. In the drought of trees (e.g., CO and TE). Hereby, n represents the length year 2003, Norway spruce’s growth decreased to 41% and of the period in years. For our purpose, the basic √ equation European beech to Rt = 76% compared to the 3-year-period Ne = Nb ×√1.0mn was transformed to 1.0m = n Ne ∕Nb and before. After 2003, spruce was slower to recover than beech. m = 1 − n Ne ∕Nb to arrive at the mortality rate m. Note In 2015, Norway spruce was also less resistant than Euro- that the term 1.0 m is the convention of writing 1.0 + m in pean beech: spruce decreased to Rt = 51% of the initial incre- financial mathematics. ment level in response to the drought event, while beech Mortality rates were calculated separately for the tree increased incremental growth, surpassing the rate of growth groups under episodic and experimentally extended drought in the 3-year-period before the drought (see bold numbers and separately within these groups for Norway spruce and in Table 1). European beech. To reveal any intra- and inter species-specific response The statistical software R 3.4.1 (R Core Team 2018) was pattern to drought, we analysed the growth response in the used for all calculations, in particular the glht and t test func- drought years 2003 and 2015 (Dr) compared with the 3-year- tions for group comparison and lme function for regression period before (PreDr) and after (PostDr) the events. Drought analyses from the nlme package (Pinheiro et al. 2017). had a much stronger effect on Norway spruce growth com- pared to European beech despite their intra- and inter-spe- cific environments (Fig. 4a). Since the relationships between Results the species, and between the intra- and inter-specific dif- ferences were similar, we show the results for 2003 only Growth response to natural episodic drought (Fig. 4). Interestingly, Norway spruce was 10–20% less effected Trees exposed to throughfall exclusion were excluded by drought when growing in the environment of beech trees from the results presented in this section (= Tnt). For the (see sb in Fig. 4b), while reductions in spruce’s growth was drought events of 2003 and 2015, we show the periodic greater in intra-specific spruce environments in 2003. Intra- basal area increment in the 3 years before, during, and specific competition (group ss, n = 192, mean 0.43 ± 0.02) after the drought years (PreDr, Dr, PostDr) (Table 1). The had significantly reduced growth (p < 0.05) compared Fig. 3 Mean annual basal area increment (± SE) of (a) N. spruce (n = 268) and (b) E. beech (n = 141) from 1998 to 2018 excluding the trees under the throughfall exclusion roofs since 2014 (tree numbers refer to the year 2003). The broken vertical lines mark the drought event years 2003 and 2015 13
Trees Fig. 4 Visualization of the growth response to the 2003 drought with intra-specific constellations (ss). c When European beech grew based on the annual basal area increment (± SE). The pre-drought in inter-specific environment with spruce (bs, broken lines), it was growth in the period 2000–2002 is set to 1.0 (1.0-line). The growth more affected by drought by app. 20% compared with intra-specific in the drought year 2003 and in the post-drought period 2004–2006 constellation (bb). However, the recovery and resilience was much was sketched in relation to this reference level. a On average, growth faster in inter-specific compared with intra-specific constellation. (ss of Norway spruce (N. sp.) dropped steeply and recovered slowly, growth of Norway spruces in neighbourhood of Norway spruces, sb European beech (E. be.) was hardly affected by the 2003 drought. b growth of Norway spruces in neighbourhood of European beeches, bb When Norway spruce grew in inter-specific environment with beech growth of European beeches in neighbourhood of European beeches, (sb, broken lines), it was 20% less affected by drought compared bs growth of European beeches in neighbourhood of Norway spruces) to inter-specific competition (group sb, n = 62, mean Norway spruce grew less in the period of 2014–2018 0.56 ± 0.05). compared to the prior years, most likely due to the dry year European beech, on the other hand, were significantly in 2015. Trees in the CO plots exhibited a slight growth more effected under drought in inter-specific environments decrease from 2011 to 2013 compared to 2014–2018 but recovered quickly (see bs in Fig. 4c). Beech growing from 17.4 to 13.4 c m2yr−1. However, on the TE plots, the in the environment of other beech trees, in contrast, were decrease was much more severe from 19.9 to 4.6 cm2yr−1. much less affected by drought (see bb in Fig. 4c). In 2003, Using the relative growth (0.77) of the CO plot as a beech trees growing intra-specifically (group bb, n = 93, reference for the relative growth on the TE plots (0.23), mean 0.87 ± 0.07) grew significantly more (p < 0.05) than the growth level was 0.30 (see Table 2, in bold and italic trees in inter-specific environments (group bs, n = 23, numbers), i.e., a loss of 70% in annual growth. mean 0.67 ± 0.05). This means that when beech grew in an On the CO plots, European beech grew more in the inter-specific environment, it was by 23% more affected by period 2014–2018 than in the years 2011–2013, maybe drought compared to intra-specific conditions. This implies because of late frost event in spring 2011 (Bayerische For- that in dry years, Norway spruce benefited from growing in stverwaltung 2015). On the TE plots, we found a medium mixed stands, obviously at the expense of European beech, decrease from 7.1 to 4.9 c m2yr−1, i.e., a relative decrease as trees of the latter species significantly reduced their by 31%. Using, analogously to Norway spruce, the relative growth in inter-specific neighbourhood. Growth responses growth (1.25) of the CO plot as a reference for the relative to experimentally extended drought by throughfall exclusion growth on the TE plots was 0.69; the growth level was Before the start of the throughfall exclusion experiment in 0.55 (see Table 2, in bold and italic numbers), i.e., a loss 2014, we measured tree growth on the 6 CO and 6 TE plots of 45% of basal area growth. for the years 2011–2013 to have an initial growth level refer- The basal area increment of Norway spruce, in both CO ence. Compared to spruce, beech had less than half the mean and TE plots decreased over time, mainly a result of the basal area increment in the reference period 2011–2013 with dry year in 2015 (Fig. 5, a, b). However, in the TE plots some variation between the CO and TE plots of each spe- (Fig. 5b), the decrease was drastically more pronounced. cies (Table 2). On the 6 CO and 6 TE plots, we recorded the In 2016 and 2017, a few of the trees had an upward trend, course of growth of in total 102 dominant trees. The follow- i.e., demonstrated recovery. ing analyses are based on 51 trees for each of the two species Most European beeches had a positive growth trend on with 25 trees on the control plots and 26 on the treatment the CO plots (Fig. 5c) and a negative trend on the TE plots. Trees that suffered mortality were excluded from the plots (Fig. 5c) during the treatment period. However, analyses of growth reactions. some beech trees acclimated or even recovered during the 13
Trees

Fig. 5  Annual basal area increment of individual trees from 2010 (2014) on the TE plots. On the TE plots (2014–2018), Norway spruce
to 2018 shown for N. spruce and E. beech on the CO and TE plots. reduced its growth (b), while European beech responded minimally to
The vertical lines show the beginning of the throughfall exclusion drought (d)

throughfall exclusion period, i.e., in the years 2016–2018 responses in European beech; the average loss in annual
(Fig. 5d). basal area growth amounted to 45% (Table 2). Finally, we
 In summary, we found clear negative responses to the found some indications of acclimation and recovery for both
experimentally induced drought in Norway spruce; the tree species (see Fig. 6).
average loss in annual basal area growth amounted to 70% To more closely examine the stress response to the
(Table 2). We found medium drought-induced negative throughfall exclusion, we analysed the annual basal area

Fig. 6  Visualization of the resistance to the 2014–2018 through- throughfall exclusion and recovered remarkably in subsequent years
fall exclusion based on the annual basal area increment (± SE). Pre- compared to spruce in an intra-specific constellation (ss). c When
drought growth in the period 2011–2013 is set to 1.0 (1.0-line, solid European beech grew in an inter-specific environment with spruce
black), the growth in the years of the throughfall exclusion is shown (bs, broken lines), the beech trees grew better in the first years of
in relation to the pre-drought level. a On average, growth of Nor- drought, but then fell behind the growth of beech in intra-specific
way spruce (N. sp.) dropped steeply and recovered slowly; growth environment (bb) (ss growth of Norway spruces in neighbourhood of
of European beech (E. be.) dropped less strongly or even increased Norway spruces, sb growth of Norway spruces in neighbourhood of
above the level of the pre-drought period after four years. b When European beeches, bb growth of European beeches in neighbourhood
Norway spruce grew in inter-specific environments with European of European beeches, bs growth of European beeches in neighbour-
beech (sb, broken lines), it was 20–30% less affected during the hood of Norway spruces)

13
Trees

Table 3  Comparison of the Groups n Statistics Resistance iba [year]/ iba [2011–2013]
drought resistance on the TE
plots in the experimentally 2014 2015 2016 2017 2018
induced drought period
2014–2018 on annual basis N .spruce all 14 Mean 0.46 0.36 0.29 0.51 0.51
 SE ± 0.04 ± 0.05 ± 0.03 ± 0.06 ± 0.08
 E. beech 21 Mean 0.55 0.91 0.61 1.01 1.14
 SE ± 0.01 ± 0.03 ± 0.02 ± 0.04 ± 0.04
 Significance n. sig. p < 0.01 p < 0.01 p < 0.05 p < 0.05
 N. spruce Ss 8 Mean 0.32 0.18 0.13 0.19 0.12
 SE ± 0.01 ± 0.01 ± 0.01 ± 0.01 ± 0.01
 Sb 6 Mean 0.73 0.68 0.51 0.93 0.77
 SE ± 0.03 ± 0.03 ± 0.09 ± 0.09 ± 0.06
 Significance p < 0.01 p < 0.01 p < 0.05 p < 0.05 p < 0.05
 E. beech Bb 15 Mean 0.67 0.94 0.58 1.19 1.25
 SE ± 0.02 ± 0.05 ± 0.04 ± 0.06 ± 0.06
 Bs 6 Mean 0.5 0.91 0.68 0.56 0.88
 SE ± 0.04 ± 0.06 ± 0.03 ± 0.06 ± 0.07
 Significance n. sig. n. sig. p < 0.01 p < 0.01 p < 0.05

 In the first section, all Norway spruce are compared and tested against all European beech. In the second
 section of the table, Norway spruce in an intra-specific environment are compared with Norway spruce in
 an inter-specific environment (ss treated vs. sb treated). In the third section, European beech in an intra-
 specific environment is compared with European beech in an inter-specific environment with spruce (bb
 treated vs. bs treated)

increments in the years 2011–2018 (Fig. 6 and Table 3). We inter-specific environments compared with those growing
first compared the performance of the species (Fig. 6a). Note in an intra-specific constellation (Table 3).
that, in Fig. 6, the reference period 2011–2013 was marked Beech trees in both inter- and intra-specific conditions,
by a bold horizontal line at level 1.0, reaching from 2011 to however, responded to drought similarly at first (Fig. 6c).
2013. The mean year of this period is 2012. To visualize the However, from 2016, we found significant differences
growth after this reference period, we drew a connecting line between the two groups, i.e., beech in inter-specific environ-
from 2012, the mean of this reference period, to the relative ments outgrew those with spruce as neighbours (Table 3).
growth in the years 2014; from there, we continued the line
to the relative growth in 2015–2018. Mortality of Norway spruce and European beech
 Both species strongly reduced their growth in 2014, the caused by experimentally extended drought
first year after the throughfall exclusion experiment was ini-
tiated. Norway spruce continued to decrease over time but Mortality of trees within the plots with experimentally
stabilized in 2016–2018, while European beech stabilized extended drought would certainly impact the water supply
earlier and recovered to the initial level by 2018 (Table 3). and growth of the remaining trees, and, therefore, analysed
 As the average growth of European beech in the reference the mortality of Norway spruce and European beech in the
period 2011–2013 was probably reduced by the late frost TE plots compared with untreated reference groups, i.e., the
in spring 2011, we also calculated the growth response in CO group and the group of all trees of the site Kranzberg
the years afterwards after elimination of the year 2011 from Forest without the ones of the throughfall exclusion experi-
the reference. However, this hardly changed the results as ment (= Tnt) to improve the interpretation of our results.
the beeches quickly recovered already in 2012 from the late The mortality rate under natural conditions between
frost. This is visible in Fig. 5c and d, where the course of 1998 and 2018 was 1.24% for Norway spruce, 2.00% for
beech growth shows a strong upward trend in 2012. European beech, and 1.50% for the total stand. In the period
 For Norway spruce in particular, environment effected 1998–2019, no tree thinning occurred in the plots, so the
growth after experimentally extended drought stress given mortality rates represent the mean dropout under self-
(Fig. 6b). Spruces growing in the environment of other thinning conditions (Table 4).
spruces exhibited decreased growth much more than The throughfall exclusion experiment CO plots were also
spruces close to beech. There was a significantly lower not thinned. Mortality rates of 0.00% Norway spruce, 0.83%
stress response and greater growth in spruce growing in European beech, and 0.45% for the total stand occurred
 between 2011 and 2018. Tree mortality under throughfall

 13
Trees

Table 4  Tree numbers at the Group Species Begin Nb End Ne Number of Mortality
beginning, Nb, and at the end, years rate in %
Ne of the defined observation m%
periods for the trees of the Tnt
group and for the trees of the Tnt N. spruce 1998 277 2018 213 21 1.24
TE and the CO plots
 E. beech 1998 156 2018 102 21 2.00
 Total 1998 433 2018 315 21 1.50
 CO N. spruce 2011 26 2018 26 8 0.00
 E. beech 2011 31 2018 29 8 0.83
 Total 2011 57 2018 55 8 0.45
 TE N. spruce 2011 26 2018 14 8 7.45
 E. beech 2011 27 2018 24 8 1.46
 Total 2011 53 2018 38 8 4.07

 The mortality rate was √calculated based on the compound interest formulaNe = Nb × 1.0mn,
 1.0m = n Ne ∕Nb , m = 1 − n Ne ∕Nb , m% = m × 100 (see program KROOF2.mort.R)
 √

exclusion was much higher than for the Tnt group. However, Discussion
since 2011–2018 does not encompasses as many years as
the period from 1998–2018 and climatic conditions differed Many studies have tackled species-specific drought resist-
between the two periods, this comparison should be viewed ance outcomes in monoculture tree plantings. However, spe-
within the context of its limitations. cies structural and functional trait differences can result in a
 The comparison of the CO plot’s with the TE plot’s mor- particular species-specific stress responses when growing in
tality rates is more interesting, as they refer to the same time monocultures (Bréda et al. 2006; Niinemets and Valladares
period 2011–2018. Trees in plots with extended experimen- 2006) and a potential reduction of stress response when
tal drought had mortality rates of 7.45% for Norway spruce, growing in mixture (Ammer 2019; Grossiord 2018). Norway
1.46% for European beech, and 4.07% for the entire stand spruce is commonly assessed as a highly drought susceptible
(Table 4). Therefore, both species had higher mortality in TE species (Lévesque et al. 2013; Zang 2012), while European
plots compared with the CO plots, and in the case of Norway beech, although under debate (Rennenberg et al. 2004), is
spruce, the mortality rate was five times as high as the long- less affected by drought (Ammer et al. 2005; Ewald et al.
term mortality of the Tnt group. The ranking of the mortality 2004). Whether tree species growing in mixtures can reduce
rate between the considered groups was ss > sb > bs > bb. drought susceptibility may depend among other things on
Although it is difficult to assess the final causes of mortality the species combination (Metz et al. 2016; Pretzsch et al.
(drought, bark beetle, and competition for light), we assume 2013), the site conditions (Grossiord et al. 2014; Trouvé
that in case of Norway spruce, most of the mortality (70%) et al. 2017), and the stand density (Bottero et al. 2017; Sohn
was caused by bark beetle despite of the chemical control et al. 2016).
measures, some directly by drought (20%) and the rest by Norway spruce and European beech represent species
self-thinning due to competition (10%). The latter assump- with different hydraulic systems (xylem anatomy). Spruce
tions are based on the annual assessment of the vitality of all exhibits a more isohydric strategy (Lyr et al. 1992), reducing
individual trees on the 12 plots. An indication for mortality stomatal conductance at early stages of soil drought. In con-
caused by bark beetle were boring holes in the bark, boring trast, beech displays a more anisohydric strategy, with less
dust on the ground and galleries under the bark. We assumed stomata sensitivity to soil drought, allowing for more carbon
dropout by self-thinning in case of subdominant trees that gain, and stem and root growth during prolonged time spans
became continuously more competed by their neighbours under mild to moderate drought (Leuschner 2009; Nikolova
in the previous years. In case of those trees with transpar- et al. 2009). These differences along with the high drought
ent crowns that died although showing neither bark beetle susceptibility of Norway spruce at the edge of its natural
infestation nor suppression by neighbours, we assumed a range and the maximum stand density within the experi-
dropout by drought stress. mental stands used here may have contributed to the sub-
 stantial and lasting decrease in spruces’ growth compared
 to the minor growth reduction of beech under both episodic
 (Fig. 4a) and extended (Fig. 6a) drought.
 Whether the potential of resource use, stress reduction,
 and even overyielding in mixed stands can be exploited by
 a given species assemblage depends on the respective site

13
Trees

conditions (Forrester et al. 2014). Under ample water supply, its maximum productivity in years with ample water sup-
e.g., a spatial or temporal complementarity of water uptake ply and when disturbances [e.g., bark beetle (Ips typogra-
may be less useful than under drought. This explains why phus L.) or gregarious spruce sawfly (Pristiphora abietina
even rather complementary tree species may change the way (Christ.) (Hym., Tenthredinidae)] were controlled by forest
which they grow in mixtures from beneficial to disadvanta- management (Skatulla et al. 1989; Wermelinger 2004). Liv-
geous along ecological gradients (Pretzsch et al. 2015). ing at the edge of an ecological niche can have amplified
 The temporal shift in the water uptake, i.e., that the tran- deleterious effects on species when small temporal envi-
spiration of Norway spruce starts earlier than European ronmental changes can have strong non-linear effects on
beech (Rötzer et al.2017a), may explain the benefit of Nor- growth and fitness. For Norway spruce, this means that the
way spruce when growing in inter-specific neighborhood trees may be more susceptible to decline in drought years
in the analysed stands (Figs. 4b and 6b). We hypothesize (Biermayer and Tretter 2016; Kölling et al. 2009) or that
that spruce in proximity to beech benefits from a better the trees have a requirement for facilitated positive inter-
water supply in the spring when beech is still leafless (see specific interactions (Brandl and Falk 2019; del Río et al.
e.g. Rötzer et al. 2017a). This pre-emptive water uptake by 2014; Pretzsch et al. 2012). In addition, Norway spruce is
spruce may reduce the water availability and growth of beech generally characterized by rather high mortality rates also
in the environment of spruce as observed on the TE plots in its natural range (Synek et al. 2020).
of this study. This assumption is substantiated by measure- The restrictions and risks of cultivating Norway spruce
ments of soil moisture and water uptake by depth (Goisser beyond its natural occurrence are important to understand for
et al. 2016) and micro-dendrometer trajectories (Rötzer et al. forest practice. Because of its high productivity, excellent tim-
2017b) which show seasonal shifts during spring drought ber, and multi-purpose use, Norway spruce is highly valued
and negative (during summer drought) soil moisture effects and has a long history and tradition, especially in monocul-
of beech neighboured by spruce. This underlines that the tures far off its natural range in mountainous regions of Central
time of the year in which a drought occurs in mixed-species Europe and the Boreal region. The increasing tree damage
stands determines which species may benefit or lose in inter- in monocultures by both biotic and abiotic (snow breakage,
specific neighbourhood. wind) disturbances have resulted changes to forest practices
 The slight basal area growth recovery of both species including a move away from planting Norway spruce solely
after the initial downtrend of under experimentally extend in monocultures. An alternative is mixed stand plantings that
drought (Fig. 6) is of special interest as it suggests an ability support more stable tree species, e.g., European beech, silver
to adapt to drought stress. fir, Douglas-fir, or Scots pine, while maintaining a significant
 Enhanced compensation growth of fine roots upon population of Norway spruce.
drought (e.g., in beech, Meier and Leuschner et al. 2008), The silvicultural tools mitigating forest damage from
adjustment of the mycorrhiza to an increased share of long- drought are comprised of a selection of well acclimated
distance exploration types (Nickel et al. 2018), and accli- species and provenances (Atzmon et al. 2004; Arend et al.
mation of the branches and leaves to drought (Barbeta and 2011; Bolte et al. 2010; Zang et al. 2011), downregulation
Penuelas, 2016; Tomasella et al. 2018) may be effective of stand density (D’Amato et al. 2013; Sohn et al. 2016),
measures of drought acclimation. and thinning (Gebhardt et al. 2014; Pretzsch et al. 2018;
 An increase of mortality of Norway spruce, e.g., caused Rodríguez-Calcerrada et al. 2011). An additional measure
by bark beetle attacks combined with extended drought, may may be increased tree species mixtures although not yet
reduce the stand density and, in this way, may improve the rated effective for drought mitigation in general (Grossiord
water supply of the remaining trees on the TE plots and 2018). Our study provides an example of how tree mixtures
contribute to their recovery. can reduce stress and allow for continued growth of Norway
 The analysed stands are within the range of natural spruce when growing closely mixed with European beech.
occurrence of European beech but at the limit of the distri- This required single tree mixture, whereas most common in
bution range of Norway spruce (Bayerisches Staatsminis- forest practice are mixtures in groups or clusters. Cultivation
terium für Ernährung, Landwirtschaft und Forsten (2001). of European beech in two or three groups or clusters embed-
The site conditions at Kranzberg Forest allow both spe- ded in Norway spruce stands has the economic advantages
cies nearly maximum productivity, indicated by the site of facilitated beech establishment (Wagner et al.2010), better
indexes of O40 according to the yield table of Assmann timber quality when growing in intra-specific environment
and Franz (1963) for Norway spruce and site class I, accord- (Höwler et al. 2019; Pretzsch and Rais 2016), and an easier
ing to Schober (1975) for European beech. But growing at harvest (Hanewinkel 2001). In the common group or cluster
the edge of its ecological niche, Norway spruce achieved mixtures, Norway spruce would most likely mainly benefit

 13
Trees when growing at the edges of the beech groups, in close Acknowledgements Open Access funding provided by Projekt DEAL. environment of beech, but not in the other zones. This means The authors wish to thank the German Science Foundation (Deutsche Forschungsgesellschaft) for funding the projects “Structure and dynam- that Norway spruce, growing in the warm dry limit of its ics of mixed-species stands of Scots pine and European beech com- natural distribution, seems to be facilitated most effectively pared with monospecific stands; analysis along an ecological gradient when growing directly next to groups of European beech through Europe” (# DFG PR 292/15-1) and "From near-death back to which is natural in this area. This suggests that the choice of life: Mixed stands of spruce and beech under drought stress and stress recovery. From pattern to process (# DFG PR 292/22-1). We would a climate smart species mixing pattern might be another tool also like to thank the Bavarian State Ministry for Environment and in the silvicultural package of measures mitigating drought Consumer Protection for funding the project “Pine (Pinus sylvestris) damages. and beech (Fagus sylvatica) in mixed stands: suitable partners to ensure productivity on dry sites in times of climate change (KROOF II) (# GZ: TKP01KPB-73853) and the Bavarian State Ministry for Nutri- tion, Agriculture, and Forestry for funding the project, W047 “ (# GZ: Conclusions 7831-28160-2018). We further thank the European Union for funding the project “Mixed species forest management. Lowering risk, increas- Experimentally extended drought established by a 5-year ing resilience (REFORM)” (# 2816ERA02S, PCIN2017-026) under the framework of Sumforest ERA-NET, the Bayerische Staatsforsten throughfall exclusion experiment enabled new insights into (BaySF) for supporting the establishment of the plots and the Bavarian how Norway spruce and European beech may respond to State Ministry for Nutrition, Agriculture, and Forestry for permanent future climate change scenarios that predict longer and more support of the project W 07”Long-term experimental plots for forest intense drought periods. The extended drought caused a growth and yield research “ (# 7831-22209-2013). Thanks also go to anonymous reviewers for their constructive criticism. drastically reduced growth in the first years, followed by a less severe decline in the subsequent period. To some Compliance with ethical standards extent, both species were able to acclimate to the drought and recover from the initial growth collapse, after exposure Conflicts of interest The authors declare that they have no conflict of to episodic droughts. Norway spruce benefited significantly interest. from growing in the environment of European beech, while beech overcame drought slightly better in intra- specific Open Access This article is licensed under a Creative Commons Attri- environments. bution 4.0 International License, which permits use, sharing, adapta- tion, distribution and reproduction in any medium or format, as long The considered site is representative for many areas as you give appropriate credit to the original author(s) and the source, in Southern Germany where Norway spruce is cultivated provide a link to the Creative Commons licence, and indicate if changes beyond its natural range, and while it can achieve opti- were made. The images or other third party material in this article are mal productivity under average climatic conditions, which included in the article’s Creative Commons licence, unless indicated otherwise in a credit line to the material. If material is not included in becomes susceptible to drought and biotic disturbances dur- the article’s Creative Commons licence and your intended use is not ing dry years. permitted by statutory regulation or exceeds the permitted use, you will Many recent studies show that tree species mixing can need to obtain permission directly from the copyright holder. To view a result in overyielding compared to monospecific stands and copy of this licence, visit http://creativecommons.org/licenses/by/4.0/. can increase the resistance of Norway spruce against biotic disturbances (e.g. bark beetle damages). The mixture of the highly productive and economically valuable Norway spruce References with stabilizing trees species such as European beech may reconcile economy with ecology. The revealed drought stress Aasamaa K, Sõber A, Hartung W, Niinemets Ü (2004) Drought accli- mation of two deciduous tree species of different layers in a tem- relief of Norway spruce in inter-specific environments may perate forest canopy. Trees 18(1):93–101 be a strong argument in favour of a transition to mixed spe- Allen CD, Breshears DD, McDowell NG (2015) On underestimation of cies forest stands and their superior ecosystem services. global vulnerability to tree mortality and forest die-off from hotter drought in the Anthropocene. Ecosphere 6(8):1–55 Ammer C (2017) Unraveling the importance of inter- and intraspecific competition for the adaptation of forests to climate change. In: Cánovas FM, Lüttge U, Matyssek R (eds) Progress in Botany, vol Author contributions statement 78. Springer, Heidelberg, pp 345–367 Ammer C (2019) Diversity and forest productivity in a changing cli- mate. New Phytol 221(1):50–66 HP, TG, and KP initiated the project. TR, K.-HH, TG, KP, Ammer C, Albrecht H, Borchert H, Brosinger F, Dittmar C, Elling W, TB, and HP developed and established the experimental Kölling C (2005) Zur Zukunft der Buche (Fagus sylvatica L.) design, HP and TR evaluated the data and wrote the manu- in Mitteleuropa. Kritische Anmerkungen zu einem Beitrag von script. TR, TG, K.-HH, KP, and TB revised the manuscript. Rennenberg et al. Allg Forst u J- Ztg 176(4):60 Arend M, Kuster T, GünthardtGoerg MS, Dobbertin M (2011) Prov- enance-specific growth responses to drought and air warming in 13
Trees three European oak species (Quercus robur, Q. petraea and Q. Grossiord C, Granier A, Ratcliffe S, Bouriaud O, Bruelheide H, pubescens). Tree Phys 31(3):287–297 Chećko E, Scherer-Lorenzen M (2014) Tree diversity does not Assmann E, Franz F (1963) Vorläufige Fichten-Ertragstafel für Bayern. always improve resistance of forest ecosystems to drought. PNAS Forstl Forschungsanst München, Inst Ertragskd, p 104 111(41):14812–14815 Assmann E, Franz F (1965) Vorläufige Fichten-Ertragstafel für Bayern. Häberle KH, Weigt R, Nikolova PS, Reiter IM, Cermak J, Wieser Forstw Cbl 84(1):13–43 G, Blaschke H, Rötzer T, Pretzsch H, Matyssek R (2012) Case Atzmon N, Moshe Y, Schiller G (2004) Eco-physiological response to Study "Kranzberger Forst": Growth and Defence in European severe drought in Pinus halepensis Mill. trees of two provenances. Beech (Fagus sylvatica L.) and Norway Spruce (Picea abies (L.) Plant Ecol 171(1–2):15–22 Karst). In: R Matyssek et al. (eds.), Growth and Defence in Plants, Barbeta A, Penuelas J (2016) Sequence of plant responses to droughts Ecological Studies 220. Springer-Verlag Berlin, Heidelberg, pp of different timescales: lessons from holm oak (Quercus ilex) for- 243–271 10.1007/978–3–642–30645–7_11 ests. Plant Ecol Divers 9:321–338 Häberle KH, Rötzer T, Pritsch K, Matyssek R (2015) Experimenteller Bayerische Forstverwaltung (2015) Spätfrostschäden - erkennen und Trockenstress in einem Buchen-Fichten-Mischbestand (KROOF). vermeiden. Merkblatt 31, LWF Freising, 3 pp Mitteilungen der Deutschen Bodenkundlichen Gesellschaft Bd. Bayerisches Staatsministerium für Ernährung (2001) Landwirtschaft 117: 202–206. Jahrestagung München Exkursionsführer 2015, und Forsten (2001) Die regionale natürliche Waldzusammenset- Exkursion-Nr. E-02 zung Bayerns, LWF Bericht 32, Bayerische Staatsforstverwaltung, Hanewinkel M (2001) Economic aspects of the transformation Bayer. Landesanstalt für Wald und Forstwirtschaft, Freising from even-aged pure stands of Norway spruce to uneven-aged Biermayer G, Tretter S (2016) Wie viel Fichte geht noch im Klimawan- mixed stands of Norway spruce and beech. For Ecol Manage del. Vorschlag für eine Übergangsstrategie für Hochleistungs- 151(1–3):181–193 standorte. LWF aktuell 1(2016):44–49 Hesse B, Goisser M, Hartmann H, Grams TEE (2019) Repeated sum- Bolte A, Ammer C, Löf M, Nabuurs GJ, Schall P, Spathelf P (2010) mer drought delays sugar export from the leaf and impairs phloem Adaptive forest management: a prerequisite for sustainable for- transport in mature beech. Tree Physiol 3:192–200 estry in the face of climate change. Sustainable Forest Manage- Höwler K, Vor T, Seidel D, Annighöfer P, Ammer C (2019) Analyzing ment in a Changing World. Springer, Dordrecht, pp 115–139 effects of intra-and interspecific competition on timber quality Bottero A, D’Amato AW, Palik BJ, Bradford JB, Fraver S, Battaglia attributes of Fagus sylvatica L.—From quality assessments on MA, Asherin LA (2017) Density-dependent vulnerability of forest standing trees to sawn boards. Eur J For Res 138(2):327–343 ecosystems to drought. J Appl Ecol 54(6):1605–1614 Kölling C, Knoke T, Schall P, Ammer C (2009) Überlegungen zum Brandl S, Falk W (2019) Mortalität von Fichte und Buche-Einfluss von Risiko des Fichtenanbaus in Deutschland vor dem Hintergrund Klima und Mischung. AFZ-Der Wald 2:10–13 des Klimawandels. Forstarchiv 80(2):42–54 Bréda N, Huc R, Granier A, Dreyer E (2006) Temperate forest trees Lapenis A, Shvidenko A, Shepaschenko D, Nilsson S, Aiyyer A (2005) and stands under severe drought: a review of eco-physiological Acclimation of Russian forests to recent changes in climate. Glob responses, adaptation processes and long-term consequences. Chang Biol 11(12):2090–2102 Annals For Sci 63(6):625–644 Leuschner C (2009) Die Trockenheitsempfindlichkeit der Rotbuche vor Ciais P, Reichstein M, Viovy N, Granier A, Ogée J, Allard V, Cheval- dem Hintergrund des prognostizierten Klimawandels. Jahrbuch lier F (2005) Europe-wide reduction in primary productivity der Akademie der Wissenschaften zu Göttingen: 281–296 caused by the heat and drought in 2003. Nature 437(7058):529 Lévesque M, Saurer M, Siegwolf R, Eilmann B, Brang P, Bugmann D’Amato AW, Bradford JB, Fraver S, Palik BJ (2013) Effects of thin- H, Rigling A (2013) Drought response of five conifer spe- ning on drought vulnerability and climate response in north tem- cies under contrasting water availability suggests high vulner- perate forest ecosystems. Ecol Appl 23(8):1735–1742 ability of Norway spruce and European larch. Glob Chang Biol del Río M, Schütze G, Pretzsch H (2014) Temporal variation of compe- 19(10):3184–3199 tition and facilitation in mixed species forests in Central Europe. Lloret F, Keeling EG, Sala A (2011) Components of tree resilience: Plant Biol 16(1):166–176 effects of successive low-growth episodes in old ponderosa pine Ewald J, Felbermeier B, von Gilsa H, Huss J, KenkG KC, Meyer forests. Oikos 120(12):1909–1920 P (2004) Zur Zukunft der Buche (Fagus sylvatica L.) in Mit- LWF (2017) http://www.lwf.bayern.de/boden-klima/umweltmonitorin teleuropa. Eur J For Res 123:45–51 g. Accessed July 2017 Forrester DI (2014) The spatial and temporal dynamics of species inter- Lyr H, Fiedler HJ, Tranquillini W (1992) Physiologie und Ökologie actions in mixed-species forests: from pattern to process. For Ecol der Gehölze. G Fischer Verlag, Jena Manage 312:282–292 Meier IC, Leuschner C (2008) Belowground drought response of Gebhardt T, Häberle KH, Matyssek R, Schulz C, Ammer C (2014) The European beech: fine root biomass and carbon partitioning in 14 more, the better? Water relations of Norway spruce stands after mature stands across a precipitation gradient. Glob Change Biol progressive thinning. Agr For Met 197:235–243 14:2081–2095 Göttlein A, Baumgarten M, Dieler J (2012) Site conditions and tree- Metz J, Annighöfer P, Schall P, Zimmermann J, Kahl T, Schulze internal nutrient partitioning in mature European beech and Nor- ED, Ammer C (2016) Site-adapted admixed tree species reduce way spruce at the Kranzberger Forst. In: Matyssek R, Schnyder drought susceptibility of mature European beech. Glob Change H, Osswald W, Ernst D, Munch JC, Pretzsch H (eds) Growth and Biol 22(2):903–920 Defence in Plants–Resource Allocation at Multiple Scales. Eco- Nickel UT, Weikl F, Kerner R, Schäfer C, Kallenbach C, Munch JC, logical Studies 220. Springer, Berlin, pp 193–211 Pritsch K (2018) Quantitative losses vs. qualitative stability of Goisser M, Geppert U, Rötzer T, Paya A, Hube A, Kerner R, Bau- ectomycorrhizal community responses to 3 years of experimental erle T, Pretzsch H, Pritsch K, Häberle KH, Matyssek R, Grams summer drought in a beech–spruce forest. Global Change Biol TEE (2016) Does belowground interaction with Fagus sylvatica 24(2):e560–e576 increase drought susceptibility of photosynthesis and stem growth Niinemets Ü, Valladares F (2006) Tolerance to shade, drought, and in Picea abies? For Ecol Manage 375:268–278 waterlogging of temperate Northern Hemisphere trees and shrubs. Grossiord C (2018) Having the right neighbors: how tree species diver- Ecol Monographs 76(4):521–547 sity modulates drought impacts on forests. New Phytol. https: //doi. org/10.1111/nph.15667 13
You can also read


