Low growth resilience to drought is related to future mortality risk in trees
←
→
Page content transcription
If your browser does not render page correctly, please read the page content below
ARTICLE
                  https://doi.org/10.1038/s41467-020-14300-5                     OPEN

                  Low growth resilience to drought is related
                  to future mortality risk in trees
                  Lucía DeSoto             et al.#

                  Severe droughts have the potential to reduce forest productivity and trigger tree mortality.
                  Most trees face several drought events during their life and therefore resilience to dry
1234567890():,;

                  conditions may be crucial to long-term survival. We assessed how growth resilience to severe
                  droughts, including its components resistance and recovery, is related to the ability to survive
                  future droughts by using a tree-ring database of surviving and now-dead trees from 118 sites
                  (22 species, >3,500 trees). We found that, across the variety of regions and species sampled,
                  trees that died during water shortages were less resilient to previous non-lethal droughts,
                  relative to coexisting surviving trees of the same species. In angiosperms, drought-related
                  mortality risk is associated with lower resistance (low capacity to reduce impact of the initial
                  drought), while it is related to reduced recovery (low capacity to attain pre-drought growth
                  rates) in gymnosperms. The different resilience strategies in these two taxonomic groups
                  open new avenues to improve our understanding and prediction of drought-induced
                  mortality.

                  #
                      A full list of authors and their affiliations appears at the end of the paper.

                  NATURE COMMUNICATIONS | (2020)11:545 | https://doi.org/10.1038/s41467-020-14300-5 | www.nature.com/naturecommunications   1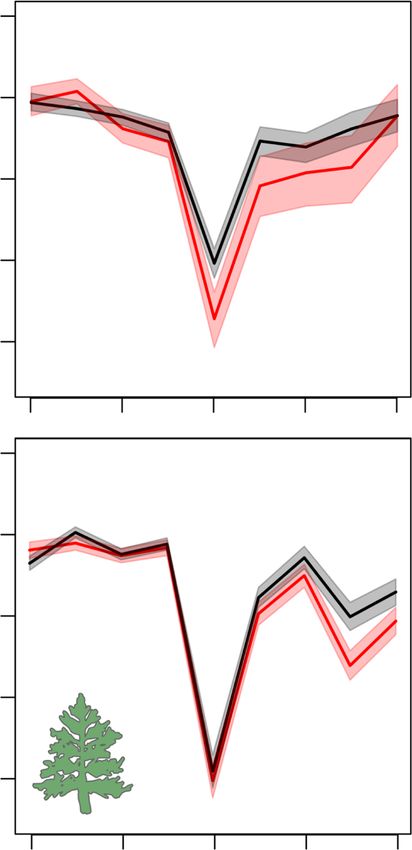
ARTICLE NATURE COMMUNICATIONS | https://doi.org/10.1038/s41467-020-14300-5
F
orests provide essential ecosystem services1–4, yet are how these legacies affect the ability of trees to cope with future
strongly threatened by deforestation, fragmentation and drought events in terms of mortality risk, which would determine
climate change5,6. Particularly, drought events associated long-term demographic responses.
with increasing temperatures have the potential to reduce forest Here we took advantage of a recently assembled pancontinental
productivity and prompt tree mortality in many areas of the database22 to study the relationship between past resilience to
world7–10. Models of climate change predict significant increases drought and mortality risk under subsequent drought events. The
in the frequency, duration and severity of droughts in vast regions database contains tree-ring width (TRW) series for surviving and
of the globe11. Alleviating negative effects of climate change on dead trees from 118 sites and >3500 individuals around the globe
forests requires global and long-term strategies12. Therefore, there (mostly from the temperate, Mediterranean and boreal ecosys-
is an urgent need to better understand the processes underlying tems of the Northern hemisphere), including 22 species (8
drought-induced tree mortality worldwide as a prerequisite to angiosperms and 14 gymnosperms; Fig. 1, Supplementary
adapt forest management strategies to climate change. Data 1). Because surviving and dead trees were sampled con-
Many studies have assessed the physiological mechanisms currently at the same sites (matched-pairs case–control study),
related to carbon and water economy, underlying drought- this database is ideal to assess and compare growth patterns of
induced mortality with the aim of developing reliable, mechan- trees before mortality22. We quantified tree resilience to drought
istic indicators of mortality risk (e.g. refs. 13–16). Other efforts using three indices that were proposed by Lloret et al.33 and
have been directed towards more empirical indicators, usually calculated them on time series of both TRW and basal area
based on radial growth as a compound measure of tree vitality increment (BAI). The indices are: (1) resistance, the ratio between
(e.g. refs. 17–22). An important factor to consider is that, while radial growth during the drought year and radial growth in the
severe drought may trigger tree mortality within a population, period immediately before; (2) recovery, the ratio between radial
some trees can be less vulnerable to dry conditions than others growth in the period immediately after the drought and radial
and survive14,23–25. Since most trees face several drought events growth during the drought year; and (3) resilience, the ratio
during their lives, high resilience to drought might determine between post-drought and pre-drought radial growth. Based on
long-term tree survival. mixed-effect models, we then analysed the relationships between
Resilience describes the capacity of a system to maintain its these three resilience indices and future mortality risk, also
functions after the impact of an exogenous disturbance26. Some accounting for the effects of taxonomic group (angiosperms vs.
studies suggested that low resilience to drought may boost tree gymnosperms) and several variables characterising environ-
mortality risk27–29. However, to our knowledge, no study has mental conditions and tree size (see “Methods”).
evaluated the direct linkage between resilience to drought and We hypothesised that trees that ultimately died during drought
future mortality risk mainly because it is difficult to empirically events (hereafter now-dead trees) were already less resilient to
evaluate both resilience and mortality on the same individual tree. droughts that occurred decades before their death, relative to
Short- and long-term responses of trees to drought can be surviving trees from the same population. We also expected that
assessed using tree-ring data, allowing a retrospective quantifi- the nature of this relationship would differ between angiosperm
cation of drought effects at annual resolution for numerous and gymnosperm trees, due to their contrasting trait syndromes
individuals, sites and species (e.g. refs. 30,31). Growth resilience and drought response strategies30,34,35. Finally, we assessed how
can be defined as the capacity of a tree to reach growth rates the relationship between drought resilience and future mortality
similar to those prior to drought. Defined this way, resilience risk depends on (i) the long-term water availability of each site
encompasses the capacity to reduce the impact of the disturbance, (characterised by the aridity index calculated as the ratio between
i.e. resistance, and the ability to return to pre-disturbance growth precipitation and potential evapotranspiration (PET)), (ii) the
levels after drought, i.e. recovery32,33. These two components of intensity of the drought event under consideration and (iii) soil
resilience may vary within taxonomic groups. Pinaceae species properties.
(gymnosperms) tend to show stronger and longer legacies in Our findings confirm that trees that died during water
radial growth after drought (slower recovery) than Fagaceae shortages were less resilient to previous non-lethal droughts,
species (angiosperms)30,34. Nonetheless, little is known about relative to coexisting surviving trees of the same species. This is,
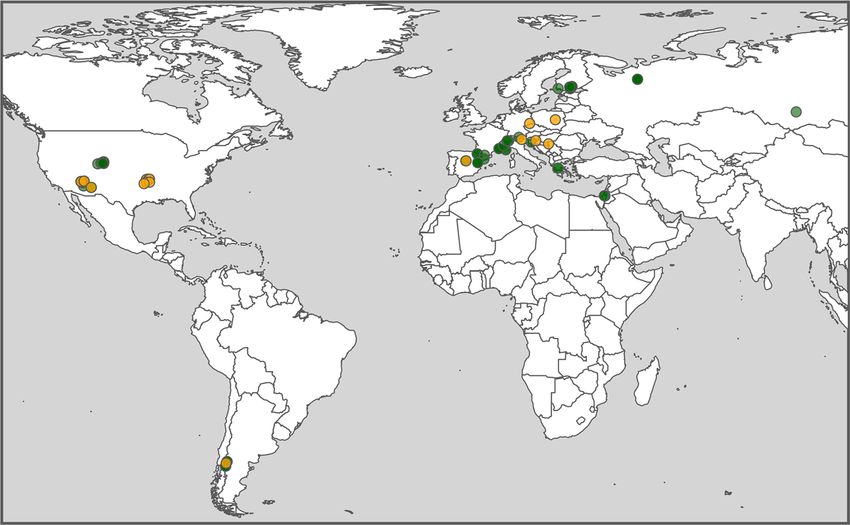
a b 30
20
Mean annual temperature (°C)
10
Biomes
Boreal forest
Mediterranean
0 Subtropical desert
Temperate forest
Temperate grassland desert
Temperate rain forest
–10 Tropical forest savanna
Tropical rain forest
Tundra
0 1000 2000 3000 4000
Mean annual precipitation (mm)
Fig. 1 Spatial and climatic ranges of the study. a Geographical distribution and b Whittaker biome classification for the study sites. The angiosperm
(orange) and gymnosperm (green) tree species included in the analysis are depicted (see Supplementary Data 1 for the description of the populations).
2 NATURE COMMUNICATIONS | (2020)11:545 | https://doi.org/10.1038/s41467-020-14300-5 | www.nature.com/naturecommunications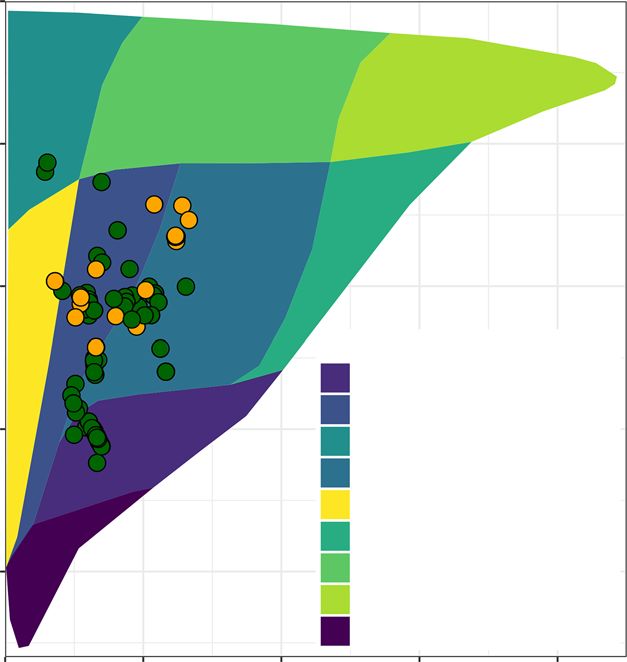
NATURE COMMUNICATIONS | https://doi.org/10.1038/s41467-020-14300-5                                                                              ARTICLE

to our knowledge, the first empirical evidence linking low growth                          a 1.1
resilience to past droughts with increased mortality risk across                                                                   0.001**
tree species and regions. Although this result is consistent for
angiosperms and gymnosperms, we show that the key component

                                                                                           Resilience
                                                                                                        1.0
of resilience that is involved (resistance vs. recovery) differs
between these two taxonomic groups. This is in accordance with
the fundamental differences in their drought response strategies,                                       0.9
such as avoidance of hydraulic failure or allocation to carbon
storage.                                                                                                0.8
                                                                                                               Now-dead        Surviving
Results
                                                                                          b                    Angiosperms         Gymnosperms
Mortality risk is associated with low resilience to drought. Our
                                                                                                        1.0
results show that trees that died because of drought were indeed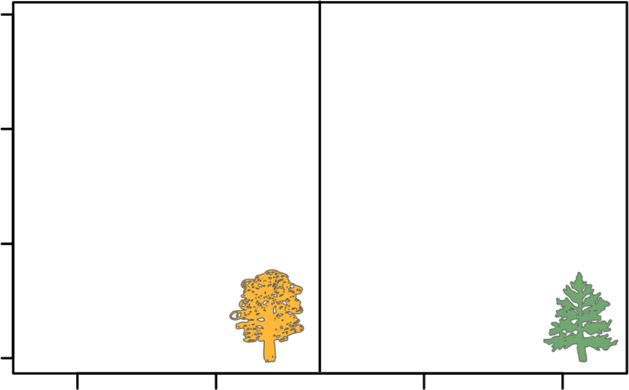
ARTICLE                                                                                             NATURE COMMUNICATIONS | https://doi.org/10.1038/s41467-020-14300-5

 Table 1 Summary of the fitted linear mixed model of resilience, resistance and recovery.

                                                              Std. β                       CI                                         df                         t/χ2                      P
 Resilience
    Fixed effects
        (Intercept)                                           −0.062                       −0.121, −0.004                             72.9                       −2.00                      0.049
        Surviving                                             −0.091                       −0.142, −0.037                             2623.9                     −3.43                      0.001
        DBHi                                                  −0.001                       −0.001, 0.000                              2536.1                     −4.04
NATURE COMMUNICATIONS | https://doi.org/10.1038/s41467-020-14300-5 ARTICLE
0.2 It is noteworthy that resilience and its components are also
Angiosperms independent of the intensity of the drought (measured as the
absolute Standardised Precipitation Evapotranspiration Index
0.0 (SPEI)49 or the SPEI difference between the relevant periods;
see “Methods” and Table 1 and Supplementary Tables 2–4). This
is consistent with a recent global study that did not find a strong
–0.2 link between the magnitude of the legacy effects after drought and
its intensity30.
Soil properties influence growth responses to drought. Soil
–0.4
fertility increases resistance but reduces recovery, particularly in
surviving trees. These opposing effects determine a neutral effect
–0.6 of soil fertility in the resilience of now-dead trees and a negative
log2 (growth rate)
effect on the resilience of surviving trees (Table 1, Supplementary
Fig. 6). The latter effect is consistent with a detrimental role of
high nutrient availability on drought survival due to preferential
0.2 biomass allocation aboveground50. It is also important to
Gymnosperms
consider that drought can have direct effects on soil fertility51
and on the composition of soil bacterial and fungal commu-
0.0 nities52, which may underlie some of the legacy effects on tree
growth reported in this study and elsewhere30.
Finally, resilience but not its components is negatively related
–0.2
to tree size (diameter at breast height (DBH); Table 1,
Supplementary Fig. 6). Similarly, several studies reported higher
–0.4 sensitivity to drought in larger trees, particularly in the
tropics53,54, probably due to hydraulic limitations related to tree
height55. However, note that tree size and age effects may be
–0.6 confounded and cannot be disentangled in purely observational
studies such as ours56.
–4 –2 0 2 4 Discussion
Years Even though previous studies have related tree growth patterns to
drought-induced mortality both at local and global scales17–22,
Fig. 3 Growth patterns before, during and after the drought event studied
our study provides, to our knowledge, the first empirical evidence
(year = 0) for angiosperms and gymnosperms. Data are presented as the
linking low growth resilience to past droughts (sensu Lloret
average of log ratio between tree-ring width (TRW) at a given year and the
et al.33) with increased risk of tree mortality across species and
average growth for the 4-year pre-drought period for surviving (black lines)
regions. We acknowledge that the spatial coverage of our data set
and now-dead (red lines) trees. Shaded areas represent the 95%
is limited largely to temperate, Mediterranean and boreal biomes,
confidence intervals of the means from bootstrapping (1000 resamplings).
although it encompasses substantial variation in geographic and
Source data are available in Digital.CSIC repository (https://doi.org/
climatic conditions within these regions (Fig. 1). Lack of infor-
10.20350/digitalCSIC/10536).
mation from the tropics reflects current tree-ring data avail-
ability57. Expanding this type of analysis to tropical forests should
(Fig. 1), we do not find consistent effects of aridity on growth be possible in the near future due to the renewed interest and
resilience and its components. On the one hand, we find a sig- methodological developments in tropical dendroecology58.
nificant positive interaction between tree status and aridity on We also show that the ability to resist the immediate impacts of
resilience and, to a lower extent, on resistance (Table 1, Supple- drought is linked to long-term mortality risk in angiosperms,
mentary Fig. 6), suggesting that surviving trees in more humid whereas recovery capacity appears to control the likelihood of
sites are more resilient due to a better capacity to resist the initial drought-induced mortality in gymnosperms. Our results confirm
drought impact. On the other hand, recovery is always inde- that growth resilience to past and current droughts should be
pendent from aridity, and aridity has no effect on resistance when considered as a promising proxy to assess future mortality risk at
BAI is used as a measure of growth instead of TRW (Supple- the individual tree level, bringing new tools to identify early
mentary Table 3). Recent large-scale studies reported that resis- signals of mortality and improving our capacity to forecast forest
tance increases with the ratio between soil moisture and PET, die-off under future climates.
whereas resilience increases with precipitation34,47. Results con-
cerning the recovery appear mixed, with slower30 or faster34,48
Methods
recovery in dry than in wet forests. These contrasting findings Growth data. We selected TRW (mm) data sets from the pancontinental database
may indicate that vulnerability to drought is to some extent compiled by Cailleret et al.22, for which (i) both dying and surviving trees growing
decoupled from the exposure to climatic water deficits precisely together at the same site were cored, (ii) all individual TRW series had been
because species distributions reflect (and tend to adjust to) the successfully cross-dated and (iii) mortality was mainly induced by drought, solely
or in combination with other factors, such as bark beetles, fungi or mistletoes6
long-term climatic environment. Consistent with this view, (Fig. 1, Supplementary Data 1). The database included 127 sites mostly located in
hydraulic safety margins have been shown to be similar across the boreal, temperate and Mediterranean biomes of North America and Europe.
biomes regardless of their rainfall environment39. Moreover, We used two metrics of tree growth, TRW and BAI (mm2). Although TRW and
differences between studies could be explained by different biotic BAI show size and age effects, BAI reduces the pure geometric effect associated
with the increase in tree DBH.
and abiotic conditions, experimental designs and modelling
approaches. Overall, a universal pattern of the relationship
Drought characterisation. To explore the effect of drought on tree growth, we
between local climate and resilience remains hitherto inconclusive used the SPEI as a drought metric49. The SPEI is a multi-scale drought index
and deserves further investigation. calculated from the monthly difference between precipitation and PET. The
NATURE COMMUNICATIONS | (2020)11:545 | https://doi.org/10.1038/s41467-020-14300-5 | www.nature.com/naturecommunications 5ARTICLE NATURE COMMUNICATIONS | https://doi.org/10.1038/s41467-020-14300-5
specific SPEI index we employed uses precipitation data from the Climate Research Climate covariate. To account for climate diversity found across the study
Unit (CRU TS 3.22) data set and PET data from the FAO-56 Penman–Monteith populations, we used the Global Aridity Index that provides high-resolution (30
estimation, with a spatial resolution of 0.5°. Positive and negative SPEI values arc-seconds) raster climate data for the 1970–2000 period65. The Global Aridity
correspond to relatively wet and dry conditions, respectively. The SPEI can be Index is the ratio between mean annual precipitation and mean annual reference
computed at different time scales to characterise the duration and intensity of evapotranspiration, based upon the implementation of the Penman Monteith
droughts because the SPEI value assigned to a particular month is calculated based Evapotranspiration equation for reference crops and using the WorldClim 2.0 data
on the averaged SPEI values of a time window covering the previous n months. For (http://worldclim.org/version2). The aridity index indicates rainfall over potential
each study site, SPEI values from 1901 to 2013 with a 1- to 24-month time win- vegetation water demand (aggregated on an annual basis), and its value thus
dows were obtained from SPEIbase v.2.3 (2014, http://hdl.handle.net/10261/ increases under more humid conditions and decreases with more arid conditions.
104742). The SPEI has been used for large-scale and long-term studies because it
allows the comparison among sites with contrasting climates and accounts for
Soil covariate. We accounted for the variation in soil properties by means of two
timing and duration of drought during the current and previous years59. high-resolution soil databases from the International Soil Reference and Infor-
mation Centre (ISRIC–World Soil Information). First, we used the WISE30sec
Selecting the SPEI time windows. Extreme drought events were detected by database (WISE Soil Property Databases) that comprises a set of harmonised soil
combining information from growth and SPEI time series. We selected the optimal profiles at 30 arc seconds (~1 km at the equator), including 20 soil properties
time window of SPEI that maximised the goodness-of-fit of a linear model between derived from statistical analyses of ca. 21,000 soil profiles (https://www.isric.org/
SPEI and the residual chronology of standardised growth for each site. We con- explore/wise-databases)66. Second, we used SoilGrids, a global gridded soil
sidered different SPEI time windows for each site because species and biomes information system at 250 m that provides global predictions for standard
respond to drought at specific time scales24,59. First, we standardised the TRW numeric soil properties at seven standard depths (0, 5, 15, 30, 60, 100 and 200 cm)
series with the R package “dplR”60 in the R environment61. Each individual TRW and depth to bedrock based on ca. 150,000 soil profiles (https://www.isric.org/
series was fit to a cubic smoothing spline (the frequency response was set to 0.50 at explore/soilgrids)67. We included ten soil characteristics to describe soil fertility in
a wavelength of 67% of the time span of each series). An autoregressive model was the study populations: organic carbon (g kg−1), total nitrogen (g kg−1), carbon/
then applied to the individual fitted series and the residuals of the resulting model nitrogen ratio, bulk density (kg dm−3) and available water capacity (from −33 to
were standardised by dividing them by the mean. Finally, a residual chronology for −1500 kPa; cm m−1) from WISE30sec database and absolute depth to bedrock
each site was obtained by averaging the individual residual indices using Tukey’s (cm), pH measured at 200 cm and clay, silt and sand content (%) measured at 60
biweight robust mean. This standardisation was flexible enough to preserve high- cm from the SoilGrids250m database. We conducted an ordination analysis of
frequency climatic information while removing the low-frequency variability these soil characteristics at the study sites using principal component analysis
caused by tree age or size, or by external disturbances62,63. (PCA) with the “FactoMineR” R package68 in the R environment61. The first
Second, we used monthly SPEI values for 24 different month scales (from component of this PCA explained 55% of the variance and was positively asso-
1 month to 2 years), ending in 5 target months corresponding to summer and early ciated with nitrogen concentration, organic content and available water capacity
autumn (from June to October for the sites located in the Northern Hemisphere (Supplementary Fig. 5). This component was interpreted as indicator of soil fer-
and from December of the previous year to May of the current year of ring growth tility and included as an explanatory variable in our statistical models.
in the Southern Hemisphere). For each site, we analysed the relationship between
the residual chronology and the 120 different SPEI windows (5 target months × Comparison between surviving and now-dead trees. We analysed growth dif-
24 month scales) for the common period (1931–1980) using linear regression
ferences between coexisting now-dead and surviving trees for the three different
models. For each of the 120 linear models per site, residual chronologies were the
response variables (resistance, recovery and resilience) around a severe drought
response variable and the SPEI for a given time window was the fixed explanatory
previous to the mortality event, using linear mixed models (LMMs). Resistance,
variable. A Gaussian error distribution with an identity link was used. We
recovery and resilience were log-transformed to satisfy normality of the LMM
compared model performance using the Akaike Information Criterion (AIC) to
residuals and considered as the response variables assuming a Gaussian error
select the best model for each site, and its corresponding SPEI time window was
distribution with an identity link. In the initial full LMM, the included fixed effects
used for the subsequent analyses (see Supplementary Data 2).
were: (1) tree status (surviving vs. now-dead), (2) taxonomic group (angiosperms
vs. gymnosperms), (3) DBH in the year of the drought event (DBHi, where i refers
Detecting extreme drought events. We selected a single drought event for each to the target drought event); (4) the relative intensity of the drought event,
site because the frequency and intensity of drought events can differ among sites49. expressed as the SPEI value during the drought event (SPEIi) and the SPEI dif-
The drought event was selected within a 30-year period following two steps. First, ference corresponding to each metric, for resistance,
to discard exceptional long mortality periods, we excluded now-dead trees that died
>50 years before the last death event recorded at a given site. Second, to avoid SPEIdiff resist ¼ SPEIi PreSPEI ð4Þ
selecting drought events either too close or too distant in time to the mortality
event, we limited the time period from 10 to 40 years before the first tree dying in for recovery,
each site (Supplementary Fig. 1). Within this period, we selected one drought event
per site following two criteria: (1) SPEI less than the 10th percentile of the site- SPEIdiff recov ¼ PostSPEI SPEIi ð5Þ
specific SPEI distribution (Supplementary Fig. 1a), and (2) abnormal low growth in
and for resilience,
the same year or in the year after (mean TRW of the site was reduced >5% relative
to the average TRW of the 4 previous years). Growth reductions the year after the SPEIdiff resil ¼ PostSPEI PreSPEI ð6Þ
drought were rare but were considered, because depending on drought timing and
the species tolerance, some trees might show a delay in their growth response to (5) the length of the time period between the drought event and the last year
drought64 (e.g. Supplementary Fig. 1b). After discarding 9 sites that did not meet recorded in the ring-width series of each tree (Δtime), to control for temporal
the latter criteria, we considered 118 sites with 2456 and 1454 co-occurring, sur- effects (mortality risk might be more related to a drought that occurred 10 years
viving and now-dead trees, respectively, of 22 species (8 angiosperms and 14 ago than 40 years ago); (6) the average ratio between precipitation and PET as a
gymnosperms) for the subsequent analyses (Supplementary Fig. 1, Supplementary measure of climatic aridity; (7) the first principal component of the soil PCA as a
Data 1 and Data 2). measure of soil fertility; and (8) all the interactions between tree status (surviving
vs. now-dead) and each of the other fixed effects. Because of the strong collinearity
between SPEIi and SPEIdiffresist (R2 = 0.88, P < 0.001, N = 5928) and between SPEIi
Computing indices of resistance, recovery and resilience. We computed
and SPEIdiffrecov (R2 = −0.89, P < 0.001, N = 5928), we only considered the effect
resistance, recovery and resilience indices as proposed by Lloret et al.33, considering
of both SPEIi and SPEIdiffresil for the resilience LMM (SPEIdiffresil vs. SPEIi; R2 =
4 years before and after the drought event in agreement with Anderegg et al.30.
−0.24, P > 0.05, N = 5928). In all LMMs, random effects were estimated for the
Other periods around the studied drought (from 1- to 8-year period) were also
intercept with site nested in species and species nested in genus as grouping factors.
analysed resulting in similar outcomes (Supplementary Fig. 3).
We simplified each full LMM (Supplementary Table 1) by removing the least
The resilience indices were computed as:
significant terms until a minimum adequate model (in terms of AIC) was
identified69 (see Supplementary Table 2 for model selection).
Resistance ¼ Dr=PreDr ð1Þ
Identical analyses were also performed for resilience indices based on BAI
instead of TRW (Supplementary Tables 3–5; Supplementary Fig. 2). In all cases,
data exploration, model fitting, variance analyses and pairwise differences between
Recovery ¼ PostDr=Dr ð2Þ
the effects were computed with the R library “HighstatLib”70 and the R packages
“lme4”71, “car”72, “emmeans”73 and “effects”74 in the R environment61.
Resilience ¼ PostDr=PreDr ¼ resistance ´ recovery ð3Þ
Additional models. We tested the effects of the source of mortality and the
where PreDr was defined as mean raw TRW of the preceding 4-year period, Dr as interaction between taxonomic group and aridity on resilience indices based on
raw TRW of the drought year and PostDr as mean raw TRW of the subsequent 4- TRW. We used additional models separately from the main models for the sake of
year period. All indices were also calculated using BAI as a measure of growth. clarity.
6 NATURE COMMUNICATIONS | (2020)11:545 | https://doi.org/10.1038/s41467-020-14300-5 | www.nature.com/naturecommunicationsNATURE COMMUNICATIONS | https://doi.org/10.1038/s41467-020-14300-5 ARTICLE
We fitted models including the additional source of mortality (Supplementary 20. Liang, E., Shao, X., Kong, Z. & Lin, J. The extreme drought in the 1920s and its
Data 1) as reported in the original studies (cf. Cailleret et al.22) as fixed effect effect on tree growth deduced from tree ring analysis: a case study in North
(Supplementary Tables 6–8). These models did not perform better compared to the China. Ann. Forest Sci. 60, 145–152 (2003).
selected models reported in Table 1 and Supplementary Table 1 (see 21. Das, A. J., Battles, J. J., Stephenson, N. L. & van Mantgem, P. J. The
Supplementary Table 2 for model comparison), and hence this variable was not relationship between tree growth patterns and likelihood of mortality: a study
included in our final models. of two tree species in the Sierra Nevada. Can. J. Forest Res. 37, 580–597 (2007).
We fitted models including the interaction between taxonomic group and 22. Cailleret, M. et al. A synthesis of radial growth patterns preceding tree
aridity index to account for a potential covariation between these two variables. mortality. Glob. Chang. Biol. 23, 1675–1690 (2017).
This interaction was never significant, and the AIC of the corresponding models 23. Plaut, J. A. et al. Reduced transpiration response to precipitation pulses
was always slightly higher than that of the full model. We therefore did not include precedes mortality in a piñon–juniper woodland subject to prolonged
the interaction between taxonomic group and aridity index in the final models (see drought. N. Phytol. 200, 375–387 (2013).
Supplementary Tables 2 and 9). 24. Camarero, J. J., Gazol, A., Sangüesa-Barreda, G., Oliva, J. & Vicente-Serrano,
Note that all additional models were first compared with the full models S. M. To die or not to die: early warnings of tree dieback in response to a
(Supplementary Table 1) and then with reduced models (Table 1) when the effect severe drought. J. Ecol. 103, 44–57 (2015).
of the newly added variables was significant. 25. Gessler, A. et al. Drought induced tree mortality - a tree-ring isotope based
conceptual model to assess mechanisms and predispositions. N. Phytol. 219,
Reporting summary. Further information on research design is available in 485–490 (2018).
the Nature Research Reporting Summary linked to this article. 26. Holling, C. S. Resilience and stability of ecological systems. Annu. Rev. Ecol.
Syst. 4, 1–23 (1973).
27. Mitchell, P. J. et al. An ecoclimatic framework for evaluating the resilience of
Data availability vegetation to water deficit. Glob. Chang. Biol. 22, 1677–1689 (2016).
The data that support this study are available in the Plant Trait database (TRY), https://
28. Johnstone, J. F. et al. Changing disturbance regimes, ecological memory, and
www.try-db.org/. The source data of Figs. 2 and 3 are available in Digital.CSIC
forest resilience. Front. Ecol. Environ. 14, 369–378 (2016).
repository (https://doi.org/10.20350/digitalCSIC/10536).
29. Trugman, A. T. et al. Tree carbon allocation explains forest drought-kill and
recovery patterns. Ecol. Lett. 21, 1552–1560 (2018).
Received: 21 November 2018; Accepted: 5 December 2019; 30. Anderegg, W. R. L. et al. Pervasive drought legacies in forest ecosystems and
their implications for carbon cycle models. Science 349, 528–532 (2015).
31. Tardif, J., Camarero, J. J., Ribas, M. & Gutiérrez, E. Spatiotemporal variability
in tree growth in the Central Pyrenees: climatic and site influences. Ecol.
Monogr. 73, 241–257 (2003).
32. Hodgson, D., McDonald, J. L. & Hosken, D. J. What do you mean, ‘resilient’?
References Trends Ecol. Evol. 30, 503–506 (2015).
1. Pan, Y. et al. A large and persistent carbon sink in the world’s forests. Science 33. Lloret, F., Keeling, E. G. & Sala, A. Components of tree resilience: effects of
333, 988–993 (2011). successive low-growth episodes in old ponderosa pine forests. Oikos 120,
2. Ilstedt, U. et al. Intermediate tree cover can maximize groundwater recharge in 1909–1920 (2011).
the seasonally dry tropics. Sci. Rep. 6, 21930 (2016). 34. Gazol, A., Camarero, J. J., Anderegg, W. R. L. & Vicente-Serrano, S. M.
3. Bonan, G. B. Forests, climate, and public policy: a 500-year interdisciplinary Impacts of droughts on the growth resilience of Northern Hemisphere forests.
Odyssey. Annu. Rev. Ecol. Evol. Syst. 47, 97–121 (2016). Glob. Ecol. Biogeogr. 26, 166–176 (2017).
4. FAO. Food and Agriculture Organization of the United Nations. Global 35. Carnicer, J., Barbeta, A., Sperlich, D., Coll, M. & Peñuelas, J. Contrasting trait
Forest Resources Assessment 2015. How are the world’s forests changing? syndromes in angiosperms and conifers are associated with different
(FAO, 2016). responses of tree growth to temperature on a large scale. Front. Plant Sci. 4,
5. Houghton, R. A. & Nassikas, A. A. Negative emissions from stopping 1–19 (2013).
deforestation and forest degradation, globally. Glob. Chang. Biol 38, 42–49 (2017). 36. Hagedorn, F. et al. Recovery of trees from drought depends on belowground
6. Seidl, R. et al. Forest disturbances under climate change. Nat. Clim. Chang. 7, sink control. Nat. Plants 2, 16111 (2016).
395–402 (2017). 37. Poyatos, R., Aguadé, D., Galiano, L., Mencuccini, M. & Martínez-Vilalta, J.
7. Allen, C. D. et al. A global overview of drought and heat-induced tree Drought-induced defoliation and long periods of near-zero gas exchange play
mortality reveals emerging climate change risks for forests. Ecol. Manag. 259, a key role in accentuating metabolic decline of Scots pine. N. Phytol. 200,
660–684 (2010). 388–401 (2013).
8. Reichstein, M. et al. Climate extremes and the carbon cycle. Nature 500, 38. Carbone, M. S. et al. Age, allocation and availability of nonstructural carbon in
287–295 (2013). mature red maple trees. N. Phytol. 200, 1145–1155 (2013).
9. Ciais, P. et al. Europe-wide reduction in primary productivity caused by the 39. Choat, B. et al. Global convergence in the vulnerability of forests to drought.
heat and drought in 2003. Nature 437, 529–533 (2005). Nature 491, 752–755 (2012).
10. Allen, C. D., Breshears, D. D. & McDowell, N. G. On underestimation of 40. Johnson, D. M., McCulloh, K. A., Woodruff, D. R. & Meinzer, F. C. Hydraulic
global vulnerability to tree mortality and forest die-off from hotter drought in safety margins and embolism reversal in stems and leaves: why are conifers
the Anthropocene. Ecosphere 6, art129 (2015). and angiosperms so different? Plant Sci. 195, 48–53 (2012).
11. IPCC. Climate Change 2013: The Physical Science Basis. Contribution of 41. Choat, B. et al. Triggers of tree mortality under drought. Nature 558, 531–539
Working Group I to the Fifth Assessment Report of the Intergovernmental (2018).
Panel on Climate Change (Cambridge University Press, 2013). 42. Choat, B., Brodersen, C. R. & McElrone, A. J. Synchrotron X-ray
12. IPCC. Climate Change 2014: Mitigation of Climate Change. Contribution of microtomography of xylem embolism in Sequoia sempervirens saplings during
Working Group III to the Fifth Assessment Report of the Intergovernmental cycles of drought and recovery. N. Phytol. 205, 1095–1105 (2015).
Panel on Climate Change (Cambridge University Press, 2014). 43. Martínez-Vilalta, J. et al. Dynamics of non-structural carbohydrates in
13. Sevanto, S., McDowell, N. G., Dickman, L. T., Pangle, R. & Pockman, W. T. terrestrial plants: a global synthesis. Ecol. Monogr. 86, 495–516 (2016).
How do trees die? A test of the hydraulic failure and carbon starvation 44. Morris, H. et al. A global analysis of parenchyma tissue fractions in secondary
hypotheses. Plant. Cell Environ. 37, 153–161 (2014). xylem of seed plants. N. Phytol. 209, 1553–1565 (2016).
14. McDowell, N. et al. Mechanisms of plant survival and mortality during 45. Brodribb, T. J., Bowman, D. J. M. S., Nichols, S., Delzon, S. & Burlett, R. Xylem
drought: why do some plants survive while others succumb to drought? N. function and growth rate interact to determine recovery rates after exposure to
Phytol. 178, 719–739 (2008). extreme water deficit. N. Phytol. 188, 533–542 (2010).
15. Adams, H. D. et al. A multi-species synthesis of physiological mechanisms in 46. Wolfe, B. T., Sperry, J. S. & Kursar, T. A. Does leaf shedding protect stems
drought-induced tree mortality. Nat. Ecol. Evol. 1, 1285–1291 (2017). from cavitation during seasonal droughts? A test of the hydraulic fuse
16. Martinez-Vilalta, J., Anderegg, W. R. L., Sapes, G. & Sala, A. Greater focus on hypothesis. N. Phytol. 212, 1007–1018 (2016).
water pools may improve our ability to understand and anticipate drought‐ 47. Stuart-Haëntjens, E. et al. Mean annual precipitation predicts primary
induced mortality in plants. N. Phytol. 223, 22–32 (2019). production resistance and resilience to extreme drought. Sci. Total Environ.
17. Pedersen, B. S. The role of stress in the mortality of Midwestern oaks as 636, 360–366 (2018).
indicated by growth prior to death. Ecology 79, 79–93 (1998). 48. Isaac-Renton, M. et al. Northern forest tree populations are physiologically
18. Ogle, K., Whitham, T. G. & Cobb, N. S. Tree-ring variation in pinyon predicts maladapted to drought. Nat. Commun. 9, 1–9 (2018).
likelihood of death following severe drought. Ecology 81, 3237–3243 (2000). 49. Vicente-Serrano, S. M., Beguería, S. & López-Moreno, J. I. A multiscalar
19. Bigler, C. & Bugmann, H. Growth-dependent tree mortality models based on drought index sensitive to global warming: the Standardized Precipitation
tree rings. Can. J. Forest Res. 33, 210–221 (2003). Evapotranspiration Index. J. Clim. 23, 1696–1718 (2010).
NATURE COMMUNICATIONS | (2020)11:545 | https://doi.org/10.1038/s41467-020-14300-5 | www.nature.com/naturecommunications 7ARTICLE NATURE COMMUNICATIONS | https://doi.org/10.1038/s41467-020-14300-5
50. Gessler, A., Schaub, M. & McDowell, N. G. The role of nutrients in drought- supported by the Dutch Ministry of Agriculture, Nature and Food-quality (KB-29-009-
induced tree mortality 0.0164 and recovery. N. Phytol. 214, 513–520 (2017). 003); E.M.R.R. by the Research Foundation – Flanders (FWO, Belgium) and by the EU
51. Houle, D., Lajoie, G. & Duchesne, L. Major losses of nutrients following a under a Marie Skłodowska-Curie IF (No.659191); T.A. by the Kone Foundation; J.J.C. by
severe drought in a boreal forest. Nat. Plants 2, 16187 (2016). the Spanish Ministry of Science (CGL2015-69186-C2-1-R); K.C. by the Slovenian
52. Kaisermann, A., de Vries, F. T., Griffiths, R. I. & Bardgett, R. D. Legacy effects Research Agency ARRS (P4-0015); L.J.H. by the USDA Forest Service-Forest Health
of drought on plant–soil feedbacks and plant–plant interactions. N. Phytol. Protection and Arkansas Agricultural Experiment Station; V.I.K. by the RFBR (18-45-
215, 1413–1424 (2017). 240003 and 18-05-00432); T. Klein by the Merle S. Cahn Foundation and the Monroe
53. Bennett, A. C., McDowell, N. G., Allen, C. D. & Anderson-Teixeira, K. J. and Marjorie Burk Fund for Alternative Energy Studies (Mr. and Mrs. Norman Reiser),
Larger trees suffer most during drought in forests worldwide. Nat. Plants 1, the Weizmann Center for New Scientists and the Edith & Nathan Goldberg Career
15139 (2015). Development Chair; T.L. by the Slovene Research Agency (P4-0107, J4-5519 and J4-
54. Rowland, L. et al. Death from drought in tropical forests is triggered by 8216); J.C.L. by the Spanish Ministry of Science (CGL2013-48843-C2-2-R); H.M. by the
hydraulics not carbon starvation. Nature 528, 119–122 (2015). Academy of Finland (No.315495); G.S.-B. by a Juan de la Cierva-Formación from the
55. Ryan, M. G., Phillips, N. & Bond, B. J. The hydraulic limitation hypothesis Spanish Ministry of Economy and Competitiveness (MINECO, FJCI 2016-30121); D.B.S.
revisited. Plant Cell Environ. 29, 367–381 (2006). by the Ministry of Education and Science of the Republic of Serbia (III 43007); R.V.
56. Mencuccini, M. et al. Size-mediated ageing reduces vigour in trees. Ecol. Lett. partially by BNP-PARIBAS Foundation; and J.M.-V. by the MINECO (CGL2013-46808-
8, 1183–1190 (2005). R and CGL2017-89149-C2-1-R) and an ICREA Academia award. Finally, we specially
57. Zhao, S. et al. The International Tree-Ring Data Bank (ITRDB) revisited: data thank M. Berdugo, V. Granda, J. Moya, R. Poyatos, L. Santos del Blanco and R. Torices
availability and global ecological representativity. J. Biogeogr. 46, 355–368 (2019). for their assistance in R programming.
58. Rozendaal, D. M. A. & Zuidema, P. A. Dendroecology in the tropics: a review.
Trees - Struct. Funct. 25, 3–16 (2011).
59. Vicente-Serrano, S. M. et al. Response of vegetation to drought time-scales
Author contributions
L.DS., J.M.-V., M.C., F.S., S.J., K.K. and E.M.R.R. conceived the ideas and designed the
across global land biomes. Proc. Natl Acad. Sci. USA 110, 52–57 (2013).
methodology. M.C., T.A., M.M.A., C.B., J.J.C., K.Č., G.G.-I., S.G., L.J.H., A.-M.H., J.M.K.,
60. Bunn, A. G. A dendrochronology program library in R (dplR).
V.I.K., T. Kitzberger, T. Klein, T.L., J.C.L., H.M., W.O., A.P., B.R., G.S.-B., D.B.S., M.L.S.,
Dendrochronologia 26, 115–124 (2008).
R.V., and J.M.-V. collected the tree-ring data. L.DS., M.C., S.J., E.M.R.R. and J.M.-V.
61. R Core Team. R: a language and environment for statistical computing.
compiled and cleaned the ring-width database. L.DS. analysed the data, drafted and led
https://www.r-project.org/ (2015).
the writing of the manuscript with inputs from J.M.-V., M.C., F.S., S.J., K.K. and E.M.R.R.
62. Cook, E. & Peters, K. The smoothing spline: a new approach to standardizing
All authors contributed critically to the drafts and gave final approval for publication.
forest interior tree-ring width series for dendroclimatic studies. Tree-Ring Bull.
41, 45–53 (1981).
63. Cook, E. R. & Kairiukstis, L. A. Methods of Dendrochronology: Applications in Competing interests
the Environmental Sciences (Kluwer Academic Publishers, 1990). The authors declare no competing interests.
64. Martínez-Vilalta, J., López, B. C., Loepfe, L. & Lloret, F. Stand- and tree-level
determinants of the drought response of Scots pine radial growth. Oecologia
168, 877–888 (2012). Additional information
65. Trabucco, A. & Zomer, R. J. Global Aridity Index and Potential Supplementary information is available for this paper at https://doi.org/10.1038/s41467-
Evapotranspiration (ET0) Climate Database v2. https://doi.org/10.6084/m9. 020-14300-5.
figshare.7504448.v3 (2018).
66. Batjes, N. H. Harmonized soil property values for broad-scale modelling Correspondence and requests for materials should be addressed to L.D.
(WISE30sec) with estimates of global soil carbon stocks. Geoderma 269, 61–68
(2016). Peer review information Nature Communications thanks the anonymous reviewers for
67. Hengl, T. et al. SoilGrids250m: global gridded soil information based on their contribution to the peer review of this work. Peer reviewer reports are available.
machine learning. PLoS ONE 12, e0169748 (2017).
68. Lê, S., Josse, J. & Husson, F. FactoMineR: an R package for multivariate Reprints and permission information is available at http://www.nature.com/reprints
analysis. J. Stat. Softw. 35, 253–258 (2008).
69. Zuur, A. F., Ieno, E. N., Walker, N., Saveliev, A. A. & Smith, G. M. Mixed Publisher’s note Springer Nature remains neutral with regard to jurisdictional claims in
Effects Models and Extensions in Ecology with R (Springer New York, 2009). published maps and institutional affiliations.
70. Zuur, A. F., Ieno, E. N. & Elphick, C. S. A protocol for data exploration to
avoid common statistical problems. Methods Ecol. Evol. 1, 3–14 (2010).
71. Bates, D., Mächler, M., Bolker, B. & Walker, S. Fitting linear mixed-effects Open Access This article is licensed under a Creative Commons
models using lme4. J. Stat. Softw. 67, 51 (2015). Attribution 4.0 International License, which permits use, sharing,
72. Fox, J. & Weisberg, S. An R Companion to Applied Regression (Sage, 2011). adaptation, distribution and reproduction in any medium or format, as long as you give
73. Lenth, R. V. Least-squares means: the R package lsmeans. J. Stat. Softw. 69, appropriate credit to the original author(s) and the source, provide a link to the Creative
1–33 (2016). Commons license, and indicate if changes were made. The images or other third party
74. Fox, J. Effect displays in R for generalised linear models. J. Stat. Softw. 8, 347 material in this article are included in the article’s Creative Commons license, unless
(2003). indicated otherwise in a credit line to the material. If material is not included in the
article’s Creative Commons license and your intended use is not permitted by statutory
regulation or exceeds the permitted use, you will need to obtain permission directly from
Acknowledgements the copyright holder. To view a copy of this license, visit http://creativecommons.org/
This article is based upon work from the COST Action FP1106 STReESS, financially licenses/by/4.0/.
supported by European Cooperation in Science and Technology (COST). L.DS. was
funded by the Fundação para a Ciência e a Tecnologia (SFRH/BPD/70632/2010) and by
the European Union (EU) under a Marie Skłodowska-Curie IF (No.797188); K.K. was © The Author(s) 2020
8 NATURE COMMUNICATIONS | (2020)11:545 | https://doi.org/10.1038/s41467-020-14300-5 | www.nature.com/naturecommunicationsNATURE COMMUNICATIONS | https://doi.org/10.1038/s41467-020-14300-5 ARTICLE Lucía DeSoto 1,2*, Maxime Cailleret3,4,5, Frank Sterck6, Steven Jansen 7, Koen Kramer 6,8, Elisabeth M.R. Robert 9,10,11, Tuomas Aakala 12, Mariano M. Amoroso13, Christof Bigler 4, J. Julio Camarero 14, Katarina Čufar 15, Guillermo Gea-Izquierdo 16, Sten Gillner17, Laurel J. Haavik18, Ana-Maria Hereş 19,20, Jeffrey M. Kane 21, Vyacheslav I. Kharuk 22,23, Thomas Kitzberger 24,25, Tamir Klein 26, Tom Levanič 27, Juan C. Linares 28, Harri Mäkinen 29, Walter Oberhuber 30, Andreas Papadopoulos31, Brigitte Rohner 5,4, Gabriel Sangüesa-Barreda 32, Dejan B. Stojanovic 33, Maria Laura Suárez 34, Ricardo Villalba 35 & Jordi Martínez-Vilalta9,36 1 Estación Experimental de Zonas Áridas, Spanish National Research Council (EEZA-CSIC), Almería, Spain. 2Centre for Functional Ecology, University of Coimbra, Coimbra, Portugal. 3INRAE, Université Aix-Marseille, UMR Recover, Aix-en-Provence, France. 4Forest Ecology, Department of Environmental Systems Science, ETH Zürich, Zürich, Switzerland. 5Swiss Federal Institute for Forest, Snow and Landscape Research (WSL), Birmensdorf, Switzerland. 6Forest Ecology and Forest Management Group, Wageningen University, Wageningen, The Netherlands. 7Institute of Systematic Botany and Ecology, Ulm University, Ulm, Germany. 8Land Life Company, Amsterdam, Netherlands. 9CREAF, Bellaterrra (Cerdanyola del Vallès), Catalonia, Spain. 10Ecology and Biodiversity, Vrije Universiteit Brussel, Brussels, Belgium. 11Laboratory of Wood Biology and Xylarium, Royal Museum for Central Africa (RMCA), Tervuren, Belgium. 12Department of Forest Sciences, University of Helsinki, Helsinki, Finland. 13Instituto de Investigaciones en Recursos Naturales, Agroecología y Desarrollo Rural (IRNAD), Universidad Nacional de Río Negro, Consejo Nacional de Investigaciones Científicas y Técnicas (CONICET), Río Negro, Argentina. 14Instituto Pirenaico de Ecología, Spanish National Research Council (IPE- CSIC), Zaragoza, Spain. 15Department of Wood Science and Technology, Biotechnical Faculty, University of Ljubljana, Ljubljana, Slovenia. 16Centro de Investigación Forestal (CIFOR), Instituto Nacional de Investigación y Tecnología Agraria y Alimentaria (INIA), Madrid, Spain. 17Institute of Forest Botany and Forest Zoology, TU Dresden, Dresden, Germany. 18USDA Forest Service, Missoula, MT, USA. 19Department of Forest Sciences, Transilvania University of Brasov, Brasov, Romania. 20BC3 - Basque Centre for Climate Change, Leioa, Spain. 21Department of Forestry and Wildland Resources, Humboldt State University, Arcata, CA, USA. 22Sukachev Institute of Forest, Siberian Division of the Russian Academy of Sciences (RAS), Krasnoyarsk, Russia. 23Siberian Federal University, Krasnoyarsk, Russia. 24Instituto de Investigaciones en Biodiversidad y Medio Ambiente (INIBOMA), Consejo Nacional de Investigaciones Científicas y Técnicas (CONICET), Bariloche, Argentina. 25Department of Ecology, Universidad Nacional del Comahue, Río Negro, Argentina. 26Department of Plant & Environmental Sciences, Weizmann Institute of Science, Rehovot, Israel. 27 Department of Yield and Silviculture, Slovenian Forestry Institute, Ljubljana, Slovenia. 28Department of Physical, Chemical and Natural Systems, Pablo de Olavide University, Seville, Spain. 29Natural Resources Institute Finland (Luke), Espoo, Finland. 30Department of Botany, University of Innsbruck, Innsbruck, Austria. 31Agricultural University of Athens, Karpenissi, Greece. 32EiFAB-iuFOR, University of Valladolid, Soria, Spain. 33 Institute of Lowland Forestry and Environment, University of Novi Sad, Novi Sad, Serbia. 34Grupo Ecología Forestal, CONICET - INTA, EEA Bariloche, Bariloche, Argentina. 35Instituto Argentino de Nivología Glaciología y Ciencias Ambientales (IANIGLA-CONICET), Mendoza, Argentina. 36 Universitat Autònoma de Barcelona, Bellaterrra (Cerdanyola del Vallès), Catalonia, Spain. *email: luciadesoto@gmail.com NATURE COMMUNICATIONS | (2020)11:545 | https://doi.org/10.1038/s41467-020-14300-5 | www.nature.com/naturecommunications 9
You can also read


