June 2021 Investor Update - Duke Realty

Page created by Jorge West
 
CONTINUE READING
June 2021 Investor Update - Duke Realty
June 2021 Investor Update
June 2021 Investor Update - Duke Realty
Forward-Looking Statement

This slide presentation contains statements that constitute “forward-looking statements” within the meaning of the Securities Act of 1933 and
the Securities Exchange Act of 1934 as amended by the Private Securities Litigation Reform Act of 1995. These forward-looking statements
include, among others, our statements regarding (1) strategic initiatives with respect to our assets, operations and capital and (2) the
assumptions underlying our expectations. Prospective investors are cautioned that any such forward-looking statements are not guarantees
of future performance and involve risks and uncertainties, and that actual results may differ materially from those contemplated by such
forward-looking statements. A number of important factors could cause actual results to differ materially from those contemplated by forward-
looking statements in this slide presentation. Many of these factors are beyond our ability to control or predict. Factors that could cause
actual results to differ materially from those contemplated in this slide presentation include the factors set forth in our filings with the
Securities and Exchange Commission, including our annual report on Form10-K, quarterly reports on Form 10-Q and current reports on Form
8-K. We believe these forward-looking statements are reasonable, however, undue reliance should not be placed on any forward-looking
statements, which are based on current expectations. We do not assume any obligation to update any forward-looking statements as a
result of new information or future developments or otherwise.

Certain of the financial measures appearing in this slide presentation are or may be considered to be non-GAAP financial measures.
Management believes that these non-GAAP financial measures provide additional appropriate measures of our operating results. While we
believe these non-GAAP financial measures are useful in evaluating our company, the information should be considered supplemental in
nature and not a substitute for the information prepared in accordance with GAAP. We have provided for your reference supplemental
financial disclosure for these measures, including the most directly comparable GAAP measure and an associated reconciliation in the
appendix to this presentation as well as in our most recent quarter supplemental report and earnings release, the latter two of which are
available on our website at www.dukerealty.com. Our most recent quarter supplemental report also includes the information necessary to
recalculate certain operational ratios and ratios of financial position. The calculation of these non-GAAP measures may differ from the
methodology used by other REITs, and therefore, may not be comparable.

LEED® – an acronym for “Leadership in Energy and Environmental Design “ – is a registered trademark of the U.S. Green Building Council”.

                                                                                                                                            2
June 2021 Investor Update - Duke Realty
Contents

 Who We Are | U.S. Logistics Real Estate Strategy   4

 Q1 2021 Review & 2021 Guidance Highlights |
                                                    6
 Relative Operating Perf | Rel Equity Value

 Business Drivers & Market Fundamentals             11

 Operations - Customers and NOI Drivers             14

 Logistics Real Estate Strategy |
                                                    18
 Capital Allocation

 Development Strategy                               25

 Liquidity and Capital Strategy                     28

 Corporate Responsibility                           32

 Why Duke Realty & Guidance                         38

 Appendix: In-fill Development Case Studies         41
                                                         TABLE OF CONTENTS   3
June 2021 Investor Update - Duke Realty
Who We Are – The Leading Domestic-only Logistics REIT

• Largest domestic-only logistics REIT
  in the business of developing,
  redeveloping, acquiring and
  managing premier logistics real estate
  facilities in key logistic nodes across
  19 markets in the U.S.
• Founded 1972, IPO 1993, S&P 500
• Own or hold an interest in 543                                        Seattle

  facilities encompassing 162 million SF
  o Newest portfolio amongst peers with unique facility                                          Minneapolis-St. Paul                                 Eastern
                                                                                                                                                    Pennsylvania
                                                                                                                                                                             New Jersey

    and site features demanded by today’s modern
    supply chain. 67% of total portfolio developed,        Northern
                                                                                                                   Chicago                    Columbus

                                                           California                                                                                                 Washington DC/
    generating substantial premium returns over core                                                                    Indianapolis
                                                                                                                                                                      Baltimore

    acquisitions.                                                                                                                          Cincinnati
                                                                                                                                                                     Raleigh

  o 99% of earnings is derived only from rental income    Southern
                                                                                                                              Nashville

                                                                                                                                                        Atlanta
                                                          California

• Enterprise value of ~$21 billion,
                                                                                                                                                                  Savannah
                                                                                                      Dallas

  Baa1/BBB+ credit ratings                                                                             Houston
                                                                                                                                          Central Florida

                                                                                                                                           South Florida

• ESG aligned strategy and culture
• Platform, strategy and market                                                   illustrative relative size of MSA based on GAV. See page 19 for additional detail.
  conditions set up for a potential
  double-digit growth run rate
                                                                                                                                   WHO WE ARE                                        4
June 2021 Investor Update - Duke Realty
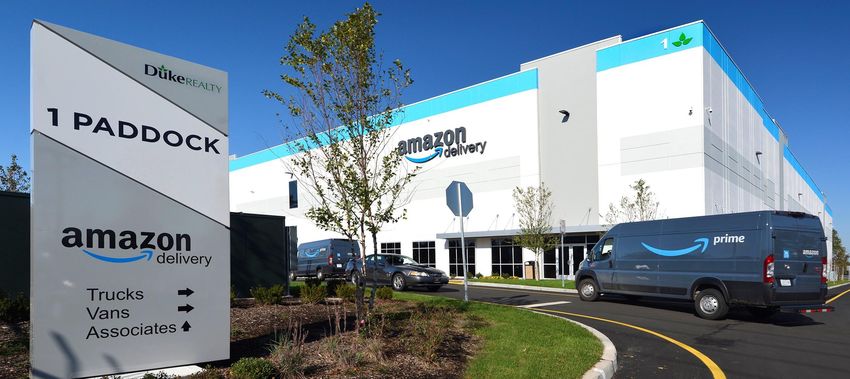
Duke Realty is the Only REIT that “Checks All the Boxes”
to be the Leading Pure-Play Domestic-Only Logistics REIT

        S&P 500
        (Large Cap Firm)                                                            
        U.S. Industrial Only | Business Model focused on Rental Income              
        Modern, High-Quality Logistics Facilities                                   
        Majority Tier 1 Market Concentration                                        
        Strong Development Capability                                               
        Top Tier Sector FFO and AFFO Growth Outlook                                 
        High BBB+ Rated Balance Sheet with Ample Liquidity                          
        ESG Embedded in Corporate Culture                                           

                                                                         STRATEGIC OVERVIEW   5
June 2021 Investor Update - Duke Realty
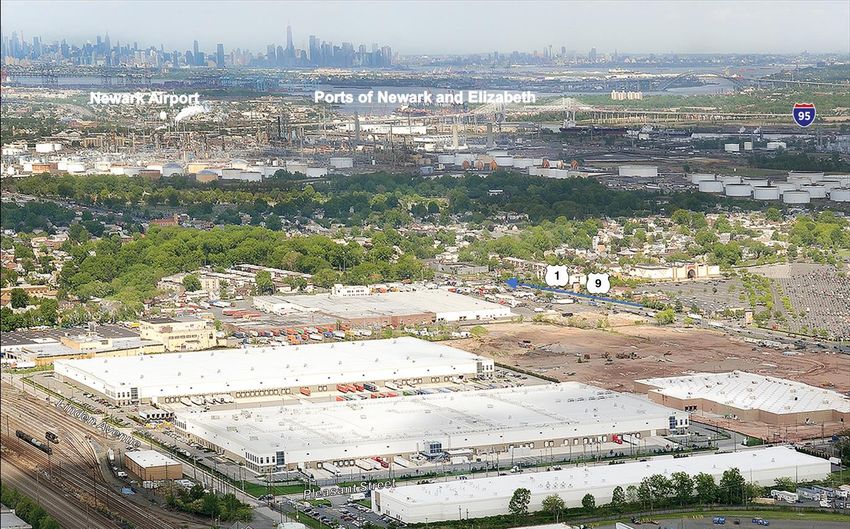
Q1 2021 RECAP & 2021 GUIDANCE HIGHLIGHTS |
       RELATIVE OPERATING PERFORMANCE |
                           RELATIVE VALUE
June 2021 Investor Update - Duke Realty
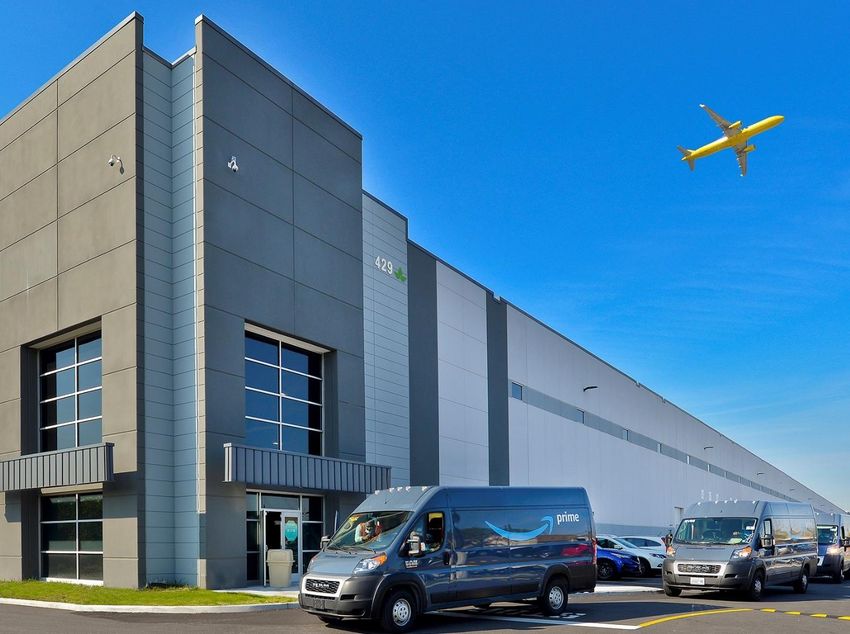
Q1 2021 Review | FY 2021 Guidance Highlights

          EARNINGS / DIVIDENDS: Q1 core FFO/sh growth 18% (15% adjusted for Q1 2020 S/L rent
          reserve); Full year 2021 guidance FFO/sh mid-point                                                   10.5%; AFFO growth mid-point 10.2%;
          Dividend Payout ratio (on AFFO) target of high 60s-to-low 70s percentage range; Dividend
          growth averaged 8.6% annually the last 2 years

         OPERATIONAL PERFORMANCE: Ending Q1 In-Service Occupancy 97.6%;
         Total Occupancy (including development pipeline) 95.5%; Q1 Same Property (“SP”) Cash NOI
         growth 6.3%, FY 2021 SP Cash NOI guidance mid-point 4.5%; Q1 Rent Growth on 2nd
         generation leasing 26% GAAP and 11% Cash; Collected 99.9% of rent

        INVESTMENT: Q1 Development Starts $412M; FY 2021 Development Starts guidance
        mid-point $1.05B (prior 3-year average $915M); Q1 Development Pipeline of $1.4B is 65%
        leased with value creation margins > 40%; Land inventory is 88% Coastal Tier 1* markets
                                                                                                                                                                         (Houston &
        Q1 Acquisitions of $51M primarily in Coastal Tier 1* markets; Dispositions of $94M                                                                                Indianapolis)

        Coastal Tier 1 GAV* is 42% of portfolio, up from 37% at YE 2019

        CAPITAL: Issued $450M 10-year green bond in Q1 at 1.83% yield;            No significant debt
        maturities until 2023; Renewed $1.2B line of credit in Q1 reducing spread by 10 bps and added a
        sustainability-pricing metric; Issued $30M of equity above NAV; "A" level credit profile
     * “Coastal Tier 1” markets include Northern New Jersey, South Florida, Southern California, Northern California and Seattle. GAV = Gross Asset Value, which is
     the approximate quarterly appraised value of the company’s real estate. For full year guidance details see final page of slide deck before the Appendix.
                                                                                                                                                                      2021 Q1 & FY OUTLOOK   7
June 2021 Investor Update - Duke Realty
Strong AFFO Performance and Improving FFO after
significant re-positioning and robust development accretion

                                                                                                                                                                                                                                     11.9%
                                                                                                                                                                                                                  10.5%
                                                                                                                                                      10.5% 2021 guidance compared to peers
                                                                                                                                                          10.2%                                                                                              8.0%
                                                                                                                        (1)                                                                                                                              7.6%

                                                               (1)
                                                                (4)
                                                                                                                        8.4%
                                                                                                 7.9%                                                                           7.8%                                        5.0%
                                                          7.4%
                                                                                              7.0%                                                                                                                                              3.3%

                                                                                                                                                                                Dividends (consensus3)
                                          6.4%
                                       5.4%

                                                                                                                        Dividend/sh
                                                               Dividend/sh

                                                                                                                                                                      AFFO/sh
                                                     AFFO/sh

                                                                                                              AFFO/sh

                                                                                                                                                            FFO/sh
                                                                                                    FFO/sh
                                         FFO/sh

                                        5Y CAGR                                                   3Y CAGR                                            1Y Implied                                                 1Y Implied to 2021
                                        thru 2020                                                 thru 2020                                      to 2021 Guidance                                                Guidance (peers)
                                                                                                                                                                                                                    * $3.58 for based 2020 FFO after deducting $0.22/sh net
                                                                                                                                                                                                                    promote income; $4.01 for 2021 FFO excluding $0.02/sh
                                                                                                                                                                                                                    promote expense , or 11.4% if include 2021 promote expense.
                                                          Robust development accretion and reduced repositioning dilution
                                                  2014 to 2018 comprised the highest levels of sales activity primarily with older, higher capex and higher-yield assets

Average Annual                                                                                                                                                       $1.0 Bn
                                                  $1.2 Bn                                                    $1.1 Bn
  Dispositions(2)                                                                                                                                                    (mid-point)
                                                                                                                                                                                                         (1) Major assets sales in 2015 and 2017 generated significant
                                                                                                                                                                                                         capital gains and thereby a return of capital to shareholders in
                                                                                                                                                                                                         the form of a special dividend; in the amounts of $0.20 and
                                                                                                                                                                                                         $0.85 per share respectively (paid in December of each year).

Disposition Yield                                    5.7%                                                     4.9%                                         4.7% - 4.9%                                   These dividends were interpreted to an annualized return as
                                                                                                                                                                                                         the distribution amount divided by the street NAV/sh at the
                                                                                                                                                                                                         time of distribution - and then amortized over the relative 3 or
                                                      (wtd avg)                                               (wtd avg)                                               (wtd avg)                          5-year hold periods. (2) Includes the previous year to the
                                                                                                                                                                                                         start of the time period average, given the lag effect on
                                                                                                                                                                                                         dispositions to earnings (e.g., “5Y Avg” includes 6 years of
                                                                                                                                                                                                         dispositions. (3) Consensus dividend of $1.035/sh per
                                                                                                                                                                                                         Refinitiv as of 5/6/2021.
                                                                                                                                                                                                         Peer guidance estimates per company supplementals, press
AFFO Payout Ratio                                       69%                                                     69%                                                  ~ 70%
                                                                                                                                                                                                         releases and earnings call commentary.

   (for regular quarterly dividends)

                                                                                                                                                                                                            FFO, AFFO & DIVIDENDS                                        8
June 2021 Investor Update - Duke Realty
Core Growth Metrics and Development Platform Size/
 Pre-Leasing Support Outperformance Through Cycles

                                                                                                                                                                                                                Development
Durable and High Performing Core Portfolio Metrics
                                                                                                                                                                                                             Growth Contribution
          for 2021E, 2020 and 3 Years                                                                                                                                                                         and Risk Profile
                                                                                                                                                                                                                Best in Class
2021 SPNOI Guidance                                                2020 SPNOI Growth                                                  3-Year SPNOI Growth
                                                                                                                                                       (avg 2018 – 2020)
                                                                                                                                                                                                               3-Year Avg Development
                                     7.3%                                                                                                                                                                       Pipeline as % of Assets
                                                                                                                                                                                   6.6%
                                                                 5.0%                                                                                                                                               (Pre-leasing %)
 4.5% 4.8%                                                                             4.4%                 4.5%
               4.0% 4.4%                                                                                                               4.6% 4.8% 4.3% 4.3%
                                                                            3.2%                 3.2%
                                                                                                                                                                                                                        0%        10%         20%         30%         40%          50%         60%         70%          80%         90%         100%

                                                                                                                                                                                                                 DRE                                                                10%                                        (57%)

                                                                                                                                                                                                                  PLD                                     4%                                                           (46%)
                                                                                                                                                                                                                  FR                                      5%                                           (38%)
 DRE PLD         FR       EGP REXR                               DRE PLD                FR       EGP REXR                               DRE PLD                FR       EGP REXR                                 EGP                                 4%                           (18%)
                                                                                                                                                                                                                REXR              0%                      (0%)
                                                                                                                                                                                                                        0%        2%          4%          6%          8%           10%         12%         14%          16%         18%         20%

              2020 Rent Growth                                                                                3-Year Rent Growth                                                                                 1Q21 Development
                                                                                                                            (avg 2018 – 2020)
                                                                                                                                                                                                               Pipeline as % of Assets
                                                               31%                                                                                                                                                  (Pre-leasing %)
          29%                       30%                                                                                                                       32%
                        25%                                                                                 28%           26%
                                                  22%                                                                                26%                                                                                     0%         10%         20%         30%         40%          50%         60%         70%          80%         90%      100%

                                                                                                                                                 18%                                                             DRE                                                                                       13% (65%)
                                                                                                                                                                                                                  PLD                                           6%                                                     (42%)

         DRE           PLD           FR          EGP REXR                                                                                                                                                          FR                                       5% (10%)
                                                                                                            DRE          PLD          FR         EGP REXR
                                                                                                                                                                                                                 EGP                           2% (0%)
                                                                                                                                                                                                                REXR              0%                      (0%)
       Source: Company reporting and DRE. “SPNOI” is “same-property NOI”, a non GAAP metric. REXR 2020 SPNOI excludes deferred rent. “Rent Growth” is 2nd generation leasing activities and on a Net                         0%         2%          4%          6%          8%           10%         12%         14%          16%         18%         20%

       Effective (GAAP) basis. PLD’s Rent Growth figure is “at share” (note prior to 3/9/21, DRE had included PLD at 100%). Development statistics for ground-up development or demolition/re-development.

                                                                                                                                                                                                                                  WHY DUKE REALTY                                                                                                           9
June 2021 Investor Update - Duke Realty
Above Average Portfolio Performance and Development
 Growth Prospects – yet Discounted Relative Value

                                           AFFO Multiple                                                                               NAV Premium / (Disc)
                                                                                              49x                                                                           28%
                                                                                                                                             26%
                                                                                  43x
                                                                                                                                                                     20%
                                              35x                     37x                                                                                   17%
                                                          34x
                                  32x                                                                                                 11%            10%

                                 DRE          PLD          FR        EGP        REXR TRNO                                             DRE     PLD     FR        EGP REXR TRNO

                                             FFO Multiple                                                                              Net Debt to EBITDA(1)(2)

                                                                                              40x
                                                                                  38x                                                  5.2x
                                                                                                                                               4.9x    5.0x       4.9x
                                                                                                                                                                         4.3x
                                              30x
                                  28x                     27x         28x                                                                                                        3.3x

                                 DRE          PLD          FR        EGP        REXR TRNO                                              DRE      PLD        FR     EGP    REXR TRNO
                                                                                                                            S&P         BBB+    A-     BBB         NR    BBB      NR
                                                                                                                            Moody’s     Baa1    A3     Baa2       Baa2   Baa3     NR
                                                                                                                            Fitch       NR      A-     BBB         NR    BBB      BBB

Source: consensus FFO and AFFO estimates for 2021 per S&P GMI “CIQ”, as of 6/3/2021. Consensus AFFO on median
basis to reduce excessive dispersion of individual analyst estimates within AFFO. NAV per Green St inclusive of April
13th revised cap rates, pricing as of 5/14/2021. For credit ratio (Debt-to-Ebitda), (1) all peers are per 3/31/2021 Wells
Fargo Credit research, except PLD Net Debt to EBITDA which is per 3/31/2021 company supplemental, excluding
development gains, and DRE which is per our 3/31/2021 Q1 supplemental report, (2) Quarter annualized.                                                                      WHY DUKE REALTY   10
MACROECONOMIC & SECULAR DRIVERS
INDUSTRIAL SUPPLY-DEMAND FUNDAMENTALS
Pandemic Further Elevated Logistics Real Estate Demand
Themes and Heightened Necessity for Supply Chain Resiliency

  CONSUMER                                               EXPANDING
                                                         CATEGORIES                                                                                                                                     INVENTORY                                             REVERSE
FREQUENCY AND                                                                                                                                                                                           EXPANSION
                                                                                                                             RE-SHORING                                                                                                                      LOGISTICS
 PENETRATION                                        Expanded purchase categories with grocery,
                                                      department store and furniture channels
                                                                                                                    Re-shoring of manufacturing to North America                         Supply chain bottlenecks from pandemic and spike in               Online returns rate 15 to 30% of
  EXPANDING                                          experiencing spike in adoption; e-Grocery
                                                    expected to grow from about 10% of grocery
                                                                                                                   should create need for more resources on-hand
                                                                                                                   domestically, likely benefitting supply chains and
                                                                                                                                                                                         e-commerce penetration from stay-at-home will likely
                                                                                                                                                                                            increase the inventory-to-sales ratio over time –
                                                                                                                                                                                                                                                             purchases (2-3x of in-store).
                                                                                                                                                                                                                                                             Post-pandemic trends should
 Online user penetration rate and                    sales today to 25% by 2025, including an                                                                                                                                                               expand this already significant
                                                                                                                    consumer spending in Southeast, Midwest and                            expanding the space needs for both B2B and B2C
    frequency of online orders                       expanded need for freezer-cooler oriented                                                                                                                                                              driver of modern facility space.
                                                                                                                    Texas. As of 4q20, re-shoring announcements                            users. Supply chain experts predict up to 5% new
      increasing; including an                       facilities. Apparel and footwear is largest                                                                                                                                                            CBRE estimates part of 5 year
                                                                                                                     were up 5x vs pre-pandemic levels (source:                           facility square footage needed, with CBRE deriving
  expanded age cohort of users.                      category with penetration expected to rise                                                                                                                                                             demand forecast includes 400
                                                                                                                     UBS); yet Cushman estimates re-shoring will                          400 to 500 msf of aggregate demand this decade.
                                                                  from 20% to 40%.
                                                                                                                     only “modestly” contribute to demand (
Supply-Demand-Vacancy set up Supportive of Continued Low
 Vacancy and Positive Rent Growth | Booming Demand Forecast

     (MSF)                                                                                                          2021 SUPPLY
                                                                                                                    Estimated to be
  Annual                                                                                                           60% pre-leased by
                                                                                                                       year-end
Demand &                                                                   * RECORD DEMAND *
                                                                     - 4q20 104 msf of demand (#1 all-time)
                                                                                                                                       Vacancy
                             9.7%                                    - 2021 projection 310 msf (#2 all-time)                                                           ~300 msf of annual demand
                           peak GFC
      360                                                                                                                                   10%                          estimated through 2023
      300
                                                                                                                                                                   CBRE predicts 300 msf of annual demand 2022-2023
                                                                                                                                            8%                     and projects positive quarterly absorption (i.e., gray bar
      240
                               Average Vac - 6.5%                                                                                                                  exceeding white bar in chart) through 2030.
      180                                                                                                                                   6%
                                                                                                                                   4.2%
      120
                                                                                                                                                                   YE 2021 VACANCY est’d ~ 4.2%

                                                                                                                                   Demand
              Demand

                                                                                                                                            4%
              Supply

                                                                                                                                   Supply
       60                                                                                                                   4.6%
        0
                                                                                                                                            2%
      -60
     -120                                                                                                                                   0%
              2007             2009           2011              2013              2015              2017              2019         2021

      (Y/Y)
Growth in
  Asking                                                                                                                                          MARKET LEVEL RENT GROWTH: RECENT
                                                                                                                            8.3%
   Rents                                                                                           6.8% 7.4%                       8.0%           HISTORY & OUTLOOK REMAIN STRONG
                                                                                          6.1%
                                                                                                                                                  2021 expected rent growth range from 4% to 10% in DRE markets.
                                                                         3.9%                                                                     Longer term 5 year forecast of 22.5% growth nationally (~ 4.5%
            3.0%                                      3.6% 2.9%                   2.7%                                3.1%
                                                                                                                                                  annually), with 5 year ranges for a majority of DRE markets between
                                                                                                                                                  4.0% to 6.0% annually.
                                             0.2%

                                                                                                                                                       DRE PORTFOLIO WELL
                       -2.4%
                                   -4.5%
                                                                                                                                                       POSITIONED to CAPTURE GROWTH
                                                                                                                                                         …DRE average in-place rents 17%-18% below current
                           -7.6%
                                                                                                                                                         market, coupled with growing underlying market rents =
            2007           2009              2011              2013              2015              2017              2019          2021                  very strong pricing power position.
                                                                                                                                                         (see detailed NOI upside components pages 16)

                           Source: Historical, 2021 projections and longer term projections per CBRE industrial research.

                                                                                                                                                                                   MARKET FUNDAMENTALS                    13
OPERATIONS: CUSTOMER RELATIONSHIPS &
                               NET OPERATING INCOME (NOI) DRIVERS
Legacy Commerce Center (Brownfield development), Linden, NJ
Diversified Customer Relationships by Company & Industry

   TOP 15 TENANTS                                                                                                            TENANT INDUSTRIES
                                                           Length of
                                                          Relationship
                           % of Total ANLV                    (yrs)

       Amazon.com                                9.1%          14                                       Transportation                                     21%

        Home Depot                       4.5%                  23                                         E-commerce(1)                                 18%

   UPS of America                    2.4%                      23                                    Manuf. Products                                   17%

         Wayfair Inc.               2.1%                        5                                 Wholesale Goods                           8%
     NFI Industries                1.2%                        15                                      Food Products                      6%
      Floor & Décor                1.2%                        16
                                                                                                Consumer Services                         6%
              Deckers             1.0%                          7
                                                                                                 Lumber & Building (2)                    6%
                 Target           0.9%                         23
                                                                                                                     Retail              5%
            Samsung               0.8%                         10
                                                                                                                  Textiles             3%
      Sonepar USA                 0.7%                          2
                                                                                                 Chemical Products                   2%
                 Clorox           0.7%                         17
                                                                                                              Publishing             2%
               Armada             0.7%                         21

                                                                3                                           Technology               2%
    Kimberly-Clark                0.6%
                                                                7                                     Health Services                2%
     XPO Logistics                0.6%

                    Kraft         0.6%                         11                                                    Other(3)        2%

   Note: Includes in-service portfolio only as of March 31, 2021; ANLV = Annualized Net Lease Value. (1) E-commerce tenants include tenants that complete the majority of their sales using the internet or they are using
   the majority of their leased space for fulfilling online sales. (2) Top Retail tenants by ANLV include: Target, The Container Store, Electrolux, Starbucks, Walmart, Cotton On, Ashley Furniture, Genuine Parts Company,
   and Best Buy; in aggregate which represents 67% of total retail exposure. (3) Other includes gov’t agencies, construction, financial services, utilities and agriculture.

                                                                                                                                                                                                    CUSTOMERS                 15
Operating Metrics Supportive of Continued Growth

NOI DRIVERS                                          (1)
                                                                                                                                   2021 SAME-PROPERTY
                                                                                                                                  NOI GUIDANCE BUILDUP
                                               98.1%             stabilized occupancy                                                    Contributing factors include magnitude of 2 nd gen
OCCUPANCY                                      95.5%             total occupancy (incl under development)                                        leasing rental growth from 2020

RENT GROWTH                                   26% GAAP | 11% cash                                                                                     +1.4%                            Total
on 2nd GEN                                                                                                                                                                             4.5%
                                                                                                                                                                 -0.3%      -0.1%
                                              6.0 years average remaining                                                                  +3.5%
LEASE TERMS                                   2.5%-3.5% recently signed annual escalators

SAME                                          6.3%            Q1 2021 actual

PROPERTY(“SP”)                                4.5%            2021 mid-point guidance             2021 Same Property build-up (approx)

                                               10% of Q1 2021 NOI not in SP pool
NON - SAME
                                               79% occupancy in non SP pool(2)
PROPERTY                                       $1.4B development pipeline with
                                                                                                                                               Rent     Free
                                                                                                                                           Escalations Rent
                                                                                                                                                                 Occup
                                                                                                                                                                  ancy
                                                                                                                                                                           Bad Debt     2021
                                                                                                                                                                           / Defaults Mid-Point
                                                                future NOI (~$78.1M)                                                        + 2nd Gen  Burn
                                                                                                                                         Leasing Growth Off
                                                                … reflects substantial NOI upside

     (1) Figures as of 3/31/2021. Occupancy stats on lease-up basis.
    ( 2) Includes development pipeline.

                                                                                                                                                                         NOI PERFORMANCE          16
Proven Net Operating Income Growth

   10.2%                2018-2020 NOI CAGR
   ~10%                2021 Expected NOI Growth

                                                                                                     Additional $7M                              Additional $67M
                                                                                                      of future NOI                               of future NOI
                                                                                                      beyond 2021                                 beyond 2021

                                                                                                                                                                     ~$70M Incremental
                                                                                                                                                                        2021 Total
                                                                                                        ~$2M                                       ~$11M
                                                                                 ~$12M                                                                                 NOI ~$757M

                                                           ~$30M
                                                                                                                           ~ ($10M)

                                      ~$9M
                ~$16M

      2020        Lease           Rent Growth  FY ‘20 & 1Q ‘21   Free Rent       Lease up       Net         3/31/2021
                                  Escalators
                                       ndRent Growth   on2020
                                                Development 2nd Gen
                                                                Dev   Deliveries
                                                                            FRT   Burnoff
                                                                                      Lease-up
                                                                               Unstabilized
                                                                                               Unstabilized
                                                                                                       Net Dispositions
                                                                                            Dispositions
                                                                                                                Development Pipl Curr Yr
                Escalators          on 2 Gen                                      Burn Off                                                        Development
    NOI $687M                                            Stabilizations                                  In-service            (’20 & ‘21)          Pipeline

                        Growth from Stabilized Portfolio ( ~$67M)                                           Additional Growth Factor Estimates

                   Note: 2021 estimated NOI components and total 2021 NOI estimate contribute to the mid-point expectations of 2021 FFO/sh and AFFO growth guidance expectations,
                   and are subject to a range of possible outcomes depending on the volume and timing of leasing, anticipated development deliveries and asset recycling, etc.

                                                                                                                                                                                    NOI PERFORMANCE   17
1 Paddock Street (Amazon Last Mile), New Jersey
Exit 10 Submarket
(185,000 square feet)

                                                  LOGISTICS ASSET STRATEGY /
                                                          CAPITAL ALLOCATION
National Platform with Expanding Diversification
into Tier 1 Markets – Targeting >70% Exposure YE 2021

                                                                                                         T1
 Market Exposure                                                                                                Seattle

  Trend & Goal                                                                                                                                                                  Minneapolis-St. Paul
                                                                                                                                                                                                                                                       Eastern                    New Jersey
                     YE                                                                                                                                                                                                                              Pennsylvania
                Q1 2021                                                                                                                                                                                                                                                T1
     2010 2017 2021 Goal                                                                                                                                                                                    Chicago               T1                                           T1
                                                                                                                                                                                                                                                                              T1
                                                                                                                                                                                                                                                   Columbus
                                                                                              Northern
                                                                                              California                                                                                                                                                                     Washington DC/
Other
                                                                   >70%                         T1
                                                                                                                                                                                                                                                                             Baltimore

                                                  69%
Major                                                                                                                                                                                                                             Indianapolis
Markets                                                                                                                                                                                                                                           Cincinnati
                                57%                                                                                                                                                                                                              Nashville
                                                                                                                                                                                                                                                                            Raleigh
                                                    2021E Tier 1

                    37%
                      2017 Tier 1

                                    2020 Tier 1

                                                                                                                                                                                                                                                             Atlanta
                                                                                                            T1
          2010 T1

                                                                                       Southern                                                                                                                                                       T1
                                                                                       California
                                                                                                                                                                                                                                                                       Savannah
                                                                                                                                                                                Dallas             T1
                                                                                                                                                                                                                                                 Central Florida
                       “Coastal” Tier 1 Note:
                         42% GAV at 1Q21,
                        up from 25% in 2017                                                                                                                                          Houston
                                                                                                                                                                                                                                                  South Florida          T1

                                                                          Concentration by GAV →                                     $350MM – $499MM                                       $500MM – $749MM                                       750MM – $1.5B                        > $1.5B

                                                                           “T1” = Tier 1 Distribution Market, defined as major markets by population size and/or gateway port for domestic or global trade.
                                                                            GAV = Gross Asset Value as estimated by Duke Realty using actual or estimated NOI’s and current cap rates per CRE and CBRE.
                                                                            Note: Map excludes current 5.2 msf in St Louis (2% of Q1 GAV) that is currently being marketing for sale and expected to close early in the third quarter of 2021.

                                                                                                                                                                                                                                                         ASSET STRATEGY                  19
Diversity of Facility Types & Sizes | Durable Long Term
Lease Renewal and Efficient Capex Performance
                                                                                                                                                                                                           LEASE                                    RE-
                                                                                                                                                                                                         ECONOMICS                                LEASING
                                                                                                                     (as of 3/31/2021)                                                                                 (since 2017)                      (since 2017)

                                                                                                                                                                                                        Recent NER
                                                                                                  # of Assets

                                                                                                                                                                                                                                   Improvements
                                                                                                                                                                              Avg Lease
                                                                                                                                                                              Size [Term]

                                                                                                                                                                                                                                                                Backfill Mos.
                                                                                                                                                                                                                                                                                (for non-renewals)
                                                                                                                                   % of NOI

                                                                                                                                                                                                                                                   Renewal %
                                                                                                                                                                                                          Growth*
                                                                                                                                                    % Leased

                                                                                                                                                                                                                     TI’s / LC’s
                                                                                                                                                                                                                     % of NER
                                                                                                                                                                                                                                     Building
                                                                                                                  Total SF
>= 500K SF                                                                                       83             63 M            37%              99%                         596K                       30%           11%          $0.03          89%                 3
                                                                                                                                                                             [7.7 yrs]

250-500K                                                                                       136              49 M            29%              96%                         230K                       30%           10%          $0.07          72%                 7
                                                                                                                                                                             [5.3 yrs]

100-250K                                                                                       207              33 M            27%              97%                          64K                       29%           11%          $0.13          73%                 4
                                                                                                                                                                             [4.9 yrs]
Most Modern Facility Features for Today’s Logistics Customers
| High Tier 1 Exposure with U.S.-only Diversification

                         203K
 Building Size (in SF)

                          SF
                                                                                                                      Geography By Market Type
                                124K
                                       92K
                                             74K
                                                   40K 40K
                                                                                                                         DRE: 40% Coastal T1; 67% Total T1
                                                                          Legend

                                                                              COASTAL T1 NON-COASTAL T1 OTHER INT’L
                                                                                                                                                                                                        12%
                                                                                                                              20%
                                                                                                                        33%                     37%
                                                         38
 Avg Age (in years)

                                                   34
                                                                                                                              19%
                                       19    20                                                                                                                   72%
                          12     18
                          yrs                                                                                           27%   19%
                                                                                                                                               31%

                                                                                                                              42%                                 11%
                                                                                                                        40%                                                        100%                88%
                                                                                                                                               32%
  Clear Height (in ft)

                         32 ft                                                                                                                                   17%
                                 29     29
                                              25                                                                        DRE
                                                                                                                        DRE   PLD              FR               EGP REXR TRNO
                                                    24
                                                         23
                                                              NOTES/SOURCES:
                                                               Building Features per CoStar and Duke Realty, building size is the median size, April 2021; Geographic “Market Type” Stratification per latest public quarterly
                                                               NOI by MSA breakdown per company supplementals; Tier 1 (“T1”) Markets defined as [Coastal T1 = SoCal, NorCal, N.NewJersey, SoFlorida & Seattle] + [Non-
                                                               Coastal T1 = Dallas, Atlanta & Chicago]. Other (major) Markets include DC/Baltimore, Indy, Cincy, Columbus, Houston, Orlando/Tampa, Nashville, Raleigh,
                                                               Phoenix, etc. DRE Tier 1 stats are proforma 2021 dispositions guidance of $900M to $1.1B, and proforma development pipeline at stabilized NOI.

                                                                                                                                                   MODERN FACILTIES & TIER 1 CONCENTRATION                                   21
Targeted Submarket Focus Across 19 Markets
 | Minimal Risk to Supply
                          Focused within                                                                                                                                             NOI exposure from higher
    80                    submarkets out of
                          212 total nationally
                                                                                                                                               < 3%                                  supply submarkets ,
                                                                                                                                                                                     comprising only 14 buildings
                                                                                                                                                                                                                                         1

                             submarkets comprise
     50                      90% of NOI                                                                                                        ~ 5%                                  lease rollover through 2023 in
                                                                                                                                                                                     higher supply submarkets                                               1

                                                             % of                                                                                                                                                                     RENT
                                                                                          # of                                        DRE                                          FOCUS
       TOP 6                                                TOTAL                                                                                                                                                                  GROWTH2
                                                                                         CBRE                                       FOCUSED                                      SUBMARKET
       MARKETS                                               DRE                                                                                                                                                                    IN FOCUS
                                                                                      SUBMARKETS                                  SUBMARKETS3                                      NOI %2
                                                             NOI2                                                                                                                                                                 SUBMARKETS
       Southern California                                   13.8%                                     9                                            4                                        88%                                                55%
       Chicago                                                 9.5%                                  17                                             4                                        84%                                                20%
       New Jersey                                              8.8%                                  24                                             4                                        83%                                                62%
       South Florida                                           9.1%                                  23                                             4                                        85%                                                28%
       Atlanta                                                 6.9%                                    9                                            3                                        84%                                                22%
       Dallas                                                  6.9%                                    9                                            3                                        87%                                                34%

          Subtotal                                          55.0%                                    91                                           22                                       85%                                                 34%

    (1) Higher supply submarkets defined per a mix of current and trending metrics such as under construction % of supply, deliveries % of supply, vacancy rate, demand, labor and barriers to entry; Current submarkets in this classification where DRE has exposure
    include SE Houston and N. Houston. Lease rollover statistic on total company NOI. (2) NOI reflects stabilized NOI including projects under development. Rent growth is a 3-year average of DRE 2nd generation leasing activity on a Net Effective (GAAP) basis. (3)
    “Focused Submarkets” are defined as comprising 80% or more of DRE total NOI within such market.

                                                                                                                                                                                                                             ASSET STRATEGY - SUBMARKETS                  22
Recent Capital Allocation Achieving Geographic
Objectives and Strong Long Term Risk-Adjusted Returns

   Established track record of disposition-acquisition recycling and significant development volume,
     together driving geographic strategy closer to YE 2021 goal of 70% Tier 1 markets
   Sector leading development pre-leasing levels. Pre-leasing and build-to-suit lease terms across
     market types represents a balanced risk-adjusted capital deployment strategy.
   Development value creation margins and expected long term returns accretive to near and long
     term earnings growth, with lower overall risk due to high pre-leasing levels. Development long
     term returns exceed acquisition IRR’s, with returns by market commensurate with leasing risk.

                                                                                  CAPITAL                                                                             CAPITAL DEPLOYMENT -
     (all totals or averages since Q1 2016)
                                                                                DEPLOYMENT-                                                                               DEVELOPMENT
     MARKETS                                                                             ACQ. & DISP.
                                                                                                                                                                                              BTS                    Combined               Est’d
                                                                             Net____                                Expected
                                                                                                                                                        Spec                   BTS           Lease                    Prelease              Value
                                                                             Activity(1)                              IRR’s(2)
                                                                                                                                                                                              term                          %              Creation
                                                                                      ($MM’s)                                                            ($MM’s)               ($MM’s)

      Coastal T1                                                                  $2,118                                          n/a                $1,499                   $648                   14                              29%   40-50%

      Non-Coastal T1                                                               $(128)                                         n/a                    $497                 $546                   13                              54%   25-35%

      Other Major Markets                                                      $(1,182)                                           n/a                    $476                 $984                   13                              68%   15-25%

         TOTALS                                                                     $807                    5.75 - 8.00%                          $2,472 $2,178                                      13                          52%       30-40%

       (1) Includes only industrial acquisitions and dispositions; (2) Unlevered IRR’s represent broad range of core through value-add transaction types across 8 markets since 2019, per DRE underwriting from buyer perspective.

                                                                                                                                                                                                                 ASSET STRATEGY – CAPITAL ALLOCATION   23
Recent Opportunistic Acquisitions – Coastal T1 Markets
 SoCal IE West Submarket – 8 bldgs, 82,000 SF                               NNJ Meadowlands Submarket – 102,000 SF
          5.0% Stabilized Yield | IRR estimate mid 8‘s %                         5.1% Stabilized Yield | IRR estimate low 8’s %

                                                                                         66-99 E Union Ave
                                                                                             102,000 SF

      1656 S Bon View Ave
           81,500 SF

           Covered land play; at lease expiration in 2025,                     M&A related divestiture sale-leaseback; low coverage
                intend to re-develop into 104K SF                               site with expansion and redevelopment potential

 NorCal Oakland/I-880 Submarket – 219,000 SF                                 Seattle Kent Valley Submarket – 63,000 SF
             5.3% Stabilized Yield | IRR estimate low 7’s %                       4.7% Stabilized Yield | IRR estimate mid 6’s %

                                                              San Leandro
                                                                  Bay

     1919 Williams St
       219,000 SF

                                                                                                             21214 66th Ave S
                                                                                                                64,000 SF

                                                                                   M&A related divestiture; creative master lease
    Sale-leaseback, with redevelopment option into 221K SF                          structure; main & main location, core asset
                                                                                                                                DEVELOPMENT   24
Turnpike Crossing Park, West Palm Beach, FL
(6 buildings totaling 802,000 square feet)

                                                        OPERATIONS:
                                              DEVELOPMENT PLATFORM
                                                A KEY GROWTH DRIVER
Development Strategic Advantages

 (figures below since 1/1/2016, unless otherwise stated)

   $848M                                         average annual development
                                                 starts (2016 – 2020)                                                                67%                              of total owned SF
                                                                                                                                                                      developed by Duke

                                                                                                                                        value creation
   6.0%                               yields(2)
                                                                            ~30-35%                                                     margins(1)

                                                                                                                            Value creation margins on infill(3)
    ~$1.5B                                              estimated value
                                                        creation
                                                                (1)                                                         projects at the higher end and typically
                                                                                                                            are up to or exceeding 50%

  52%                            average pre-leased
                                                                                                                          Speculative: 8-month average lease up
                                                                                                                          Build-to-suit: 13-year average initial lease term

                                                                                                                        repeat business, in-house
    88%                            of land bank in
                                   coastal markets(4)                                  68%                              construction & development
                                                                                                                        a strategic advantage

     (1) Value creation applies market cap rates per CBRE and internal records to initial projected stabilized NOI until projects are stabilized; (2) Based on initial stabilized cash yield (3)
     “infill” defined as submarket locations which have characteristics such as lack of developable land, close proximity to major population center, or close proximity to a major airport
     or seaport. (see representative in-fill development case studies starting on page 41); (4) Land bank % based on latest quarter inventory.

                                                                                                                                                                                                   DEVELOPMENT   26
Development Pipeline - Relatively Low Risk, Tier 1 Focus

                        PIPELINE $1.4B,                                                                            MARGIN                                              2021 STARTS GUIDANCE
                       65% PRE-LEASED                                                                               42%                                                     $950 - 1,150M
                  Currently an active build-to-suit prospect list better than pre-Covid levels. Coupled with national operating team and
                   leading track record on infill redevelopment, the platform is strategically well positioned to capture value creation.

Northern California                                  Seattle
•       141,000 SF build-to-suit redevelopment       •   190,000 SF spec development
•       100% pre-leased
                                                     •   0% pre-leased
                                                                                                               Chicago
                                                                                                               •       2 build-to-suits totaling 1.9M SF; 100% pre-leased
                                                                                                               •       300,000 SF spec development, 0% pre-leased

Northern California
•       347,000 SF spec development
                                                                                                                                                                                                                    Eastern Pennsylvania
                                                                                                                                                                                                                    •        415,000 SF build-to-suit
•       0% pre-leased
                                                                                                                                                                                                                    •        100% pre-leased

                                                                                                                                                                                                                New Jersey – Exit 10
                                                                                                                                                                                                                •       622,000 SF spec development
                                                                                                                                                                                                                •       0% pre-leased; currently 100% leased

                                                 Southern California – Orange Co
                                                 •   146,000 SF build-to-suit redevelopment; 100% pre-leased
    Southern California –                        •   3 buildings, 163,000 SF spec development; 0% pre-leased
    IE and South Bay
                                                                                                                                                                                                                         South Florida – Dade Co
    •    3.5M SF total spec developments                                                                                                                       Atlanta – Airport submarket                               •     2 spec developments totaling 723,000 SF
    •    0% pre-leased; Currently 43% leased                                                                       Dallas                                      •   318,000 SF build-to-suit; 100% pre-leased             •     22% pre-leased
                                                                                                                   •     432,000 SF build-to-suit              •   239,000 SF spec development; 0% pre-leased
                                                                                                                   •     100% pre-leased
                                                                                                                                                                                                                                DEVELOPMENT                        27
Lockport
Des Moines16328
             Creek/ 16410 / 16508
                     21202,        (3 buildings,
                             24th Avenue  South,803,000
                                                 Seattle,SF),
                                                         WA I-55 Submarket, Chicago, IL
(Two buildings totaling 512,000 square feet)

                                                          LIQUIDITY AND CAPITAL STRATEGY
Capital Strategy
                                                                                                                                                           Disciplined use of $1.2B credit facility
                                                                                                                                                           Maintain high unencumbered asset pool
                                                                                                                                                           Conservative 65-75% AFFO payout ratio
   Operate at a high Baa1 / BBB+ level                             (1)
                                                                                                                                                           Generate “funds available for
                                                                                                                                                            reinvestment”

                                                                                       Ratings                            Liquidity
   Follow disciplined
    development
    practices with
    approximately 50%                                                                                                                                                                       Maintain strong and
    pre-leasing levels                                                                                                                                                                       diverse lender
                                                                   Develop-                              Capital                           Access to                                         relationships
   Development pipeline                                            ment                                 Strategy                           Capital
    65% pre-leased                                                                                                                                                                          Communicate regularly
                                                                                                                                                                                             with investors
   Will selectively
    consider spec                                                                                                                                                                           Multiple types of capital
    projects in certain                                                                 Capital                            Liability                                                         available
    markets                                                                              Fore-                             Manage-
                                                                                        casting                             ment

 Fund growth with “funds available for
  reinvestment after dividends”, dispositions
  and opportunistic, modest equity issuance                                                                                                                  Maintain well-balanced debt maturities
                                                                                                                                                              and minimize use of variable-rate debt
 High quality tenant base resulting in “best in
  class” rent collection rate during COVID-19                                                                                                                No significant debt maturities until 2023

                (1) Moody’s / S&P, respectively. A securities rating is not a recommendation to buy, sell or hold securities and is subject to revision or withdrawal at any time by the
                rating organization.
                                                                                                                                                                                                        CAPITAL          29
Simplified and Disciplined Financial Profile
                    Capitalization                                                 Net Debt to               Fixed Charge
                   (in $ millions at 3/31/21, excludes
                         unconsolidated JV debt)
                                                                                  EBITDA - TTM              Coverage - TTM

       Unsecured                                                                                            5.8x        5.9x
                                                  Secured Debt                 5.2x         5.0x
          Debt                                        $60
         $3,509
                              18%

                                                         Common Equity        3/31/2021     2021          3/31/2021    2021
                              82%                        at Market Value                   Forecast                   Forecast
                                                             $15,850

                                                                           Ability to fund over $550M of growth without equity and
         Commitment to a strong credit profile                                       maintain current ratings (Baa1 / BBB+)

                Fixed-Rate Borrower                                                       Balanced Debt Maturities

                    100% Fixed
                       Rate

           Conservative fixed rate borrower.
   Revolving credit facility the main source of floating
                           rates.                                                Ample liquidity with disciplined use of
                                                                                          $1.2B credit facility

                                                                                                                       CAPITAL       30
Duke Realty is Baa1/BBB+(3) Rated but Credit Metrics
are at “A” Quality Levels

    REITs with “A” ratings:

        Debt + Preferred                                        Debt + Preferred                                               Net Debt to                                      Fixed Charge(1)(2)
         to Mkt Cap(1)                                              to GA(1)                                                   EBITDA(1)(2)                                        Coverage
           PSA                       14%                            PLD                      26%                           PSA                        1.2                          PLD                        9.7

           PLD                       17%                           EQR                       29%                           CPT                        4.7                          PSA                        9.4

                                                                    AVB                      30%                           PLD                        4.9                        DRE                         5.6
        DRE                       18%
           CPT                       22%                           CPT                       31%                        DRE                          5.2                              O                       5.4

           EQR                       23%                                                                                      O                       5.3                          AVB                        5.3
                                                                 DRE                       32%
           AVB                       23%                              O                      35%                           AVB                        5.7                          CPT                        5.3

              O                      26%                           PSA                       35%                           EQR                        6.0                          EQR                        4.5

           SPG                       38%                           SPG                       53%                           SPG                        7.0                          SPG                        4.3

    1) Companies are per 3/31/21 Wells Fargo Research except PLD Net Debt to EBITDA and Fixed Charge which are per 3/31/21 company supplementals and DRE which is per our 3/31/21 Q1 supplemental report.
    2) Quarter annualized; (3) Moody’s / S&P, respectively. A securities rating is not a recommendation to buy, sell or hold securities and is subject to revision or withdrawal at any time by the rating organization.

                                                                                                                                                                                                               CAPITAL     31
CORPORATE RESPONSIBILITY
Corporate Responsibility at Duke Realty
 Corporate responsibility is a commitment to corporate practices that
 balance continuous improvement in environmental (E), social (S) and
 governance (G) initiatives that we believe are critical to our long-term
 success and to relationships with our stakeholders.

 ESG Goals
 • Utilize materiality assessment results to refine long-term strategy and goals
 • Promote associate well-being and champion diversity, equity and inclusion
 • Continue to evaluate renewable energy solutions for our customers
 • Impact communities where we do business
 • Develop sustainable buildings
 • Continuously improve disclosure and publish additional KPI’s and targets for
   controllable and non-controllable ESG factors
                                                                    CORP RESPONSIBILITY   33
Green Initiatives

                        $1.46B                                                                                     82                                                              87%
                        LEED developments                                                                LEED projects                                               of portfolio has energy
                           since 2019                                                                     since 2008*                                                    efficient lighting

  $850M                                            ESG Data Mgt Technology
                                                  software investment in 2021 to enhance energy
                                                                                                                                                                                                                        $1.2B
                                                                                                                                                                                                              line of credit renewal
    of green bonds                                monitoring, reporting and tenant engagement; as                                                                                                            includes sustainability-
  issued since 2019                                 well as enhance other “S” and “G” reporting                                                                                                               linked pricing* (2021)
            Note: Figure represents industrial, as well as previously owned office and medical office LEED projects since 2008. * Pricing linked to growing the % of stabilized in-service LEED developed properties.    CORP RESPONSIBILITY   34
Green Initiatives – Smart Building and Solar Case Studies

 • 529,000-square-foot Class A, multi-load      • 18,000 solar panels installed across four
   building in Southern California San            buildings in Perth Amboy totaling 1M
   Gabriel submarket (Irwindale, CA)              square feet of rooftop space

 • Close to major transportation routes         • 11.1 megawatt system will produce a
   servicing the Southern California LA Basin     combined 13,500,000 kWh of clean
                        ®
                                                  electricity–enough to power more than
 • Built to pursue LEED Silver certification      2,200 homes annually, 50% are low-to-
                                                  moderate income households
 • Smart building enhancements including
   temperature and lighting controls, smart     • Part of New Jersey’s Community Solar
   metering and energy storage systems to         Energy Pilot Program in Partnership with
   ensure energy efficiency.                      Solar Landscape

                                                                            CORP RESPONSIBILITY   35
Commitment to Social and Governance

                                                    Top

                                          20%                                                                3,600                                                                        24%                                                                     55%
                                         governance and                                                                                                                                 women in upper                                                             diversity of
                                                                                                                   total hours                                                                                                                                    independent
                                         social rankings
                                                         1
                                                                                                                  volunteering                                                           management
                                                                                                                                                                                                                                                                    directors

                                         ISS QualityScore                                               2
                                                                                                                                                                                                        Board of Directors
                                                                                                                                                                              Annual board of directors elections since 2002. By                                                      3
                                                                                                                                                                              laws incorporate proxy access provision of 3/3/20
                         Social

          Governance

                                            0            2             4            6             8           10

                                           Lower Risk                                     Higher Risk                                                     Jim Connor                    David Stockert                  John Case                Tamara Fischer      Norman Jenkins            Kelly
                                                                                                                                                      Chairman and CEO                    Lead Director                                                                                   Killingsworth

                 •       Incorporate elements of SASB disclosure
                         framework in public filings.
                 •       Community service, wellness and diversity,
                         equity & inclusion part of culture. Wellness                                                                                       Melanie                     Peter Scott                 Chris Sultemeier                   Michael          Warren            Lynn Thurber
                         program helps to reduce turnover and                                                                                              Sabelhaus                                                                                 Szymanczyk        Thompson

                         create G&A savings.

Note: Figures represent latest QE data or FY 2020 activities. (1) Ranked by Green Street Advisors and ISS. (2) ISS QualityScore as of 5/1/2021 based on four “pillars” - Board Structure, Shareholder Rights, Compensation and Audit. In
aggregate, over 100 variables drive the composite score. Peer set for “G” S&P 500, for “S” is REIT GICS. (3) “3-3-20” is a group of up to 20 shareholders, owning three percent or more of the company’s outstanding shares continuously for
at least three years can require the company to include in its proxy materials director nominations for up to the greater of: (a) 20% of the number of directors up for election, rounding down to the nearest whole number; or (b) two directors.                                                        36
                                                                                                                                                                                                                                                                    CORP RESPONSIBILITY
Industry Recognitions & Affiliations

            •    Listed on Forbes Global 2000 – one of 35 real estate companies

            •    Gold winner of Brandon Hall Group’s Excellence Awards in the Best
                 Inclusion and Diversity Strategy category

            •    Global Real Estate Sustainability Benchmark (GRESB) member

            •    2020 Women on Boards for ten consecutive years

            •    Best Places to work in Illinois (1st), Orange County (1st) and Dallas
                 (11th)

            •    American Heart Association’s Workplace Health Achievement Gold
                 level winner four consecutive years

            •    American Red Cross partner and Disaster Responder member

             Note: Information reflects 2020 recognitions.
                                                                       CORP RESPONSIBILITY   37
Legacy Commerce Center (Brownfield development), Linden, NJ
(3 buildings totaling 1.1 million square feet)

                                                              WHY DUKE REALTY? |
  2021 DETAILED RANGE OF ESTIMATES (GUIDANCE)
The Leading Domestic-Only Logistics REIT

                                  Market leadership and trusted advisor to our customers with long-term relationships
   50 Years of Experience

   Leading Developer and              Portfolio suited for e-commerce and traditional distribution; concentrated in Tier 1 markets
                                       with newest portfolio in sector with low capex; strong tenants.
   Owner of State-of-the-Art
                                      Best-in-class, vertically integrated development platform drives incremental growth
   Logistics Facilities
                                        Shifting consumer habits creating growth ripple effect throughout the entire supply chain; global
   Long Term Fundamentals                pandemic resulted in supply chain bottlenecks creating strategies for inventory “safety stock”

   Outlook Very Strong                  Secular demand, traditional demand expected to roughly equal new supply on an annual basis, yet
                                         historical lows in vacancy and submarket selectivity set up a positive pricing power environment

                                               Debt to Total Market Cap at 1Q21 of 18%; 2021 expected mid-point of guidance for
   Fortress Balance Sheet with                  Fixed Charge Coverage and Debt-to-Ebtida of 5.9x and 5.0x, respectively.
   Ample Liquidity for Growth                  No significant debt maturities until 2023

                                                   ‘17 – ‘20 AFFO growth 7.9%; 2021 expected growth in AFFO of 10.2%
                                                   Improving embedded lease esclators, a higher level of annual development
   Proven Financial Performance                     deliveries with strong margins and IRR’s and excellent market fundamentals
                                                    supportive of FFO, AFFO and NOI growth in high single digits to low double digits
   and Strong Outlook
                                                   8.5% dividend increase Q4 2020; with future increases correlated to AFFO growth
                                                   Recent monthly rent collections at top of peers – indicative of relative quality

   Responsible Corporate Citizen                       Developed 29 LEED-certified industrial facilities; 28 projects in pursuit of LEED
                                                        certification. 100% LEED commitment on all new developments.
   with ESG Embedded in Culture
                                                       Community service, wellness and diversity programs for over 18 years
   for 3 Decades
                                                       Top-tier governance per ISS and Green Street

                                                                                                                  WHY DUKE REALTY           39
2021 Range of Estimates                                                                                                                  Updated April 28, 2021

(dollars in millions except per share amounts)
                                                               Range of Estimates
                                             2020     2021
 Metrics                                    Actual    YTD     Pessimistic Optimistic       Key Assumptions

Net Income per Share Attributable           $0.80     $0.21      $1.86      $2.24      –   Original 2021 guidance in a range of $1.24 to $1.58 per share.
to Common Shareholders - Diluted                                                       –   Higher gains on property sales in 2021 compared to 2020.
Nareit FFO per Share Attributable to        $1.40     $0.38      $1.60      $1.70      –   Original 2021 guidance in a range of $1.58 to $1.68 per share.
Common Shareholders - Diluted                                                          –   Quicker lease-up of new developments.
                                                                                       –   Less impact from debt transactions in 2021 compared to 2020.
                                                                                       –   Expense impact of internal leasing costs, $0.02 to $0.04.
Core FFO per Share Attributable to          $1.52     $0.39      $1.65      $1.71      –   Original 2021 guidance in a range of $1.62 to $1.68 per share.
Common Shareholders - Diluted                                                          –   Quicker lease-up of new developments.
                                                                                       –   Lower bad debt expense than original estimates.
                                                                                       –   Strong rent growth.
Growth in AFFO - Share Adjusted              6.2%     8.8%       8.0%       12.3%      –   Original 2021 guidance in a range of 5.8% to 10.1%.
                                                                                       –   Driven by same factors impacting Core FFO.
Average Percentage Leased                   97.6%     98.1%     97.2%       98.6%      –   Original 2021 guidance in a range of 96.6% to 98.6%.
(stabilized portfolio)                                                                 –   Less downtime from troubled tenant move-outs than original estimate.
                                                                                       –   Pushing rents at expense of some occupancy.
Average Percentage Leased                   97.0%     97.5%     96.3%       97.7%      –   Original 2021 guidance in a range of 95.7% to 97.7%.
(In-service portfolio)                                                                 –   Driven by same factors impacting stabilized portfolio.
                                                                                       –   Quicker leasing of speculative development.
Same Property NOI - Cash                     5.0%     6.3%       4.1%        4.9%      –   Original 2021 guidance in a range of 3.6% to 4.4%.
                                                                                       –   Increased occupancy from original estimate.
                                                                                       –   Continued solid rent growth, embedded lease escalations.
Same Property NOI - Net Effective            2.8%     7.3%       3.1%        3.9%      –   Original 2021 guidance in a range of 2.5% to 3.3%.
                                                                                       –   Less downtime from troubled tenant move-outs than original estimate.
                                                                                       –   Lower straight-line rent bad debt than 2020.
Building Acquisitions                       $411       $51       $300        $500      –   Original 2021 guidance in a range of $200 to $400.
(Duke share)                                                                           –   Coastal markets focus.
Building Dispositions                        $322      $94       $900       $1,100     –   Original 2021 guidance in a range of $500 to $700.
(Duke share)                                                                           –   Primarily non-Tier 1 markets, including St. Louis.
                                                                                       –   Manage tenant concentration.
Development Starts                           $796     $412       $950       $1,150     –   Original 2021 guidance in a range of $700 to $900.
(JVs at 100%)                                                                          –   Leasing success driving speculative activity.
                                                                                       –   Speculative starts in targeted growth markets.

Service Operations Income                        $6    $2         $8         $10       –   Original 2021 guidance in a range of $5 to $7.
                                                                                       –   Third party development.
General & Administrative Expense             $58      $24        $61         $57       –   Original 2021 guidance in a range of $59 to $55.
                                                                                       –   Consistent overhead levels.
                                                                                       –   Excludes overhead restructuring costs.
Effective Leverage (Gross Book               32%      32%        33%         29%
Basis)
Fixed Charge Coverage (TTM)                  5.6X     5.8X       5.7X        6.1X
Net Debt to Core EBITDA (TTM)                5.2X     5.2X       5.2X        4.8X      - Maintain Baa1/BBB+ ratings.                                              40
Lockport 16328 / 16410 / 16508 (3 buildings, 803,000 SF), I-55 Submarket, Chicago, IL

                                                                    APPENDIX
                                             IN-FILL DEVELOPMENT CASE STUDIES
Infill Build-to-Suits and Spec Developments - Chicago

•   Three projects totaling 2.2 million square feet
•   Two (2) build-to-suits totaling 1.9 million
    square feet with top tier customers Wayfair
    and a leading home and commercial
    improvement retailer, with both customers
    having leading e-commerce strategies
•   One (1) speculative development totaling
    300,000 square feet on a rail-served site
    inside the I-294 beltway
•   ~ Mid 30’s value creation expected

                                                      DEVELOPMENT   42
Infill Redevelopment – Southern California
    Orange County Submarket

6450 Katella Ave| 146,000 SF
Cypress, California

•   Acquired former Mitsubishi HDQ – one 2-story
    office building, four smaller R&D buildings and
    one 146,000 SF warehouse
•   Within one hour of 10.5M residents; 5 miles from
    5 major freeways – perfect last mile location
•   Leased for 10 yrs to e-comm user just after
    closing
•   14 month entitlement / Conditional Use Permit
    process
•   Under construction; August 2021 delivery
•   ~ 60% value creation expected

                                                       DEVELOPMENT   43
Infill Redevelopment – Southern California
South Bay Submarket

•   Acquired Class C industrial building on 13-
    acre brownfield site in Q4 2018
•   7 mi from LAX / 10 mi from the Ports of
    LA/LB
•   17-month environmental remediation and
    demo                                                             13344 South Main Street
                                                                     290,000 SF
•   Speculative start August 2020
•   Preleased for 100% of space December
    2020, delivered May 2021                      Existing Class C
                                                  Warehouse

•   225M SF inventory in South Bay
    submarket with 1.6% vacancy
•   > 50% value creation expected
                                                                              DEVELOPMENT      44
Infill Redevelopments – Los Angeles / Orange Co
Under construction and coming soon

                                                          2871 E La Mesa St
                                                          ~187,605 SF developable
                                                            Anaheim, California

                                                       Value creation expected > 30%

                                                       Orange Ave
                                                   ~160,673 SF developable
                                                    Long Beach, California

                  13215 Cambridge Street
                     ~146,068 SF developable
                    Santa Fe Springs, California

                                                    Value creation
                                                   expected > 40%
            Value creation expected > 40%
                                                                                       45
Infill Redevelopments – Inland Empire West
Under construction and coming soon | 35% to 40% value creation expected

                                        8978 HAVEN AVE | 120,628 SF
                                        Rancho Cucamonga, California

                                                                               Vineyard and Elm
                                                                              ~190,713 SF developable
   10905 Beech Avenue                                                            Ontario, California
    ~170,000 SF developable
       Fontana, California

                                Slover and Oleander
                                 ~185,400 SF developable
                                    Fontana, California

                                                                          DEVELOPMENT                   46
Land Acquisitions & Developments – Inland Empire East
4

     45% to 50% value creation expected

    4375 N PERRIS BLVD | 1,008,646 SF                             4501 PATTERSON AVENUE | 800,628 SF                               9180 ALABAMA ST | 1,079,236 SF
    Perris, California                                            Perris, California                                               Redlands, California
       Start Feb 2019 | Preleased Nov 2019 | Delivered May 2020      Start Sept 2019 | Preleased Apr 2020 | Delivered Sept 2020       Start Dec 2019 | Preleased Sep 2020 | Delivered April 2021

                                            4375 N Perris
                                             Boulevard                         3500 Indian Ave
                                            1,008,648 SF                         783,407 SF
                                                                                                                                  3300 Indian Ave
                                                                                                                                   1,224,874 SF

                                                                                                             728 W Rider St
                                                                                                              1,203,449 SF

                               ENTITLEMENT NOTE: IE East entitlement
                               process ranges from 15 to 36 months

                                                                                                                                                                      DEVELOPMENT                  47
Infill Redevelopment – Northern California
                                                    •   Located in San Jose’s Golden Triangle submarket with direct
                                                        access to I-880 in the Silicon Valley with excellent access to
                                                        the Peninsula and all of the Bay Area.

                                                    •   Acquired low coverage industrial facility on 13.7 acres of
                                                        land in Q4 2019. Facility was leased to Univar for their
                                                        chemical 3PL operations through Q2 2020.

                                                    •   Upon Univar’s lease expiration, building began
                                                        redevelopment into a 141,000 SF last mile delivery station
                                                        and 100% leased to a major e-comm retailer; delivery
                                                        expected September 2021.

                                                    •   ~ 40% Value creation expected

2256 Junction Ave. | Former Univar Chemical Plant
San Jose, CA

                                                                2256 Junction Ave. | Proposed Last Mile Delivery Station
                                                                San Jose, CA

                                                                                                                           DEVELOPMENT   48
Infill Redevelopment – Northern California

•   In January 2019, acquired 12 acre site in     Before
    Fremont, CA near I-880. Site was occupied
    by a 23-year old office/flex property.
    Received site plan approval in Q4 2019 and
    commenced demolition and grading work.

•   In Q2 2020 began shell construction for a     After
    210,000 SF, 36’ clear speculative facility;
    delivered late Q1 2021.

•   Submarket vacancy 5.5% with 5-year rent
    growth ~ 9.8% annually

•   ~ 33% Value creation expected

                                                           DEVELOPMENT   49
Infill Redevelopment – South Florida
Medley / Hialeah Submarket
                                                       •   Direct access to U.S. Highway 27 to facilitate quick access
                                                           to I-75, SR 826 and straight access to the cargo area of
                                                           Miami International Airport and the Florida Turnpike.
                                                       •   Acquired former lumber yard site on 35 acres of land in Q1
                                                           2018, demolition of existing structure began Q1 2020 with
                                                           pre-development lease up of Building 2 by Q3 2020, prior to
                                                           demolition completion.
                                                       •   First building was 72% preleased to a distributor of
                Miami 27
              Business Park
                                                           technology products prior to the start of construction; Second
                                                           building commenced construction in 2021.
                                           Miami
                                                       •   Submarket vacancy 6.0%; recent historical and projected
                                       International       market rent growth of 3.1%.
                                           Airport
                                         (10 miles)    •   > 40% Value creation expected

 10310 NW 121ST Way | Former Lumber Yard
 Medley, FL

                                                                    10310 NW 121ST Way | 221,984 SF under construction
                                                                    Medley, FL

                                                                                                                         DEVELOPMENT   50
Infill Redevelopment — Northern New Jersey
    Exit 12 (Carteret / Avenel) Submarket

                                                           One Paddock St
                                                             185,071 SF

•    2018 infill acquisition of 9 net acres brownfield
     land site approximately 2 miles from the Exit 12
     interchange off I-95; strategically located within
     30 minutes of NYC and 15 minutes of Newark
     International Airport and Port of New Jersey.
•    Successfully worked through site remediation
     contingencies and various government approvals.
•    Successfully leased site to Amazon in Q4 2019
     for a brand new, 185,000 SF build-to-suit, delivery
     station with approximately 3 acres of extra
     parking for Amazon’s fleet storage, delivered in
     Q3 2020.
•    ~ 50% Value creation
                                                                            DEVELOPMENT   51
Infill Redevelopment — Northern New Jersey
Perth Amboy Submarket

                        •      Acquired 83 acre site in Northern New Jersey along the Garden State
                               Parkway in Q2 2019 that was under contract for 2 years.
                        •      Successfully completed a remediation plan with government agencies;
                               including demolishing an old steel manufacturing facility. Remediated the
                               site and completed the entitlement process.
                        •      Developed two industrial build-to-suits with 20-year leases for a major
                               home improvement retailer. Building 1 delivered Q3 2020 as an “FDC”
                               (flatbed distribution center) and Building 2 an ‘MDC” (market delivery
                               center), delivered Q4 2020. Both facilities provide same-day and next-day
                               delivery, with the flatbed delivery center delivering larger bulk orders to
                               contractor work sites and stores in the area.
                        •      > 55% value creation
                              New York City
                                                                           New Jersey 440 Toll Road Bridge

                                                                  Building 1
                                                                  332,800 SF

                                                                                                       Building 2
                                                                                                       921,100 SF

                            Steel Run Logistics Center | Perth Amboy, NJ
                            1,254,000 SF

                                                                                                                DEVELOPMENT   52
Infill Redevelopment — Northern New Jersey
Newark Submarket

                                                                                                                          After
                                                       Before
•   As part of the 2017
    “Bridge” acquisition, DRE                                   429 Delancy Street
                                                                662,000 SF Speculative Built
    acquired the right to                                       Delivered Q4 2019; 100% Leased

    develop a 32 acre infill
    location in the Newark
    submarket

•   Commenced development
    in late 2018 for 40’ clear
    height, speculative facility.
    In Q4 2019, facility
                                                                                   2 miles from Newark Intl. Airport
    delivered and leased for                                                       and Ports of Newark and Elizabeth

    12 years to a major e-
    commerce retailer.
                                                                                                                          After
•   662,000 square foot fulfillment center being used for
    primarily last mile “quick delivery” for Northern NJ

•   The modern building features are truly unique to the
    submarket.
     • In this submarket, only 7 of 733 facilities (4.1%)
        have > 30’ clear height and built after 1997.

•   ~ 30% value creation

                                                                                                            DEVELOPMENT           53
Infill Redevelopment — Northern New Jersey
Exit 10 Submarket

                                     •   Acquired 40 acre site in Northern New Jersey along the Exit
                                         10 / I-287 Corridor in Q2 2019.
                                     •   Successfully completed an environmental remediation plan
                                         and commenced construction in Q1 2020. In Q4 2020, also
                                         entered into ground lease for adjacent 8 acres for
                                         development of an excess storage lot amenity.
                                     •   Executed 100% pre-lease in December 2020 for a major
                                         furniture dealer for their “safety stock” logistics strategy, with
                                         expected delivery in Q3 2021.
                                     •   Submarket vacancy at 1 to 2%, representing a strong
                                         environment for lease-up
                                     •   > 50% value creation expected

                      150 Old New
                    Brunswick Road

                                                                                          DEVELOPMENT         54
Infill Build-to-Suit Developments – Atlanta Airport

 2929 ROOSEVELT HIGHWAY | 500,000 SF             1000 LOGISTICS WAY | 664,000 SF                   CAMP CREEK 4850 | 210,000 SF
 HWC Logistics                                   Home Depot                                        Porsche Cars NA

                             Delivered Q2 2020                                 Delivered Q1 2021                                  Delivered Q1 2020

                                                    Value creation ~ 30%                                                   DEVELOPMENT                55
Definitions
Supplemental Performance Measures
Funds from Operations (“FFO”): FFO is a non-GAAP performance measure computed in accordance with standards established by the National Association of Real Estate
Investment Trusts (“Nareit”). It is calculated as net income attributable to common shareholders computed in accordance with generally accepted accounting principles (“GAAP"), excluding
depreciation and amortization related to real estate, gains and losses on sales of real estate assets (including real estate assets incidental to our business) and related taxes, gains and
losses from change in control, impairment charges related to real estate assets (including real estate assets incidental to our business) and similar adjustments for unconsolidated joint
ventures and partially owned consolidated entities, all net of related taxes. We believe FFO to be most directly comparable to net income attributable to common shareholders as defined
by GAAP. FFO does not represent a measure of liquidity, nor is it indicative of funds available for our cash needs, including our ability to make cash distributions to shareholders.

Core Funds from Operations (“Core FFO”): Core FFO is computed as FFO adjusted for certain items that can create significant earnings volatility and do not directly relate to our
core business operations. The adjustments include gains or losses on debt transactions, gains or losses from involuntary conversion from weather events or natural disasters, promote
income, severance and other charges related to major overhead restructuring activities, the expense impact of non-incremental costs attributable to successful leases and similar
adjustments for unconsolidated joint ventures and partially owned consolidated entities. Although our calculation of Core FFO differs from Nareit’s definition of FFO and may not be
comparable to that of other REITs and real estate companies, we believe it provides a meaningful supplemental measure of our operating performance.

Non-Incremental Costs Attributable to Successful Leases: Non-incremental costs attributable to successful leases represent internal costs allocable to successful leasing
activities and exclude estimated costs related to downtime and/or unsuccessful deals. These costs primarily consist of compensation and other benefits for internal leasing and legal
personnel. These costs are not capitalizable "incremental costs" in the context of the applicable lease accounting rules, but we believe including them as an adjustment when computing
Core FFO provides useful information for purposes of comparability with economically similar success-based costs incurred by other organizations that outsource their leasing functions,
which are generally capitalizable.

Adjusted Funds from Operations (“AFFO”): AFFO is defined by the Company as the Core FFO (as defined above), less recurring building improvements and total second
generation capital expenditures (the leasing of vacant space that had previously been under lease by the Company is referred to as second generation lease activity) related to leases
commencing during the reporting period, and adjusted for certain non-cash items including straight line rental income and expense, non-cash components of interest expense including
interest rate hedge amortization, stock compensation expense and after similar adjustments for unconsolidated partnerships and joint ventures.

EBITDA for Real Estate ("EBITDAre"): EBITDAre is a non-GAAP supplemental performance measure, which is defined by Nareit as net income (computed in accordance with
GAAP), before interest, taxes, depreciation and amortization ("EBITDA") adjusted to exclude gains and losses on sales of real estate assets (including real estate assets incidental to our
business), gains and losses from change of control, impairment charges related to real estate assets (including real estate assets incidental to our business) and to include share of
EBITDAre of unconsolidated joint ventures. We believe EBITDAre to be most directly comparable to net income computed in accordance with GAAP and consider it to be a useful
supplemental performance measure for investors to evaluate our operating performance and ability to meet interest payment obligations.

Core EBITDA: Core EBITDA is defined by the Company as the EBITDAre, adjusted for the same reasons as Core FFO, to exclude gains or losses on debt transactions, gains or losses
from involuntary conversion from weather events or natural disasters, the expense impact of costs attributable to successful leasing activities, promote income and severance charges
related to major overhead restructuring activities.

Property Level Net Operating Income - Cash Basis ("PNOI"): PNOI is a non-GAAP performance measure, which is comprised of rental revenues from continuing operations
(computed in accordance with GAAP) less rental expenses and real estate taxes from continuing operations, along with adjustments to exclude the straight line rental income and expense,
amortization of above and below market rents, amortization of lease concessions and lease termination fees as well as an adjustment to add back intercompany rent. PNOI, as we calculate
it, may not be directly comparable to similarly titled, but differently calculated, measures for other REITs. We believe that PNOI to be most directly comparable to income from continuing
operations defined by GAAP and that PNOI is another useful supplemental performance measure, as it is an input in many REIT valuation models and it provides a means by which to
evaluate the performance of the properties within our Rental Operations segments.

Same Property Performance Net Operating Income ("SPNOI"): We evaluate the performance of our properties, including our share of properties we jointly control, on a "same
property" basis, using PNOI with certain minor adjustments. The same property pool of properties is defined once a year at the beginning of the current calendar year, and includes
buildings that were in the stabilized portfolio throughout both the current and prior calendar years in both periods. The same property pool is adjusted for dispositions subsequent to its
initial establishment. SPNOI also excludes termination fees. SPNOI is a non-GAAP supplemental performance measure that we believe is useful because it improves comparability between
periods by eliminating the effects of changes in the composition of our portfolio.

                                                                                                                                                                                               56
You can also read