Study on attractors during organism evolution - Nature
←
→
Page content transcription
If your browser does not render page correctly, please read the page content below
www.nature.com/scientificreports
OPEN Study on attractors
during organism evolution
1*
Andrzej Kasperski & Renata Kasperska2
The important question that arises during determining the evolution of organisms is whether
evolution should be treated as a continuous process or whether groups of organisms fall into ’local’
attractors during evolution. A similar question arises during considering the development of cells
after cancer transformation. Answers to these questions can provide a better understanding of how
normal and transformed organisms evolve. So far, no satisfactory answers have been found to these
questions. To find the answers and demonstrate that organisms during evolution get trapped in ’local’
attractors, an artificial neural network supported by a semihomologous approach and unified cell
bioenergetics concept have been used in this work. A new universal model of cancer transformation
and cancer development has been established and presented to highlight the differences between
the development of transformed cells and normal organisms. An unequivocal explanation of cancer
initialization and development has not been discovered so far, thus the proposed model should shed
new light on the evolution of transformed cells.
Random genetic mutations and natural selection are the factors that, according to existing theories, act as driving
forces of organism e volution1,2. These phenomena may point at the continuous or discontinuous character of
evolution. When considering evolution as a discontinuous process, large differences between genomes of evolv-
ing groups of organisms should be visible. In this case, it can be said that whole groups of organisms should be
trapped in different attractors and evolve inside them. The term ’attractor’ means a configuration (a set of values
for the variables) towards which the system evolves over time. After attaining an attractor a given configuration
erturbation3. In this
of a system is sufficiently stable to return to the original state after disappearing an eventual p
work, the attractors which trap genomes of organisms are termed ’genome attractors’. For all cells of trapped (in
the genome attractor) organism, special gene expression programs (termed ’cell-fates’) are activated that enlive
and keep alive the whole organism.
Most animal studies have used single mitochondrial DNA genes to evaluate population or low-level taxonomic
relationships4–7. One of the most useful genes for phylogenetic reconstruction is cytochrome b, that is commonly
used in systematic research to address many taxonomic level d ivergences8,9. Cytochrome b, alone or supported
by other data sets (for example nuclear ribosomal rRNA gene, cytochrome oxidase I gene (COI), complete mito-
chondrial DNA), can yield phylogenetic trees that are in agreement with well-established p hylogeny9–16. Research
indicates that the use of cytochrome b is superior to COI when one locus is to be used as a standard for mam-
malian species phylogeny and identification16. Cytochrome b is very useful as a ’fingerprint’ of organisms because
it can harbour very few mutations due to the stringent structural and physiological links it obeys. This implies all
the observed mutations are ’function preserving’ and thus ’fitness independent’, so that they can be considered
as evolutionary neutral mutations only working as ’time keeping’ measuring the evolution timing between two
species. For these reasons, cytochrome b sequences of the selected groups of organisms have been examined
in this work to check trapping the evolving groups of organisms in genome attractors. Especially important for
checking genome attractors is the ability to use cytochrome b sequence variability in comparison of organisms
in the same genus or the same family17,18. An example of using cytochrome b alone as a molecular marker can
be establishing phylogenetic relationship at various levels within the fish family Cichlidae9. The obtained trees
(as a result of analysis based on cytochrome b alone) have been consistent with the trees obtained as a result of
the extended (total) a nalysis9. Other authors have presented that a partial DNA sequence of cytochrome b can
be sufficient for animal identification. This has been demonstrated on the example of the identification of the
remains of endangered animals and species endemic to Taiwan (i.e. clouded leopards, leopard cats, lions, tigers,
water buffalos and selected Formosans)19.
The reconstruction of evolution on genetic levels usually requires applying a distance correction to take into
account the impact of an intermediate/invisible stages of evolution. For this reason, the selection of a stochastic
1
Institute of Biological Sciences, Department of Biotechnology, University of Zielona Gora, ul. Szafrana 1,
65‑516 Zielona Gora, Poland. 2Faculty of Mechanical Engineering, University of Zielona Gora, ul. Szafrana 4,
65‑516 Zielona Gora, Poland. *email: A.Kasperski@wnb.uz.zgora.pl
Scientific Reports | (2021) 11:9637 | https://doi.org/10.1038/s41598-021-89001-0 1
Vol.:(0123456789)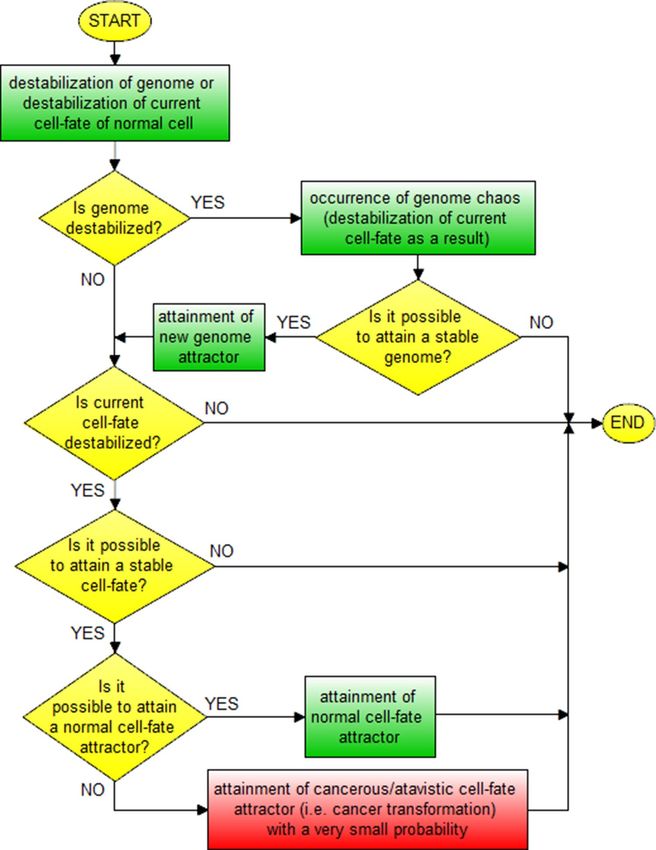
www.nature.com/scientificreports/
model (i.e. correction model) for estimating real evolutionary distance is required. These correction models
include for example the Poisson, Dayhoff, Jones-Taylor-Thornton (JTT) models that can be used, inter alia, in
Neighbor Joining and Maximum Likelihood methods20. Before calculation of distances between sequences, the
sequences have to be aligned. To align sequences the appropriate method should be selected and parameterized.
In this way, various results can be obtained and different conclusions regarding evolution can be drawn depend-
ing on the used methods and their parameterization. As a result, it can be said that a cloud of uncertainty covers
over the real truth about evolution.
During organism evolution, macro-cellular evolution and micro-cellular evolution can be distinguished.
Macro-cellular evolution is driven by genome re-organization, while micro-cellular evolution is driven by gene
mutation and/or epigenetic function21,22. In this article the continuous/discontinuous character of evolution (with
the consequent existence of macro-evolution processes separated from micro-evolution) has been investigated
by means of a neural network inspired approach. The new idea presented in this work is to code the individual
amino-acids of the cytochrome b sequences of organisms in many different ways. The aim of the different cod-
ing individual amino-acids was to put into account and neutralize the influence of different manners of amino-
acid coding on the recognized by neural network evolutionary similarities. Additionally, the semihomologous
approach has been used to validate the results. Studies of evolution using the semihomologous approach offer
new possibilities related to take into account the similarities at the codon level23–27.
In this article, the evolution of normal organisms has been also compared with transformed cell development.
New evolutionary models are proposed to reconcile macro-cellular evolution and micro-cellular evolution in
view of cancer development. In one of the newest exemplary models, all individual molecular mechanisms are
classified as genomic/environmental interactions that lead to macro-cellular evolution, followed by micro-cellular
evolution to grow the cancer cell p opulation28,29.
The article is organized as follows: firstly the methods and theoretical bases are listed, including a description
of the neural network implementation and semihomologous approach. Secondly, selected aspects of evolution
of normal organisms and transformed cells are given attention to. Lastly, the research conclusions are presented.
Materials and methods
Cytochrome b amino-acid sequences selected for this study were taken from the protein databases NCBI and
Protein BLAST.
Design and teaching the artificial neural network. The artificial neural network (ANN) has been
designed as a full synapse three layer neural network and it has been taught in a similar way as it is presented
in18. These three layers (i.e. the input, hidden and output layer) are composed of neurons, all having the same
characteristics. Each layer has been implemented as a sigmoid layer and transfers the input pattern to the out-
put pattern by executing a sigmoid transfer function (y = 1/(1 + exp(-x))) that gives a smooth output limitation
within the range 0 and 130. The layers are connected using synapses that permit a pattern to be passed from the
input layer to the hidden layer and next from the hidden layer to the output layer. In the implemented neural
network, all the nodes of the input layer are connected with all the nodes of the hidden layer and all the nodes of
the hidden layer are connected with all the nodes of the output layer. Because the number of amino-acids (AA)
in the cytochrome b sequences is usually not bigger than 400 for almost all organisms, it has been assumed that
the length of sequences in the input of the neural network is equal to 400 AA. In order to obtain a length equal
to 400, the sequences have been aligned by addition of the "−" characters at the end of sequences or have been
cut. After the alignment, each sequence has been converted to the binary form by changing each character to
a random generated five-positional binary number. After converting, the new binary form of sequence (which
is entered into the neural network input layer) has a length of 2000 and the number of neurons in the neural
network input layer is equal to 2000 (i.e. n = 2000). The number of neurons in the output layer (k) is equal to
the number of organisms used for ANN teaching (i.e. k = 36). The number of neurons in the hidden layer (m) is
calculated by the geometric pyramid r ule31, i.e. m = sqrt(n*k) neurons (in this work m = round(sqrt(n*k)) = 268).
Sequences of cytochrome b of 36 organisms have been used to teach the neural network (see point A.1 in
Appendix): https://github.com/biopgms/bioattr/blob/main/teaching_sequences.xml. These 36 organisms have
been selected from a wide spectrum of evolution, from primitive organisms to evolutionarily advanced organ-
isms. Selected in this way 36 cytochrome b sequences can be considered as pattern sequences necessary to
recognize the other, examined organisms. The supervised learning technique with the on-line backpropagation
algorithm has been used for teaching the neural network. This technique allows the neural network to be taught
very effectively30. A teaching output for the first sequence (i.e. the cytochrome b sequence of Bacteria {#1}) was
equal to "0000…0001". For the other sequences used for teaching, "1" was shifted to the left, i.e. a teaching output
for the second sequence (i.e. for the cytochrome b sequence of Green alga {#2}) was equal to "0000…0010". A
teaching output for the 36th sequence (i.e. the cytochrome b sequence of Four-horned antelope {#36}) was equal
to "1000…0000". In this way, the obtained results at the each of 36 outputs are in the range [0, 1] and inform
about recognized similarities of examined organism to 36 organisms used to teach ANN (where value 0 means
the minimum recognized similarity and value 1 means the maximum recognized similarity). ANN had been
teaching (for learning rate = 0.3 and momentum = 0.1) until Root Mean Squared Error (RMSE) was less than
0.001. Teaching process time to decrease the RMSE less than 0.001 was approximately 6 days on computer IBM
HS23 (2CPU Xenon E5–2650 × 4 Core, 2.00 GHz, RAM = 12 GB, HDD = 50 GB). The teaching process has been
carried out in parallel 50 times, each time for different random generated five-positional binary numbers that
code each character in the sequences that have been used to teach the neural network. In this way, 50 versions of
the neural network have been obtained (that can be downloaded from: http://staff.uz.zgora.pl/akaspers/bioattr/
saved_N Ns.z ip), each version of neural network taught using a different amino-acid coding. Then, each examined
Scientific Reports | (2021) 11:9637 | https://doi.org/10.1038/s41598-021-89001-0 2
Vol:.(1234567890)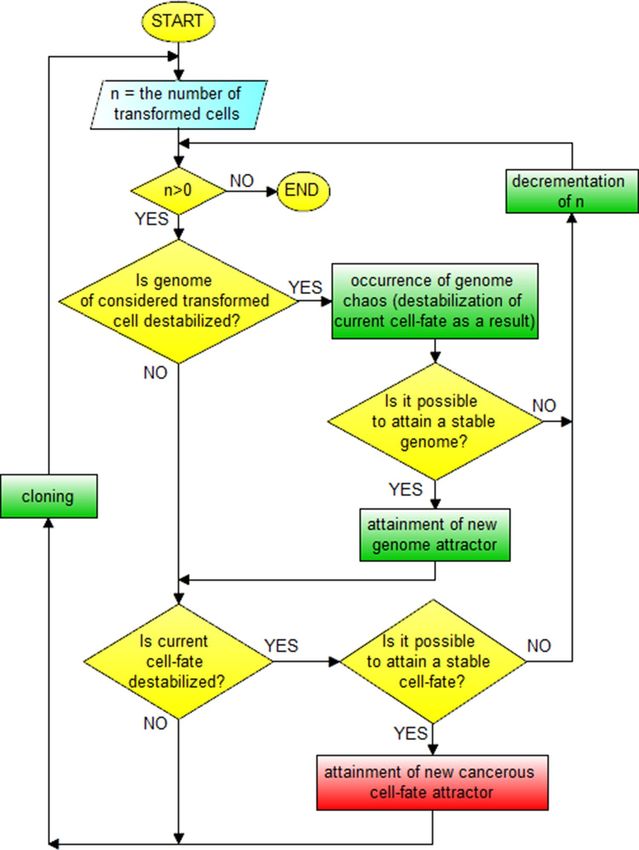
www.nature.com/scientificreports/
Figure 1. Orbits and genome attractors during human evolution. Tree shrew attractor orbit is disturbed most
strongly by the attraction in the Asian rat {#26} (with average similarity to all organisms in the attractor equals
to 0.0025) and Domestic sheep {#35} (0.0014) directions—schematically presented by small arrows from the
attractor. Prosimian attractor orbit is disturbed most strongly by the attraction in the Horse {#32} (0.0037) and
Chinese hare {#24} (0.0013) directions. NWM attractor orbit is disturbed most strongly by the attraction in the
Domestic sheep {#35} (0.0015) direction.
organism had been recognized 50 times by each version of the neural network. The final results of recognition
have been calculated as an arithmetic mean of the results obtained in the given outputs of the neural networks.
Semihomologous approach. The semihomologous method assumes that the one-point mutation in
the codons of compared amino-acids is the most frequent mechanism occurring in homologous proteins. This
method posits close relations between amino-acids and their codons for the analysis of various relationships
between proteins. The semihomologous approach allows for improving (compared to standard homologous
approach) the accuracy of protein sequence comparison which avoids result m isinterpretations23–27. The semi-
homologous algorithm assumes the existence of the following position types when comparing two amino-acids:
(a) homology positions (marked as "R")—positions with comparison of the same amino-acids; (b) transition
positions (marked as "#") – semihomologous positions with transition type one-point mutations in the codons of
the compared amino-acids; (c) transversion positions (marked as "$")—semihomologous positions with trans-
version type one-point mutations in the codons of compared amino-acids.
Results and discussion
In this section the results of two approaches are presented to examine evolution of selected organisms. These two
approaches use artificial neural network (ANN) and semihomologous Dot-Matrix methods, that are implemented
as the EvolutionXXI and dotPicker programs.
Human evolution—ANN approach. The human evolution has been examined taking into account evo-
lution of monkeys (i.e. Tree shrews, Prosimians, New World Monkeys (NWM), Old World Monkeys (OWM)),
Other hominoids (here: hominoids except for Old humans) and Old humans (here: Homo heidelbergensis, Homo
sapiens ssp. Denisova, Homo sapiens neanderthalensis). The obtained evolutionary similarities (recognized using
ANN) between selected organisms from these groups and Homo sapiens are presented in Tables 1–6 (see Appen-
dix). Analysis of the results points out the evolutionary distances between these groups, i.e. it appears that the
organisms of these groups are trapped in the local genome attractors. Assuming that these attractors are in the
orbits (additionally see Remark 1), the distance between the orbits of Old human attractor and Homo sapiens
attractor is very small with a distance factor equal to 1.0013 (i.e. Homo sapiens attractor orbit/Old human attrac-
tor orbit ≈ 1.0013). The distance between the orbits of Other hominoid attractor and Old human attractor is
bigger with a distance factor equal to 1.1. The distances between the other orbits are much bigger with distance
factors equal accordingly to: 3.2, 12.4, 17.8, 9.3 (Fig. 1). The small arrows pointing from the genome attractors
to the outside of the orbits schematically represent disturbances (i.e. attractions to the other organisms to which
similarities have been recognized by ANN) of the attractor orbits (Fig. 1).
Scientific Reports | (2021) 11:9637 | https://doi.org/10.1038/s41598-021-89001-0 3
Vol.:(0123456789)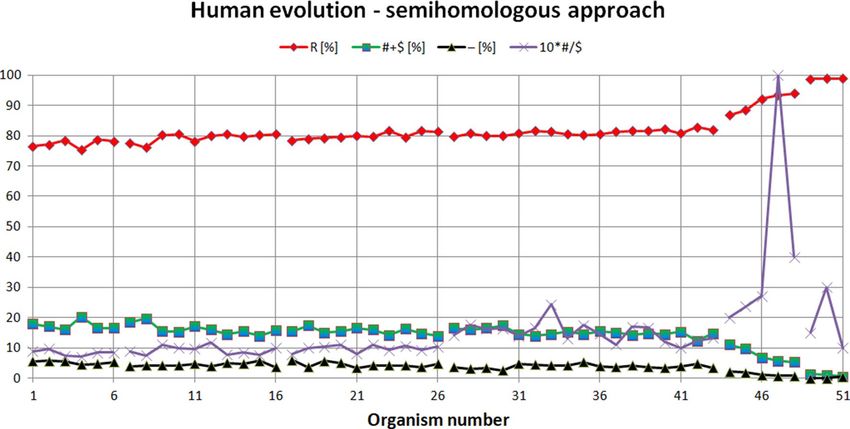
www.nature.com/scientificreports/

                                            Figure 2.  Human evolution examined using semihomologous approach. The organisms presented on the
                                            X-axis are set in the order determined by the neural network from the organism most evolutionarily distant
                                            from Homo sapiens (organism number 1 on the X-axis, i.e. Tupaia belangeri), to the organism closest to
                                            human (organism number 51 on the X-axis, i.e. Homo heidelbergensis). "R"—homologous positions, "# + $"—
                                            semihomologous positions (sum of positions with transitions and transversions), "−"—positions with two or
                                            three point mutations, "#/$" factor—ratio # to $.

                                            Remark 1 The distances between orbits represent evolutionary distances between genome attractors without
                                            taking into account intermediate/invisible stages of evolution (note: distances between orbits are calculated and
                                            presented as distance factors, i.e. inner orbit/outer orbit, see Tables 1–6 and Tables 7–10 in Appendix). Taking
                                            into account the impact of the intermediate/invisible stages of evolution requires applying distance corrections
                                            that increase distance factors (see “Introduction”). The location of the genome attractors in the orbits allows for
                                            this correction to be presented in a very flexible way, i.e. by appropriately shifting (left/right) the genome attrac-
                                            tors along the orbits, it is possible to present the increase or decrease of this correction.

                                            Human evolution—semihomologous approach. The semihomologous approach has been used to
                                            examine Human evolution. The results are presented in Fig. 2 and in Tables 1–6 (see Appendix). Note: the
                                            organism numbers shown on the X-axis correspond to the numbers presented in the column ’Organism no. in
                                            Fig. 2′ in Tables 1–6 (see Appendix).
                                                From Fig. 2 it is noticeable that the semihomologous approach used to examine Human evolution confirms
                                            the results obtained using ANN. During Tree shrew, Prosimian, NWM and OWM development, the numbers of
                                            positions (comparing to Homo sapiens) with two point and three point mutations (i.e. "−" positions) and semi-
                                            homologous positions (i.e. "# + $" positions) very slowly decreases. The number of homologous positions (i.e. "R"
                                            positions) slowly increases. Other hominoid development is characterized by faster decreasing the numbers of
                                            "−" and "# + $" positions and faster increasing "R" positions. Old humans attractor is characterized by very small
                                            number of "−" and "# + $" positions and very high number of "R" positions. Semihomologous characteristics: for
                                            Tree shrew attractor (average("R") = 77.37[%]; average("# + R") = 17.41[%];
                                                average("-") = 5.22[%]; average("#/$") = 0.84); for Prosimian attractor (79.37[%]; 16.18[%]; 4.45[%]; 0.93);
                                            for NWM attractor (79.97[%]; 15.53[%]; 4.5[%]; 0.98); for OWM attractor (81.04[%]; 15.03[%]; 3.93[%]; 1.51);
                                            for Other hominoid attractor (90.95[%]; 7.74[%]; 1.32[%]; 4.22); for Old human attractor (98.86[%]; 0.96[%];
                                            0.18[%]; 1.83). It should be noted that the average ("#/$") factor increases during evolution of these organisms
                                            and is less than 1 for attractors of Tree shrews, Prosimians, NWM and is bigger than 1 for attractors of OWM,
                                            Other hominoids, Old humans (Fig. 3).
                                                It should also be noted that using only the semihomologous approach it is impossible to separate most groups
                                            of organisms (i.e. Tree shrews, Prosimians, NWM, OWM) because the number of homologous and semiho-
                                            mologous positions and positions with two and three point mutations is almost the same for these groups (see
                                            Remark 2).

                                            Remark 2 One of the key properties of neural networks is a generalization allowing for the correct recognition
                                            and classification of previously unseen/unknown patterns (i.e. sequences that have not been used for teaching
                                            when referring to the considerations presented in this article). The advantage of using ANN (comparing to
                                            semihomologous approach) for separation of organisms into groups that represent attractors may be due to the
                                            fact that during recognition ANN takes into account not only amino-acid similarities/dissimilarities but also
                                            the distribution of these similarities/dissimilarities, i.e. the recognition using ANN may resemble recognizing
                                            images formed ("painted") by sequences.

          Scientific Reports |   (2021) 11:9637 |                https://doi.org/10.1038/s41598-021-89001-0                                                     4

Vol:.(1234567890)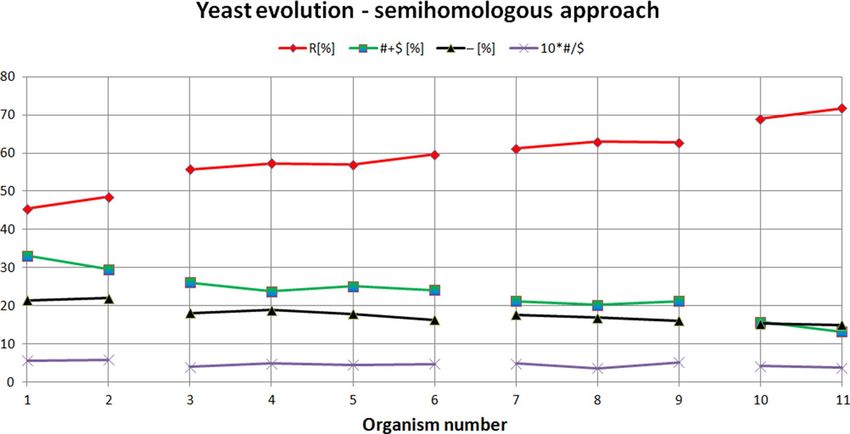
www.nature.com/scientificreports/

                                  Figure 3.  Characteristics of the genome attractors during Human evolution using semihomologous approach.

                                  Figure 4.  Orbits and genome attractors during yeast evolution. Yarrowia/Schizosaccharomyces attractor orbit is
                                  disturbed most strongly by the attraction in the Poplar mushroom {#8} (with average similarity to all organisms
                                  in the attractor equals to 0.006) and Green alga {#2} (0.004) directions—schematically presented by small arrows
                                  from the attractor. Candida attractor orbit is disturbed most strongly by the attraction in the Poplar mushroom
                                  {#8} (0.008) and Green alga {#2} (0.002) directions. Kluyveromyces attractor orbit is disturbed most strongly
                                  by the attraction in the Poplar mushroom {#8} (0.004) and Green alga {#2} (0.002) directions. Saccharomyces
                                  attractor orbit is disturbed by the attraction in the Poplar mushroom {#8} (0.001) direction.

                                  Yeast evolution – ANN approach. The yeast evolution has been examined taking into account evolution
                                  of several strains of yeasts. The obtained evolutionary similarities (recognized using ANN) between Saccharomy-
                                  ces cerevisiae and selected other yeasts are presented in Tables 7–10 (see Appendix). The yeasts during evolution
                                  are trapped in four genome attractors, i.e. Saccharomyces, Kluyveromyces, Candida, Yarrowia/Schizosaccharom
                                  yces attractors (Tables 7–10 in Appendix). Analysis of the results points out the evolutionary distances between
                                  these groups, i.e. it appears (similar as in the case of human evolution) that the organisms of these groups are
                                  trapped in the local genome attractors. Assuming that these attractors are in the orbits (additionally see Remark
                                  1), the distance between the orbits of Saccharomyces attractor and Saccharomyces cerevisiae attractor can be con-
                                  sidered as average with a distance factor equal to 1.4 (i.e. Saccharomyces cerevisiae attractor orbit/Saccharomyces
                                  attractor orbit ≈ 1.4). The distances between the other orbits are bigger with distance factors equal accordingly
                                  to: 2.2, 2.2, 11.7 (Fig. 4).

Scientific Reports |   (2021) 11:9637 |                https://doi.org/10.1038/s41598-021-89001-0                                                  5

                                                                                                                                              Vol.:(0123456789)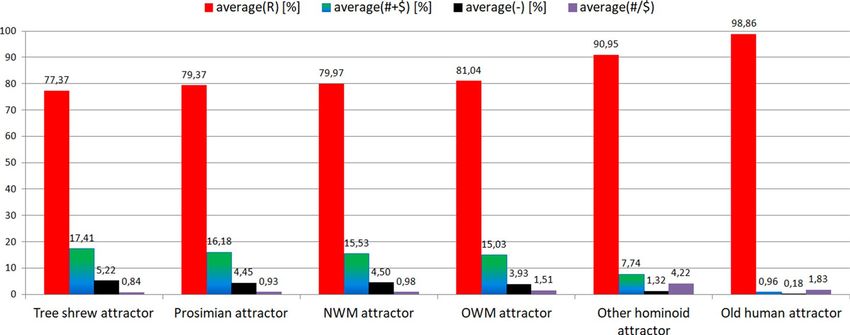
www.nature.com/scientificreports/
Figure 5. Yeast evolution examined using semihomologous approach. The organisms presented on the X-axis
are set in the order determined by the neural network from the organism most evolutionarily distant from
Saccharomyces cerevisiae (organism number 1 on the X-axis, i.e. Schizosaccharomyces pombe), to the organism
closest to Saccharomyces cerevisiae (organism number 11 on the X-axis, i.e. Saccharomyces paradoxus).
"R"—homologous positions, "# + $"—semihomologous positions (sum of positions with transitions and
transversions), "−"—positions with two or three point mutations, "#/$" factor—ratio # to $.
Figure 6. Characteristics of the genome attractors during yeast evolution using semihomologous approach.
Yeast evolution – semihomologous approach. The semihomologous approach has been used to
examine yeast evolution. The results are presented in Fig. 5 and in Tables 7–10 (see Appendix). Note: the organ-
ism numbers shown on the X-axis correspond to the numbers presented in the column ’Organism no. in Fig. 5’
in Tables 7, 8, 9, 10 (see Appendix).
From Fig. 5 it is noticeable that the semihomologous approach used to examine yeast evolution confirms
the results obtained using ANN. During yeast evolution the numbers of positions (comparing to Saccharomyces
cerevisiae) with two point and three point mutations (i.e. "−" positions) and semihomologous positions (i.e.
"# + $" positions) decreases. The number of homologous positions (i.e. "R" positions) increases. Semihomologous
characteristics: for Yarrowia/Schizosaccharomyces attractor (average("R") = 56.68[%]; average("# + R") = 24.96[%];
average("−") = 18.36[%]; average("#/$") = 0.48); for Candida attractor (57.38[%]; 24.81[%]; 17.81[%]; 0.45); for
Kluyveromyces attractor (62.26[%]; 20.9[%]; 16.84[%]; 0.46); for Saccharomyces attractor (70.34[%]; 14.51[%];
15.16[%]; 0.4) (Fig. 6). It should be noted that in this case ANN enables a much clearer separation of organisms
into individual groups compared to semihomologous approach (see Remark 2).
Study on evolution of the other, selected organisms. The ANN approach has not detected clear
direction in the evolution of bats, hippopotamuses, sirenians, rhinoceroses, squirrels (https://github.com/
Scientific Reports | (2021) 11:9637 | https://doi.org/10.1038/s41598-021-89001-0 6
Vol:.(1234567890)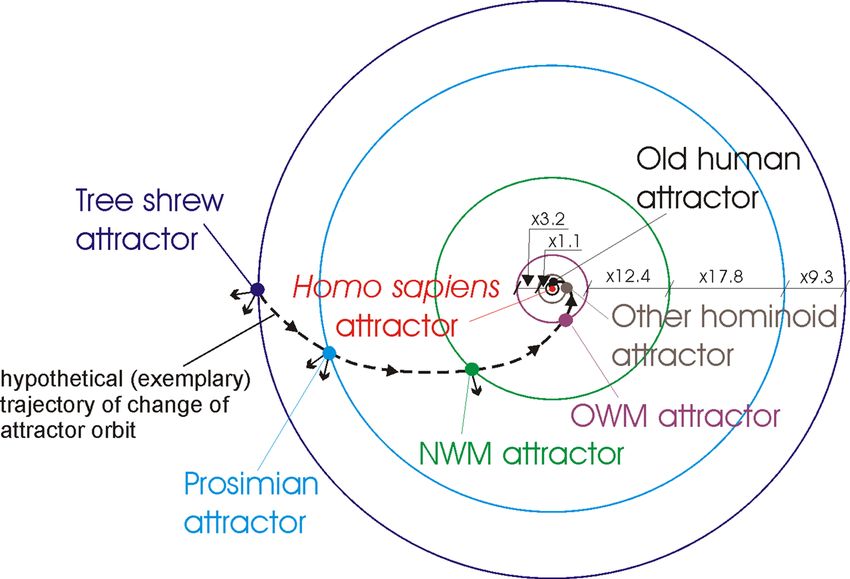
www.nature.com/scientificreports/
biopgms/bioattr/blob/main/other_organisms.pdf). This may indicate that these organisms are trapped in local
genome attractors (bearing in mind that organisms from a wide range of evolution have been used to teach the
neural network).
The recognition of evolution using ANN points out that orbit of Bat attractor (checked for exemplary bats:
Aeorestes cinereus, Anoura caudifer, Aselliscus stoliczkanus, Brachyphylla cavernarum, Casinycteris argynnis, Cyn-
opterus brachyotis, Epomophorus gambianus, Epomops dobsonii, Eptesicus serotinus, Glischropus aquilus, Hippo-
sideros lylei, Myotis altarium, Plecotus macrobullaris, Ptenochirus jagori, Rhinolophus ferrumequinum tragatus,
Scotonycteris bergmansi, Sphaerias blanfordi, Vampyressa pusilla) is disturbed most strongly by the attraction in
the direction of Horse {#32} (with average similarity to all organisms in the attractor equals to 0.002), Gray wolf
{#30} (0.002) and Chinese hare {#24} (0.002).
Orbit of Hippopotamus attractor (checked for exemplary hippopotamus: Hexaprotodon liberiensis, Hippo-
potamus amphibius) is disturbed most strongly by the attraction in the direction of Blue whale {#33} (0.006),
Brown bear {#29} (0.004) and Four-horned antelope {#36} (0.002).
Orbit of Sirenia attractor (checked for exemplary mantas: Dugong dugon, Hydrodamalis gigas, Trichechus
manatus) is disturbed most strongly by the attraction in the direction of African bush elephant {#31} (0.005)
and African lion {#28} (0.004).
Orbit of Rhinoceros attractor (checked for exemplary rhinoceros: Rhinoceros sondaicus, Rhinoceros unicornis)
is disturbed most strongly by the attraction in the direction of African bush elephant {#31} (0.005) and African
lion {#28} (0.004).
Orbit of Squirrel attractor (checked for exemplary squirrel: Sciurus aestuans, Sciurus lis, Sciurus niger, Sciurus
vulgaris) is disturbed most strongly by the attraction in the direction of Chinese hare {#24} (0.003).
Attractors during development of transformed cells. Cells after cancer transformation display a
series of paradoxes—in this view, there is a need for a more system-based framework to understand the complex
phenomena associated with the development of c ancer32. This section presents a new (based on the attractor
concept) system approach to the universal explanation of cancer transformation and cancer development. It
is known, that mitochondria play especially important role during the development of cancer that, in certain
cancer settings, can act as neoplastic drivers by generating high levels of oncometabolites that are able to change
the genomic and epigenomic landscape of the c ell33. Taking into account that the cancer genome can be con-
sidered as a complex network of mutually regulating genes, this network can lose stability and can also, under
certain conditions, produce hundreds of stable equilibrium states termed as a ttractors34–36. In this view, the new
universal model of cancer transformation and development has been established and schematically presented in
Fig. 7. This new model can be considered a significant extension, improvement and unification of the proposal
presented in37. There can be distinguished two types of attractors (i.e. cancer cell-fate attractors and genome
attractors) in accordance with this new model (Fig. 7).
In accordance with Fig. 7 two types of cancer development can be distinguished during cancer development,
i.e. the vertical and horizontal development of cancer. Vertical cancer development is based on step-by-step
changes of cell-fate attractors. Horizontal cancer development is based on step-by-step changes of genome
attractors. The vertical development always occurs during cancer development, while the horizontal develop-
ment of cancer is optional, i.e. it may or may not occur (additionally see schemas of cancer transformation and
development presented in Figs. 8, 9, 10, 11). This indicates that cancer development can occur as a clearly vertical
development (during which vertical development occurs only). Cancer development can also occur as a mix of
vertical development and horizontal development—during that type of development, horizontal development
is always followed by vertical development (see Figs. 10, 11).
Cancer cell‑fate attractors. Cancer development, presented in Fig. 7 as vertical (i.e. from top to down)
development, occurs through step-by-step changes of cell-fates by cancer clones. This type of cancer develop-
ment occurs without a change of genome attractor and can occur without DNA mutations (see Remark 3).
Remark 3 Vertical development of cancer is driven by ’non-genetic instability’, i.e. it is driven by instability of the
phenotype38. Vertical cancer development occurs as an adaptation of cell-fates to external (environment) factors.
It can also occur as an adaptation of cell-fates to internal factors, among others, random changes of genome
(but without occurrence of genome re-organization) by elevated level of ROS. That means that vertical cancer
development occurs without a change of genome attractor and can occur without DNA mutations (additionally
see schemas of cancer development (Figs. 10, 11)).
After destabilization of current cell-fate (i.e. destabilization of current gene expression program), the processes
of establishing new cell-fate (i.e. establishing new gene expression program) and its stabilization are activated39.
The process of cell-fate stabilization is schematically presented in Fig. 7 as auto-transformation to cell-fate attrac-
tor (i.e. establishing stable cell-fate means that cell-fate attains cell-fate attractor). From this point of view, cell-fate
attractor can be considered as a bioenergetic state toward which a running gene expression program (coded in
DNA) strives to attain stability. In view of unified cell bioenergetics (UCB), overenergization of mitochondria
is one of the reasons for cancer transformation and then cancer development (for details see37,40,41). Overen-
ergization can cause the switch of current cell-fate to cancerous/atavistic cell-fate37. The aim of the activation
of cancerous/atavistic cell-fate is to prevent overenergized mitochondria against an excessive amount of ROS
(additionally see Remark 4). The reversal of cancer cells towards early protists was suggested previously42–46 and
formulated by some authors as the atavistic theory of cancer47–53. Switching to cancerous cell-fate (i.e. cancer
transformation) causes, among others, activation of atavistic gene expression program and, as a result, cell
Scientific Reports | (2021) 11:9637 | https://doi.org/10.1038/s41598-021-89001-0 7
Vol.:(0123456789)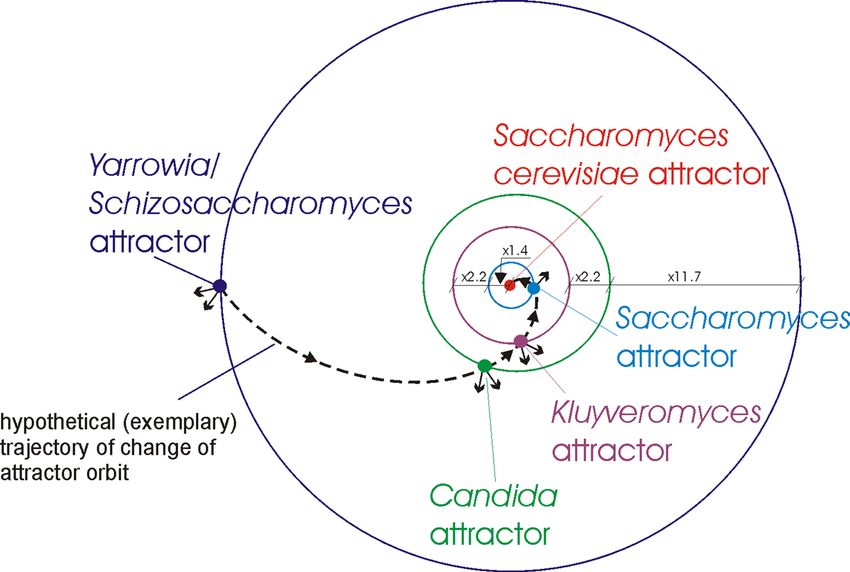
www.nature.com/scientificreports/
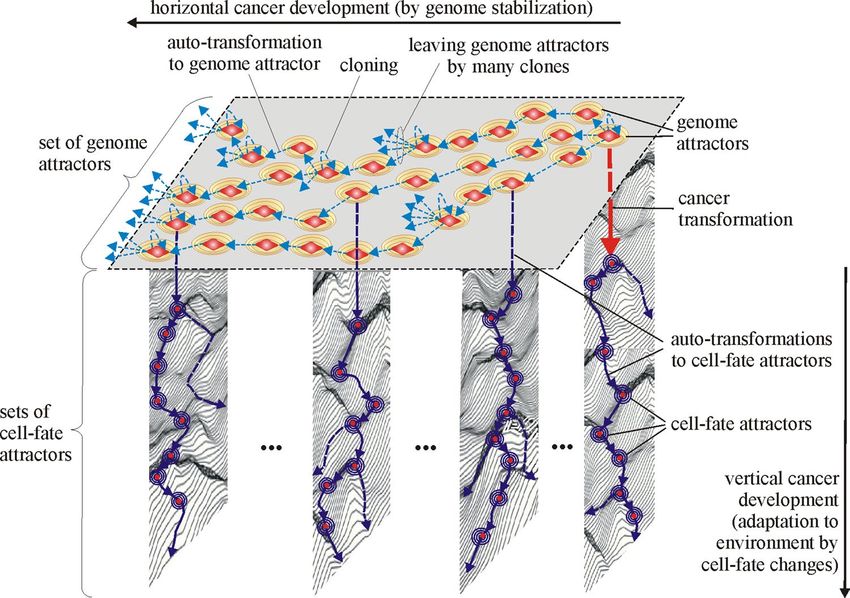
Figure 7. Horizontal and vertical cancer development in view of the new universal model of cancer
transformation and cancer development. Cancer transformation activates, among others, cloning which causes
that many clones can leave (because of occurrence of genome chaos) current genome attractor (GA) and
attain new/different genome attractors by auto-transformation to genome attractor. The clones are kept alive
after attaining new genome attractors by establishing appropriate new cell-fates. After attaining a new genome
attractor, random mutations caused by elevated ROS level can lead to: (a) genome chaos occurrence and a
change of genome attractor (macro-cellular evolution) or (b) destabilization of current cell-fate and a change of
cell-fate attractor (micro-cellular evolution). Note: micro-cellular evolution can also occur without mutations,
only as a result of cell-fate adaptation to changes in environment (vertical cancer development). It should be also
noted that the figure shows only example sets of cell-fate attractors (as well as the presentation of the cloning
process and leaving genome attractors by many clones are also limited to only a few cases) to ensure the clarity
of this figure. In accordance with schemas of cancer development (Figs. 10, 11), vertical development occurs,
among others, after each change of genome attractor.
Figure 8. Schema of cancer transformation.
disruption from the body, occurrence of the Warburg effect and emergence of the other cancer hallmarks that
include: sustained proliferative signaling, evasion of growth suppressors, resistance to cell death, enablement of
replicative immortality, energy metabolism list-reprogramming, evasion of immune destruction, inducement of
angiogenesis, and the activation of invasion and m etastasis54. Cancer development leads also to the outgrowth
of a clonally derived population of cancer cells. Moreover, tumors contain a repertoire of recruited cells that
contribute to the acquisition of the aforementioned hallmark traits by creating a ’tumor microenvironment’54.
Remark 4 In accordance with unified cell bioenergetics (UCB), a stimulation of aerobic fermentation can inhibit
mitochondrial NADH (mtNADH) increase and as a result inhibit ROS production. From this point of view,
Scientific Reports | (2021) 11:9637 | https://doi.org/10.1038/s41598-021-89001-0 8
Vol:.(1234567890)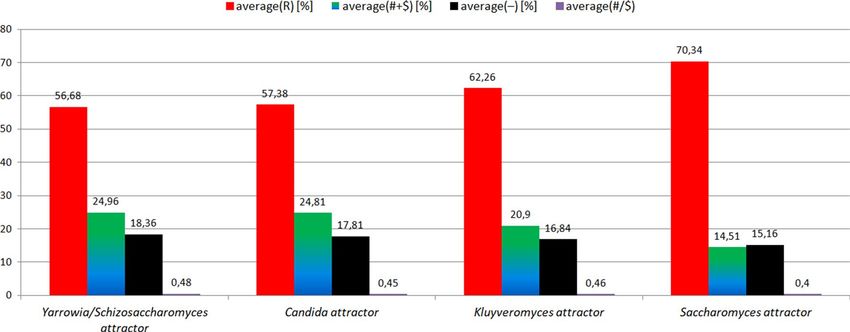
www.nature.com/scientificreports/

                                  Figure 9.  Block schema of cancer transformation.

                                  Figure 10.  Schema of cancer development.

Scientific Reports |   (2021) 11:9637 |               https://doi.org/10.1038/s41598-021-89001-0        9

                                                                                                   Vol.:(0123456789)
www.nature.com/scientificreports/
Figure 11. Block schema of cancer development.
the Warburg effect represents a cellular defense strategy that reduces the oxidative stress status of the c ells55.
According to current observations, the Warburg effect occurs even in the presence of completely functioning
mitochondria and the glycolytic contribution to total ATP production does not generally exceed 50–60%56,57. For
this reason OXPHOS (i.e. oxidative phosphorylation) substantially contributes to ATP production after cancer
transformation58. This phenomenon allows maintenance of charging mitochondria with NADH in many cancer
cell types. Moreover, gaining energy through highly intensive aerobic glycolysis that occurs after cancer trans-
formation can additionally inhibit overenergized mitochondria discharge. As a result ROS levels are increased
ndings59.
in many types of cancer cells, that is consistent with other research fi
As an example of cancer development through changes of cell-fate attractors can be given development
which occurs after stimulation (being trapped in genome attractor) of the MCF-7 breast-cancer cell line by HRG
(heregulin)39. It is known that HRG-stimulation induces cell d ifferentiation60. HRG activates the ErbB recep-
tor with sustained extracellular signal regulated kinase (ERK) activity. As a result, after stimulation of MCF-7
breast-cancer cells by HRG, the destabilization of current cell-fate occurs, what induces the cells leave current
cell-fate attractor to be trapped in another cell-fate attractor with stabilization of new cell-fate as an outcome39.
This type of cancer development can be considered as an adaptation (by cell-fate changes) to changes in the
Scientific Reports | (2021) 11:9637 | https://doi.org/10.1038/s41598-021-89001-0 10
Vol:.(1234567890)www.nature.com/scientificreports/
environment. From Fig. 7 it is visible that a lot of different, stable phenotypes can be obtained for each genotype.
This hallmark of the way cancer develops can be described as one-genotype-many-phenotypes, with a paradigm
of 1:n mapping. The ability of the regulatory control structures of a system to produce more than one stable
system state is called multi-stability38.
Cancer genome attractors. Cancer development, presented in Fig. 7 as horizontal (i.e. from right to left)
development, is based on step-by-step changes of genome attractors by cancer clones. This type of cancer devel-
opment is optional (it may or may not occur). Occurrence of this type of development can be considered as a
supporting (important) component of the development of some cancers leading to, among others, polyploidy
and aneuploidy. Horizontal cancer development is associated with genome re-organization and is driven by
genome instability (GIN). In accordance with unified cell bioenergetics (UCB), cancerous mitochondria gen-
erate an excessive amount of reactive oxygen species (ROS) (for details see37,40,41). Thus, cancer cells exhibit
increased levels of ROS compared to normal cells. High level of ROS causes an increase of the number of ran-
dom DNA mutations61. As a result, the probability of changes (by these mutations) of DNA fragments that code
the mechanisms responsible for monitoring the integrity of the genome increases61. A defect in the regulation
of these mechanisms can result in GIN. GIN includes chromosome instability (CIN), chromosome structure
instability (CSI), microsatellite instability (MSI) and small structure variations62,63. GIN and tumor promoting
inflammation are among the hallmarks of c ancer54,64–67. Aneuploidy (i.e. abnormal numbers of chromosomes
that arise through CIN by the persistent loss and gain of whole chromosomes) and chromosome large-scale
structural rearrangements (induced by CSI as a consequence of improper repair of DNA damage) are other
important features of cancer c ells62. Both CIN and CSI are associated with advanced stages of cancer develop-
ment (characterized by, among others, increased resistance to chemotherapy and invasiveness)62. The chromo-
somal changes induced by CIN and CSI provide the driving mechanism that allows cancer cells to sample the
genomic landscape62. The aim of the sampling is to find an aneuploid karyotype that may be transformative or
best suited for growth in stressful e nvironments62. This sampling is supported by the cloning mechanism. It
should be noted that cancer are clonal for aneuploidy above a threshold68. Aneuploidy is a ubiquitous feature of
cancer69. Generally, aneuploidy can be described as numerical or structural, depending on whether whole chro-
mosomes or portions of chromosomes are gained or lost. Both of these are distinct from polyploidy, in which
cells contain more than two complete sets of chromosomes, but always contain an exact multiple of the hap-
loid number, so the chromosomes remain balanced70. Aneuploidy and polyploidy occur frequently in tumors70.
Polyploid cells are known to display greater capacity for adaptation to environmental challenge comparing to
their diploid counterparts47. GIN leads to occurrence of genome chaos71. Genome chaos is a process of com-
plex, rapid genome re-organization that results in the formation of unstable genomes, which is followed by the
potential to establish stable genomes72. The process of genome stabilization is schematically presented in Fig. 7
as auto-transformation to genome attractor. Establishing a stable genome means that the cell has been trapped
in genome attractor. From this point of view, the cancer genome attractor can be considered as a physical state
in which a genome attains stability. Occurrence of genome chaos and then genome stabilization cause the emer-
gence of a re-organized genome, i.e. it can be said that a modified organism of the same type is emerging. This
modified organism is then kept alive by establishing new cell-fate (i.e. horizontal cancer development is followed
by vertical cancer development) that allows it to stay alive.
In view of presented information, schema and block schema of cancer transformation can be depicted as
shown in Figs. 8 and 9.
Schema and block schema of cancer development can be depicted as shown in Figs. 10 and 11.
The schemas presented in Figs. 8, 9, 10, 11 along with Fig. 7 explain known controversies related to the
development of cancer 68:
(i) many carcinogens do not mutate genes;
(ii) there is no functional proof that mutant genes cause cancer;
(iii) mutation is fast but carcinogenesis is exceedingly slow.
In accordance with the presented schemas, cancer transformation (Figs. 8, 9) and development (Figs. 10, 11)
can occur without mutations, only as a result of subsequent cell-fate destabilizations (issues (i) and (ii)). It should
be added that cancer transformation and then development can also occur as a result of random mutations chang-
ing DNA fragments which code mechanisms responsible for monitoring the integrity of the genome, leading to
GIN and consequently to genome chaos (with genome re-organization) followed by a change of genome attractor
(see the “Cancer genome attractors” section). After cancer transformation, cancer development can also occur
both as horizontal cancer development (as a result of subsequent genome destabilizations) followed by vertical
cancer development (as a result of subsequent cell-fate destabilizations) (Figs. 7, 10, 11). After destabilization of
current cell-fate of normal cell as a result of fast occurring mutations, the cells can undergo cancer transforma-
tion and as a result attain cancerous/atavistic cell-fate with a very small probability (Figs. 8, 9), for this reason
cancer transformation requires a long time (issue (iii)).
Conclusions
This work presents new approaches to the separation of organisms into groups that represent attractors (i.e. arti-
ficial neural network, semihomologous Dot-Matrix method and unified cell bioenergetics concept). The carried
out analyzes point out that pattern recognition by neural network allows for very effective and clear organism
separation (see Remark 2). Semihomologous Dot-Matrix method confirms the results and is a good method for
detailed attractor analyzes. Analysis of the development of normal exemplary organisms (i.e. human and yeasts)
points out that the organisms get trapped in the local attractors during evolution (Figs. 1, 4). Because the ROS
Scientific Reports | (2021) 11:9637 | https://doi.org/10.1038/s41598-021-89001-0 11
Vol.:(0123456789)www.nature.com/scientificreports/
level in normal cells is moderate, for this reason ROS can stimulate living processes without a big impact on
changes of genome attractors. Comparing to attractors of normal cells, cancer attractors are very unstable. In
accordance with the proposed new universal model, cancer transformation and then development, can occur
without genome re-organization (vertical development in Fig. 7), i.e. step-by-step cancer development, from
one cell-fate attractor to the next cell-fate attractor (see Figs. 8, 9, 10, 11 and Remark 3). However, a higher level
of ROS in cancer cells (see Remark 4) can also lead to repeated occurrences of genome chaos, and, as a result,
permanent changes of genome attractors during cancer development, leading to instability of current gene
expressions and (as a result) changes and stabilization of new cell-fates. When viewed from outside, there can
be an impression that cancer cells want to escape from the internal ROS flame through permanent changes of
genome attractors followed by an adaptation of gene expression to re-organized genome by attaining new cell-
fate attractors. In sum, considering this case, cancer transformation and then development can also occur as
a result of genome re-organizations (horizontal development in Fig. 7), i.e. step-by-step cancer development,
from one genome attractor to the next genome attractor followed by vertical development (see Figs. 8, 9, 10, 11).
Data availability
Cytochrome b amino-acid sequences selected for this study were taken from the protein databases NCBI and
Protein BLAST. All data generated or analyzed during this study are included in this article.
Code availability
All calculations presented in this article have been made using the written by the authors EvolutionXXI and
dotPicker programs (freely available at https://github.com/biopgms/bioattr). The EvolutionXXI program has
been written in Java using the Joone framework. This program contains an implemented neural network. The
EvolutionXXI program can be run on any platform with installed Java Virtual Machine (JVM). The dotPicker
program has been written in C#. This program contains implemented multidimensional semihomologous Dot-
Matrix method. The dotPicker program can be run on Windows with installed .NET Framework.
Received: 19 February 2021; Accepted: 19 April 2021
References
1. Harvey, P. H. & Pagel, M. D. The Comparative Method in Evolutionary Biology Vol. 239 (Oxford University Press, 1991).
2. Damasco, A. & Giuliani, A. A resonance based model of biological evolution. Phys. A 471, 750–756 (2017).
3. Lewin, R. Complexity: Life at the Edge of Chaos (Collier Books, 1993).
4. Meyer, A. Evolution of mitochondrial DNA in fishes. In Biochemistry and Molecular Biology of Fishes Vol. 2 (ed. Hochachka, M.)
1–38 (Elsevier, 1993).
5. Rocha-Olivares, A., Rosenblatt, R. H. & Vetter, R. D. Molecular evolution, systematics, and zoogeography of the rockfish subgenus
Sebastomus (Sebastes, Scorpaenidae) based on mitochondrial cytochrome b and control region sequences. Mol. Phylogenet. Evol.
11(3), 441–458 (1999).
6. Lovejoy, N. R. & de Araújo, M. L. Molecular systematics, biogeography, and population structure of Neotropical freshwater
needlefishes of the genus Potamorrhaphis. Mol. Ecol. 9(3), 259–268 (2000).
7. Tsigenopoulos, C. S. & Berrebi, P. Molecular phylogeny of North Mediterranean freshwater barbs (genus Barbus: Cyprinidae)
inferred from cytochrome b sequences: Biogeographic and systematic implications. Mol. Phylogenet. Evol. 14(2), 165–179 (2000).
8. Esposti, D. M. et al. Mitochondrial cytochrome b: Evolution and structure of the protein. Biochim. Biophys. Acta. 1143, 243–271
(1993).
9. Farias, I. P., Ortı, G., Sampaio, I., Schneider, H. & Meyer, A. The Cytochrome b gene as a phylogenetic marker: The limits of resolu-
tion for analyzing relationships among cichlid fishes. J. Mol. Evol. 53, 89–103 (2001).
10. Mindell, D. P. & Honeycutt, R. L. Ribosomal RNA in vertebrates: evolution and phylogenetic applications. Annu. Rev. Ecol. Evol.
Syst. 21, 541–566 (1990).
11. Zardoya, R. & Meyer, A. Evolutionary relationships of the coelacanth, lungfishes, and tetrapods based on the 28S ribosomal RNA
gene. Proc. Natl. Acad. Sci. USA 93, 5449–5454 (1996).
12. Van de Peer, Y. & De Wachter, R. Evolutionary relationships among the eukaryotic crown taxa taking into account site-to-site rate
variation in 18S rRNA. J. Mol. Evol. 45, 619–630 (1997).
13. Abouheif, E., Zardoya, R. & Meyer, A. Limitations of metazoan 18S rRNA sequence data: Implications for reconstructing a phy-
logeny of the animal kingdom and inferring the reality of the Cambrian explosion. J. Mol. Evol. 47, 394–405 (1998).
14. Naylor, G. J. P. & Brown, W. M. Amphioxus mitochondrial DNA, chordate phylogeny, and the limits of inference based on com-
parisons of sequences. Syst. Biol. 47(1), 61–76 (1998).
15. Zardoya, R., Cao, Y., Hasegawa, M. & Meyer, A. Searching for the closest living relative(s) of tetrapods through evolutionary
analyses of mitochondrial and nuclear data. Mol. Biol. Evol. 15(5), 506–517 (1998).
16. Tobe, S. S., Kitchener, A. C. & Linacre, A. M. T. Reconstructing mammalian phylogenies: A detailed comparison of the cytochrome
b and cytochrome oxidase subunit i mitochondrial genes. PLoS ONE 5(11), e14156 (2010).
17. Castresana, J. Cytochrome b phylogeny and the taxonomy of great apes andmammals. Mol. Biol. Evol. 18(4), 465–471 (2001).
18. Kasperski, A. & Kasperska, R. A new approach to the automatic identification of organism evolution using neural networks.
BioSystems 142–143, 32–42 (2016).
19. Hsieh, H. M. et al. Cytochrome b gene for species identification of the conservation animals. Forensic Sci. Int. 122(1), 7–18 (2001).
20. Kumar, S., Stecher, G. & Tamura, K. MEGA7: molecular evolutionary genetics analysis version 7.0 for bigger datasets. Mol. Biol.
Evol. 33(7), 1870–1874 (2016).
21. Heng, H. H. et al. Stochastic cancer progression driven by non-clonal chromosome aberrations. J. Cell. Physiol. 208, 461–472
(2006).
22. Heng, H. H. et al. Cancer progression by non-clonal chromosome aberrations. J. Cell. Biochem. 98, 1424–1435 (2006).
23. Leluk, J. A non-statistical approach to protein mutational variability. BioSystems 56, 83–93 (2000).
24. Leluk, J. Regularities in mutational variability in selected protein families and the Markovian model of amino-acid replacement.
J. Comput. Chem. 24, 659–672 (2000).
25. Leluk, J., Konieczny, L. & Roterman, I. Search for structural similarity in proteins. Bioinformatics 19, 117–124 (2003).
26. Kasperski, A. & Kasperska, R. A novel method of sequence similarity evaluation in n-dimensional sequence space. Curr. Bioinform.
7(3), 295–303 (2012).
Scientific Reports | (2021) 11:9637 | https://doi.org/10.1038/s41598-021-89001-0 12
Vol:.(1234567890)www.nature.com/scientificreports/
27. Kasperski, A. & Kasperska, R. Identification of protein family representatives. Curr. Bioinform. 9(4), 414–425 (2014).
28. Ye, C. J., Regan, S., Liu, G., Alemara, S. & Heng, H. H. Understanding aneuploidy in cancer through the lens of system inheritance,
fuzzy inheritance and emergence of new genome systems. Mol. Cytogenet. 11, 31 (2018).
29. Heng, H. H. Genome Chaos: Rethinking Genetics, Evolution, and Molecular Medicine. (Academic Press Elsevier, 2019). ISBN 978-
012-8136-35-5 (2019).
30. Heaton, J. Introduction to Neural Networks with Java, 1st Edition, Paperback (2005).
31. Masters, T. Practical Neural Network Recipies in C++. (Academic Press, 1993).
32. Erenpreisa, J., Salmina, K., Anatskaya, O. & Cragg, M. S. Paradoxes of cancer: survival at the brink. Semin. Cancer Biol. https://
doi.org/10.1016/j.semcancer.2020.12.009 (2020).
33. Cannino, G., Ciscato, F., Masgras, I., Sánchez-Martín, C. & Rasola, A. Metabolic plasticity of tumor cell mitochondria. Front. Oncol.
8, 333. https://doi.org/10.3389/fonc.2018.00333 (2018).
34. Kauffman, S. Homeostasis and differentiation in random genetic control networks. Nature 224, 177–178 (1969).
35. Kauffman, S. A. Metabolic stability and epigenesis in randomly constructed genetic nets. J. Theor. Biol. 22, 437–467 (1969).
36. Greaves, M. & Maley, C. C. Clonal evolution in cancer. Nature 481(7381), 306–313 (2012).
37. Kasperski, A. & Kasperska, R. Bioenergetics of life, disease and death phenomena. Theor. Biosci. 137(2), 155–168 (2018).
38. Huang, S. Genetic and non-genetic instability in tumor progression: Link between the fitness landscape and the epigenetic land-
scape of cancer cells. Cancer Metast. Rev. 32(3–4), 423–448 (2013).
39. Zimatore, G., Tsuchiya, M., Hashimoto, M., Kasperski, A. & Giuliani, A. Self-organization of whole gene expression through
coordinated chromatin structural transition: Validation of self-organized critical control of genome expression. https://doi.org/
10.1101/852681 (2019).
40. Kasperski, A. Modelling of cells bioenergetics. Acta Biotheor. 56, 233–247 (2008).
41. Kasperski, A. & Kasperska, R. Selected disease fundamentals based on the unified cell bioenergetics. J. Invest. Biochem. 2(2), 93–100
(2013).
42. Erenpreisa, J., Kalejs, M. & Cragg, M. S. Mitotic catastrophe and endomitosis in tumour cells: An evolutionary key to a molecular
solution. Cell Biol. Int. 29(12), 1012–1018 (2005).
43. Erenpreisa, J. & Wheatley, D. Endopolyploidy in development and cancer; “survival of the fattest?”. Cell Biol. Int. 29(12), 981–982
(2005).
44. Erenpreisa, J. & Cragg, M. S. Life-cycle features of tumour cells. In Evolutionary Biology from Concept to Application (ed. Pontarotti,
P.) 61–71 (Springer, 2008).
45. Erenpreisa, J. & Cragg, M. S. Three steps to the immortality of cancer cells: senescence, polyploidy and self-renewal. Cancer Cell
Int. 13(1), 92 (2013).
46. Niculescu, V. F. Developmental and non developmental polyploidy in xenic and axenic cultured stem cell lines of Entamoeba
invadens and E. histolytica. Insights Stem Cells 2(1), 1–9 (2016).
47. Erenpreisa, J. et al. Stress-induced polyploidy shifts somatic cells towards a pro-tumourogenic unicellular gene transcription
network. Cancer Hypotheses 1(1), 1–20 (2018).
48. Arguello, F. Atavistic Metamorphosis: A new and logical explanation for the origin and biological nature of cancer: With a discus-
sion on a novel approach to treat cancer. (Samozal, 2011). ISBN-13: 978-1460968994 (2011).
49. Davies, P. C. W. & Lineweaver, C. H. Cancer tumors as Metazoa 1.0: tapping genes of ancient ancestors. Phys. Biol. 8(1), 15001
(2011).
50. Vincent, M. D. Cancer: Beyond speciation. Adv. Cancer Res. 112, 283–350 (2011).
51. Vincent, M. D. Cancer: A de-repression of a default survival program common to all cells?. BioEssays 34(1), 72–82 (2012).
52. Davies, P. Exposing cancer’s deep evolutionary roots. Phys. World 26(7), 37–40 (2013).
53. Lineweaver, C. H., Davies, P. C. W. & Vincent, M. D. Targeting cancer’s weaknesses (not its strengths): Therapeutic strategies sug-
gested by the atavistic model. BioEssays 36(9), 827–835 (2014).
54. Hanahan, D. & Weinberg, R. A. Hallmarks of cancer: The next generation. Cell 144(5), 646–674 (2011).
55. Alfarouk, K. O. et al. Glycolysis, tumor metabolism, cancer growth and dissemination: A new pH-based etiopathogenic perspective
and therapeutic approach to an old cancer question. Oncoscience 1(12), 777–802 (2014).
56. Zu, X. L. & Guppy, M. Cancer metabolism: Facts, fantasy, and fiction. Biochem. Biophys. Res. Commun. 313, 459–465 (2004).
57. Liberti, M. V. & Locasale, J. W. The Warburg effect: How does it benefit cancer cells?. Trends Biochem. Sci. 41(3), 211–218 (2016).
58. Zheng, J. Energy metabolism of cancer: Glycolysis versus oxidative phosphorylation (Review). Oncol. Lett. 4, 1151–1157 (2012).
59. Zhang, B. B., Wang, D. G., Guo, F. F. & Xuan, C. Mitochondrial membrane potential and reactive oxygen species in cancer stem
cells. Fam. Cancer. 14(1), 19–23 (2015).
60. Nagashima, T. et al. Quantitative transcriptional control of ErbB receptor signaling undergoes graded to biphasic response for cell
differentiation. J. Biol. Chem. 282, 4045–4056 (2007).
61. Liou, G. Y. & Storz, P. Reactive oxygen species in cancer. Free Radic. Res. 44(5), 479–496 (2010).
62. Thompson, S. L. & Compton, D. A. Chromosomes and cancer cells. Chromosome Res. 19(3), 433–444 (2011).
63. Yao, Y. & Dai, W. Genomic instability and cancer. J. Carcinog. & Mutagen. 5, 1000165. https://doi.org/10.4172/2157-2518.10001
65 (2014).
64. Zetter, B. R. Angiogenesis and tumor metastasis. Annu. Rev. Med. 49, 407–424 (1998).
65. Heng, H. H. et al. Chromosomal instability (CIN): What it is and why it is crucial to cancer evolution. Cancer Metastasis Rev.
32(3–4), 325–340 (2013).
66. Baker, S. G. A cancer theory kerfuffle can lead to new lines of research. J. Natl. Cancer Inst. 107(2), 1–8 (2015).
67. Goodson, W. H. 3rd. et al. Assessing the carcinogenic potential of low-dose exposures to chemical mixtures in the environment:
The challenge ahead. Carcinogenesis 36, S254-296 (2015).
68. Duesberg, P. & Rasnick, D. Aneuploidy, the somatic mutation that makes cancer a species of its own. Cell Motil Cytoskeleton. 47,
81–107 (2000).
69. Merlo, L. M., Wang, L., Pepper, J. W., Rabinovitch, P. S. & Maley, C. C. Polyploidy, aneuploidy and the evolution of cancer. Adv.
Exp. Med. Biol. https://doi.org/10.1007/978-1-4419-6199-0_1 (2010).
70. Zasadil, L. M., Britigan, E. M. C. & Weaver, B. A. 2n or not 2n: Aneuploidy, polyploidy and chromosomal instability in primary
and tumor cells. Semin. Cell Dev. Biol. 24(4), 370–379. https://doi.org/10.1016/j.semcdb.2013.02.001 (2013).
71. Ye, C. J., Sharpe, Z. & Heng, H. H. Origins and consequences of chromosomal instability: From cellular adaptation to genome
chaos-mediated system survival. Genes 11, 1162. https://doi.org/10.3390/genes11101162 (2020).
72. Liu, G. et al. Genome chaos: Survival strategy during crisis. Cell Cycle 13(4), 528–537. https://doi.org/10.4161/cc.27378 (2014).
Author contributions
A.K. conceptualization, ideas, methodology, theoretical basis, interpretations, literature review, and writing
of the article; R.K. contributed the drawing figures, analysis and discussion of presented solutions and article
proofreading. All authors reviewed the manuscript.
Scientific Reports | (2021) 11:9637 | https://doi.org/10.1038/s41598-021-89001-0 13
Vol.:(0123456789)You can also read