Modelling the productivity of Siberian larch forests from Landsat NDVI time series in fragmented forest stands of the Mongolian forest steppe
←
→
Page content transcription
If your browser does not render page correctly, please read the page content below
Environ Monit Assess (2021) 193:200
https://doi.org/10.1007/s10661-021-08996-1

Modelling the productivity of Siberian larch forests
from Landsat NDVI time series in fragmented forest stands
of the Mongolian forest‑steppe
Stefan Erasmi · Michael Klinge ·
Choimaa Dulamsuren · Florian Schneider ·
Markus Hauck

Received: 27 November 2020 / Accepted: 4 March 2021
© The Author(s) 2021

Abstract The monitoring of the spatial and tempo- season NDVI of forest sites and tree ring width over
ral dynamics of vegetation productivity is important in an observation period of 20 years. This relationship
the context of carbon sequestration by terrestrial eco- was independent of the forest stand size and of the
systems from the atmosphere. The accessibility of the landscape’s forest-to-grassland ratio. We conclude
full archive of medium-resolution earth observation from the consistent findings of our case study that
data for multiple decades dramatically improved the the maximum growing season NDVI can be used for
potential of remote sensing to support global climate retrospective modelling of forest productivity over
change and terrestrial carbon cycle studies. We inves- larger areas. The usefulness of grassland NDVI as a
tigated a dense time series of multi-sensor Landsat proxy for forest NDVI to monitor forest productivity
Normalized Difference Vegetation Index (NDVI) data in semi-arid areas could only partially be confirmed.
at the southern fringe of the boreal forests in the Mon- Spatial and temporal inconsistencies between forest
golian forest-steppe with regard to the ability to cap- and grassland NDVI are a consequence of different
ture the annual variability in radial stemwood incre- physiological and ecological vegetation properties.
ment and thus forest productivity. Forest productivity Due to coarse spatial resolution of available satellite
was assessed from dendrochronological series of Sibe- data, previous studies were not able to account for
rian larch (Larix sibirica) from 15 plots in forest patches small-scaled land-cover patches like fragmented forest
of different ages and stand sizes. The results revealed in the forest-steppe. Landsat satellite-time series were
a strong correlation between the maximum growing able to separate those effects and thus may contribute
 to a better understanding of the impact of global cli-
 mate change on natural ecosystems.
S. Erasmi
Thuenen Institute of Farm Economics, Bundesallee 63,
 Keywords Forest-steppe · NDVI · Tree
38116 Braunschweig, Germany
 productivity · Tree ring · Remote sensing ·
M. Klinge (*) · F. Schneider Dendrochronology
Department of Physical Geography, Institute
of Geography, University of Goettingen,
Goldschmidtstraße 5, 37077 Goettingen, Germany
e-mail: mklinge1@uni-goettingen.de Introduction

C. Dulamsuren · M. Hauck Terrestrial carbon of aboveground biomass plays
Applied Vegetation Ecology, Faculty of Environment
 a major role in the global carbon cycle. Knowl-
and Natural Resources, University of Freiburg,
Tennenbacher Str. 4, 79106 Freiburg, Germany edge about productivity and spatial distribution of

 Vol.:(0123456789)
 13
200 Page 2 of 18 Environ Monit Assess (2021) 193:200

aboveground carbon stocks in forests is essential is calculated as the ratio between the difference and
for global biogeochemical scenarios and model- the sum of the spectral reflectance in the red and near-
ling (Goodale et al., 2002; Pan et al., 2011). Assess- infrared region (Rouse et al., 1974).
ing the spatial and temporal variability of vegetation Combining temporal series of ground-measured
productivity remains a challenge and is a function tree-ring and remote-sensing data enables the gen-
of numerous environmental factors. Changing cli- eration of a data pool for the assessment of the spa-
mate is assumed to have a considerable impact on tial and temporal variability in forest productivity
vegetation growth and hence, tree productivity, for the last four decades since operational satellite
especially in areas that are considered as hotspots of earth observations became available. Several stud-
global climate change, like the eastern part of Cen- ies exist that have demonstrated the potential of sat-
tral Asia (Turco et al., 2015). Direct measurements ellite remote sensing time series for tree productiv-
of tree productivity on historical scales are available ity monitoring. Bunn et al. (2013) used time series
from dendrochronological studies that use the annual of bi-weekly NDVI data for the estimation of tree
radial stem increment (tree ring width; TRW) as a growth and revealed best correlations for July NDVI
measure of tree growth and thus are able to produce data together with the first principal component of
time series of ecosystem productivity. Depending tree-ring data from different sites of the Siberian
on the climatic conditions, annual stem increment taiga. Comparable results were reported from juni-
in boreal of forest can either be limited by low tem- per woodlands of the Tibetan Plateau by He and
peratures or drought during the growing season (Beck Shao (2006) who also used the first principal com-
et al., 2011; Hauck et al., 2019; Zhou et al., 2020). ponent of the tree-ring data together with NDVI time
As the result of climate warming, boreal forests are series. Kaufmann et al. (2004) and Xu et al. (2019)
increasingly switching from temperature-limited to underlined the importance of the summer greenness
drought-limited ecosystems (D’Arrigo et al., 2004; of the canopy (June/July) for the prediction of TRW.
Buermann et al., 2014). Especially the forest-steppe D’Arrigo et al. (2000) and Wang et al. (2004) also
related to the semi-arid regions of Central Asia is highlighted the potential of satellite-time series for
more and more subjected to forest disturbance by fire the prediction of forest productivity. However, not
and windthrow (Nyamjav et al., 2007). These forests all studies confirmed a general positive relationship
often show decreases in productivity (Dulamsuren between dendrochronological sampling and annual
et al., 2010, 2013). or seasonal NDVI composites. A recent study by
 Tree ring studies can cover centuries but only Brehaut and Danby pointed out that relations are
deliver local information. The uneven and sparse dis- inconsistent and might be a function of forest type
tribution of available tree ring information cannot rep- and also be affected by climatic variables (Brehaut &
resent larger areas. By contrast, remote sensing data Danby, 2018).
are able to monitor and quantify ecological parame- All mentioned studies have in common that they
ters that affect plant productivity over large areas. The were based on data from coarse spatial resolution sen-
basic concept relies on the establishment of relations sors (e.g. AVHRR, MODIS) and cannot account for
between the absorbed and reflected solar radiation in small-scaled land-cover patches and landscape het-
the visible and near infrared (VNIR) spectrum and erogeneity. Due to this limitation in resolution and the
the specific index of plant productivity in question, highly fragmented forests in Central Asia, some stud-
such as tree ring increment (Eitel et al., 2020). The ies used NDVI time series over larger grassland areas
vast majority of such studies use regression analyses as a proxy for forest productivity (He & Shao, 2006).
to parameterize the relationship between the target Only few and recent studies made use of the poten-
variable and the remote sensing observations (Lu tial of higher spatial resolution time series available
et al., 2015; Powell et al., 2010; Rodríguez-Veiga from the Landsat missions for mapping spatial and
et al., 2019). In most cases, when long time series of temporal variations in forest productivity (Liu, 2016).
satellite data are investigated, the Normalized Dif- Coops et al. (1999) was the first to evaluate the poten-
ference Vegetation Index (NDVI) serves as a proxy tial of annual Landsat data stacks for the estimation of
variable (Eckert et al., 2015; Fensholt & Proud, 2012; the annual increment of forest-stand volume. Powell
Ivanova et al., 2021; Testa et al., 2018). The NDVI et al. (2010) compared different regression techniques

13
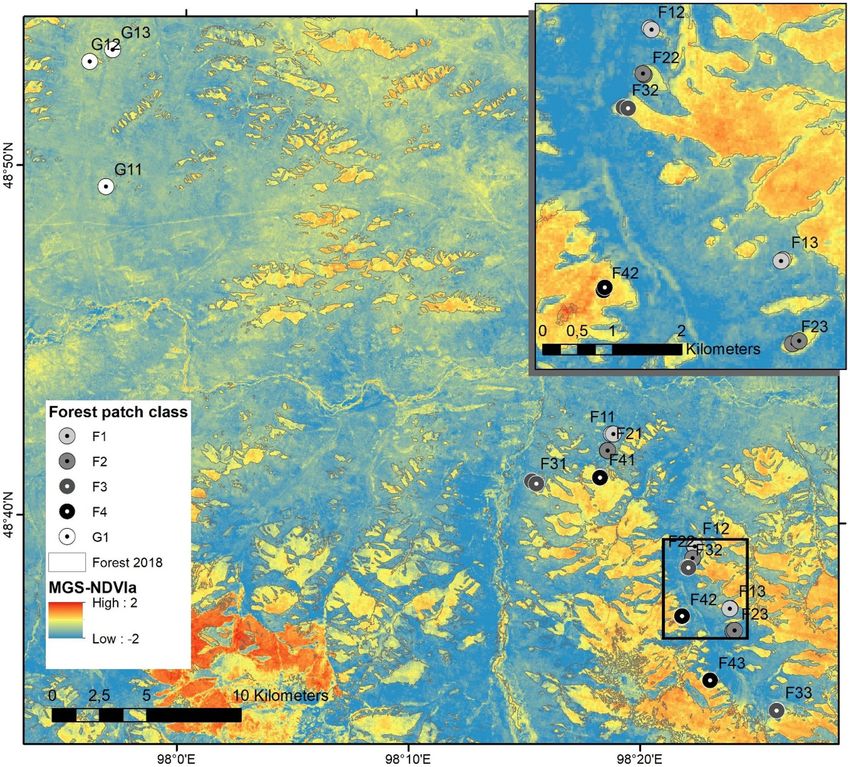
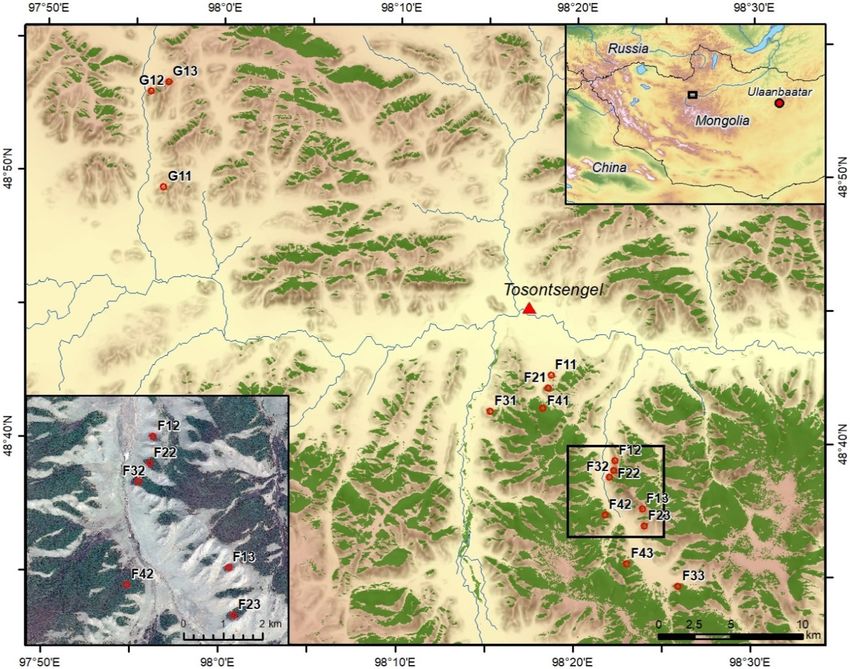
Environ Monit Assess (2021) 193:200 Page 3 of 18 200

to estimate biomass from time series of Landsat data. it was tested, if steppe-grassland areas surrounding
Main-Knorn et al. (2013) and Thomas et al. (2011) the forest stands can serve as a proxy for the moni-
monitored forest disturbance and regrowth patterns toring of tree growth when the resolution of the sat-
from biennial time series stacks. The only study that ellite data and the size of the forest patches is not
used a multi-year series of Landsat for the estimation large enough for the analysis of homogeneous areas.
of tree ring width so far was published by Sangüesa-
Barreda et al. (2014). They used single Landsat-5
images for 15 irregularly distributed years within a Material and methods
25-year span to monitor the consequences of insect
outbreaks on the annual increment of the stand basal The study area is located at the northern slope of the
area in Mediterranean pine forests. A major issue Khangai Mountains near the city of Tosontsengel in
with such approaches is the proper determination of central Mongolia (98°16′E/48°46′N) about 600 km to
a consistent time of the year when dealing with long the west of Ulan Bator (Fig. 1). The high continental
annual time series. All known studies that are related climate of the region is reflected by cold and semi-
to predicting forest productivity from Landsat time arid conditions. The monthly mean temperatures
series only manually selected the optimal annual at Tosontsengel range between − 31.7 °C in Janu-
acquisition based on quality criteria (cloud coverage, ary and 14.7 °C in July (National Agency for Mete-
peak of growing season) and only made use of a sin- orology and Environment Monitoring of Mongolia,
gle sensor. Ulan Bator). The main precipitation occurs during
 In the present study, we investigated the applica- the summer season and is related to the circulation
bility of Landsat-based growing season NDVI time of the westerlies (Batima et al., 2005). Summer pre-
series as a proxy of TRW of Siberian larch (Larix cipitation is subject to high inter-annual variations
sibirica) at the southern border of the boreal for- (Fig. 2), making the area vulnerable to droughts. In
ests in Mongolia. Landsat data covered a range of contrast, the Siberian High during the winter season
32 years from 1986 to 2017. In addition to exist- produces mostly dry conditions. The area is part of
ing studies, we used data from a full dense Landsat the southern boreal forests of Mongolia with altitudes
time series (LTS) of all available acquisitions from ranging from 1600 to 2500 m a.s.l. Forest stands are
the Landsat-sensors Landsat-5/TM, Landsat-7/ strongly dominated by Siberian larch (Larix sibirica)
ETM+, and Landsat-8/OLI. We computed annual- and occur mainly on northern slopes whereas grass-
monthly metrics of NDVI data for the growing sea- land steppe is found on the southern slopes (Hilbig,
son over all sensors as a proxy for tree productiv- 1995; Treter, 1996). The major factors limiting tree
ity. Besides the evaluation of the technical potential growth are the shortage of precipitation (< 300 mm/a)
of the LTS, the central hypothesis of the study was together with high evapotranspiration as a function of
that vegetation greenness is a function of tree ring incoming solar radiation and terrain parameters (Hais
width, and hence, NDVI LTS are able to capture et al., 2016; Schlütz et al., 2008). Forest stands in the
temporal anomalies and trends in forest productivity study area show considerable impact from industrial
due to climate variations. Based on the findings of timber harvest activities in the second half of the
Khansaritoreh et al. (2017) that the forest-steppe twentieth century until 1990. After the end of the
occurs in a dominantly drought-limited environment, socialistic period in Mongolia, activities changed to
our main hypothesis referred to the general assump- predominantly unsystematic selective logging by the
tion that long time series of high-resolution satellite rural population (Nyamjav et al., 2007). Today, the
data indicate the temporal variations in vegetation forest-steppe area is home to mobile pastoralists, who
greenness that are related to climate variations. Fur- keep mixed herds of sheep, goats, cattle, yak, and
thermore, we postulated that the spatial patterns of horses on common pastures. Livestock is not much
those trends are related to forest fragmentation, i.e. herded and animals preferentially graze on grassland,
that the reduction of forest areas (i.e. the forest-to- but also move into the forests along the edges and fur-
grassland ratio) has an impact on the vulnerability to ther into the interior, when the forest islands are small
climate variations and thus tree productivity. Further, (Lkhagvadorj et al., 2013).

 13
200 Page 4 of 18 Environ Monit Assess (2021) 193:200 Fig. 1 Study area near Tosontsengel, Mongolia with clusters defines the patch size class, whereas the second digit num- of forest stands of different size (increasing from F1/G1 to F4) bers the replica. The small rectangle in the overview map (top in subregions with high (F1–F4, south-eastern part of the study right) shows the location of the study area (main map). The area) or low (G1, north-western part) forest-to-grassland ratio. rectangle in the main map shows the position of the detailed The red points indicate the plot positions and the first digit map (bottom left) Field data “middle-aged trees” (61–100 years) and “young trees” (≤ 60 years). The forest stands were selected Field data of wood cores were taken in August 2014 by a stratified random sampling approach in the in monospecific L. sibirica forest stands in sub-plots core areas of forests (i.e. avoiding a 30 m forest edge of 20 × 20 m size (Khansaritoreh et al., 2017). Wood buffer). Stratification was based on a supervised clas- cores from all L. sibirica trees (1755 individuals) sification between forest and non-forest area (Land- with a stem diameter of ≥ 3 cm were collected at sat 8 OLT/TIRS of September 19, 2013). All forest breast height (1.3 m above the ground) using an incre- patches were subsequently classified into four dif- ment borer with an inner diameter of 5 mm. From the ferent size classes (1: < 0.1 km2; 2: 0.1–1.0 km2; 3: wood cores, the tree ring width was measured to an > 1.0–5.0 km2; 4: > 5.0 km2) that serve as a proxy for accuracy of 10 µm using a Lintab 5 measuring system forest fragmentation. Based on the forest-to-grassland (Rinntech, Heidelberg, Germany). All sampled trees ratio, we distinguished between grassland-dominated were classified into four age classes including “very (G) and forest-dominated (F) sub-regions. Forest old trees” (> 160 years), “old trees” (101–160 years), patches in the grassland-dominated subregion mostly 13
Environ Monit Assess (2021) 193:200 Page 5 of 18 200

Fig. 2  Variation of monthly precipitation during the sum- the period May to August). Climate data were obtained from
mertime in the study area from 1986 to 2014 (daily data for the National Agency for Meteorology and Environment Moni-
Tosontsengel, aggregated to monthly sums and cumulated for toring of Mongolia, Ulan Bator

consisted of the smallest patch size class (G1). For Resources Observation Science Center, 2014). The
each patch class (F1 to F4; G1), three replica were “Collection 1 Level-2” scenes are processed to surface
sampled. In each forest stand, two independent nearby reflectance. Landsat-8 OLI surface reflectance data are
sub-plots of 20 × 20 m were sampled. For this study, computed using the Landsat Surface Reflectance Code
the data from the sub-plots were aggregated at the (LaSRC). Landsat 5 TM and Landsat 7 ETM+ surface
stand level. This yielded a total of 15 forest plots dis- reflectance are generated using the Landsat Ecosystem
tributed over the study area (Fig. 1) that were investi- Disturbance Adaptive Processing System (LEDAPS)
gated for the impact of patch size and isolation on the algorithm. Both algorithms make use of the Moderate
forest productivity. Resolution Imaging Spectroradiometer (MODIS) for
 the estimation of climate and atmospheric parameters
 but build on two different radiative transfer models to
Satellite data retrieve surface reflectance. LaSRC in addition uses
 the coastal aerosol spectral band from Landsat-8 OLI
Landsat data were collected from U.S. Geologi- to perform aerosol inversion as input for the radiative
cal Survey (USGS) Earth Resources Observation transfer modelling. Details about the processing of the
and Science (EROS) Center from the Landsat sen- surface reflectance for the three sensors can be found
sors Thematic Mapper (TM), Enhanced Thematic in the respective product guides (U.S. Geological Sur-
Mapper + (ETM+), and Operational Land Imager vey, 2019a, 2019b). The output from the two process-
(OLI) at a 30-m spatial resolution (U.S. Geological ing systems is a compilation of all spectral bands in
Survey, Earth Resources Observation and Science the solar reflectance domain (Bands 1–5 and 7 for
Center, 2012a, 2012b; U.S. Geological Survey, Earth Landsat 5 TM and Landsat 7 ETM+; Bands 2–7, 9 for

 13
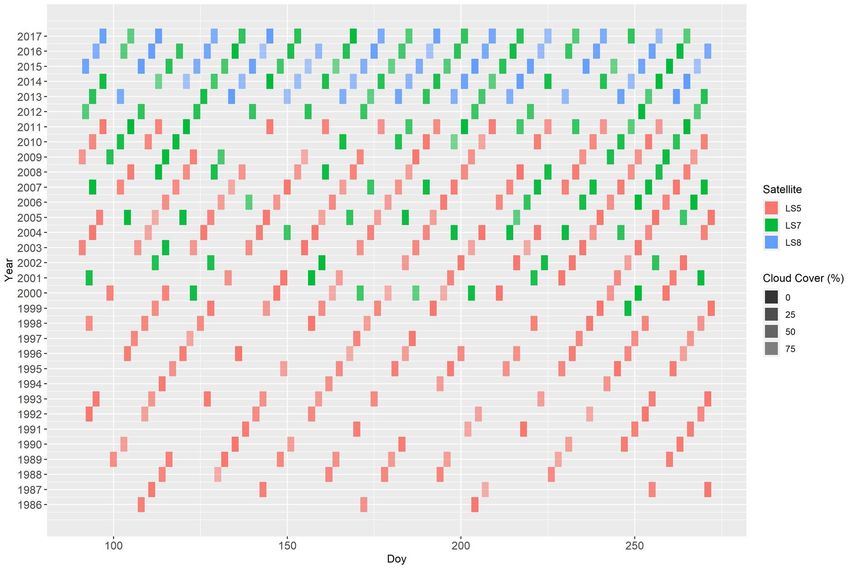
200 Page 6 of 18 Environ Monit Assess (2021) 193:200

Landsat 8 OLI) together with a pixel quality assess- used (see below). This resulted in an overall collec-
ment layer (“pixel_qa”) that stores a bit index that tion of 216 scenes from the TM sensor, 123 from
later is used for cloud masking in the LTS process- ETM+, and 55 from OLI. An overview of all Land-
ing. It should be noted that, depending on the surface sat data for this study is given in Fig. 3.
reflectance processing algorithm, this bit index stores
different values for clear pixels. On demand, the pro-
cessor also delivers a collection of ready to use veg-
etation indices like the NDVI and others. Data analysis
 For the purpose of time-series analysis, only
highest quality data with a root mean square error The collection of Landsat satellite data for the study
of less than or equal to 12 m in geometric accuracy area was processed to a time series layer stack of
(referred to as “Tier 1” Landsat data) were used in NDVI images. First, the NDVI was computed
the present study according to the recommendations for every single Landsat scene based on the well-
of the U.S. Geological Survey (U.S. Geological known ratio of high absorption in the Red and high
Survey, 2019c). All Landsat scenes (path 137/row reflectance of incoming solar radiation in the NIR
26) from beginning of April until end of September part of the electromagnetic spectrum as an indicator
were selected for the 31-year time period 1986 to for “green” vegetation and vegetation productivity
2017, from which at least a subset of 20 years was (Tucker, 1979):

Fig. 3  Summary of all available Landsat satellite imagery red = Landsat-5 TM, green = Landsat 7 ETM+, blue = Landsat
for the study area between 1986 and 2017 (Landsat path 137/ 8 OLI; opacity of the bars indicates amount of cloud coverage)
row 26; colour of the bars shows the three Landsat systems,

13
Environ Monit Assess (2021) 193:200 Page 7 of 18 200 NIR − Red seasonal effects and adjusted to a comparable data NDVI = NIR + Red range by computing the standardized anomalies: Cloud, cloud-shadow, snow, and ice-affected pix- MGS NDVI − MGSNDVI MGSNDVIa = els were masked for each NDVI layer based on the MGSNDVI pixel quality assessment layer of the respective Land- sat acquisition. Differences in reflectance wavelength where μMGS-NDVI is the mean value of the MGS- and hence, NDVI, between the OLI and the other two NDVI observations in the time period 1995 to 2014 sensors have been observed for stable land surface and σMGS-NDVI is its standard deviation. The stand- targets. These differences are a result of the improved ardized anomalies of TRW are calculated as TRWa, calibration, radiometric, and spectral resolution of respectively. the OLI sensor. In order to produce a consistent LTS, The analysis concept of the relations between we accounted for this issue based on ordinary least MGS-NDVIa and TRWa built on a correlation analy- square (OLS) regression transformations of the NDVI sis at the level of the sub-categories (F1-F4; G1) that from Landsat 8 OLI to Landsat 7 ETM+ and Landsat are defined above. The relationships were investigated 5 TM that are suggested by Roy et al. (2016). for every single forest plot (with n = no. of available After masking and transformation, the Landsat years) and for the mean values of the standardized NDVI data were aggregated using a maximum value anomalies across the three forest plots within each compositing (MVC) approach (Holben, 1986) for all patch size category (F1-F4, G1). Further, the TRW data that were acquired within the long-term growing data were separated by tree-age class and the MGS- season between mid of May and mid of September NDVIa-TRWa relationship was analyzed at the level for every single year. The MVC approach selects for of age classes. The general idea behind these strati- every pixel the maximum NDVI value from a satellite fications was that the tree productivity and hence, the dataset recorded during the growing season of 1 year. NDVI, is affected by the forest patch size and shows Therefore, these aggregated annual values are referred differences even within a patch size depending on the to as the “maximum growing season NDVI (MGS- age of the trees as has been reported by Khansaritoreh NDVI)” in this study. Data availability within the et al. (2017). Further, it is assumed from previous compositing period may produce a bias in the MGS- work that variations in tree productivity are related to NDVI when only few images are available. Further, variations in climate (Dulamsuren et al., 2010, 2011; strong rainfall during the summer months around the Khansaritoreh et al., 2018). Based on this rationale, peak of growing season may introduce artefacts in the the hypotheses that are stated in the introduction were composited seasonal NDVI time series. E.g., during tested at the plot level. Mean seasonal MVC NDVI 1992 and 1994, climate records show extreme precip- anomalies were extracted for the plot coordinate and itation sums during the summer months (especially in the surrounding 3 × 3 pixel neighbourhood in order to July, see Fig. 2). These issues restricted the process- ensure that all pixels that contribute to the 20 × 20 m ing of the MGS-NDVI to a minimum of three cloud plots are covered. With regard to the hypothesis that free observations (at the pixel level) per season. As grassland NDVI can serve as a proxy for the moni- a consequence, considerable parts of the study area toring of tree productivity (He & Shao, 2006), every were masked out, especially for the first 10 years of forest plot was assigned a corresponding grassland the Landsat collection where only Landsat-5 images plot. The grassland plots were determined by calcu- are available and at irregular temporal intervals with lating the shortest distance from the forest plot to the a considerable lack of data at the peak of the grow- forest border and then measuring a distance of 100 m ing season where NDVI is at its maximum (Fig. 3). perpendicular to the forest border outside the forest. Thus, the final time series included only the years Only unmanaged grassland sites were selected. from 1995 to 2017. With regard to the availability of Statistical analysis was executed with IBM SPSS the tree ring data, only the period from 1995 to 2014 Statistics 26.0 and R (4.0.3-1). All statistical analy- could be evaluated. sis was carried out at the level of the 15 plots for the The two-time series of annual data (TRW and MGS- 20-year time period. The statistical results based on NDVI) from 1995 to 2014 were finally corrected for the calculation of the Pearson correlation coefficient 13
200 Page 8 of 18 Environ Monit Assess (2021) 193:200

r in order to be able not only to evaluate the strength (May–August) was associated to higher NDVI val-
but also the direction of the relations between NDVI ues of the growing season. This correlation could be
and TRW data. The overall significance of the linear observed at the plot level for the majority of the 15
models was estimated from an F test and the definition forest plots. The highest number of significant rela-
of critical p values at 99%, 95% and 90% significance tions was found for June precipitation of the same
level. The results of the statistical analysis were used as year and seasonal NDVI. Further, the precipitation of
input for spatial modelling of annual standardized TRW the year prior to the NDVI measurement also was cor-
anomalies for the entire study area. Temporal autocor- related with vegetation greenness in terms of NDVI.
relation in the TRW as well as in the NDVI time series Here, the significant relations could be observed for
observations was tested with the autocorrelation func- the months July and August (Table 1).
tion as described in Venables and Ripley (2011). The temporal profile of the MGS-NDVIa for the
 studied time period appeared to reflect these varia-
 tions quite similarly for the different patch sizes and
Results the separation by grassland- and forest-dominated
 landscapes (Fig. 4). The general behaviour was simi-
Landsat time series of maximum growing season lar for all classes with negative standardized anoma-
NDVI and climate variability lies for periods that are linked to years of low summer
 precipitation (compare with Fig. 2). For single years
The MGS-NDVIa followed the variations in climate (e.g. 2012), small forest patches (F1/G1) showed
conditions for the studied time period of 1995 to 2014 higher anomalies compared with the larger patches
(Table 1). Higher precipitation during the summer (F2 to F4).

Table 1  Response of Precipitation
maximum growing season
NDVI (MGS-NDVIa) to Current year Previous year
precipitation standardized
anomalies of the same Plot May Jun Jul Aug May Jun Jul Aug
year and the previous year
 F11 Δ
(period of analysis: 1995–
2014). F = forest-dominated F12 ▲ ▲
area, G = steppe-dominated F13 Δ ▲
area. The first digit defines F21 Δ Δ
the forest-patch size,
 F22 ▲
whereas the second digit
numbers the single replicas. F23 Δ ▲
Plots without second digits F31 Δ Δ
represent the summarized F32 ▲
classes
 F33 ▲ ▲ ▲
 F41 Δ Δ Δ
 F42 ▲ Δ
 F43 Δ Δ
 G11 Δ Δ
 G12 ▼ ▲
 G13 ▲
 F1 Δ Δ
▲ significant positive F2 Δ Δ
(p < 0.05) F3 ▲ Δ
▼ significant negative F1-F3 ▲ Δ
(p < 0.05) F4 Δ ▲
Δ marginally significant G1
positive (p < 0.1)

13
Environ Monit Assess (2021) 193:200 Page 9 of 18 200 Landsat time series of maximum growing season (F4) indicated an effect of the past on the current NDVI and tree ring width year. This can be due to the stable microclimate of large forest patches that is less effected by climate The interannual variability of the MGS-NDVIa variability. Annual NDVI values of grassland showed showed overall significant correlations with TRW a no overall temporal autocorrelation. (Table 2). The relation between NDVI and TRW was Significant correlations (p ≤ 0.05) between MGS- always positive, i.e. positive standardized anomalies NDVIa and TRWa were found for the majority of for- of NDVI were associated with positive anomalies of est plots over all age classes as well as for the mean of TRW. Temporal autocorrelation of annual NDVI and all trees within a plot and therefore also independent TRW observations could be neglected based on the of forest-patch size (Table 2). Only two plots (F11, results from the autocorrelation-function test (Fig. 5). F41) did not show any significant relationships, at Graph (a) in Fig. 5 shows the autocorrelation between neither of the three investigated levels. The highest TRW of the year under investigation and the previ- share of highly significant correlations was found ous years (t-1 and t-2). High values indicate a strong for the age class “old trees” (O). Note that the results effect of the past on the current year. It is obvious for young trees (Y) are less robust for interpretation that past year’s (t-1) TRW has an effect on produc- across plots due to missing data in almost 50% of the tivity of trees in the current year. This is in line with plots. The introduction of a 1-year lag in the NDVI- other studies that revealed a spill-over effect of grow- TRW relationship reduced the overall significance ing conditions of the previous year on current produc- of the correlations considerably. Then, significant tivity (Babushkina & Belokopytova, 2014; Vaganov relations (p ≤ 0.05) were only found for small forest et al., 2009). In contrast to the TRW time series, in patches in grassland-dominated landscapes (G1). general, no effect of past NDVI observations on the Based on the significant relations between MGS- current year could be found. This is mainly a conse- NDVIa and TRWa, the slope of the linear regression of quence of the annual aggregation of the NDVI data TRW from NDVI was further investigated (Fig. 6). The that eliminates the seasonal cycle and the inher- underlying assumption that the forest patch size and ent correlation structure of seasonal data (Forkel forest-grassland ratio have an impact on the slope of the et al., 2013) and thus enables a regression analysis on regression line was not confirmed. The slopes are not the annual level. Only NDVI of large forest patches notably different for the different forest-patch size classes. Fig. 4 Temporal profile of standardized maximum growing season NDVI anomalies (MGS-NDVIa) for the reference period 1995 to 2014 grouped by patch size (F1, F2-F4) and forest-to-grassland ratio (F, G) 13
200 Page 10 of 18 Environ Monit Assess (2021) 193:200 Table 2 Results of the correlation analysis between standardized maximum growing season NDVI anomalies (MGS-NDVIa) and standardized anomalies of the tree-ring width (TRWa) for different forest-patch size classes and tree age classes Tree age class Patch size class/ Y (≤ 60 years) M (61–100 years) O (101–160 years) vO (> 160 years) Mean plot F11 - - 0.33n.s 0.40 + 0.37n.s F12 - 0.66 + + + 0.49 + + 0.64 + + + 0.60 + + + F13 - 0.69 + + + 0.78 + + + 0.82 + + + 0.76 + + + F1 - 0.58 + + + 0.56 + + 0.65 + + + 0.61 + + + F21 0.41 + 0.48 + + 0.61 + + + 0.63 + + + 0.58 + + F22 - 0.40 + 0.70 + + + 0.71 + + + 0.69 + + + F23 - 0.77 + + + 0.85 + + + 0.86 + + + 0.84 + + + F2 0.53 + + 0.74 + + + 0.82 + + + 0.82 + + + 0.81 + + + F31 0.67 + + + 0.68 + + + 0.64 + + + 0.73 + + + 0.74 + + + F32 - 0.27n.s 0.75 + + + 0.59 + + + 0.58 + + F33 0.52 + + 0.65 + + + 0.53 + + 0.61 + + + 0.60 + + + F3 0.69 + + + 0.68 + + + 0.77 + + + 0.76 + + + 0.75 + + + F41 − 0.03n.s − 0.23n.s − 0.11n.s 0.03n.s − 0.08n.s F42 0.73 + + + 0.73 + + + 0.76 + + + 0.72 + + + 0.75 + + + F43 0.50 + + 0.55 + + 0.57 + + 0.62 + + + 0.57 + + F4 0.58 + + 0.70 + + + 0.64 + + + 0.69 + + + 0.66 + + + G11 0.64 + + + 0.61 + + + 0.68 + + + 0.60 + + + 0.70 + + + G12 0.66 + + + 0.67 + + + 0.64 + + + 0.47 + + 0.66 + + + G13 - − 0.20n.s 0.54 + + 0.55 + + 0.42 + G1 0.67 + + + 0.54 + + 0.69 + + + 0.63 + + + 0.66 + + + + + + Correlation highly significant (p ≤ 0.01), positive + + Correlation significant (p ≤ 0.05), positive + Correlation marginally significant (p ≤ 0.1), positive n.s no significant correlation “-” no tree ring data Grassland NDVI as a proxy for tree productivity classes except for F4 (p ≤ 0.05) (Fig. 7b). Here again, the slopes of the linear regression functions for the With regard to the hypothesis that steppe-grassland patch-size classes (F1-F3, G1) are not statistically dif- NDVI can be used as a proxy for forest NDVI in the ferent, whereas MGS-NDVIa and TWRa of the largest assessment of anomalies and trends in forest produc- patch size class F4 are completely uncorrelated. tivity, significant correlation between MGS-NDVIa A closer look at the temporal signatures of grass- of the steppe and TRWa could be found for all patch- land and forest NDVI anomalies (Fig. 8) confirms size classes except F4 (Table 3, Fig. 7a). However, the generally uniform behaviour of the two time the significance levels were generally lower compared series for small forest patches (F1, G1). However, with the use of forest NDVI. In many cases, at patch it can also be seen that the general response of for- class level and at plot level, no significant relation est NDVI in some years is different from grassland was observed. The largest forest patches (F4) showed NDVI, especially in large forest patches and their weak correlations and no significance at all. Accord- surroundings (F4). The large discrepancies between ingly, the correlation analysis between grassland and forest and steppe NDVI anomalies become obvious, forest MGS-NDVIa revealed highly statistically sig- especially in drought years, which is exemplarily nificant relations (p ≤ 0.01) at all forest-patch size shown in Fig. 9. 13
Environ Monit Assess (2021) 193:200 Page 11 of 18 200 Fig. 5 Results of the temporal autocorrelation test. Autocorre- displays the time lag in years between two observations; the lation of annual TRW anomalies a, autocorrelation of annual Y-axis shows the value of the autocorrelation function. Values NDVI anomalies over forest b, and autocorrelation of annual below 0.50 indicate no autocorrelation between the observa- NDVI anomalies over associated grassland plots c. The X-axis tions Discussion increment and maximum NDVI composites of the growing season. The study concept followed the evi- We used a compilation of dendrochronological dence from previous literature about the general simi- records from 15 plots of Siberian larch in the south- larity of temporal patterns from NDVI as an indicator ern boreal forests of Mongolia together with a dense of vegetation greenness and tree-ring width (TRW) as time series of Landsat satellite images for 20 years to a proxy of biomass accumulation. Hence, both signals investigate the relations between annual radial stem represent the vegetation vitality and can indicate vari- ations in forest productivity (Kaufmann et al., 2004; D’Arrigo et al., 2000). Our results confirmed the cor- relations of NDVI to annual variations in climate dur- ing the growing season and thus TRW for the moun- tainous forests in the study area. The seasonal maximum of vegetation greening in terms of NDVI is closely linked to the precipitation in the summertime (most frequently in June) of the corresponding year of observation. Late summer and spring rainfall did not affect the maximum growing season NDVI. This is in accordance with other stud- ies (Bumann, 2017; Kaufmann et al., 2004) that also reported a close relation of growing-season precipi- tation to the maximum of NDVI. On the other hand, He and Shao (2006) did not reveal any significant relations for Qilian juniper stands in central China. In comparison with the NDVI-precipitation relation- ship, Khansaritoreh et al. (2017) pointed out that the TRW-precipitation relationship is more correlated by Fig. 6 Relationship between standardized maximum-growing applying a 1-year time lag between summer precipita- season NDVI anomalies (MGS-NDVIa) and standardized tree- tion and TRW. Nevertheless, like other authors, they ring width anomalies (TRW a) for different forest-patch size found significant precipitation-TRW relationships for classes (grey lines) and overall correlation for all plot types both the current and previous year summer months (black dashed line). Reference period is 1995 to 2014 13
200 Page 12 of 18 Environ Monit Assess (2021) 193:200

Table 3  Results of the Tree age class
correlation analysis
between standardized Patch size Y (≤ 60 years) M (61– O (101– vO (> 60 years) Mean
maximum growing season class/plot 100 years) 160 years)
NDVI anomalies (MGS-
NDVIa) and standardized F11 - - 0.41+ 0.47++ 0.45++
anomalies of the tree-ring F12 - 0.48++ 0.31n.s 0.49++ 0.44+
width (TRWa) for different F13 - 0.44+ 0.51++ 0.58++ 0.51++
forest-patch size classes
and tree age classes. NDVI F1 - 0.48++ 0.47++ 0.57+++ 0.52++
anomalies refer to the F21 0.06n.s 0.04n.s 0.16n.s 0.22n.s 0.15n.s
corresponding grassland F22 - 0.18n.s 0.48++ 0.49++ 0.45+
plot at the forest border of F23 - 0.46++ 0.58++ 0.59++ 0.55++
the respective patch
 F2 0.23n.s 0.39n.s 0.53++ 0.56++ 0.51++
 F31 0.61+++ 0.66++ 0.46++ 0.46++ 0.58++
 F32 - 0.37n.s 0.55++ 0.43+ 0.43+
 F33 0.19n.s 0.39n.s 0.30n.s 0.20n.s 0.28n.s
+++ Correlation highly
 F3 0.46+ 0.43+ 0.51++ 0.46+ 0.48++
significant (p ≤ 0.01),
positive F41 − 0.23n.s − 0.02n.s − 0.24n.s − 0.29n.s − 0.23n.s
++ Correlation significant F42 0.12n.s 0.09n.s 0.13n.s 0.18n.s 0.12n.s
(p ≤ 0.05), positive F43 − 0.15n.s − 0.16n.s − 0.01n.s − 0.13n.s − 0.13n.s
+ Correlation marginally F4 − 0.15n.s − 0.08n.s − 0.13n.s − 0.18n.s − 0.14n.s
significant (p ≤ 0.1), G11 0.43+ 0.42+ 0.53++ 0.45++ 0.50++
positive G12 0.69+++ 0.64+++ 0.55++ 0.41+ 0.61+++
n.s no significant G13 - − 0.35n.s 0.31n.s 0.37n.s 0.19n.s
correlation
 G1 0.59+++ 0.43+ 0.54++ 0.47++ 0.53 ++
“-” no tree ring data

(Bumann, 2017; Khansaritoreh et al., 2017). In forest-dominated and grassland-dominated forest-
accordance with these findings, we could show both a steppe areas (Fig. 4). Dulamsuren et al. (2019) reported
relation between NDVI and precipitation of the same that the humus content of the organic layer, which
year as well as a weaker but still significant relation improves the moisture availability, increased simulta-
for NDVI and previous year July precipitation. neously with forest stand size. In addition, Klinge et al.
 In opposite to our finding of significant correla- (2021) have shown that permafrost is promoted by
tion of data from the same year, Wang et al. (2004) a thick organic layer and permafrost is mostly absent
reported a 1-year lag in the correlation between NDVI in small forest stands. The authors stated that perma-
and TRW for oak forests in North America. The maxi- frost supports soil-moisture conditions, which influ-
mum growing season NDVI was found to be a valu- ences tree growth in the forest-steppe. This geoeco-
able indicator of tree productivity, whereas the sizes of logical factor decreases drought stress in large forest
the forest patches and the landscape type (grassland vs. stands, whereas small fragmented forest patches are
forest dominated landscapes) did not have an impact subjected more to climate variability. Nevertheless,
on the NDVI-TRW relationship. The general relation- this increased climate sensitivity of TRW and NDVI in
ship between NDVI and TRW was reported by other small forest stands did not obliterate the general cor-
authors, too (Bumann, 2017; Coops et al., 1999; He relation between the two variables across all studied
& Shao, 2006). Further, Khansaritoreh et al. (2017) forest stands.
found that TRW in small forests compared to larger Due to data quality issues and availability in the
forests correlated more with climatic variability, sug- early years of Landsat 5 TM, the time series in our
gesting that small stands show a higher variability also study had to be reduced from 31 to 20 years of over-
in NDVI. Indeed, small stands showed higher ampli- lapping dendrochronological records and annual
tudes of NDVI over the observed time period in both NDVI composites. This is in line with the majority

13
Environ Monit Assess (2021) 193:200 Page 13 of 18 200 Fig. 7 Relationship between standardized maximum-growing NDVIa of forest patch and corresponding grassland plots b for season NDVI anomalies (MGS-NDVIa) of grassland plots different patch size classes (grey lines) and the overall correla- and standardized tree-ring width anomalies (TRWa) for cor- tion (black dashed line). Reference period is 1995 to 2014 responding forest-patches a and relationship between MGS- of comparable studies that investigated the sensitiv- single acquisitions that represent a full growing sea- ity of NDVI time series to tree productivity based son (Coops et al., 1999) or on data from a single on dendrochronology (D’Arrigo et al., 2000; Bunn sensor, e.g. Landsat 5 TM (Bumann, 2017). This et al., 2013; Wang et al., 2004; Vicente-Serrano constraint and also the usage of pre-composited et al., 2016; Kaufmann et al., 2004; Brehaut & products limited the proper delineation of the maxi- Danby, 2018). The major drawback of the Landsat- mum of growing season NDVI in the earlier stud- based studies is that they were solely based on ies. Kaufmann et al. (2004) underlined that only the Fig. 8 Standardized maxi- mum-growing season NDVI anomalies (MGS-NDVIa) for forest-patch size classes (F1, F4, G1) compared with corresponding steppe plots (F1_S, F4_S, G1_S) (refer- ence period 1995 to 2014) 13
200 Page 14 of 18 Environ Monit Assess (2021) 193:200

Fig. 9  Spatial patterns of standardized anomalies of maximum growing season NDVI (MGS-NDVIa) for the year 2002. Outline
shows the extend of forest patches, dots illustrate the location of the sample plots for the different forest patch classes

summer peak in NDVI represents the physiological progress in satellite-time series availability and pro-
status of the forest stand. Thus, the approach in the cessing, the major restriction of satellite-time series
present study used the full archive of Landsat data for monitoring tree physiology parameters still is the
for the delineation of the seasonal maximum NDVI relatively short record compared with the variation
as a proxy for tree productivity. The highly signifi- of tree growth at decadal or even multi-decadal time
cant results of the correlation analysis confirmed the scales. Despite this fact, the present study underlines
adequacy of this approach. However, the mentioned the indisputable value of high-resolution dense time
issues in the MVC processing for the first 10 years series for monitoring and retrospective modelling of
of the time series also reveal the still existing chal- tree productivity.
lenges for long time series of satellite data. Bunn A major issue in the NDVI-TRW analysis in highly
et al. (2013) pointed to the fact that despite the major fragmented forest landscapes is that the forest patch

13
Environ Monit Assess (2021) 193:200 Page 15 of 18 200

size cannot always be covered and depicted accurately et al., 2002). Summarizing, the analysis of the grass-
by the spatial resolution of the available satellite-time land NDVI-TRW relationship shows a potential for
series. This is why in previous studies, grassland monitoring tree productivity in highly fragmented
NDVI time series have been used as a proxy to moni- grassland-steppe-forest landscapes. It also reveals
tor temporal variations in tree productivity (Bumann, that this relationship is not uniform but shows spa-
2017; He & Shao, 2006; Wang et al., 2004). This tial and temporal inconsistencies that are a function
principle builds on the assumption that forests and of complex, site-specific ecological parameters and
grasslands grow under similar climatic conditions and processes. Thereby, the availability of higher spatial
presumes a similar response of different vegetation- resolution satellite time series as exemplified in this
cover types on variations in those climate conditions study is a prerequisite to separate those effects.
(He & Shao, 2006). In this case, forest NDVI can be
replaced by grassland NDVI in modelling productiv-
ity. In our study, we generally confirmed the over-
all significant relation between grassland and forest Conclusions
NDVI over the investigated time period. However,
in some years, the overall spatial patterns of NDVI Seasonal composites of NDVI data from a 20-year
and thus TRW standardized anomalies show opposed multi-sensor Landsat time series were tested for cor-
responses of grassland and forest patches to climate relations with dendrochronological tree ring growth
conditions. For example, for the year 2002, we observed of Siberian larch in the southern boreal forests of
strong negative anomalies for steppe-grassland areas northern Mongolia. The analysis concept was based
whereas the forest areas showed no deviation to the on the hypothesis that the general vegetation green-
long-term mean (Fig. 9). This year was at the end of ness is correlated with ecosystem productivity and
a long, severe drought with very low summer rainfall thus productivity can be captured by satellite-based
in the Khangai Mountains (compare Fig. 2). This dif- vegetation indices like the NDVI. Our results con-
ference is the result of the different life strategies of firmed the general ability of NDVI time series to cap-
late-successional forests and grasslands in terms of ture anomalies in forest productivity. We could also
stomatal regulation. Moreover, large forest patches demonstrate that the nature of the relation between
show a higher resilience to climate extremes com- the NDVI signal and tree ring width is comparable
pared to small, highly fragmented forest sites. For for different forest types (e.g. age, patch size, forest-
the specific site conditions in our study area, this can steppe ratio). However, our analysis revealed that
be linked to various environmental factors where the the NDVI of grasslands is less suitable as a proxy
most obvious one is the strong association of for- to monitor forest productivity due to the different
est occurrence with topography. Forest patches are response patterns of grasslands and forests to climate
mainly present on north-facing slopes where evapo- conditions. Our study should therefore contribute
transpiration is reduced compared to south-facing to a better understanding of long-term dynamics in
slopes, resulting in higher soil water availability and forest-steppe ecosystems and their relation to climate
relative humidity that support tree growth (Klinge change. Overall, the observed patterns and relations
et al., 2018). During drought periods, soils in the for- between satellite data time series and dendrochro-
ested areas are favoured by canopy shading and are nological records form the basis for a retrospective
able to maintain necessary hydrological conditions modelling of tree ring growth over larger areas and
over longer periods. The higher resilience of large thus may provide a key parameter for global climate
forest patches compared to small patches in the study change and terrestrial carbon cycle studies as well as
area is also associated to the permafrost distribution for the calibration of global carbon models.
that modifies the soil hydrological regime in larger,
closed forest stands (Klinge et al., 2018, 2021). Here, Acknowledgements We are grateful to the US Geological
 Survey for freely providing Landsat Collection 1 Level 2 data
seasonal ice above the permafrost layer can compen- for satellite time series analysis. We acknowledge the great
sate the deficiency in drought years by accumulat- support of the reviewer Hilde K. Wam in a previous version of
ing soil water in moist years and releasing water to this manuscript.
the tree roots in dry and warm periods (Sugimoto

 13
200 Page 16 of 18 Environ Monit Assess (2021) 193:200 Funding Open Access funding enabled and organized Bumann, E. (2017). Assessing Responses of Betula papyrifera by Projekt DEAL. This work was funded by the Deutsche (Paper Birch) to Climate Variability in a Remnant Popu- Forschungsgemeinschaft (DFG) under project number lation Along the Niobrara River in Nebraska Through 385460422 “Analysis of the geo-ecological parameters con- Dendroecological and Remote Sensing Techniques (Dis- trolling the spatial pattern of forest islands and discontinuous sertations & Theses in Natural Resources 161). Lincoln, permafrost and its modification by forest fire, forest use and cli- Nebraska. http://digitalcommons.unl.edu/natresdiss/161. mate change in the forest-steppe of Mongolia”. The field work Accessed 26 October 2018. was funded by the Volkswagen Foundation in the scope of the Bunn, A. G., Hughes, M. K., Kirdyanov, A. V., Losleben, M., project 87175 “Forest regeneration and biodiversity at the for- Shishov, V. V., Berner, L. T., et al. (2013). Comparing est-steppe border of the Altay and Khangai Mountains under forest measurements from tree rings and a space-based contrasting developments of livestock numbers in Kazakhstan index of vegetation activity in Siberia. Environmental and Mongolia”. Research Letters, 8, 35034. https://doi.org/10.1088/1748- 9326/8/3/035034 Data availability This study used Landsat data that were Coops, N., Bi, H., Barnett, P., & Ryan, P. (1999). Estimating publicly available from U.S. Geological Survey (USGS) Earth mean and current annual increments of stand volume in Resources Observation and Science (EROS) Center (https:// a regrowth eucalypt forest using historical Landsat multi earthexplorer.usgs.gov/). spectral scanner imagery. Journal of Sustainable Forestry, 9, 149–168. https://doi.org/10.1300/J091v09n03_07 D’Arrigo, R. D., Kaufmann, R. K., Davi, N., Jacoby, G. C., Open Access This article is licensed under a Creative Com- Laskowski, C., Myneni, R. B., et al. (2004). Thresholds mons Attribution 4.0 International License, which permits for warming-induced growth decline at elevational tree use, sharing, adaptation, distribution and reproduction in any line in the Yukon Territory, Canada. Global Biogeochemi- medium or format, as long as you give appropriate credit to the cal Cycles, 18. https://doi.org/10.1029/2004GB002249 original author(s) and the source, provide a link to the Crea- D’Arrigo, R. D., Malmstrom, C. M., Jacoby, G. C., Los, S. tive Commons licence, and indicate if changes were made. The O., & Bunker, D. E. (2000). Correlation between maxi- images or other third party material in this article are included mum latewood density of annual tree rings and NDVI in the article’s Creative Commons licence, unless indicated based estimates of forest productivity. International otherwise in a credit line to the material. If material is not Journal of Remote Sensing, 21, 2329–2336. https://doi. included in the article’s Creative Commons licence and your org/10.1080/01431160050029611 intended use is not permitted by statutory regulation or exceeds Dulamsuren, C., Hauck, M., & Leuschner, C. (2010). Recent the permitted use, you will need to obtain permission directly drought stress leads to growth reductions in Larix sibirica in from the copyright holder. To view a copy of this licence, visit the western Khentey, Mongolia. Global Change Biology, 16, http://creativecommons.org/licenses/by/4.0/. no-no. https://doi.org/10.1111/j.1365-2486.2009.02147.x Dulamsuren, C., Hauck, M., Leuschner, H. H., & Leuschner, C. (2011). Climate response of tree-ring width in Larix References sibirica growing in the drought-stressed forest-steppe eco- tone of northern Mongolia. Annals of Forest Science, 68, 275–282. https://doi.org/10.1007/s13595-011-0043-9 Babushkina, E. A., & Belokopytova, L. V. (2014). Climatic Dulamsuren, C., Klinge, M., Bat-Enerel, B., Ariunbaatar, T., signal in radial increment of conifers in forest-steppe of & Tuya, D. (2019). Effects of forest fragmentation on southern Siberia and its dependence on local growing organic carbon pool densities in the Mongolian forest- conditions. Russian Journal of Ecology, 45, 325–332. steppe. Forest Ecology and Management, 433, 780–788. https://doi.org/10.1134/S1067413614050038 https://doi.org/10.1016/j.foreco.2018.10.054 Batima, P., Natsagdorj, L., Gombluudev, P., & Erdenetsetseg, Dulamsuren, C., Wommelsdorf, T., Zhao, F., Xue, Y., Zhumadilov, B. (2005). Observed climate change in Mongolia. AIACC B. Z., Leuschner, C., et al. (2013). Increased summer temper- Working Papers, 12, 1–25. atures reduce the growth and regeneration of Larix sibirica in Beck, P. S. A., Juday, G. P., Alix, C., Barber, V. A., Winslow, S. southern boreal forests of Eastern Kazakhstan. Ecosystems, E., Sousa, E. E., et al. (2011). Changes in forest productivity 16, 1536–1549. https://doi.org/10.1007/s10021-013-9700-1 across Alaska consistent with biome shift. Ecology Letters, 14, Eckert, S., Hüsler, F., Liniger, H., & Hodel, E. (2015). Trend analy- 373–379. https://doi.org/10.1111/j.1461-0248.2011.01598.x sis of MODIS NDVI time series for detecting land degradation Brehaut, L., & Danby, R. K. (2018). Inconsistent relationships and regeneration in Mongolia. Journal of Arid Environments, between annual tree ring-widths and satellite-measured 113, 16–28. https://doi.org/10.1016/j.jaridenv.2014.09.001 NDVI in a mountainous subarctic environment. Ecologi- Eitel, J. U. H., Griffin, K. L., Boelman, N. T., Maguire, A. J., cal Indicators, 91, 698–711. https://doi.org/10.1016/j. Meddens, A. J. H., Jensen, J., et al. (2020). Remote sens- ecolind.2018.04.052 ing tracks daily radial wood growth of evergreen needle- Buermann, W., Parida, B., Jung, M., MacDonald, G. M., Tucker, leaf trees. Global Change Biology, 26, 4068–4078. https:// C. J., & Reichstein, M. (2014). Recent shift in Eurasian doi.org/10.1111/gcb.15112 boreal forest greening response may be associated with Fensholt, R., & Proud, S. R. (2012). Evaluation of Earth Obser- warmer and drier summers. Geophysical Research Letters, vation based global long term vegetation trends — Com- 41, 1995–2002. https://doi.org/10.1002/2014GL059450 paring GIMMS and MODIS global NDVI time series. 13
Environ Monit Assess (2021) 193:200 Page 17 of 18 200 Remote Sensing of Environment, 119, 131–147. https:// Geoinformatics & Geostatistics: An Overview. https://doi. doi.org/10.1016/j.rse.2011.12.015 org/10.4172/2327-4581.1000151 Forkel, M., Carvalhais, N., Verbesselt, J., Mahecha, M., Neigh, Lkhagvadorj, D., Hauck, M., Dulamsuren, C., & Tsogtbaatar, C., & Reichstein, M. (2013). Trend change detection in J. (2013). Pastoral nomadism in the forest-steppe of the NDVI time series: Effects of inter-annual variability and Mongolian Altai under a changing economy and a warm- methodology. Remote Sensing, 5(5), 2113–2144. https:// ing climate. Journal of Arid Environments, 88, 82–89. doi.org/10.3390/RS5052113 https://doi.org/10.1016/j.jaridenv.2012.07.019 Goodale, C. L., Apps, M. J., Birdsey, R. A., Field, C. B., Heath, L. Lu, D., Chen, Q., Wang, G., Liu, L., Li, G., & Moran, E. S., Houghton, R. A., et al. (2002). Forest carbon sinks in the (2015). A survey of remote sensing-based aboveground northern hemisphere. Ecological Applications, 12, 891–899. biomass estimation methods in forest ecosystems. Inter- https://doi.org/10.1890/1051-0761(2002)012[0891:FCSITN] national Journal of Digital Earth, 9, 63–105. https://doi. 2.0.CO;2 org/10.1080/17538947.2014.990526 Hais, M., Chytrý, M., & Horsák, M. (2016). Exposure-related Main-Knorn, M., Cohen, W. B., Kennedy, R. E., Grodzki, W., forest-steppe: A diverse landscape type determined by Pflugmacher, D., Griffiths, P., et al. (2013). Monitoring topography and climate. Journal of Arid Environments, coniferous forest biomass change using a Landsat trajec- 135, 75–84. https://doi.org/10.1016/j.jaridenv.2016.08.011 tory-based approach. Remote Sensing of Environment, Hauck, M., Leuschner, C., & Homeier, J. (2019). Klimawandel 139, 277–290. https://doi.org/10.1016/j.rse.2013.08.010 und Vegetation - Eine globale Übersicht. Berlin, Heidel- Nyamjav, B., Goldammer, J.G., & Uibrig, H. (2007). Fire situa- berg: Springer Spektrum. tion in Mongolia. In International Forest Fire News, 36, He, J., & Shao, X. (2006). Relationships between tree-ring 46–66. width index and NDVI of grassland in Delingha. Chinese Pan, Y., Birdsey, R. A., Fang, J., Houghton, R., Kauppi, P. E., Science Bulletin, 51, 1106–1114. https://doi.org/10.1007/ Kurz, W. A., et al. (2011). A large and persistent carbon s11434-006-1106-4 sink in the world’s forests. Science, 333, 988–993. https:// Hilbig, W. (1995). The Vegetation of Mongolia. SPB Acad. doi.org/10.1126/science.1201609 Publ. Powell, S. L., Cohen, W. B., Healey, S. P., Kennedy, R. E., Holben, B. N. (1986). Characteristics of maximum-value com- Moisen, G. G., Pierce, K. B., et al. (2010). Quantifica- posite images from temporal AVHRR data. International tion of live aboveground forest biomass dynamics with Journal of Remote Sensing, 7, 1417–1434. https://doi. Landsat time-series and field inventory data: A compari- org/10.1080/01431168608948945 son of empirical modeling approaches. Remote Sensing of Ivanova, Y., Kovalev, A., & Soukhovolsky, V. (2021). Mode- Environment, 114, 1053–1068. https://doi.org/10.1016/j. ling the Radial Stem Growth of the Pine (Pinus sylvestris rse.2009.12.018 L.) Forests Using the Satellite-Derived NDVI and LST Rodríguez-Veiga, P., Quegan, S., Carreiras, J., Persson, H. (MODIS/AQUA) Data. Atmosphere, 12, 12. https://doi. J., Fransson, J. E., Hoscilo, A., et al. (2019). Forest bio- org/10.3390/atmos12010012 mass retrieval approaches from earth observation in dif- Kaufmann, R. K., D’Arrigo, R. D., Laskowski, C., Myneni, R. B., ferent biomes. International Journal of Applied Earth Zhou, L., & Davi, N. K. (2004). The effect of growing sea- Observation and Geoinformation, 77, 53–68. https://doi. son and summer greenness on northern forests. Geophysical org/10.1016/j.jag.2018.12.008 Research Letters. https://doi.org/10.1029/2004GL019608 Rouse, J. W., Hass, R., Schell, J. A., & Deering, D. W. (1974). Khansaritoreh, E., Dulamsuren, C., Klinge, M., Ariunbaatar, Monitoring vegetation systems in the Great Plains with T., Bat-Enerel, B., Batsaikhan, G., et al. (2017). Higher ERTS. In NASA. Goddard Space Flight Center (Ed.) (1, climate warming sensitivity of Siberian larch in small Sect. A, pp. 309–317). than large forest islands in the fragmented Mongolian for- Roy, D. P., Kovalskyy, V., Zhang, H. K., Vermote, E. F., Yan, L., est steppe. Global Change Biology, 23, 3675–3689. https:// Kumar, S. S., et al. (2016). Characterization of Landsat-7 to doi.org/10.1111/gcb.13750 Landsat-8 reflective wavelength and normalized difference Khansaritoreh, E., Schuldt, B., & Dulamsuren, C. (2018). vegetation index continuity. Remote Sensing of Environ- Hydraulic traits and tree-ring width in Larix sibirica ment, 185, 57–70. https://doi.org/10.1016/j.rse.2015.12.024 Ledeb. as affected by summer drought and forest fragmen- Sangüesa-Barreda, G., Camarero, J. J., García-Martín, A., tation in the Mongolian forest steppe. Annals of Forest Hernández, R., & de La Riva, J. (2014). Remote-sensing Science. https://doi.org/10.1007/s13595-018-0701-2 and tree-ring based characterization of forest defolia- Klinge, M., Dulamsuren, C., Erasmi, S., Karger, D. N., & tion and growth loss due to the Mediterranean pine pro- Hauck, M. (2018). Climate effects on vegetation vitality at cessionary moth. Forest Ecology and Management, 320, the treeline of boreal forests of Mongolia. Biogeosciences, 171–181. https://doi.org/10.1016/j.foreco.2014.03.008 15, 1319–1333. https://doi.org/10.5194/bg-15-1319-2018. Schlütz, F., Dulamsuren, C., Wieckowska, M., Mühlenberg, Klinge, M., Schneider, F., Dulamsuren, C., Arndt, K., M., & Hauck, M. (2008). Late Holocene vegetation his- Bayarsaikhan, U., & Sauer, D. (2021). Interrelations tory suggests natural origin of steppes in the northern between relief, vegetation, disturbances, and perma- Mongolian mountain taiga. Palaeogeography, Palaeo- frost in the forest-steppe of central Mongolia. accepted. climatology, Palaeoecology, 261, 203–217. https://doi. Earth Surface Processes and Landforms. org/10.1016/j.palaeo.2007.12.012 Liu, L. (2016). Opportunities of mapping forest carbon stock Sugimoto, A., Yanagisawa, N., Naito, D., Fujita, N., & Maximov, and its annual increment using Landsat time-series data. T. C. (2002). Importance of permafrost as a source of water 13
You can also read