Nonlinear responses of particulate nitrate to NOx emission controls in the megalopolises of China
←
→
Page content transcription
If your browser does not render page correctly, please read the page content below
Atmos. Chem. Phys., 21, 15135–15152, 2021
https://doi.org/10.5194/acp-21-15135-2021
© Author(s) 2021. This work is distributed under
the Creative Commons Attribution 4.0 License.

Nonlinear responses of particulate nitrate to NOx emission controls
in the megalopolises of China
Mengmeng Li1 , Zihan Zhang1 , Quan Yao2 , Tijian Wang1 , Min Xie1 , Shu Li1 , Bingliang Zhuang1 , and Yong Han3
1 Schoolof Atmospheric Sciences, Nanjing University, Nanjing 210023, China
2 Statistical
           Bureau of Qingjiangpu District, Huaian 223001, China
3 Guangdong Province Key Laboratory for Climate Change and Natural Disaster Studies, School of Atmospheric Sciences,

Sun Yat-Sen University, Guangzhou 510000, China

Correspondence: Mengmeng Li (mengmengli2015@nju.edu.cn)

Received: 21 April 2021 – Discussion started: 4 June 2021
Revised: 19 August 2021 – Accepted: 31 August 2021 – Published: 12 October 2021

Abstract. Nitrate is an increasingly important component of     results also emphasize that ammonia (NH3 ) and volatile or-
fine particulate matter (PM2.5 ) in Chinese cities. The pro-    ganic compounds (VOCs) are effective in controlling nitrate
duction of nitrate is not only related to the abundance of      pollution, whereas decreasing the sulfur dioxide (SO2 ) and
its precursor, but it is also supported by the atmospheric      NOx emissions may have counterintuitive effects on nitrate
photochemical oxidants, raising a new challenge for the         aerosols. This paper helps understand the nonlinear aerosol
current emission control actions in China. This paper uses      and photochemistry feedbacks and defines the effectiveness
comprehensive measurements and a regional meteorology–          of proposed mitigations for the increasingly serious nitrate
chemistry model with optimized mechanisms to establish the      pollution in China.
nonlinear responses between particulate nitrate and the emis-
sion controls of nitrogen oxides (NOx ) in the megalopolises
of China. Nitrate is an essential component of PM2.5 in east-
ern China, accounting for 9.4 %–15.5 % and 11.5 %–32.1 %        1   Introduction
of the PM2.5 mass for the warm and cold seasons. The hypo-
thetical NOx emission reduction scenarios (−10 % to −80 %)      Secondary inorganic aerosols (SIAs), including sulfate
during summer–autumn result in almost linearly lower PM2.5      (SO2−                 −                        +
                                                                     4 ), nitrate (NO3 ) and ammonium (NH4 ), account for
by −2.2 % in Beijing–Tianjin–Hebei (BTH) and −2.9 % in          30 %–60 % of the total fine particulate matter (PM2.5 ) mass
Yangtze River Delta (YRD) per 10 % reduction of NOx emis-       during haze events in China (R. J. Huang et al., 2014; Zhao
sions, whereas they lead to a rather complicated response of    et al., 2013). Since the enactment of the Air Pollution Pre-
PM components in winter. Wintertime nitrate is found to in-     vention and Control Action Plan in 2013, the Chinese gov-
crease by +4.1 % in BTH and +5.1 % in YRD per 10 % re-          ernment has taken drastic measures to reduce the emissions
duction of NOx emissions, with nearly unchanged nitric acid     of sulfur dioxide (SO2 ), nitrogen oxides (NOx ) and primary
(HNO3 ) and higher dinitrogen pentoxide (N2 O5 ) intermedi-     PM2.5 , leading to significant decreases in sulfate and over-
ate products produced from the increased atmospheric oxi-       all PM2.5 concentrations in cities (Silver et al., 2018; Li
dant levels. An inflexion point appears at 30 %–50 % NOx        et al., 2021a; J. D. Wang et al., 2017). Meanwhile, the nitro-
emission reduction, and a further reduction in NOx emis-        gen / sulfur (N/S) ratio in PM2.5 increased significantly, and
sions is predicted to cause −10.5 % reduction of nitrate for    nitrate became the main component of PM2.5 (16 %–45 %)
BTH and −7.7 % for YRD per 10 % reduction of NOx emis-          during haze episodes, despite a more than 20 % reduction in
sions. In addition, the 2012–2016 NOx control strategy actu-    the concentrations of its precursor NOx (Shao et al., 2018;
ally leads to no changes or even increases of nitrate in some   Wen et al., 2018; Zhai et al., 2019). The increasingly serious
areas (8.8 % in BTH and 14.4 % in YRD) during winter. Our       nitrate pollution has emerged to be the new emphasis of air
                                                                pollution controls in China.

Published by Copernicus Publications on behalf of the European Geosciences Union.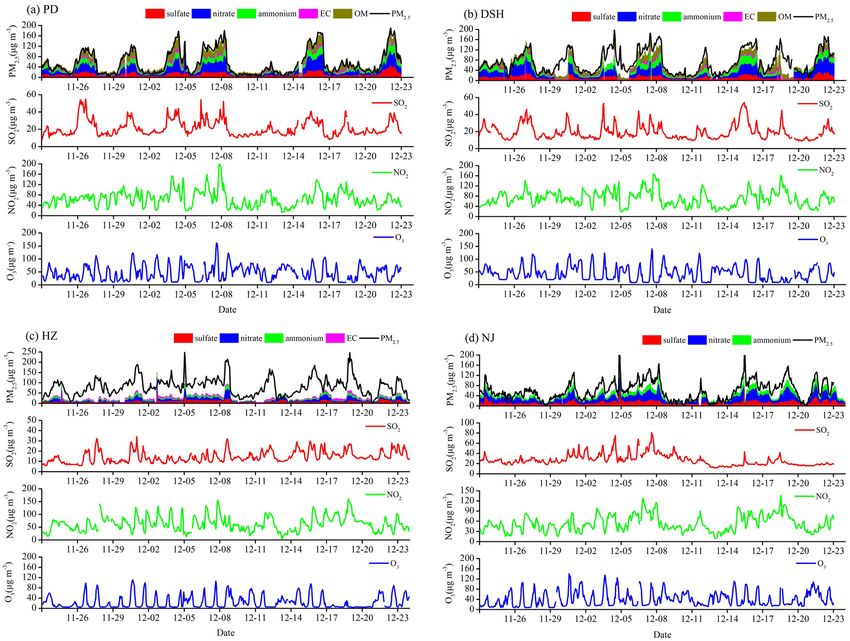
15136    M. Li et al.: Nonlinear responses of particulate nitrate to NOx emission controls in the megalopolises of China

   Nitrate formation involves complex multiphase chemical         trate by 3 %–14 % (Wang et al., 2014). Recent evidence from
reactions. In the daytime, nitrogen dioxide (NO2 ) reacts with    field observations (Fu et al., 2020) and numerical simulations
the hydroxyl radical (OH) to produce nitric acid (HNO3 ).         (Dong et al., 2014), however, has suggested that the NOx
With excess ammonium (NH3 ), low temperature and insuffi-         emission reduction in China could result in an increase of ni-
cient sulfuric acid, this reaction can proceed quickly and pro-   trate in winter through increased photochemical oxidants and
duce high ammonium nitrate (Seinfeld and Pandis, 2006). In        nocturnal N2 O5 chemistry but a decrease in other seasons. In
the nighttime, however, high-concentration NO2 reacts with        the next 5–10 years, SO2 emissions might level off in China,
ozone (O3 ) to produce the nitrate radical (NO3 ) and dini-       while NOx emissions will become stringently controlled to
trogen pentoxide (N2 O5 ). The heterogeneous hydrolysis of        ensure further air quality improvements (Zheng et al., 2018).
N2 O5 on wet particles is the main pathway for nocturnal ni-      Accurately understanding the nonlinear aerosol and photo-
trate formation (56 %–97 %) (He et al., 2018; Pathak et al.,      chemistry feedbacks is crucial to resolve the emerging ni-
2011; Xue et al., 2014).                                          trate pollution and to establish reasonable air pollution con-
   Nitrate chemistry is not only related to the abundance         trol strategies in China.
of its precursor NOx , but it is also supported by the atmo-         To address this issue, we use comprehensive measure-
spheric oxidants (e.g., OH and O3 ) produced from the photo-      ments and a regional meteorology–chemistry model com-
chemical reactions of NOx and volatile organic compounds          bined with hypothetical NOx emission scenarios to estab-
(VOCs) (Meng et al., 1997). Using a box model, some stud-         lish the nonlinear response relationships between particulate
ies have determined that the relationship between particu-        nitrate and NOx emission controls in the megalopolises of
late nitrate and NOx emissions is nonlinear depending on          China. The model configurations, numerical designs and ob-
the ozone chemical sensitivity regime (Pun and Seigneur,          servational data are presented in Sect. 2. Section 3 discusses
2001; Nguyen and Dabdub, 2002). Pun and Seigneur (2001)           the results. Finally, a summary is presented in Sect. 4.
showed that the daytime HNO3 production was more sensi-
tive to the concentrations of atmospheric oxidants and that
in the VOC-limited regime the decrease of HNO3 produc-            2     Materials and methods
tion due to the NOx emission control might be offset by
the increase of OH. Nguyen and Dabdub (2002) calculated           2.1    Model setup and experimental designs
the detailed isopleth between nitrate and NOx emissions;
they found that the reduction of NOx emissions resulted           This study uses the Weather Research and Forecasting-
in a decrease of nitrate in the NOx -limited regime, and an       Chemistry (WRF-Chem) model version 4.1 developed by
increase of nitrate under extreme conditions in the VOC-          Grell et al. (2005) to simulate the regional meteorology and
limited regime. Despite that, the single-site box model results   atmospheric chemistry. The mesoscale meteorology and air
could not distinguish the regional differences among chemi-       quality simulations of WRF-Chem have been improved in
cal regimes; the basic hypotheses in box models to predict ni-    terms of incorporating the satellite-derived land surface pa-
trate production are also unreasonable in the real atmosphere.    rameters (Li et al., 2014, 2017) and optimizing the SIA for-
   As an important precursor for both fine particles and          mation pathways enhanced by mineral aerosols (M. M. Li
ozone, strict control of NOx emissions has started in China       et al., 2019; X. Huang et al., 2014).
since the 12th Five-Year Plan was established (Zheng et al.,         The modeling domain covers two main megalopolises
2018). A confounding factor is that, for most cities in China,    of China and its adjacent areas – the Beijing–Tianjin–
the production of O3 is usually limited by VOCs (Xie et al.,      Hebei (BTH) region and the Yangtze River Delta (YRD) re-
2014; Dong et al., 2014; Liu et al., 2010). The control of NOx    gion (Fig. 1). The modeling framework is configured with
emissions has therefore resulted in an increase of surface O3     81 × 86 grid cells at 25 km horizontal resolution. The model
concentrations in recent years (Li et al., 2021a; K. Li et al.,   is run with an 84 h model cycle, with the first 12 h discarded
2019; Kalsoom et al., 2021), implying complex impacts on          as spin-up time and model outputs of each model cycle to
nitrate formation. Li et al. (2021a) and Liu and Wang (2020)      provide chemical initial conditions for the subsequent over-
examined the influencing factors on the surface O3 trends         lapping 84 h simulation. The 6 h, 1◦ × 1◦ National Centers
in China from 2013 to 2017 using regional chemical mod-           for Environmental Prediction Final (NCEP/FNL) analysis
els. They highlighted that the control of NOx emissions ex-       fields are regularly input for the model initial and lateral
plained 11 %–35 % of the increased O3 due to the nonlin-          boundary meteorological conditions.
ear NOx –VOC–O3 chemistry and that for most regions the              The model physical configurations include the YSU
magnitudes could be comparable to those resulting from the        boundary layer scheme (Noh et al., 2003), the RRTMG ra-
meteorological influences and aerosol effects. Some simu-         diation scheme (Iacono et al., 2008), the Noah land surface
lations suggested that the NOx emission increase in 2005–         scheme (Ek et al., 2003) and the Lin microphysics scheme
2012 resulted in an increase of nitrate by 3.4 % yr−1 in east-    (Lin et al., 1983). We have updated the land cover type and
ern China (Geng et al., 2017; Wang et al., 2013), and the         vegetation data in the WRF mesoscale model with the lat-
following NOx emission control resulted in a decrease of ni-      est land surface parameters derived from the Moderate Res-

Atmos. Chem. Phys., 21, 15135–15152, 2021                                         https://doi.org/10.5194/acp-21-15135-2021
M. Li et al.: Nonlinear responses of particulate nitrate to NOx emission controls in the megalopolises of China              15137

Figure 1. WRF-Chem domain configuration and observational stations. Black crosses: surface weather stations; red dots: CNEMC routine
air quality monitoring stations; red stars: surface supersites in YRD.

olution Imaging Spectroradiometer (MODIS; Li et al., 2014,          main unchanged at the usual levels in 2016. Simulation
2017).                                                              N0 is the same as B0, but it only considers the gas-phase
   The atmospheric chemistry is simulated using the Car-            oxidation production of HNO3 (NO2 + OH → HNO3 ) and
bon Bond Mechanism version Z (CBMZ) (Zaveri and Peters,             its subsequent partitioning to the aerosol phase of nitrate
1999) gas-phase chemistry module coupled with the four-             in WRF-Chem. The B0 and N0 simulations are combined
bin sectional Model for Simulating Aerosol Interactions and         to distinguish the contributions of gas-phase oxidation and
Chemistry (MOSAIC) (Zaveri et al., 2008). The aqueous-              heterogeneous pathways (i.e., uptakes of N2 O5 , NO3 and
phase chemistry is based on the Carnegie Mellon University          NO2 ) for the formation of nitrate aerosols during the warm
(CMU) scheme including 50 species and more than 100 re-             and cold seasons. A group of sensitivity scenarios (CNOx −N
actions (Fahey and Pandis, 2001). Formation of SIA in the           (N = 10 %, 20 %, . . . , and 80 %)) are designed with the per-
default WRF-Chem model accounts for the gas-phase oxida-            turbed anthropogenic NOx emissions in China reduced by
tion of SO2 and NO2 and aqueous-phase oxidation of SO2              10 %, 20 %, . . . , and 80 %, respectively. The differences be-
by hydrogen peroxide (H2 O2 ) and O3 in cloud. We have op-          tween B0 and CNOx −N simulations are calculated to illus-
timized the SIA formation pathways by including the aque-           trate the responses of particulate pollution in China’s megac-
ous SO2 oxidation catalyzed by mineral ions and heteroge-           ities to the NOx emission reduction scenarios. Another sim-
neous uptakes of SO2 , NO2 , NO3 , N2 O5 and HNO3 on min-           ulation (E1) is designed with the anthropogenic emissions
eral aerosols in the MOSAIC aerosol module (M. M.Li et al.,         of NOx in China set to the 2012 levels to show the impacts
2019; X. Huang et al., 2014).                                       of 2012–2016 NOx control strategy on particulate pollution.
   Anthropogenic emissions are adopted from the 2016                Additionally, in order to evaluate the effectiveness of multi-
Multi-resolution Emission Inventory for China (MEIC) and            pollutant cooperative controls, three series of simulations
the 2010 MIX-Asia emission inventory for regions outside            (CSO2 −N , CNH3 −N and CVOCs−N , N = 20 %, 40 %, 60 %
of mainland China developed by Tsinghua University (http://         and 80 %) are also supplemented with the anthropogenic
meicmodel.org, last access: December 2020). Biogenic emis-          emissions of SO2 , NH3 and VOCs in China reduced by
sions are calculated online using the Model of Emissions of         20 %, 40 %, 60 % and 80 %, respectively. The differences
Gases and Aerosols from Nature (MEGAN; Guenther et al.,             between B0 and CNOx −N /CSO2 −N /CNH3 −N /CVOCs−N sim-
2006).                                                              ulations are calculated to illustrate the responses of nitrate
   A series of WRF-Chem simulations is designed, as sum-            pollution in China’s megacities to the multi-pollutant coop-
marized in Table 1. In the baseline simulation (denoted as          erative controls.
the B0 scenario), the anthropogenic emissions in China re-

https://doi.org/10.5194/acp-21-15135-2021                                          Atmos. Chem. Phys., 21, 15135–15152, 2021
15138 M. Li et al.: Nonlinear responses of particulate nitrate to NOx emission controls in the megalopolises of China
Table 1. The emission scenarios in WRF-Chem numerical experiments.
Simulation scenarios Descriptions
B0 Base simulation under the 2016 emission conditions.
CNOx −N (N = 10 %, 20 %, . . . and 80 %) Same as B0, but anthropogenic NOx emissions are reduced by 10 %, 20 %, . . .
and 80 %, respectively, relative to the usual levels in 2016.
CSO2 −N (N = 20 %, 40 %, 60 % and 80 %) Same as B0, but anthropogenic SO2 emissions are reduced by 20 %, 40 %, 60 %
and 80 %, respectively, relative to the usual levels in 2016.
CNH3 −N (N = 20 %, 40 %, 60 % and 80 %) Same as B0, but anthropogenic NH3 emissions are reduced by 20 %, 40 %, 60 %
and 80 %, respectively, relative to the usual levels in 2016.
CVOCs−N (N = 20 %, 40 %, 60 % and 80 %) Same as B0, but anthropogenic VOC emissions are reduced by 20 %, 40 %,
60 % and 80 %, respectively, relative to the usual levels in 2016.
N0 Same as B0, but it only considers the NO2 + OH gas-phase oxidation pathway
for the production of nitrate aerosol.
E1 Same as B0, but anthropogenic NOx emissions are replaced using the MEIC
inventory in 2012.
For all simulation scenarios, two month-long periods dur- soluble ions (sulfate, nitrate, ammonium, sodium, chlo-
ing the Campaign on Air Pollution and Urban Meteorol- ride, potassium, calcium and magnesium), carbonaceous
ogy in Yangtze River Delta (CAPUM-YRD) – 15 August to aerosols (elemental carbon (EC) and organic carbon (OC))
16 September (Period I) and 24 November to 26 December and gaseous pollutants (SO2 , NO2 , CO and O3 ) during the
(Period II) in 2016 – are simulated to represent the warm and CAPUM-YRD. Details for the methods and data at the four
cold seasons, respectively (Shu et al., 2019). The complete supersites are described in Shu et al. (2019).
simulation consists of 13 84 h model cycles, with the first 6 d
as a spin-up for chemistry and the remaining model outputs
for analysis. 3 Results and discussions
3.1 Model weather and chemical validation
2.2 Weather and air pollutant data
Model evaluations indicate that the WRF-Chem model is
Surface meteorological observations at 186 land-based auto- able to simulate the weather and atmospheric pollution char-
matic stations across China (Fig. 1) are collected for model acteristics in China. The simulated magnitudes of surface
meteorological validation, including hourly data of 2 m air temperature by WRF-Chem in general agree with actual
temperature, 2 m relative humidity and 10 m wind speed. observations, with a correlation efficient (R) of 0.89 and
These data are archived at the U.S. National Climatic Data 0.94 and a normalized mean bias (NMB) of −0.55 % and
Center (NCDC) (Smith et al., 2011). −0.80 %, respectively, in Period I and Period II (Table 2).
Air pollutant data at the national air quality monitoring Underestimation of relative humidity (−5.65 % in Period I
network and regional supersites of China (Fig. 1) are used and −6.56 % in Period II) is common in the WRF simula-
for model chemical validation. This nationwide monitoring tion, and it might be attributed to the influence of the bound-
network contains 1597 sites covering 454 cities in main- ary layer parameterization on the weather forecast (Bhati and
land China, as shown in Fig. 1. Six routine air pollutants Mohan, 2018; Gomez-Navarro et al., 2015). Clear overesti-
including PM2.5 , particulate matter with aerodynamic diam- mation of wind speed (23.72 % in Period I and 40.64 % in
eter less than 10 µm (PM10 ), SO2 , NO2 , carbon monoxide Period II) might be because of the unresolved topography in
(CO) and O3 are monitored and reported hourly by the Chi- WRF (Jimenez et al., 2013; Li et al., 2014).
nese National Environmental Monitoring Center (CNEMC) The predicted concentrations of routine air pollutants also
network (available at http://www.cnemc.cn, last access: De- accurately capture the spatial and seasonal patterns of ob-
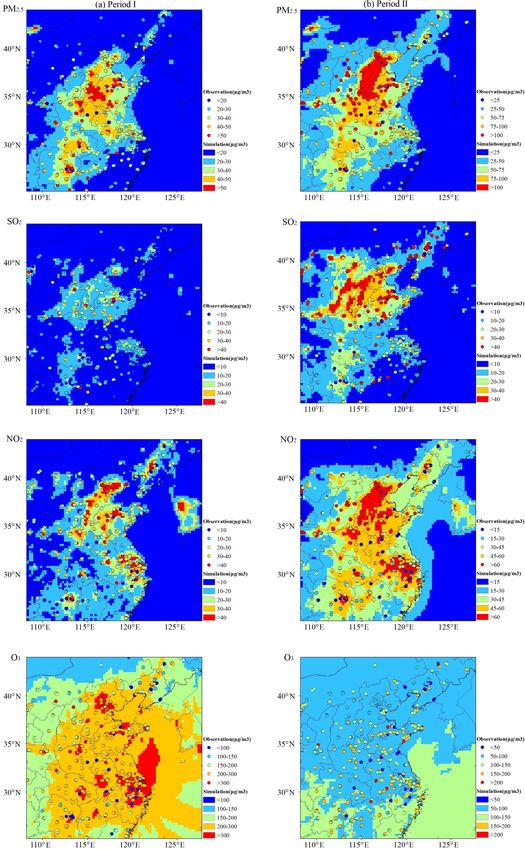
cember 2020). served surface PM2.5 , SO2 , NO2 and O3 levels in both sea-
Additionally, four comprehensive atmospheric environ- sons (Fig. 2). Both simulations and observations display
ment supersites in YRD including Dianshanhu (DSH; high air pollutant concentrations in the vicinity of the North
31.1◦ N, 121.0◦ E), Pudong (PD; 31.2◦ N, 121.5◦ E), Nan- China Plain (NCP) and eastern China but with higher O3 lev-
jing (NJ; 32.1◦ N, 118.8◦ E) and Hangzhou (HZ; 30.3◦ N, els in the warm season and oppositely higher PM2.5 and
120.2◦ E) measured the mass concentrations of PM2.5 , water- other gaseous pollutant concentrations in winter. The model
Atmos. Chem. Phys., 21, 15135–15152, 2021 https://doi.org/10.5194/acp-21-15135-2021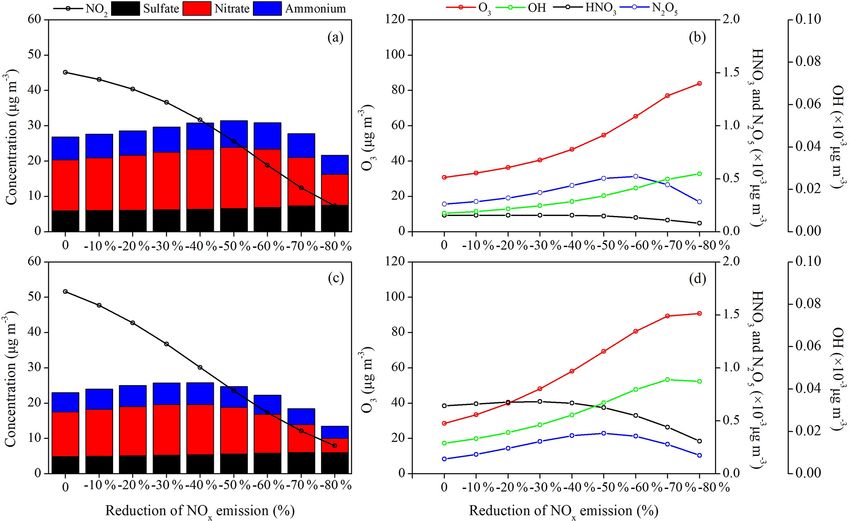
M. Li et al.: Nonlinear responses of particulate nitrate to NOx emission controls in the megalopolises of China 15139
Table 2. Statistical evaluations of the model meteorological performance.
Variable Obs Sim Ra MB a NMB a ME a RMSE a
Period I (15 Aug to 16 Sep)
Temperature (◦ C) 24.04 23.91 0.89 −0.13 −0.55 % 1.98 2.63
Humidity (%) 70.89 66.88 0.78 −4.01 −5.65 % 11.07 14.67
Wind speed (m s−1 ) 2.46 3.04 0.50 0.58 23.72 % 1.38 1.83
Period II (24 Nov to 26 Dec)
Temperature (◦ C) 3.43 3.40 0.94 −0.03 −0.80 % 2.18 2.83
Humidity (%) 69.85 65.27 0.63 −4.58 −6.56 % 13.51 17.88
Wind speed (m s−1 ) 2.61 3.66 0.55 1.06 40.64 % 1.70 2.23
a R : correlation coefficient; MB: mean bias; NMB: normalized mean bias; ME: mean error; RMSE: root mean square
error.
Table 3. Statistical evaluations of the model chemical performance.
Variable Obs Sim MB NMB Obs Sim MB NMB
Period I Period II
PM2.5 36.88 33.22 −3.66 −9.92 % 91.59 64.28 −27.31 −29.82 %
SO2 17.65 16.51 −1.14 −6.46 % 41.45 29.80 −11.65 −28.11 %
NO2 28.53 33.23 4.70 16.47 % 53.01 54.28 1.27 2.40 %
Daily-maximum O3 237.45 255.77 18.32 7.72 % 125.62 86.61 −39.01 −31.05 %
statistical evaluations show a mean bias (MB) of −3.66, dation of SO2 by NO2 on alkaline aerosols under humid con-
−1.14, 4.70 and 18.32 µg m−3 and a NMB of −9.92, −6.46, ditions (Wang et al., 2016; Cheng et al., 2016).
16.47 and 7.72 % for PM2.5 , SO2 , NO2 and O3 in Period I
and a relatively larger MB of −27.31, −11.65, 1.27 and 3.2 Air pollution and aerosol composition
−39.01 µg m−3 and a NMB of −29.82, −28.11, 2.40 and characteristics
−31.05 % in Period II, respectively (Table 3). The uncer-
tainty in emissions data, the absence of secondary organic Chemical composition analyses of major gaseous and par-
aerosol in MOSAIC aerosol chemistry or the simulated wind ticulate air pollutants suggest large seasonal variations of air
errors (Table 2) may be responsible for the larger atmo- pollution characteristics in China (Fig. 2). Mainly emitted
spheric chemical biases in winter, which has been extensively from combustion sources, atmospheric pollutants accumulate
discussed in some studies (Zhao et al., 2016; Li et al., 2021a). in the densely industrialized and populated megalopolises
As the most important components of PM2.5 , reasonable of China, with a hotspot along Beijing, Hebei, Shandong
representation of SIA is imperative to the PM2.5 simulation. and their adjacent cities frequently exceeding China’s Na-
Evaluations with measurements of PM2.5 components at the tional Ambient Air Quality Standards. The average concen-
four supersites of eastern China show that the model per- trations of surface PM2.5 , SO2 , NO2 and daily-maximum O3
forms reasonably in simulating the seasonal variations and in China’s routine air quality monitoring network are 33.8,
proportions of aerosol species in PM2.5 , but it is biased low 15.8, 26.5 and 223.2 µg m−3 for Period I and 80.2, 34.7,
by 10 %–40 % in simulating the magnitudes of SIA concen- 47.7 and 131.4 µg m−3 for Period II. The surface PM2.5 , SO2
trations (Fig. 3). The model underestimation is −1.8, −2.2 and NO2 concentrations show obvious increases by 137.6 %,
and −2.2 µg m−3 for sulfate, nitrate and ammonium, respec- 119.2 % and 80.2 % during winter compared to those of the
tively, in Period I and −2.6, −4.3 and −3.4 µg m−3 in Pe- summer–autumn period (Period I). The maximum surface
riod II. The model also captures the large change of N/S ratio PM2.5 concentration recorded in the winter period was more
from the warm to cold seasons, that increases from 0.4 in Pe- than 600 µg m−3 , which is the highest value ever recorded in
riod I to 1.6 in Period II. Our previous work (Li et al., 2019) 2016 and led to the “orange” air quality alert.
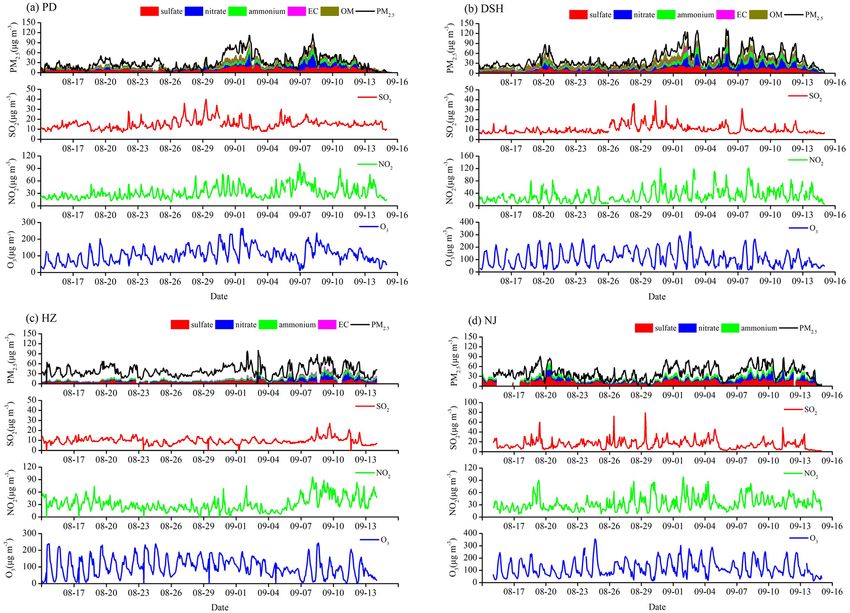
has confirmed that the consideration of the optimized aque- The further analyses of PM2.5 mass concentrations, ma-
ous and heterogeneous SIA formation pathways in WRF- jor PM2.5 components and gases at the four supersites in
Chem significantly reduces the model biases by 41.4 % for YRD are presented in Figs. 4–5. Organic matter (OM) is
sulfate and 44.6 % for nitrate during the CAPUM-YRD of obtained by multiplying the OC concentrations by a fac-
2016. Recent studies highlighted that the remaining SIA sim- tor of 1.6, mainly accounting for the hydrogen and oxygen
ulation biases may be attributed to the missing aqueous oxi- masses in OM. The measured SIA concentrations exhibit
https://doi.org/10.5194/acp-21-15135-2021 Atmos. Chem. Phys., 21, 15135–15152, 2021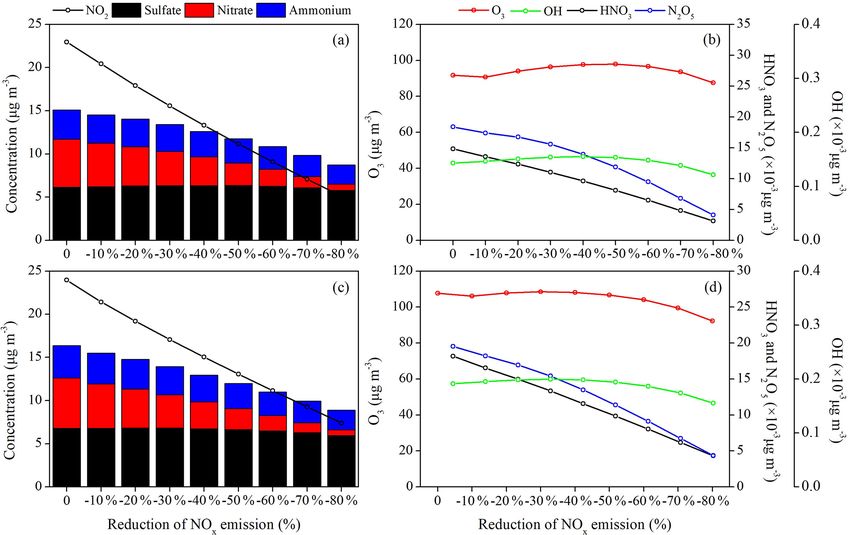
15140     M. Li et al.: Nonlinear responses of particulate nitrate to NOx emission controls in the megalopolises of China

Figure 2. Spatial patterns of the surface average PM2.5 , NO2 , SO2 and daily-maximum O3 concentrations in Period I (a) and Period II (b)
from the WRF-Chem modeling (shaded contours) and routine air quality observations (dots).

Atmos. Chem. Phys., 21, 15135–15152, 2021                                               https://doi.org/10.5194/acp-21-15135-2021
M. Li et al.: Nonlinear responses of particulate nitrate to NOx emission controls in the megalopolises of China               15141

Figure 3. Comparisons of surface PM2.5 components from WRF-Chem simulations and observations in Period I (a) and Period II (b) at the
four supersites in YRD.

Figure 4. Observed aerosol composition and gaseous pollutant concentrations at the four supersites during Period I.

high levels, with average values of 18.8 µg m−3 for Period I            PM2.5 in the two periods. The proportions of sulfate, nitrate
and 37.1 µg m−3 for Period II. The three SIA components                 and ammonium in total PM2.5 range from 13.5 %–28.9 %,
together account for 32.3 %–57.4 % (48.6 % on average)                  9.4 %–15.5 % and 9.4 %–14.9 % at the four supersites for Pe-
and 27.7 %–70.9 % (56.9 % on average) of the total PM2.5                riod I and 9.2 %–20.3 %, 11.5 %–32.1 % and 7.0 %–19.8 %
mass concentrations and become the primary components of                for Period II, respectively. The strikingly higher proportion

https://doi.org/10.5194/acp-21-15135-2021                                              Atmos. Chem. Phys., 21, 15135–15152, 2021
15142     M. Li et al.: Nonlinear responses of particulate nitrate to NOx emission controls in the megalopolises of China

Figure 5. Same as Fig. 4 but for Period II.

of nitrate than that of sulfate in PM2.5 during winter, with a   ambient humidity in winter also benefits the heterogeneous
N/S ratio of 1.6, is in accordance with recent observations      formation of SIA, leading to high NOR and SOR (Wang
during other winter haze periods in China (Shao et al., 2018;    et al., 2012).
Zhang et al., 2018; Zhang et al., 2019). They emphasized that       Figure 6 illustrates the contributions of gas-phase oxida-
since the enactment of the Clean Air Action Plan in 2013,        tion and heterogeneous reactions for the nitrate production
the PM2.5 components have changed clearly, with decreas-         calculated from B0 and E0 simulations. It is shown that on a
ing contributions from coal combustion.                          daily basis the gas-phase oxidation production of HNO3 and
   The high proportions of sulfate and nitrate in PM2.5          its subsequent partitioning to the aerosol phase is the princi-
could be related to the high oxidation rates of SO2 and          pal formation route for particulate nitrate, with the average
NO2 . The observed average values of sulfur oxidation ratio      contributions of 60.2 % for BTH and 91.7 % for YRD in Pe-
(SOR = [SO2−            2−
              4 ]/([SO4 ] + [SO2 ])) and nitrogen oxidation      riod I and 75.1 % for BTH and 85.9 % for YRD in Period II.
ratio (NOR = [NO3 ]/([NO−
                    −
                              3 ] + [NO2 ])) are 0.41 and 0.13   The heterogeneous hydrolyses of N2 O5 and other nitroge-
in Period I and 0.33 and 0.21 in Period II. In contrast, the     nous gases (calculated as the model differences between B0
observed SOR is generally higher in summer–autumn than           and N0 simulations) contribute to the remaining nitrate, par-
winter, opposite to that of NOR, indicating the enhanced for-    ticularly in BTH with high aerosol loading. These calculated
mation of nitrate in winter. Shu et al. (2019) also noted sim-   results (60.2 %–91.7 % for NO2 + OH oxidation and 8.3 %–
ilar seasonal distinctions for SOR and NOR in YRD. They          39.8 % for heterogeneous pathways) are in line with previous
attributed the weakened conversion from NO2 to nitrate in        assessments in China and globally. Alexander et al. (2009)
summer to the volatility and evaporative loss of nitrate (Sun    reported that the global tropospheric nitrate burden is dom-
et al., 2012). The sharp increase of particles and moderate      inated by NO2 + OH (76 %), followed by N2 O5 hydrolysis

Atmos. Chem. Phys., 21, 15135–15152, 2021                                        https://doi.org/10.5194/acp-21-15135-2021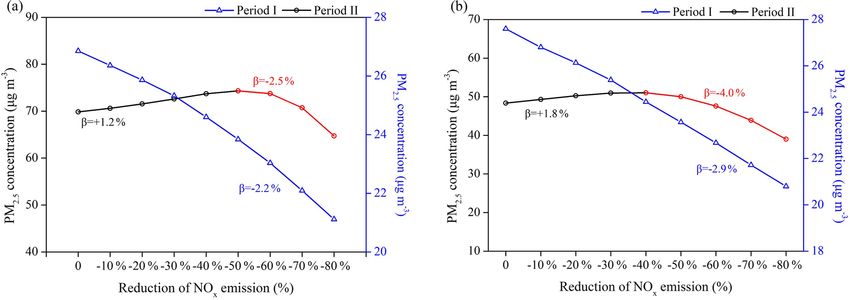
M. Li et al.: Nonlinear responses of particulate nitrate to NOx emission controls in the megalopolises of China           15143

                                                                      In Period I (August–September), the PM2.5 –NOx re-
                                                                   sponses are closer to a linear function, reflecting a stronger
                                                                   sensitivity to the NOx emission changes in the warm season.
                                                                   The surface PM2.5 concentrations decrease almost linearly
                                                                   as we gradually reduce NOx emissions in China, with the
                                                                   average β values of −2.2 % in BTH and −2.9 % in YRD.
                                                                   However, the PM2.5 –NOx emission responses in Period II
                                                                   (November–December) display strong nonlinearity and are
                                                                   analogous to a quadratic parabola distribution for both re-
                                                                   gions. The NOx emission reductions within the first 50 %
                                                                   would even increase surface PM2.5 concentrations by +1.2 %
                                                                   averagely in BTH, and this β value increases to +1.8 % in
                                                                   YRD with the first 40 % reductions of NOx emissions. Sub-
                                                                   sequently, the PM2.5 responses shift towards a similar lin-
                                                                   ear pattern, with an average β value of −2.5 % in BTH and
Figure 6. Contributions of gas-phase oxidation and heterogeneous   −4.0 % in YRD.
production to the surface nitrate concentrations for the BTH and      The distinct forms of PM2.5 –NOx emission responses for
YRD regions in two seasons.                                        the warm and cold seasons are determined by the seasonal
                                                                   ozone chemical sensitivity regimes. The photochemical indi-
                                                                   cator of 1[O3 ]NOx /1[O3 ]VOCs with a critical value of 1.0
(18 %), but recent results suggested that N2 O5 hydrolysis
                                                                   is used to investigate the season-varying ozone sensitivity
was as important as NO2 + OH (both 41 %) for global ni-
                                                                   in China, which is calculated as the ratio of ozone concen-
trate production (Alexander et al., 2020). In major Chinese
                                                                   tration changes under 20 % NOx emission reduction to that
cities, it was estimated that the conversion of NOx to nitrate
                                                                   under 20 % VOC emission reduction (Fig. S1 in the Sup-
was dominated by NO2 + OH oxidation in Shanghai, with a
                                                                   plement). The results indicate a strong VOC-limited ozone
mean contribution of 55 %–77 % in total and an even higher
                                                                   chemistry across China during winter while either a VOC-
contribution (84 %–92 %) in summer (He et al., 2020). In the
                                                                   limited regime over a large portion of the NCP and east-
NCP, the nitrate contribution of heterogeneous pathways was
                                                                   ern China or a NOx -limited regime in northern and western
about 30.8 % (Liu et al., 2020) or even comparable to the
                                                                   China during summer–autumn, as also indicated by previ-
partitioning of HNO3 (Wang et al., 2019; H. C. Wang et al.,
                                                                   ous studies (Xie et al., 2014; Dong et al., 2014; Liu et al.,
2017; Luo et al., 2021). The nitrate formation from hetero-
                                                                   2010). We find larger O3 and OH production under the NOx
geneous pathways is moderately underestimated in the opti-
                                                                   emission reduction conditions in both seasons (Figs. 8 and 9),
mized WRF-Chem model of this study, possibly due to the
                                                                   particularly in Period II (November–December), with an av-
uncertainties of heterogeneous uptake coefficients and un-
                                                                   erage increase rate of +14.7 % and +18.5 % in BTH and
clear reaction mechanisms applied in the model (M. M. Li
                                                                   +25.2 % and +23.1 % in YRD per 10 % reduction of NOx
et al., 2019; Xue et al., 2016; He et al., 2014).
                                                                   emissions. The SIA formation chemistry is highly limited
3.3     Nonlinear responses of nitrate to NOx emissions            by atmospheric oxidants produced from the NOx –VOC–O3
        and their policy implications                              photochemical cycles. The nonlinear O3 –NOx responses in-
                                                                   dicate a rather complicated aerosol and photochemistry feed-
3.3.1    PM2.5 –NOx and O3 –NOx responses in the warm              back in megacities.
         and cold seasons
                                                                   3.3.2   Nonlinear responses of particulate nitrate to NOx
NOx is key in atmospheric chemistry and serves as an im-                   emissions
portant precursor for both ozone and secondary aerosols. We
conduct a series of simulations with perturbed NOx emis-           The SIA formation is basically driven by the atmospheric ox-
sions to assess the responses of PM2.5 mass concentrations         idant levels, and a reduction of NOx emissions may have
to NOx emissions in two megalopolises of China (Fig. 7).           counterintuitive effects on SIA components by controlling
The WRF-Chem simulation results show that the responses            the atmospheric oxidant levels. The calculated SIA com-
of surface PM2.5 concentrations to NOx emissions vary in           ponents for each emission scenario in both months show
different seasons and display strong nonlinear behavior in         that the surface nitrate aerosols can be substantially de-
winter. To better quantify their effectiveness, we define the      creased/increased with reducing NOx emissions, but the sul-
NOx emission control efficiency (β), which denotes the per-        fate and ammonium concentrations have moderately smaller
centage changes of surface PM2.5 or its component concen-          changes (Figs. 8–10).
trations in response to the successive 10 % reduction of NOx          Response of sulfate to the NOx emissions is more pre-
emissions.                                                         dictable and determined by the changes of atmospheric ox-

https://doi.org/10.5194/acp-21-15135-2021                                        Atmos. Chem. Phys., 21, 15135–15152, 2021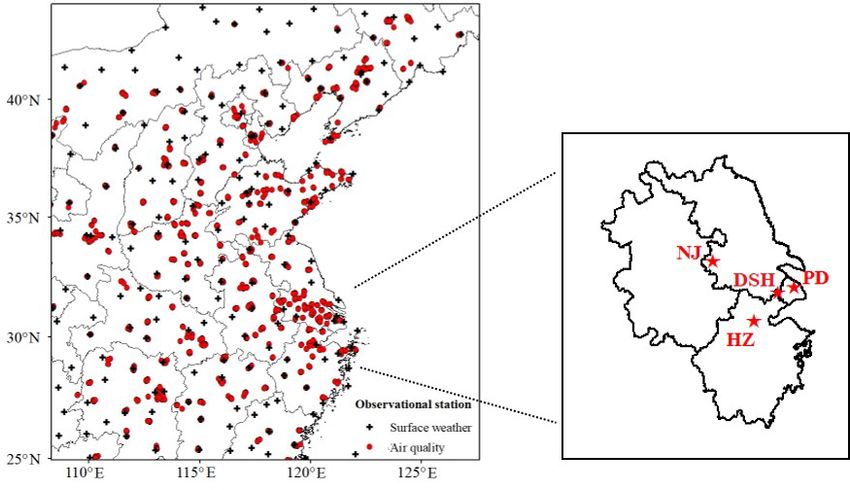
15144    M. Li et al.: Nonlinear responses of particulate nitrate to NOx emission controls in the megalopolises of China

Figure 7. Responses of surface PM2.5 concentrations to the NOx emission reduction scenarios in (a) BTH and (b) YRD. The calculated NOx
emission control efficiency (β) is also marked in the figure.

Figure 8. Responses of the surface concentrations of SIA components and key atmospheric trace gases (NO2 , O3 , OH, HNO3 and NO3 ) to
the NOx emission reduction scenarios in (a, b) BTH and (c, d) YRD during Period I.

idant levels since the conversion of SO2 to sulfate is partly        tion in Eq. (1). The β values for surface sulfate change by
driven by OH in the gas phase and by dissolved H2 O2 or              −0.7 %–+1.2 % in BTH and −1.5 %–+0.2 % in YRD under
O3 in the presence of fog or cloud. In Period I (August–
September), the sulfate–NOx response follows a gradual
quadratic parabola distribution as that of O3 –NOx and OH–
NOx response curves (Figs. 8 and 10), with a fitted func-

Atmos. Chem. Phys., 21, 15135–15152, 2021                                             https://doi.org/10.5194/acp-21-15135-2021
M. Li et al.: Nonlinear responses of particulate nitrate to NOx emission controls in the megalopolises of China 15145
Figure 9. Same as Fig. 8 but for Period II.
each NOx emission reduction scenario. HNO3 (−16.7 %) and N2 O5 (−8.9 %) concentrations.
[NO− 2
3 ] = −34.51ENOx − 23.81ENOx + 13.2
[SO2− 2
4 ] = − 2.41ENOx − 1.71ENOx + 6.1
in BTH (R 2 = 0.84)
in BTH (R 2 = 0.93)
[NO− 2
3 ] = −36.51ENOx − 19.61ENOx + 12.0
[SO2− 2
4 ] = − 2.31ENOx − 0.91ENOx + 6.8
in YRD (R 2 = 0.99) (2)
in YRD (R 2 = 0.99), (1)
[NH+
4]=
2
−9.11ENOx
− 6.91ENOx + 6.2
where [SO2− 4 ] is the surface mean concentration of sulfate in BTH (R 2 = 0.78)
(µg m−3 ), and 1ENOx is the percentage change of NOx emis-
sions (%). [NH+ 2
4 ] = −10.51ENOx − 6.21ENOx + 5.3
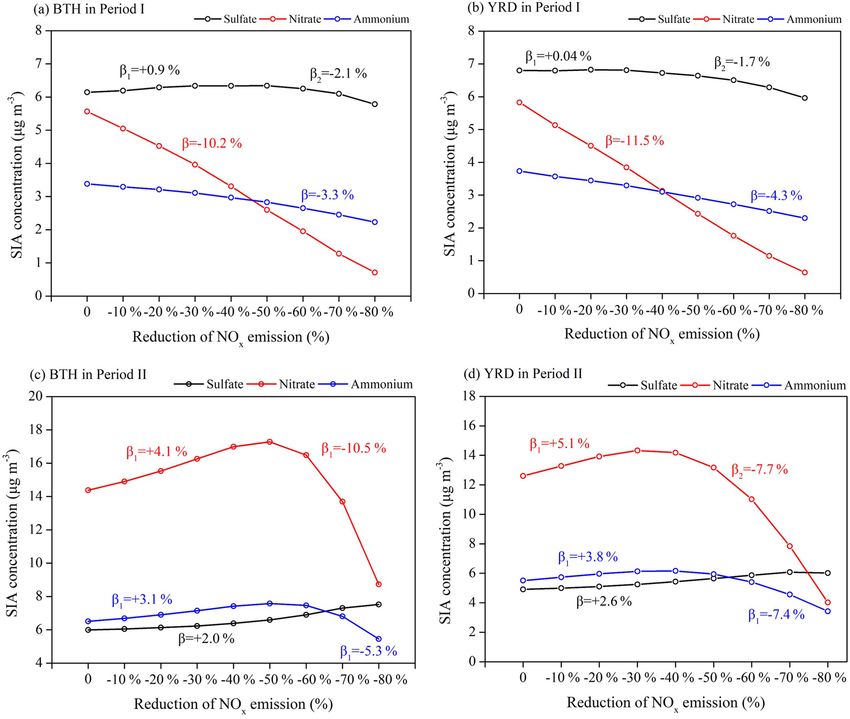
As expected, the production of nitrate reflects a strong sen- in YRD (R 2 = 0.98), (3)
sitivity to NOx , and it decreases linearly with the NOx emis-
sion control, with an average β value of −10.2 % in BTH where [NO− +
3 ] and [NH4 ] are the surface mean concentra-
−3
tions (µg m ) of nitrate and ammonium, respectively.
and −11.5 % in YRD, which further leads to a decrease of
ammonium concentrations by −3.3 % in BTH and −4.3 % In Period II (November–December), we find opposite re-
in YRD (Figs. 8 and 10). The formation of nitrate mainly sults, with quadratic parabola distributions for the nitrate–
involves the NO2 + OH → HNO3 gas-phase oxidation and NOx response (Eq. 2) and the ammonium–NOx response
the heterogeneous hydrolysis of N2 O5 and other nitrogenous (Eq. 3) but linearly increasing sulfate concentrations (av-
gases. The strong sensibility of particulate nitrate in response erage β values of +2.0 % in BTH and +2.6 % in YRD;
to the NOx emission decreases can be explained by the syn- Figs. 9 and 10), leading to small PM2.5 changes in winter.
chronously suppressive production of its intermediate prod- Such nonlinear nitrate–NOx responses can be explained by
ucts HNO3 and N2 O5 . For example, when the NOx emission the substantially increased oxidants as we gradually reduce
is reduced by 20 %, the surface NO2 concentration in BTH NOx emissions in each scenario. It is noted that in winter
drops by 20.0 %, but the surface O3 and OH concentrations the nitrate–NOx response highly depends on the production
O3 NO2
increase slightly by 2.6 % and 5.3 % due to the reduction of of N2 O5 , which is produced from the NO2 −→ NO3 −→
NO+O3 titration reaction and the greater VOC availability in N2 O5 chemical reactions and is a crucial intermediate prod-
the warm season, leading to substantial reductions in surface uct for nitrate formation. Under the low NOx emission reduc-
https://doi.org/10.5194/acp-21-15135-2021 Atmos. Chem. Phys., 21, 15135–15152, 202115146 M. Li et al.: Nonlinear responses of particulate nitrate to NOx emission controls in the megalopolises of China
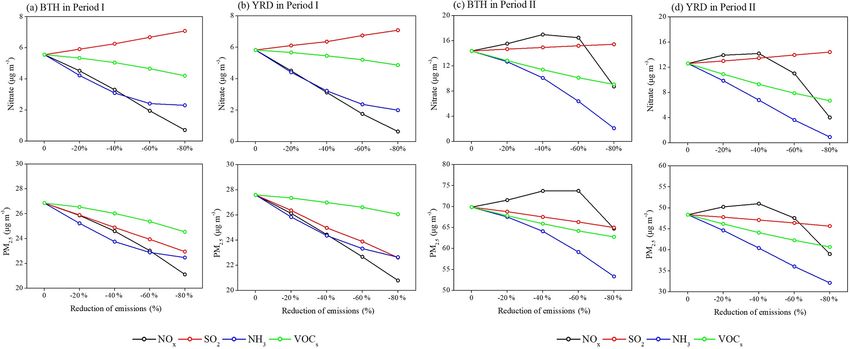
Figure 10. Responses of the surface concentrations of SIA components to the NOx emission reduction scenarios and their emission control
efficiencies in (a, b) Period I and (c, d) Period II.
tion conditions, the production of N2 O5 is more sensitive to These results reveal that the increase in atmospheric oxi-
the atmospheric oxidant concentrations. The significant in- dants in response to NOx emission control can offset the de-
creases of surface O3 in each NOx emission scenario in the creasing precursors concentrations and further enhance the
VOC-poor environment (Fig. 9b and d) lead to an enhance- formation of secondary nitrate, as recently found during the
ment of N2 O5 levels from 10 % to more than 100 %. In spite COVID-19 pandemic (Huang et al., 2020; Li et al., 2021b).
of the HNO3 concentration remaining nearly unchanged or
decreasing slightly by less than 5 % in response to NOx con- 3.3.3 Impacts of 2012–2016 NOx control strategy on
trol, nitrate is found to increase (average β values of +4.1 % particulate pollution
in BTH and +5.1 % in YRD), with higher N2 O5 produced
from the increased ozone introduced by attenuated titration. During the 12th Five-Year Plan period (2011–2015), a series
An inflexion point appears at the 30 %–50 % NOx emission of end-of-pipe pollutant controls (e.g., selective catalytic re-
reduction scenario, and a further reduction in NOx emissions duction techniques) were carried out for power, industry and
is predicted to cause −10.5 % and −5.3 % reductions of sur- transportation sectors. These measures effectively controlled
face particulate nitrate and ammonium for BTH and −7.7 % the national NOx emissions by 22.8 % from 2012 to 2016
and −7.4 % for YRD. (MEIC v1.3) in China. To quantify the effects of recent NOx
control measures on the levels of photochemical oxidants and
Atmos. Chem. Phys., 21, 15135–15152, 2021 https://doi.org/10.5194/acp-21-15135-2021M. Li et al.: Nonlinear responses of particulate nitrate to NOx emission controls in the megalopolises of China 15147
particulate nitrate, we conduct an additional simulation with need to consider NH3 emission controls when designing the
NOx emissions set to the levels of 2012 in E1. PM2.5 pollution mitigation strategies.
The model simulations (Fig. 11) suggest that reducing VOCs, which are not a direct precursor for SIA, are ef-
China’s NOx emissions alone from 2012 to 2016 leads to an fective in SIA controls due to their influences on the at-
average −24.9 % to −8.6 % decrease of NOx concentrations mospheric oxidation cycles (Tsimpidi et al., 2008; Womack
in the surface layer. As previously pointed out, the 2012– et al., 2019; Nguyen and Dabdub, 2002). Our results sug-
2016 NOx emission control measures led to increased O3 and gest that decreasing VOC emissions per 10 % would suppress
OH levels in winter, which offset the effectiveness of NOx the oxidation formation of nitrate and decrease the nitrate
emission reduction in alleviating winter nitrate. No obvious concentrations by −2.5 % in BTH and −1.7 % in YRD for
declines in the winter nitrate levels are observed and even in- Period I and −5.0 % in BTH and −6.3 % in YRD for Pe-
creases in some areas (+8.8 % in BTH and 14.4 % in YRD; riod II. The reduction of VOC emissions would result in a
Figs. S2 and S3 in the Supplement). As shown, the largest decrease of PM2.5 by −0.7 % during summer–autumn and
PM2.5 responses shift towards the southern Hebei and cen- −1.8 % during winter in the two megacities. Tsimpidi et al.
tral China provinces, where the wintertime PM2.5 concentra- (2008) also showed that the reduction of VOC emissions
tions are particularly high. The substantial emission changes caused a marginal increase of PM2.5 during summer in the
from 2012 to 2016 lower the PM2.5 air pollution by up to eastern United States, whereas it resulted in a decrease of at-
−1.8 % in BTH and −3.5 % in YRD for Period I and oppo- mospheric oxidant levels and 5 %–20 % reduction of both in-
sitely increase the surface PM2.5 by 2.4 % in BTH and 4.7 % organic and organic PM2.5 components during winter. Larger
in YRD for Period II. The past NOx emission control strat- and synchronized NOx and VOC emission controls are re-
egy leads to increased atmospheric oxidant levels and dete- quired to overcome the adverse effects of nonlinear photo-
riorated particulate pollution in winter due to the nonlinear chemistry and aerosol chemical feedbacks.
photochemistry and aerosol chemical feedbacks, without re- The SO2 emission reduction, although effective in reduc-
gard of the other emission control measures. This conclusion ing sulfate and PM2.5 , is not successful in regulating the ni-
is also supported by evidence from the recent field observa- trate pollution due to the chemical competition in nitrate and
tions (Fu et al., 2020). sulfate formations (Geng et al., 2017; Wang et al., 2013).
Changes in nitrate concentration are linearly associated with
the SO2 emission reductions, with the average β values
3.3.4 Responses of particulate nitrate to
of 2.9 % during summer–autumn and 1.3 % during winter.
multi-pollutant cooperative controls
Decreasing SO2 emissions is less effective (a β value of
−0.7 %) in mitigating the wintertime haze pollution because
In order to evaluate the effectiveness of multi-pollutant co- the benefit of SO2 reduction is partly offset by the significant
operative controls in China, three series of additional simu- increase of nitrate, demonstrating the critical role of multi-
lations (CSO2 −N , CNH3 −N and CVOCs−N ) are also designed pollutant cooperative controls. Lei et al. (2013) evaluated the
to show the responses of nitrate and PM2.5 pollution to the impacts of SO2 control strategies on nitrate and sulfate pro-
emission controls of NOx , SO2 , NH3 and VOCs, respectively. duction in the United States and also found that the compe-
The results (Fig. 12) show that atmospheric NH3 and VOCs tition for bases in nitrate and sulfate formation significantly
are effective in controlling the particulate nitrate pollution affects the nitrate concentrations.
for both seasons, whereas decreasing the SO2 and NOx emis- Our results emphasize that future nitrate and PM2.5 pollu-
sions may have counterintuitive effects on the concentration tion mitigation strategies should focus on reducing the chem-
levels of nitrate aerosols. ical precursors and key atmospheric oxidants involved in the
Atmospheric NH3 acts as a critical neutralizing species production of secondary aerosols. The recent “Three-Year
for SIA production and efficient haze mitigation (Liu et al., Action Plan for Winning the Blue Sky Defense Battle” calls
2019). According to the WRF-Chem simulation, reduction for stringent emission controls of NOx , SO2 , VOCs and NH3
of NH3 emissions may be effective in reducing the nitrate but without specific reduction targets. Such emission changes
component, with an average β value of −10.0 % in BTH would emphasize the need to jointly consider multi-pollutant
and −10.3 % in YRD for Period I and −8.3 % in BTH and emission controls for mitigating haze air pollution.
−11.5 % in YRD for Period II, primarily by suppressing
the ammonium nitrate formation. Quantitatively, a 10 % re-
duction in NH3 emissions can alleviate the PM2.5 pollution 4 Conclusions
by −2.7 % during summer–autumn and −3.2 % during win-
ter in the two Chinese megacities. Atmospheric chemistry Recent air pollution actions have significantly lowered the
modeling by Wen et al. (2021) also indicated that control- PM2.5 levels in China via controlling emissions of SO2 and
ling NH3 emissions in Beijing would significantly reduce the NOx but raised a new question of how effective the NOx
population-weighted PM2.5 concentrations by 6.2 %–21 %, emission controls can be in the mitigation of emerging ni-
with 60 %–100 % NH3 reductions in January, implying the trate and ozone air pollution. We use comprehensive mea-
https://doi.org/10.5194/acp-21-15135-2021 Atmos. Chem. Phys., 21, 15135–15152, 202115148 M. Li et al.: Nonlinear responses of particulate nitrate to NOx emission controls in the megalopolises of China Figure 11. Changes in the concentrations of surface PM2.5 , SIA components and key atmospheric trace (NO2 , O3 , HNO3 and N2 O5 ) due to the 2012–2016 NOx emission reductions in China, estimated as the differences between the base simulation and the E1 scenario. The units are parts per trillion (ppt) for HNO3 and N2 O5 and micrograms per cubic meter (µg m−3 ) for other chemical species. Figure 12. Responses of the surface nitrate (upper panels) and PM2.5 (bottom panels) concentrations to the emission reduction scenarios of NOx , SO2 , NH3 and VOCs during Period I (a, b) and Period II (c, d). Atmos. Chem. Phys., 21, 15135–15152, 2021 https://doi.org/10.5194/acp-21-15135-2021
M. Li et al.: Nonlinear responses of particulate nitrate to NOx emission controls in the megalopolises of China                  15149

surements and a regional meteorology–chemistry model with             Author contributions. ML developed the model code, designed the
optimized mechanisms to establish the nonlinear responses             numerical experiments and wrote the original draft. ZZ carried out
between particulate nitrate and NOx emission controls in the          the numerical experiments. QY provided and analyzed some of the
megalopolises of China.                                               data. MX, SL and BZ validated and analyzed the model results. TW
   Nitrate is an essential component of PM2.5 in eastern              and YH reviewed and revised the manuscript.
China, accounting for 9.4 %–15.5 % and 11.5 %–32.1 % of
the total PM2.5 mass for the warm and cold seasons, respec-
                                                                      Competing interests. The contact author has declared that neither
tively. We find that the efficiency of PM2.5 reduction is highly
                                                                      they nor their co-authors have any competing interests.
sensitive to NOx emissions, and it varies in different seasons
depending on the ozone chemical regimes. The reduction
of NOx emissions results in almost linearly lower PM2.5 by            Disclaimer. Publisher’s note: Copernicus Publications remains
−2.2 % in BTH and −2.9 % in YRD per 10 % reduction of                 neutral with regard to jurisdictional claims in published maps and
NOx emissions during summer–autumn, whereas it increases              institutional affiliations.
the atmospheric oxidant levels and leads to a rather com-
plicated response of the PM components in winter. Nitrate
is found to increase (average β values of +4.1 % in BTH               Acknowledgement. This study is funded by the National Nat-
and +5.1 % in YRD) in winter with higher N2 O5 intermedi-             ural Science Foundation of China (41975153, 42077192 and
ate produced from the increased ozone introduced by atten-            41775026), the National Key Basic Research Development Pro-
uated titration, despite the nearly unchanged or slightly de-         gram of China (2019YFC0214603 and 2020YFA0607802) and
creased HNO3 concentrations in response to NOx control. An            the Emory University–Nanjing University Collaborative Research
inflexion point appears at 30 %–50 % NOx emission reduc-              Grant.
tion, and a further reduction of NOx emissions is predicted to
cause −10.5 % reductions of particulate nitrate for BTH and
−7.7 % for YRD. In addition, the 2012–2016 NOx emission               Financial support. This research has been supported by the Na-
                                                                      tional Natural Science Foundation of China (grant nos. 41975153,
control strategy leads to −24.9 % to −8.6 % decreases of sur-
                                                                      42077192 and 41775026), the National Key Research and De-
face NOx concentrations and no changes or even increases
                                                                      velopment Program of China (grant nos. 2019YFC0214603 and
of wintertime nitrate in BTH (+8.8 %) and YRD (14.4 %).               2020YFA0607802) and the Emory University–Nanjing University
Our results also emphasize that atmospheric NH3 and VOCs              Collaborative Research Grant.
are effective in controlling the particulate nitrate pollution,
whereas decreasing the SO2 and NOx emissions may have
counterintuitive effects on nitrate aerosols. These results pro-      Review statement. This paper was edited by Maria Kanakidou and
vide insights for developing mitigation strategies for the            reviewed by two anonymous referees.
ubiquitous nitrate aerosols in the winter haze of China.

Data availability. The WRF-Chem model version 4.1 is
available at https://www2.mmm.ucar.edu/wrf/users/download/            References
get_source.html (last access: December 2020). The NCEP
FNL data are accessible in the National Center for Atmo-              Alexander, B., Hastings, M. G., Allman, D. J., Dachs, J., Thorn-
spheric Research (NCAR) Research Data Archive (RDA;                     ton, J. A., and Kunasek, S. A.: Quantifying atmospheric nitrate
http://rda.ucar.edu/datasets/ds083.2/, last access: December 2020).     formation pathways based on a global model of the oxygen iso-
The MEIC anthropogenic emission inventories are available at            topic composition (117 O) of atmospheric nitrate, Atmos. Chem.
http://www.meicmodel.org (last access: December 2020). The              Phys., 9, 5043–5056, https://doi.org/10.5194/acp-9-5043-2009,
surface weather data are accessible in the Integrated Surface           2009.
Database (https://www.ncdc.noaa.gov/isd/data-access, last access:     Alexander, B., Sherwen, T., Holmes, C. D., Fisher, J. A., Chen,
December 2020). The surface air pollutant and aerosol species data      Q., Evans, M. J., and Kasibhatla, P.: Global inorganic nitrate
are provided by the Chinese National Environmental Monitoring           production mechanisms: comparison of a global model with ni-
Center (http://www.cnemc.cn/en/, last access: December 2020) and        trate isotope observations, Atmos. Chem. Phys., 20, 3859–3877,
archived at https://doi.org/10.6084/m9.figshare.12818807.v1 (Li,        https://doi.org/10.5194/acp-20-3859-2020, 2020.
2020).                                                                Bhati, S. and Mohan, M.: WRF-urban canopy model evaluation for
                                                                        the assessment of heat island and thermal comfort over an urban
                                                                        airshed in India under varying land use/land cover conditions,
Supplement. The supplement related to this article is available on-     Geoscience Letters, 5, 27, https://doi.org/10.1186/s40562-018-
line at: https://doi.org/10.5194/acp-21-15135-2021-supplement.          0126-7, 2018.
                                                                      Cheng, Y. F., Zheng, G. J., Wei, C., Mu, Q., Zheng, B., Wang, Z.
                                                                        B., Gao, M., Zhang, Q., He, K. B., Carmichael, G., Poschl, U.,
                                                                        and Su, H.: Reactive nitrogen chemistry in aerosol water as a

https://doi.org/10.5194/acp-21-15135-2021                                            Atmos. Chem. Phys., 21, 15135–15152, 2021
15150 M. Li et al.: Nonlinear responses of particulate nitrate to NOx emission controls in the megalopolises of China source of sulfate during haze events in China, Science Advances, ondary aerosol contribution to particulate pollution during haze 2, e1601530, https://doi.org/10.1126/sciadv.1601530, 2016. events in China, Nature, 514, 218–222, 2014. Dong, X. Y., Li, J., Fu, J. S., Gao, Y., Huang, K., and Zhuang, G. Huang, X., Song, Y., Zhao, C., Li, M. M., Zhu, T., Zhang, Q., S.: Inorganic aerosols responses to emission changes in Yangtze and Zhang, X. Y.: Pathways of sulfate enhancement by natural River Delta, China, Sci. Total Environ., 481, 522–532, 2014. and anthropogenic mineral aerosols in China, J. Geophys. Res.- Ek, M. B., Mitchell, K. E., Lin, Y., Rogers, E., Grunmann, P., Ko- Atmos., 119, 14165–14179, 2014. ren, V., Gayno, G., and Tarpley, J. D.: Implementation of Noah Huang, X., Ding, A., Gao, J., Zheng, B., Zhou, D., Qi, X., Tang, land surface model advances in the National Centers for Environ- R., Wang, J., Ren, C., Nie, W., Chi, X., Xu, Z., Chen, L., Li, Y., mental Prediction operational mesoscale Eta model, J. Geophys. Che, F., Pang, N., Wang, H., Tong, D., Qin, W., Cheng, W., Liu, Res.-Atmos., 108, 8851, https://doi.org/10.1029/2002jd003296, W., Fu, Q., Liu, B., Chai, F., Davis, S., Zhang, Q., and He, K.: 2003. Enhanced secondary pollution offset reduction of primary emis- Fahey, K. M. and Pandis, S. N.: Optimizing model performance: sions during COVID-19 lockdown in China, Natl. Sci. Rev., 8, variable size resolution in cloud chemistry modeling, Atmos. En- nwaa137, https://doi.org/10.1093/nsr/nwaa137, 2020. viron., 35, 4471–4478, 2001. Iacono, M. J., Delamere, J. S., Mlawer, E. J., Shephard, M. Fu, X., Wang, T., Gao, J., Wang, P., Liu, Y. M., Wang, S. X., Zhao, W., Clough, S. A., and Collins, W. D.: Radiative forcing by B., and Xue, L. K.: Persistent Heavy Winter Nitrate Pollution long-lived greenhouse gases: Calculations with the AER radia- Driven by Increased Photochemical Oxidants in Northern China, tive transfer models, J. Geophys. Res.-Atmos., 113, D13103, Environ. Sci. Technol., 54, 3881–3889, 2020. https://doi.org/10.1029/2008jd009944, 2008. Geng, G., Zhang, Q., Tong, D., Li, M., Zheng, Y., Wang, S., and Jimenez, P. A., Dudhia, J., Gonzalez-Rouco, J. F., Montavez, J. P., He, K.: Chemical composition of ambient PM2.5 over China Garcia-Bustamante, E., Navarro, J., de Arellano, J. V. G., and and relationship to precursor emissions during 2005–2012, At- Munoz-Roldan, A.: An evaluation of WRF’s ability to reproduce mos. Chem. Phys., 17, 9187–9203, https://doi.org/10.5194/acp- the surface wind over complex terrain based on typical circula- 17-9187-2017, 2017. tion patterns, J. Geophys. Res.-Atmos., 118, 7651–7669, 2013. Gómez-Navarro, J. J., Raible, C. C., and Dierer, S.: Sensitivity of Kalsoom, U., Wang, T. J., Ma, C. Q., Shu, L., Huang, the WRF model to PBL parametrisations and nesting techniques: C. W., and Gao, L. B.: Quadrennial variability and evaluation of wind storms over complex terrain, Geosci. Model trends of surface ozone across China during 2015–2018: Dev., 8, 3349–3363, https://doi.org/10.5194/gmd-8-3349-2015, A regional approach, Atmos. Environ., 245, 117989, 2015. https://doi.org/10.1016/j.atmosenv.2020.117989, 2021. Grell, G. A., Peckham, S. E., Schmitz, R., McKeen, S. A., Frost, G., Lei, H. and Wuebbles, D. J.: Chemical competition in nitrate and Skamarock, W. C., and Eder, B.: Fully coupled “online” chem- sulfate formations and its effect on air quality, Atmos. Environ., istry within the WRF model, Atmos. Environ., 39, 6957–6975, 80, 472–477, 2013. 2005. Li, K., Jacob, D. J., Liao, H., Shen, L., Zhang, Q., and Bates, K. H.: Guenther, A., Karl, T., Harley, P., Wiedinmyer, C., Palmer, P. Anthropogenic drivers of 2013-2017 trends in summer surface I., and Geron, C.: Estimates of global terrestrial isoprene ozone in China, P. Natl. Acad. Sci. USA, 116, 422–427, 2019. emissions using MEGAN (Model of Emissions of Gases and Li, M.: Air qaulity in recent years.zip, figshare [data set], Aerosols from Nature), Atmos. Chem. Phys., 6, 3181–3210, https://doi.org/10.6084/m9.figshare.12818807.v1, 2020. https://doi.org/10.5194/acp-6-3181-2006, 2006. Li, M. M., Song, Y., Huang, X., Li, J. F., Mao, Y., Zhu, T., Cai, X. He, H., Wang, Y. S., Ma, Q. X., Ma, J. Z., Chu, B. W., Ji, D. S., Tang, H., and Liu, B.: Improving mesoscale modeling using satellite- G. Q., Liu, C., Zhang, H. X., and Hao, J. M.: Mineral dust and derived land surface parameters in the Pearl River Delta region, NOx promote the conversion of SO2 to sulfate in heavy pollution China, J. Geophys. Res.-Atmos., 119, 6325–6346, 2014. days, Sci. Rep.-UK, 4, 4172, https://doi.org/10.1038/Srep04172, Li, M. M., Wang, T. J., Xie, M., Zhuang, B. L., Li, S., Han, Y., 2014. Song, Y., and Cheng, N. L.: Improved meteorology and ozone He, P., Xie, Z., Chi, X., Yu, X., Fan, S., Kang, H., Liu, C., and air quality simulations using MODIS land surface parameters in Zhan, H.: Atmospheric 117 O(NO− 3 ) reveals nocturnal chem- the Yangtze River Delta urban cluster, China, J. Geophys. Res.- istry dominates nitrate production in Beijing haze, Atmos. Chem. Atmos., 122, 3116–3140, 2017. Phys., 18, 14465–14476, https://doi.org/10.5194/acp-18-14465- Li, M. M., Wang, T. J., Xie, M., Li, S., Zhuang, B. L., Huang, X., 2018, 2018. Chen, P. L., Zhao, M., and Liu, J. E.: Formation and Evolution He, P. Z., Xie, Z. Q., Yu, X. W., Wang, L. Q., Kang, H., and Mechanisms for Two Extreme Haze Episodes in the Yangtze Yue, F. G.: The observation of isotopic compositions of at- River Delta Region of China During Winter 2016, J. Geophys. mospheric nitrate in Shanghai China and its implication for Res.-Atmos., 124, 3607–3623, 2019. reactive nitrogen chemistry, Sci. Total Environ., 714, 136727, Li, M. M., Wang, T. J., Shu, L., Qu, Y. W., Xie, M., Liu, J. https://doi.org/10.1016/j.scitotenv.2020.136727, 2020. N., Wu, H., and Kalsoom, U.: Rising surface ozone in China Huang, R. J., Zhang, Y. L., Bozzetti, C., Ho, K. F., Cao, J. J., Han, from 2013 to 2017: A response to the recent atmospheric Y. M., Daellenbach, K. R., Slowik, J. G., Platt, S. M., Canonaco, warming or pollutant controls?, Atmos. Environ., 246, 118130, F., Zotter, P., Wolf, R., Pieber, S. M., Bruns, E. A., Crippa, M., https://doi.org/10.1016/j.atmosenv.2020.118130, 2021a. Ciarelli, G., Piazzalunga, A., Schwikowski, M., Abbaszade, G., Li, M. M., Wang, T. J., Xie, M., Li, S., Zhuang, B. L., Fu, Q. Y., Schnelle-Kreis, J., Zimmermann, R., An, Z. S., Szidat, S., Bal- Zhao, M., Wu, H., Liu, J., Saikawa, E., and Liao, K.: Drivers tensperger, U., El Haddad, I., and Prevot, A. S. H.: High sec- for the poor air quality conditions in North China Plain dur- Atmos. Chem. Phys., 21, 15135–15152, 2021 https://doi.org/10.5194/acp-21-15135-2021
You can also read


