Changes in groundwater drought associated with anthropogenic warming - HESS
←
→
Page content transcription
If your browser does not render page correctly, please read the page content below
Hydrol. Earth Syst. Sci., 23, 1393–1408, 2019
https://doi.org/10.5194/hess-23-1393-2019
© Author(s) 2019. This work is distributed under
the Creative Commons Attribution 4.0 License.

Changes in groundwater drought associated with
anthropogenic warming
John P. Bloomfield1 , Benjamin P. Marchant2 , and Andrew A. McKenzie1
1 British   Geological Survey, Maclean Building Crowmarsh Gifford, Oxfordshire, OX10 8BB, UK
2 British   Geological Survey, Environmental Science Centre, Keyworth, Nottinghamshire, NG12 5GD, UK

Correspondence: John P. Bloomfield (jpb@bgs.ac.uk)

Received: 4 May 2018 – Discussion started: 21 June 2018
Revised: 10 January 2019 – Accepted: 23 February 2019 – Published: 11 March 2019

Abstract. Here we present the first empirical evidence for        tent of shallow groundwater globally, anthropogenic warm-
changes in groundwater drought associated with anthro-            ing may widely effect changes to groundwater drought char-
pogenic warming in the absence of long-term changes in            acteristics in temperate environments.
precipitation. Analysing standardised indices of monthly
groundwater levels, precipitation and temperature, using two
unique groundwater level data sets from the Chalk aquifer,
UK, for the period 1891 to 2015, we show that precipita-          1   Introduction
tion deficits are the main control on groundwater drought
formation and propagation. However, long-term changes in          Globally groundwater provides of the order of one-third of all
groundwater drought are shown to be associated with an-           freshwater supplies (Doll et al., 2012, 2014), 2.5 billion peo-
thropogenic warming over the study period. These include          ple are estimated to depend solely on groundwater for ba-
increases in the frequency and intensity of individual ground-    sic daily water needs (UN, 2015), and it sustains the health
water drought months, and increases in the frequency, mag-        of many important groundwater-dependent terrestrial ecosys-
nitude and intensity of episodes of groundwater drought, as       tems (Gleeson et al., 2012). This high level of dependence on
well as an increasing tendency for both longer episodes of        groundwater means that communities and ecosystems across
groundwater drought and for an increase in droughts of less       the globe are vulnerable to both natural variations in ground-
than 1 year in duration. We also identify a transition from       water resources (Wada et al., 2010) and the impacts of an-
a coincidence of episodes of groundwater drought with pre-        thropogenic climate change on groundwater (Green et al.,
cipitation droughts at the end of the 19th century, to an in-     2011; Taylor et al., 2013). Groundwater droughts, taken here
creasing coincidence with both precipitation droughts and         to mean periods of below-normal groundwater levels (Tallak-
with hot periods in the early 21st century. In the absence of     sen and Van Lanen, 2004; Van Loon, 2015; Van Loon et al.,
long-term changes in precipitation deficits, we infer that the    2016a, b), are a major threat to global water security (Van La-
changing nature of groundwater droughts is due to changes         nen et al., 2013) and are potentially susceptible to being mod-
in evapotranspiration (ET) associated with anthropogenic          ified by climate change. Since drought formation and prop-
warming. We note that although the water tables are rela-         agation are driven by precipitation deficits and evapotran-
tively deep at the two study sites, a thick capillary fringe of   spirative losses associated with elevated temperatures, there
at least 30 m in the Chalk means that ET should not be lim-       is an expectation that anthropogenic climate change, and in
ited by precipitation at either site. ET may be supported by      particular anthropogenic warming, is already modifying the
groundwater through major episodes of groundwater drought         occurrence and nature of droughts (Dai, 2011; Sheffield et
and, hence, long-term changes in ET associated with anthro-       al., 2012; Trenberth et al., 2014; Greve et al., 2014). How-
pogenic warming may drive long-term changes in groundwa-          ever, to date there have been no systematic investigations into
ter drought phenomena in the Chalk aquifer. Given the ex-         how warming due to anthropogenic climate change may af-
                                                                  fect groundwater drought (Green et al., 2011; Taylor et al.,

Published by Copernicus Publications on behalf of the European Geosciences Union.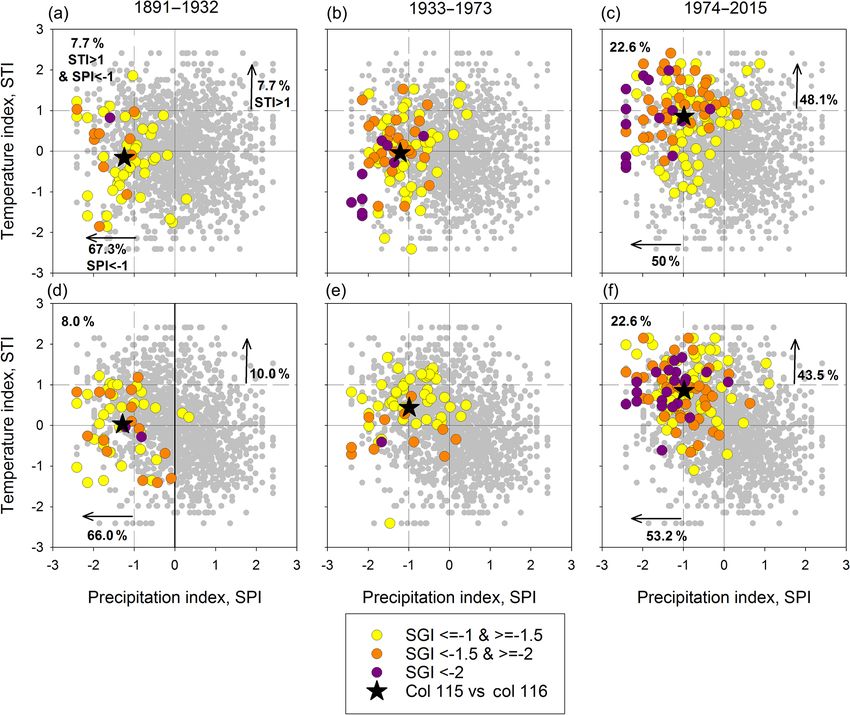
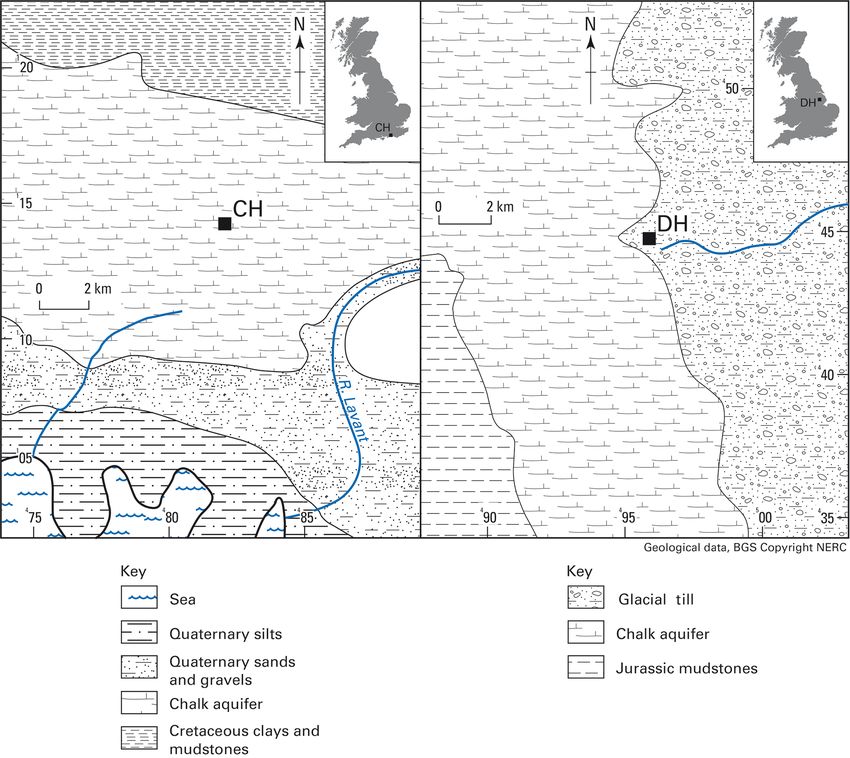
1394                     J. P. Bloomfield et al.: Changes in groundwater drought associated with anthropogenic warming

2013; Jackson et al., 2015), and it has even been noted in the     changing frequency of drought, as measured by the Palmer
IPCC Fifth Annual Assessment of Impacts, Adaptation, and           Modified Drought Index (PMDI), with standardised annual
Vulnerability that “there is no evidence that . . . groundwater    average precipitation and temperature anomalies. Here, in-
drought frequency has changed over the last few decades”           stead of using the PMDI, we use the Standardised Ground-
(Jiménez Cisneros et al., 2014, p. 232). This significant gap      water level Index, SGI (Bloomfield and Marchant, 2013) to
in our understanding of groundwater drought is not surpris-        characterise the monthly status of groundwater, and we com-
ing given the limited availability of long groundwater level       pare changes in SGI with changes in standardised monthly
time series suitable for analysis (Jiménez Cisneros et al.,        air temperature and precipitation. We have chosen not to
2014) and the low signal-to-noise ratios characteristic of         use the Standardised Precipitation Evapotranspiration In-
many hydrological systems (Wilby, 2006; Watts et al., 2015).       dex (SPEI; Vincente-Serrano et al., 2010; Trenberth et al.,
In addition, the challenges of formal attribution of groundwa-     2014) in our analysis as we explicitly wish to analyse the
ter droughts due to anthropogenic warming (Trenberth et al.,       correlations between SGI and standardised temperature and
2015) and the potentially confounding influences of land use       between SGI and standardised precipitation independently
change and groundwater abstraction on groundwater drought          (Stagge et al., 2017).
(Stoll et al., 2011; Jiménez Cisneros et al., 2014; Van Loon et       We have not attempted to formally attribute any ground-
al., 2016a, b) complicate any analysis of such droughts. Here      water droughts to climate change. Rather, we follow the ap-
we address some of these challenges and present the first em-      proach of Trenberth et al. (2015) and investigate how cli-
pirical evidence for the effects of anthropogenic warming on       mate change may modify a particular phenomenon of in-
the changing nature of groundwater droughts.                       terest. In our case, given the known centennial-scale anthro-
   Groundwater systems have been shown to affect global            pogenic warming over the UK described in Sect. 2.2 (Sexton
land-energy budgets and regional climate (Senevirante et al.,      et al., 2004; Karoly and Stott, 2006; Jenkins et al., 2008), us-
2006; Trenberth et al., 2009; Maxwell and Condon, 2016)            ing an empirical analysis we address the following question.
and can control the generation of large-scale hydrological         How has the occurrence, duration, magnitude and intensity
droughts, particularly in temperate climates (Van Lanen et         of groundwater drought, as expressed by changes in monthly
al., 2013). Although the role of evapotranspiration (ET) in        SGI and in episodes of groundwater drought, changed over
regional- to global-scale drying is still a matter of active de-   the period 1891 to 2015? Once relationships between natu-
bate (Dai, 2011; Sheffield et al., 2012; Greve et al., 2014;       rally varying precipitation anomalies, groundwater droughts
Milly and Dunne, 2016), there is an expectation of a gen-          and anthropogenic warming are quantified and characterised,
eral increase in ET, and hence of general drying associated        subsequent studies may consider attribution of groundwater
with anthropogenic warming (Trenberth et al., 2014). Even if       droughts. Such studies may address questions related to as-
anthropogenic warming may not necessarily cause droughts,          sessing how much of the anomaly in any given groundwa-
Trenberth et al. have noted that it is expected that when          ter drought can be explained by anthropogenic warming, but
droughts do occur that they are likely to set in more quickly      attribution-based questions are out of the scope of the cur-
and to be more intense in a warming world (Trenberth et al.,       rent empirical study. Note also that investigation of the re-
2014). In order to investigate the evidence for such changes       lationship, if any, between episodes of extreme heat (heat-
in groundwater droughts it is desirable to identify sites from     waves) and groundwater droughts is not in the scope of the
unconfined aquifers with long, continuous records of ground-       present study. Although the analysis is restricted to data from
water levels where there have been no systematic long-term         two sites in the UK, the findings have potentially significant
changes in precipitation or land cover. In addition, the sites     implications for changes in groundwater drought driven by
ideally should be free from the systematic, long-term influ-       anthropogenic warming given the global extent of shallow
ence of groundwater abstraction. In this context, we investi-      groundwater systems (Fan et al., 2013) and this is discussed
gate the empirical evidence for changes in the character of        in Sect. 5.
groundwater droughts in the period 1891 to 2015 associated
with anthropogenic warming at two such sites, representative
of groundwater systems in temperate climates, from the Cre-        2   Site descriptions and drought context
taceous Chalk, the major aquifer of the UK. These sites are
at Chilgrove House (CH), believed to be the world’s longest        The CH and DH sites meet the requirements of the study
continuously monitored groundwater level observation bore-         in that continuous, long records of groundwater level are
hole, and at Dalton Holme (DH) (Fig. 1).                           available from small rural catchments negligibly impacted
   We have adopted an approach similar to that of Diffebaugh       by land-use change and abstraction over the period of study
et al. (2015) in order to investigate how anthropogenic warm-      (Sect. 2.1). Importantly, both sites are subject to long-
ing may have effected groundwater droughts at CH and DH.           term warming associated with anthropogenic climate change
Diffebaugh et al. (2015) demonstrated how anthropogenic            (Sect. 2.2). In addition, there are no major long-term changes
warming has increased hydrological drought risk in Califor-        in mean precipitation at the two sites over the analysis pe-
nia over the last 100 years approximately by comparing the         riod (demonstrated qualitatively in Sect. 4 and quantitatively

Hydrol. Earth Syst. Sci., 23, 1393–1408, 2019                                    www.hydrol-earth-syst-sci.net/23/1393/2019/
J. P. Bloomfield et al.: Changes in groundwater drought associated with anthropogenic warming                                   1395

Figure 1. Location of the CH and DH observation boreholes, local geological setting, coastline and surface water courses.

through the results of a simple statistical test in Sect. 4.1).         due to being in areas least affected by abstraction (Jackson
The sites, although unusual due to their length, continuous             et al., 2015). There are no major groundwater abstractions
nature and frequency (monthly or better) of the groundwa-               in the immediate vicinity of the observation boreholes. Both
ter level observations, are representative of groundwater sys-          observation boreholes are located in small rural catchments
tems and hydrological settings that are common throughout               with no major population centres or industrial activities, and
large, populous areas of the globe including Europe, Asia,              there has been no long-term change in land use in the catch-
North and South America and parts of Australia and southern             ments over the study period. The inference of a lack of any
Africa, in that they represent shallow, unconfined aquifers in          systematic impacts from abstraction on groundwater levels
temperate regions.                                                      at CH and DH is supported by the good correlation observed
                                                                        between precipitation and groundwater levels at the two sites
2.1   Site descriptions                                                 (Bloomfield and Marchant, 2013).
                                                                           CH is a 62.0 m deep observation borehole in the Seaford
                                                                        Chalk Formation, a white chalk (limestone) of Coniacian
The CH and DH groundwater observation boreholes are lo-
                                                                        to Santonian age. Groundwater levels over the observation
cated in the Chalk, the principal aquifer in the UK (Downing
                                                                        record have an absolute range of about 43.7 m, with a max-
et al., 1993; Lloyd, 1993). CH is in south-eastern England
                                                                        imum groundwater level of about 77.2 meters above sea
and DH in the east of England (Fig. 1). The CH and DH
                                                                        level (m a.s.l.) and a minimum level of about 33.5 m a.s.l.,
hydrographs are the two longest continuous records in the
                                                                        equivalent to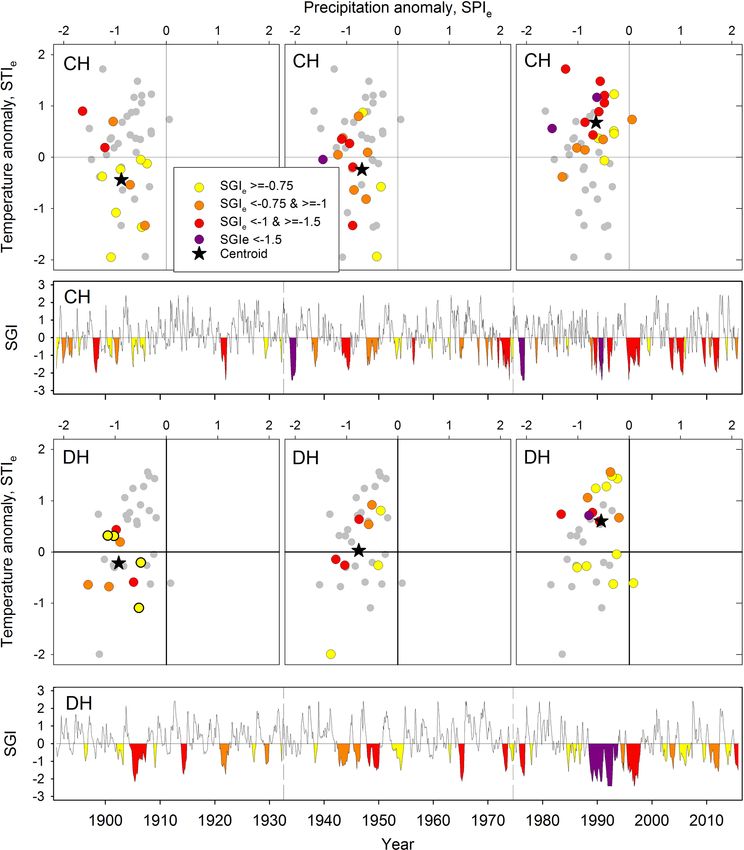
1396                    J. P. Bloomfield et al.: Changes in groundwater drought associated with anthropogenic warming

25 m, although double and higher multiple recharge peaks         slightly higher than at DH where the mean monthly precipi-
and episodes are also relatively frequent due to natural vari-   tation is 58 mm.
ability in precipitation (recharge can occur in summer as well      Air temperature across both catchments closely follows
as winter with appropriate antecedent conditions and precip-     the Central England Temperature (CET) monthly series
itation). Variability in winter recharge means that in some      (Parker et al., 1992) (Fig. S2). Analysis of the CET record
winters, such as 1854–1855, 1897–1898, 1933–1934, 1975–          shows that near-surface air temperature in England has been
1976, 1991–1992 and 1995–1996, minimal recharge occurs.          rising at a rate of 0.077 ◦ C decade−1 since 1900 (Parker and
This characteristically results in a nearly continuous decline   Horton, 2005) and by about 0.42 ◦ C decade−1 between 1975
in groundwater levels throughout the recharge season, and        and 2005 (Karoly and Stott, 2006). The observed recent
in all cases groundwater droughts occurred during the fol-       warming in mean annual CET since at least 1950 has been
lowing summers. There are no clear geological or catchment       formally attributed to anthropogenic forcing (Sexton et al.,
constraints on either the lowest or highest groundwater lev-     2004; Karoly and Stott, 2006; Jenkins et al., 2008; King et
els at CH. However, the River Lavant, approximately 2 km         al., 2015). In contrast, annual mean precipitation over Eng-
to the south-east of the CH borehole, is a Chalk stream that     land shows no systematic trends since records began in 1766,
drains the catchment. The flowing length and discharge of the    and there has been no attribution of changes in annual mean
Lavant reflect the regional groundwater level. Land cover in     precipitation to anthropogenic factors (Jenkins et al., 2008;
the Lavant catchment is approximately 35 % woodland, 65 %        Watts et al., 2015). In addition, we note that there is no ev-
arable and grassland with a small number of villages. Com-       idence at either of the study sites for a systematic change
parison of Ordnance Survey land cover mapping from 1898          in long-term monthly precipitation across the observational
and 2015 shows that there has been no substantial change in      records (see Sects. 3.2 and 4.1). Precipitation in the UK is,
land cover in the vicinity of CH during this period (Ordnance    however, seasonal and highly variable, with a tendency to-
Survey, 1897, 2015).                                             wards drier summers in the south-east and wetter winters in
   DH is a 28.5 m deep observation borehole in the Burnham       the north-west (Jenkins et al., 2008; Watts et al., 2015), and
Chalk Formation, a thinly bedded white chalk of Turonian to      the precipitation time series at CH and DH show seasonal
Santonian age. Groundwater levels have a range of 14.8 m,        and inter-annual variations, including episodes of meteoro-
with a maximum groundwater level of about 23.8 m a.s.l. and      logical drought consistent with the broad drought history of
a minimum of about 9.6 m a.s.l., equivalent to a range from      southern and eastern England (Fig. S3).
about 10 to about 25 m below ground level (Fig. S1). The            A number of studies have described major episodes of hy-
groundwater level hydrograph has a broadly sinusoidal ap-        drological drought, including groundwater drought, in the
pearance. Groundwater levels at DH respond more slowly           UK since the 19th century (Marsh et al., 2007; Lloyd-Hughes
to rainfall than at CH, despite the thinner unsaturated zone.    et al., 2010; Bloomfield and Marchant, 2013; Bloomfield et
This is probably due to local effects of thin glacial till de-   al., 2015; Folland et al., 2015; Marchant and Bloomfield,
posits near DH. Maximum groundwater levels at DH may             2018) and the societal impacts of those droughts (Taylor et
be controlled by the elevation of springs that feed a small      al., 2009; Lange et al., 2017). Marsh et al. (2007) identi-
surface drain about 0.75 km to the south. There are no clear     fied seven episodes of major hydrological droughts in Eng-
geological or catchment constraints on the lowest groundwa-      land and Wales between 1890 and 2007 using ranked rain-
ter levels. DH is located in a flat area with no major streams   fall deficiency time series and analysis of long river flow and
or rivers. Land cover in the immediate vicinity of DH is pre-    groundwater level time series (Marsh et al., 2007, Table 2) as
dominantly arable and grassland with a number of small ar-       follows: 1890–1910 (known as the “Long Drought”), 1921–
eas of woodland and villages. Comparison of Ordnance Sur-        1922, 1933–1934, 1959, 1976, 1990–1992 and 1995–1997.
vey land cover mapping from 1892 and 2015 shows that there       Marsh et al. (2007) noted that of these major droughts all
has been no substantial change in land cover during this pe-     but one, the drought of 1959, had sustained and/or severe
riod (Ordnance Survey, 1911, 2015).                              impacts on groundwater levels. All the major droughts typi-
                                                                 cally had large geographical footprints extending over much
2.2    Climate and drought context                               of England and Wales as well as over parts of north-western
                                                                 Europe (Lloyd-Hughes and Saunders, 2002; Lloyd-Hughes
Average monthly air temperature at CH over the observation       et al., 2010; Fleig et al., 2011; Hannaford et al., 2011). How-
record from 1891 to 2015 is 9.4 ◦ C and at DH it is 9.1 ◦ C,     ever, regional variations in drought intensities were present
with maximum and minimum average monthly temperatures            within and between the major drought events as a func-
of 19.8 and 18.8 ◦ C and −3 and −1.6 ◦ C at CH and DH            tion of spatial differences in driving meteorology and catch-
respectively (Fig. S2). In the Köppen–Geiger classification      ment and aquifer properties (Marsh et al., 2007; Bloomfield
(Peel et al., 2007), the climate at CH and DH can be char-       and Marchant, 2013; Bloomfield et al., 2015; Marchant and
acterised as temperate and falls in the ocean or maritime cli-   Bloomfield, 2018).
mate category, being representative of large parts of north-        Three periods have been used for analysis in this
western Europe. Mean monthly precipitation at CH is 83 mm,       study, namely 1891–1932, 1933–1973 and 1974–2015 (see

Hydrol. Earth Syst. Sci., 23, 1393–1408, 2019                                 www.hydrol-earth-syst-sci.net/23/1393/2019/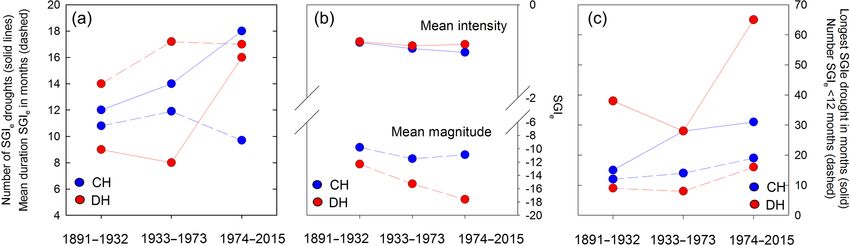
J. P. Bloomfield et al.: Changes in groundwater drought associated with anthropogenic warming                                1397

Sect. 3.2). We note that this means that each analysis pe-         lies. Diffebaugh et al. (2015) chose to analyse their 100-year-
riod contain episodes of previously documented major his-          long records in two halves. However, in this study we have
toric drought. For example, the first analysis period includes     divided the observation record into thirds to give three peri-
the “Long Drought” of 1890–1910 (Marsh et al., 2007); the          ods for use in the analysis, namely 1891–1932, 1933–1973
middle period includes the drought of 1933–1934, the most          and 1974–2015. This provides some granularity in the de-
intense groundwater drought on record at CH; and the last          scription of changes in the standardised indices with time
period includes the 1975–1976 drought, a major groundwa-           and means that the first period is associated with the least an-
ter drought at both CH and DH (Bloomfield and Marchant,            thropogenic warming while the last period, 1974–2015, coin-
2013).                                                             cides with the period of greatest documented anthropogenic
                                                                   warming over the study area (Karoly and Stott, 2006).
                                                                      An alternative approach to dividing the records for analy-
3     Data and methods                                             sis could have been to try and identify one or more significant
                                                                   change points in the temperature record using time series
3.1    Data
                                                                   analysis techniques and then to use those periods to charac-
Groundwater level measurements are available back to 1836          terise any differences in the relationships between hydrologi-
for the observation borehole at CH, while groundwater levels       cal droughts and features of the driving climatology between
are available for DH back to 1889. We have chosen to analyse       those periods. Change point analysis (Chen and Gupta, 2000)
the 125-year-long series of observed monthly groundwater           can lack statistical power because of the temporal correlation
levels from 1891 to 2015 common to both sites. The ground-         amongst the data and the need for a correction to account for
water level data have been taken from the NGLA (National           the multiple hypotheses that are in effect being considered.
Groundwater Level Archive, 2017). Groundwater level ob-            So for example, the Bonferroni correction (Bonferroni, 1936)
servations are typically made at least at monthly intervals.       would require, to demonstrate significance at the p = 0.05
Groundwater levels have been linearly interpolated to the end      level, that each hypothesis be tested at the p = 0.05/1499 =
of the month prior to standardisation, as the SGI requires         3 × 10⁻⁵ level based on the length of the time series in the
groundwater level data on a regular time step.                     present study. When a change point analysis was conducted
   There are no continuous rain gauge or temperature records       on the monthly standardised groundwater level, precipitation
for either of the sites that cover the entire study period. How-   and air temperature time series from each site and the model
ever, gridded temperature and precipitation data (5 km by          residuals were assumed to be independent, significant steps
5 km gridded UKCP09 data) are available for the UK for the         were identified in each series. However, when temporal cor-
period 1910 to 2011 (Met Office, 2017). The work described         relation in the time series was accounted for with a first-order
here is part of a Historic Droughts project (see Acknowledge-      auto-regressive model, only steps in the air temperature se-
ments), funded by the Natural Environment Research Coun-           ries from both sites and the groundwater level series from
cil (NERC), that has extended these records back to 1891           DH persisted. The most significant step in the CH air temper-
using newly recovered, digitised and gridded meteorological        ature series was in November 1988 (p = 2 × 10⁻⁷ ). For the
records and extended the gridded data to 2015 using unpub-         DH temperature series the most significant step was also in
lished updates. We have used this extended gridded data set        November 1988 (p = 2×10⁻⁸ ), and for the DH groundwater
in the present study. Although the extent of the groundwa-         level series it was in April 1984 (p = 0.01). However, after
ter catchments are unknown at both sites they are likely to        a Bonferroni correction only the steps in the monthly stan-
be restricted to a few square kilometres given the nature of       dardised air temperature time series remained significant.
the local hydrogeology (Fig. 1). Consequently, temperature            Notwithstanding the results of the change point tests, the
and precipitation data have been extracted for the 5 km by         change point approach to defining analysis periods has not
5 km grid cell in which the CH and DH observation boreholes        been adopted in the present study for a couple of reasons.
are located, in a manner analogous to Jackson et al. (2016),       Since the aim of the study is to characterise changes in rela-
rather than averaging the gridded climatological data over a       tionships between groundwater droughts and climatology in
larger area.                                                       the context of previously documented long-term warming we
                                                                   want to make no prior assumptions regarding specific periods
3.2    Methods                                                     with potentially different temperature regimes. In addition,
                                                                   as we know from previous studies that anthropogenic warm-
As mentioned in the introduction, the empirical analysis de-       ing will have affected both series since at least the 1950s
scribed in this paper broadly follows the approach of Dif-         (Sexton et al., 2004; Karoly and Stott, 2006; Jenkins et al.,
febaugh et al. (2015), i.e. analysis of changes in the fre-        2008; King et al., 2015), the meaning of any change points
quency and co-occurrence of three standardised indices with        identified post-1950 in the context of anthropogenic warming
time, where one index is a measure of the hydrological             would be unclear and is an approach towards attribution that
drought status of the system and the other two indices sep-        we are explicitly trying to avoid in the current study. How-
arately characterise precipitation and air temperature anoma-      ever, we note that the change point analysis described above

www.hydrol-earth-syst-sci.net/23/1393/2019/                                     Hydrol. Earth Syst. Sci., 23, 1393–1408, 2019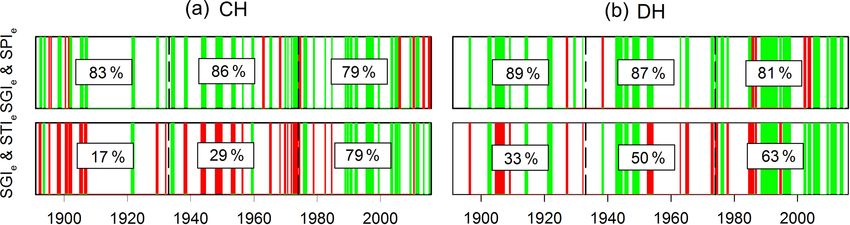
1398                     J. P. Bloomfield et al.: Changes in groundwater drought associated with anthropogenic warming

is consistent with the findings presented in Sect. 4, in that the   ilar to other non-parametric approaches, for example Osti et
latter part of the observational record at both sites is signifi-   al. (2008) who used a plotting position method to estimate a
cantly warmer than the earlier part of the record.                  standardised precipitation, and Vidal et al. (2010) who used
    A wide range of methods have been used to characterise          a non-parametric kernel density fitting routine to estimate a
and investigate hydrological droughts including groundwa-           normalised soil moisture index.
ter droughts. They broadly fall into two classes: standardised         SGI has been estimated using the monthly groundwater
indices and threshold level approaches (see Van Loon, 2015,         level time series. The SGI relies on a non-parametric ap-
for a detailed recent overview). Threshold level approaches         proach to the standardisation of groundwater level hydro-
use a pre-defined threshold, which may vary seasonally.             graphs (Bloomfield and Marchant, 2013). It is estimated us-
When flows or, in the case of groundwater, when levels fall         ing a normal-score transform (Everitt, 2002) of groundwa-
below a given threshold a site is considered to be in drought.      ter level data for each calendar month. This non-parametric
Drought characteristics such as duration, magnitude and fre-        normalisation assigns a value to observations, based on their
quency can then be estimated. This approach has the bene-           rank within a data set, in this case groundwater levels for
fit of being able to characterise aspects of droughts in abso-      a given month from a given hydrograph. The normal-score
lute terms and hence is particularly useful for water resource      transform is undertaken by applying the inverse normal cu-
management planning or to understand processes at a partic-         mulative distribution function to n equally spaced pi values
ular observation borehole. However, it does not lend itself so      ranging from 1/(2n) to 1–1/(2n). The values that result are
easily to studies where there is a need to compare multiple         the SGI values for the given month. These are then re-ordered
sites and multiple indicators of change. For example, in the        such that the largest SGI value is assigned to the i for which
present study it would be necessary to define and justify six       pi is largest, the second largest SGI value is assigned to the
seasonally varying thresholds (two for each site identifying        i for which pi is second largest, and so on. The SGI distri-
precipitation and groundwater drought thresholds and one            bution which results from this transform will always pass the
for each site identifying hot-period thresholds). In contrast,      Kolmogorov–Smirnov test for normality. The normalisation
droughts characterised using standardisation approaches en-         is undertaken for each of the 12 calendar months separately
able the comparison of hydrological anomalies between dif-          and the resulting normalised monthly indices then merged
ferent sites and/or between different components of the ter-        to form a continuous SGI time series. Note that the result-
restrial water cycle using common standardised anomalies            ing standardised drought index is not linear and that drought
from a normal situation (Van Loon, 2015). Given the need            conditions (SGI < − 1) will be expected about 16 % of the
in this study to compare relative changes in groundwater            time while extreme drought conditions (SGI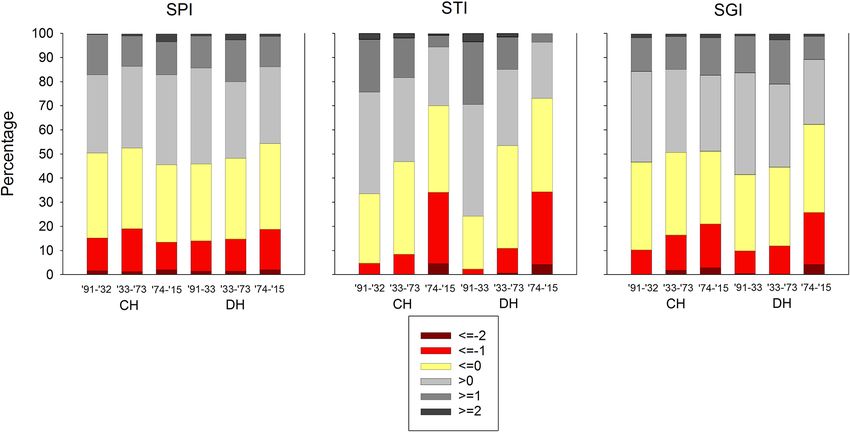
J. P. Bloomfield et al.: Changes in groundwater drought associated with anthropogenic warming 1399
correlations between SGI and SPI are similar in the first and met: (i) any part of a groundwater or precipitation drought
last third of the observational record. As would be expected, episode or hot-period overlaps, and (ii) within the periods,
the cross-correlation between SGI and STI is weaker than incidents of monthly SGI ≤ −1 either overlap with or post-
that of SGI and SPI, with correlations between SGI and STI6 date incidents of either monthly SPI is ≤ −1, or monthly STI
of −0.15 and −0.35 for CH and DH respectively (Fig. S4). is ≥ 1.
The 6-month maximum absolute summed cross-correlation
period is consistent with previous analyses of SPI accumula-
tion at the two sites. It is the same as the SPI accumulation 4 Results
period identified by Bloomfield and Marchant (2013) for CH
4.1 Changes in standardised monthly temperature,
and slightly less than that for DH (Bloomfield and Marchant,
groundwater level and precipitation since 1891
2013, Table 2) (note that cross-correlation co-efficients at DH
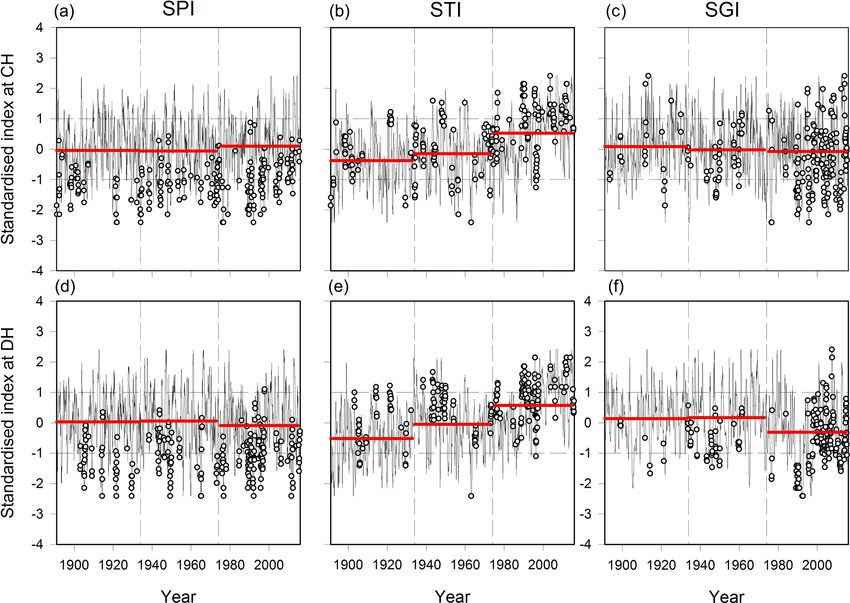
are particularly insensitive to q beyond 6 months; Fig. S4). SGI time series show that there has been a large increase in
This is despite the accumulation periods in Bloomfield and the frequency of months of groundwater drought since 1891
Marchant (2013) being based on standardised precipitation at both sites (Figs. 2 and 3 and Table S1). The frequency of
alone and being estimated for a shorter observation record months of groundwater drought has more than doubled be-
than the present study. tween the first third (1891–1932) and the last third (1974–
Given the above, we have used a 6-month accumulation 2015) of the record, i.e. from about 10 % of months at both
for precipitation and a 6-month average for temperature in sites in the first third of the record to 21 % and 25 % at CH
the analysis. For simplicity, throughout the following de- and DH respectively in the last third of the record. The in-
scription of the results and discussions, all subsequent ref- crease in frequency of groundwater drought months is as-
erences to SPI and STI relate to SPI6 and STI6 unless oth- sociated with a very large increase in the frequency of hot
erwise stated. Although the correlations between SGI, SPI months, from 5 % to 34 % of the months at CH and from 2 %
and STI are based on simple phenomenological correlations to 34 % of the months at DH. In contrast, there has been no
between the time series, they reflect recharge and discharge systematic change in the frequency of precipitation drought
processes at the sites and are consistent with accepted con- months. The probability of these changes in standardised in-
ceptualisations of drought generation in the Chalk. For ex- dices between the first and last thirds of the observational
ample, at both sites the standardised groundwater level at the record being significant has been estimated. Given that the
end of the winter recharge season, i.e. SGI in March, is cor- standardised monthly indices are normally distributed, a null
related with accumulated precipitation for the 6 months prior model can be estimated where each standardised index is
to March, i.e. the winter half-year from October to March. assumed to be a realisation of a temporally auto-correlated
Previously, Folland et al. (2015) have documented a vari- Gaussian random function (with auto-correlation function
ety of climate and other drivers of multi-annual hydrologi- estimated from the observed data). A “probability of differ-
cal droughts across the English Lowlands, the region within ence” for a standardised index between analysis periods can
which CH and DH are located, based on precipitation deficits be estimated as follows. If we define D as equal to the num-
established during winter half-years. ber of droughts in the last analysis period minus the number
There is a plethora of definitions of meteorological of droughts in the first analysis period (for example) then
drought (Lloyd-Hughes, 2014; Van Loon, 2015). Here we the probability of difference is the probability, under the null
follow the WMO convention for SPI (McKee et al., 1993; model, that D is greater than the observed value. Estimated
World Meteorological Organisation, 2012), where precipita- in this way, the probability of the difference in the number of
tion drought is defined as any period of continuously neg- hot months in the period 1891–1932 and 1974–2015 being as
ative SPI that reaches an intensity of −1 or less. By anal- extreme as the observed is 0.03 for CH and 0.005 for DH. For
ogy, we define any month with a negative SPI or SGI of −1 groundwater drought months the probabilities are 0.056 for
or less as a precipitation or groundwater drought month and CH and 0.055 for DH, but for precipitation drought months
any month with a positive STI that reaches an intensity of they are 0.70 for CH and 0.36 for DH. From this it is inferred
1 or more as a hot month. Periods of continuously negative that the increased incidence of hot months and of groundwa-
SGI or SPI that reaches a monthly intensity of −1 or less is ter drought months between the start and end of the record is
defined as an episode of groundwater (SGIe ) or precipitation very unlikely to occur by chance at both sites, but that there
(SPIe ) drought, and a period of continuously positive STI that is no significant difference in the probability of precipitation
reaches a monthly intensity of 1 or more, denoted by STIe , is drought.
defined as a hot period.
In addition, we are interested in the degree of coinci-
dence between episodes of groundwater drought, precipita-
tion drought and hot periods. Groundwater droughts have
been assessed to be coincident with precipitation droughts
or with hot periods if both of the following conditions are
www.hydrol-earth-syst-sci.net/23/1393/2019/ Hydrol. Earth Syst. Sci., 23, 1393–1408, 20191400 J. P. Bloomfield et al.: Changes in groundwater drought associated with anthropogenic warming
Figure 2. Changes in standardised indices of precipitation, temperature and groundwater level since 1891. Time series of SPI, STI and SGI
for CH (a, b, c) and DH (d, e, f) for the period 1891–2015, with mean values for first, middle and last thirds of the record highlighted in red.
Open circles in plots of SGI denote months where STI is ≥ 1, and in plots of SPI and STI denote months where SGI is ≤ −1. Percentages
are for months in the first and last third of the records where SGI and SPI are ≤ −1 and STI is ≥ 1.
4.2 Changes in association between monthly winter half-years resulting in effectively no groundwater
groundwater drought, temperature and recharge over a 12-month period (Marsh et al., 2007; Alexan-
precipitation der and Jones, 2000). Because that drought occurred at the
start of the middle third of the observational record it is as-
Figure 4 shows the occurrence of groundwater drought sociated with a relatively cool period with respect to the full
months as a function of SPI and STI at CH and DH for the pe- standardised series.
riods 1890–1932, 1933–1973 and 1974–2015. It shows how However, a number of trends can be seen in addition to the
groundwater drought months reflect both natural variability natural variability in precipitation deficits. As a consequence
in the driving drought climatology, specifically in precipita- of the increase in frequency of groundwater drought months
tion deficits, but also underlying changes associated with an- and of hot months across the observational record, there has
thropogenic warming. been a considerable increase in the number of groundwater
Dry months (SPI ≤ 0) appear to be a broad prerequisite drought months that coincide with hot months, particularly
for groundwater drought months throughout the record at in the last third of the record (Table S2). The percentage of
both sites (Fig. 4). Natural variation in precipitation deficit is groundwater drought months that coincided with hot months
clearly the primary control on groundwater drought months increased from about 8 % and 10 % in the period 1891–1932,
across the whole period at both sites and major groundwa- to about 48 % and 43 % in the period 1974–2015 for CH and
ter droughts driven by significant precipitation deficits are DH respectively. At the same time, there has been a slight
evident in the data. For example, six of the eight most ex- reduction in the coincidence of months of groundwater and
treme groundwater drought months in the middle period at precipitation drought for these two periods, from 67 % to
CH (where SGIJ. P. Bloomfield et al.: Changes in groundwater drought associated with anthropogenic warming 1401
Figure 3. Percentage of monthly SPI, STI and SGI as a function of six ranges of standardised values from ≤ −2 to ≥ 2 for each third of the
records from CH and DH.
drought. So the increase in the percentage of groundwater of precipitation deficit. Episodes of groundwater drought
drought months that coincide with both hot months and pre- (SGIe ) are almost entirely associated with dry episodes
cipitation drought months between the first and last periods where mean SPI is < = 0 (Fig. 5). However, despite the lim-
of the observational record, from about 8 % to 34 % and from ited number of episodes at each site, Figs. 5 and 6 also show
about 10 % to 35 % for CH and DH, is almost entirely due to evidence of changes in the nature of episodes of groundwa-
the effect of warming. To illustrate and emphasise the com- ter drought associated with anthropogenic warming. The to-
bined effects of these changes in the relationship between tal number of episodes of groundwater drought at the sites
SPI, STI and SGI across the three periods, Fig. 4 shows the is limited, and in large part reflects the natural variability of
centroid for all groundwater drought months (SGI < − 1) for precipitation deficits. However, at both sites there is an in-
each third of the record. At CH and DH there is a strong over- crease in the frequency of episodes of groundwater drought
all warming trend with mean STI for all groundwater drought between the first and last periods of analysis, i.e. from 12
months increasing from −0.16, −0.04 and 0.85 at CH and to 19 and from 9 to 16 at CH and DH respectively for the
from 0.03, 0.44 and 0.98 at DH between 1891–1932, 1933– periods 1891–1932 and 1974–2015 (Fig. 6a and Table S3).
1973 and 1974–2015. This is consistent with the warming However, note that at DH there were only 8 droughts in the
trend across the whole record (Figs. 2 and 3). middle analysis period 1933–1973, one less than in the first
period. A year-long episode of groundwater drought started
4.3 Changes in episodes of groundwater drought in December 1973 and ended in November 1974 at DH. This
has been included in the statistics for the last analysis pe-
There have been 45 episodes of groundwater drought at CH riod. It illustrates the naturally “noisy” nature of the rela-
and 33 at DH between 1891 and 2015. Of these, 16 episodes tively sparse data, reflects in part the temporal variability in
at CH and 9 episodes at DH had an average SGI intensity of the precipitation deficits that drive the occurrence of ground-
≤ −1 (Table S3). Across the observational record, ground- water droughts at the site, and illustrates why we have chosen
water droughts are more frequent but typically shorter and to analyse relatively coarse periods and use averages to char-
less intense at CH compared with DH (Figs. 5 and 6). This acterise changes in drought characteristics across the record.
is consistent with previous observations that the CH hydro- There is no consistent change in the mean duration of
graph has a shorter autocorrelation than that of DH, inferred groundwater droughts at either CH or DH, with mean du-
to be due to differences in aquifer and catchment character- rations of about 11, 12 and 10 months across the three peri-
istics between the sites (Bloomfield and Marchant, 2013). ods from 1891 to 2015 at CH, and mean durations at DH of
Episodes of groundwater drought are present throughout 14, 17 and 17 months for the same three periods. Although
the observation record and are primarily driven by episodes
www.hydrol-earth-syst-sci.net/23/1393/2019/ Hydrol. Earth Syst. Sci., 23, 1393–1408, 20191402 J. P. Bloomfield et al.: Changes in groundwater drought associated with anthropogenic warming Figure 4. Occurrence of groundwater drought months as a function of SPI and STI at CH (a, b, c) and at DH (d, e, f), for the periods 1890–1932, 1933–1973 and 1974–2015. For reference, all monthly values from 1891–2015 are shown as grey symbols and all months were SGI > − 1 for a given period are shown as open white circles. Black stars denote the centroid of the groundwater drought months for each of the three periods. there is no clear tendency of change in mean SGIe duration, in the coincidence of episodes of hot periods (STIe ) with it appears that there may be a tendency for an increase both episodes of groundwater drought (SGIe ) (Fig. 7). Episodes in the maximum drought duration and in the number of sub- of groundwater drought generally coincide with precipitation annual episodes of groundwater drought, particularly at CH droughts. Typically in a given period precipitation droughts (Fig. 6c). There is a tendency for the mean event magnitude are coincident with between 75 % and 89 % of groundwater and mean event intensity of groundwater droughts at both droughts, with no systematic change in the frequency of co- sites to increase with time, with mean event magnitude in- incidence across the observational record at either site. This creasing more at DH than at CH, from about −12 to about is consistent with the observation that groundwater droughts −18, and mean event intensity to increasing more at CH at the sites are primarily driven by episodes of precipitation than at DH, from −0.8 to −1.0 between the periods 1891– deficit. However, there has been a large, systematic increase 1932 and 1974–2015 (Fig. 6b). The systematic increases in in the coincidence of groundwater droughts with hot periods, drought frequency, magnitude and intensity are associated from 17 %, 29 % and 79 % at CH and from 33 %, 50 % and with a large increase in mean STI across the three analysis 63 % at DH during the 1891–1932, 1933–1973 and 1974– periods and are reflected in the change in relative position of 2015 periods respectively (Fig. 7). the SPI–STI centroids of the data for SGIe , shown as black stars, in the plots for each of the three periods in Fig. 5. In addition to changes in mean STI associated with episodes of groundwater drought, there have been changes Hydrol. Earth Syst. Sci., 23, 1393–1408, 2019 www.hydrol-earth-syst-sci.net/23/1393/2019/
J. P. Bloomfield et al.: Changes in groundwater drought associated with anthropogenic warming                                     1403

Figure 5. Changes in the incidence and magnitude of episodes of groundwater drought since 1891 as a function of temperature and pre-
cipitation. Mean groundwater drought event intensity (mean SGIe) as a function of mean event SPI and STI for the periods 1891–1932,
1933–1943 and 1944–2015. Grey symbols indicate all episodes of groundwater drought at a site. Yellow through to purple symbols indicate
increasing mean SGI for the episodes of groundwater drought. The black star denotes the centroid of the episodes of SGI in each third of
the observational record. The SGI time series are shown below the cross plots for reference with SGI drought events of a given magnitude
highlighted. Data for CH are shown in the upper panels and DH in the lower panels.

5     Discussion and conclusions                                      ated with negative precipitation anomalies (SPI ≤ 0) (Figs. 5
                                                                      and 7). However, we have also shown that there is no sig-
5.1    Controls on changes in groundwater drought on                  nificant difference in the probability of precipitation drought
       the Chalk aquifer                                              between the beginning and end of the records at CH and DH
                                                                      (Sect. 4.1) and that increases in groundwater drought fre-
                                                                      quency, magnitude and intensity are not associated with any
Precipitation deficit is the primary driver of groundwater
                                                                      long-term increases in precipitation deficits. Given these ob-
drought (Tallaksen and Van Lanen, 2004; Van Loon, 2015).
                                                                      servations, and in the absence of major long-term changes in
This is confirmed for CH and DH, where dry months (SPI ≤
                                                                      land cover and the absence of systematic effects of abstrac-
0) are a broad prerequisite for groundwater drought months
                                                                      tion in the catchments (Sect. 2.1), what are the controls on
throughout the record at both sites (Fig. 4) and where almost
all episodes of groundwater drought (SGI ≤ −1) are associ-

www.hydrol-earth-syst-sci.net/23/1393/2019/                                         Hydrol. Earth Syst. Sci., 23, 1393–1408, 2019
1404 J. P. Bloomfield et al.: Changes in groundwater drought associated with anthropogenic warming Figure 6. (a) Change in total number of groundwater drought episodes and mean duration of SGIe at CH (blue) and DH (red) for the periods 1891–1932, 1933–1973 and 1974–2015. (b) Change in mean intensity and mean magnitude of groundwater drought episodes over the three analysis periods at CH and DH. (c) Change in maximum duration of SGIe and number of episodes of groundwater drought less than 12 months in duration. Figure 7. Graphical representation of coincidence of groundwater droughts with precipitation droughts (SGI–SPI) and with hot periods (SGI–STI) for CH (a) and DH (b), where green denotes coincident and red non-coincident episodes. Percentages indicate the fraction of coincident episodes for the first (1891–1932), middle (1933–1943) and last (1944–2015) thirds of the record (where periods are separated by vertical dashed lines). the observed changes in groundwater drought since 1891 at winters over the same periods. In addition, there appears to CH and DH? be no systematic drying trend associated with the consecu- Marsh et al. (2007) and Marsh (2007) have previously tive dry winters when they do occur. For example, the mean noted that major hydrological droughts in the UK may persist SPI for episodes of consecutive dry winters at CH is −0.72, for at least a year, and often substantially longer – a common −0.89 and −0.78 for the periods 1891–1932, 1933–1973 and feature of major groundwater droughts globally (Tallaksen 1974–2015, while the corresponding mean SPI for consecu- and Van Lanen, 2004; Van Loon, 2015). This is confirmed tive dry winters at DH it is −0.52, −0.70 and −0.62. Since in the present study with the mean duration of groundwa- there is no clear driver for change in the nature of ground- ter droughts at CH being about 11 months and at DH being water drought at CH and DH related to precipitation deficits, about 16 months (Table S3). Marsh et al. (2007) and Fol- and given that there is a significant increase in air tempera- land et al. (2015) also noted that major hydrological droughts ture associated with anthropogenic warming across the ob- in the UK are almost always associated with more than one servational record, we postulate that increased ET associated consecutive dry winter. However, there is no evidence for with anthropogenic warming is a major contributing factor to systematic changes in the frequency of consecutive dry win- the observed increasing occurrence of individual months of ters either at CH or at DH across the observational record. groundwater drought as well changes in the frequency, mag- If a dry winter is defined as below-average mean monthly nitude and intensity of episodes of groundwater drought. SPI for the winter half-year (October to March), there no In shallow, unconfined groundwater systems ET con- consistent changes in consecutive dry winters across the two tributes to the formation and propagation of groundwater sites. At CH there have been 16, 12 and 11 consecutive dry droughts (Tallaksen and Van Lanen, 2004; Van Lanen et al., winters over the periods 1891–1932, 1933–1973 and 1974– 2013; Van Loon, 2015) in a complex, non-linear manner. As 2015 respectively and at DH 14, 16 and 18 consecutive dry part of a study investigating the connections between ground- Hydrol. Earth Syst. Sci., 23, 1393–1408, 2019 www.hydrol-earth-syst-sci.net/23/1393/2019/
J. P. Bloomfield et al.: Changes in groundwater drought associated with anthropogenic warming                                1405

water flow and transpiration partitioning based on modelling      to global scale is challenging; however, Good et al. (2015)
of data from shallow North American aquifers, Maxwell and         have estimated that the majority of ET, about 64 %, is due to
Condon (2016) have shown that ET is water limited below           plant transpiration. At the global scale, there is currently lim-
about 5 m (Maxwell and Condon, 2016, Fig. 3). If this re-         ited understanding of how plants use groundwater for evap-
lationship holds for CH and DH, ET should be expected to          otranspiration. In the first such global analysis, Koirala et
have a limited effect on groundwater drought formation and        al. (2017) modelled the spatial distribution of primary pro-
propagation at the two sites because the depth to ground-         duction and groundwater depth and found positive and nega-
water at CH and DH associated with episodes of ground-            tive correlations dependent on both climate class and vegeta-
water drought is typically in the range 35 to 45 m and 10         tion type. Positive correlations, i.e. higher plant productivity
to 15 m below ground level respectively. Unlike many other        associated with high (shallower) groundwater tables, were
aquifers, the Chalk has a thick capillary fringe and due to       generally found under dry or temperate climate class con-
the micro-porous nature of the matrix remains saturated to at     ditions, whereas negative correlations were associated with
least 30 m above the water table (Price et al., 1993). This po-   high plant productivity but with lower (deeper) water tables
tentially enables ET to support the propagation of groundwa-      predominately in humid environments. When just the tem-
ter droughts even when the water table falls below 5 m. Ire-      perate climate class was considered, grass, crop and shrub
son et al. (2009) have shown how groundwater flow through         vegetation types (similar to those found at CH and DH) were
the unsaturated zone of the Chalk is highly sensitive to frac-    all associated with positive correlations between vegetative
ture distributions and characteristics and so may be expected     production and groundwater level, with only forests show-
to vary significantly between sites on the Chalk as fracture      ing negative correlations. Fan et al. (2013) produced the first
characteristics vary spatially (Bloomfield, 1996). However,       high-resolution global model of depth to groundwater level
even though there are no data on the thickness of the capil-      depth and, based on a conservative estimate of the maxi-
lary fringe at CH or DH, it can be estimated with some con-       mum rooting depths of plants of 3 m below ground level, es-
fidence due to the remarkable uniformity of the matrix of the     timated that up to 32 % of the global ground surface area has
Chalk across the UK (Price et al., 1993, Fig. 3.3a; Allen et      a water table depth or capillary fringe within rooting depth.
al., 1997, Fig. 4.1.5). Saturation of the matrix of the Chalk     Based on the observations above, it is clear that globally shal-
is controlled primarily by the pore-throat size distribution of   low groundwater systems are common and that in temperate
the matrix, which is characteristically less than 1 µm across     environments shallow groundwater contributes to ET medi-
the Chalk. Such pore throat sizes can support capillary pres-     ated by plant transpiration, and as such plant transpiration
sure heads of 30 m or more, and consequently it has been          may be an important process effecting groundwater drought
proposed that this corresponds to the typical depth of cap-       formation and propagation and hence may be susceptible to
illary fringe in the matrix of the Chalk aquifer (Price et al.,   changes due to anthropogenic warming. If the effect of fu-
1993; Allen et al., 1997). From the above, we infer that ET       ture anthropogenic warming on groundwater droughts and
may be expected to contribute to the formation and propa-         more generally ET processes in areas of shallow groundwa-
gation of groundwater droughts at sites on the Chalk, such        ter and/or thick capillary fringes are to be modelled with any
as at CH and DH, with water tables down to at least 30 m          fidelity, there is clearly a need for a focus on improvements
below ground level. Consequently, on aquifers such as the         in modelling ET processes in shallow groundwater systems
Chalk, groundwater drought formation and development may          (Doble and Crosbie, 2017).
be particularly sensitive to the effects of changes in ET, and
hence to anthropogenic warming.                                   5.3   Conclusions

5.2   Implications for the changing susceptibility to             The following conclusions were made:
      global groundwater droughts                                   – In the fifth IPCC Assessment of Impacts, Adapta-
                                                                      tion, and Vulnerability it was noted that “there is no
Given that the sites analysed here are representative of              evidence that . . . groundwater drought frequency has
groundwater systems in temperate hydrogeological settings,            changed over the last few decades” (Jiménez Cisneros et
we infer that anthropogenic warming may potentially be                al., 2014, p. 232). Here we provide the first evidence for
modifying characteristics of groundwater drought such as the          changes in groundwater drought frequency, magnitude
frequency, magnitude and intensity of groundwater droughts            and intensity associated with anthropogenic warming.
globally wherever shallow, unconfined aquifers are present in         This has been possible due to the unusually long and
temperate environments. If groundwater droughts are chang-            continuous nature of the groundwater level time series
ing in their character due to anthropogenic warming and               and supporting meteorological data that are available for
these changes are mediated by ET (Maxwell and Condon,                 the CH and DH sites.
2016), how important might this phenomenon be globally?
   The partitioning of ET into plant transpiration, intercep-       – The observed increase in groundwater drought fre-
tion, soil and surface water evaporation at the continental           quency, magnitude and intensity at CH and DH associ-

www.hydrol-earth-syst-sci.net/23/1393/2019/                                    Hydrol. Earth Syst. Sci., 23, 1393–1408, 2019
1406 J. P. Bloomfield et al.: Changes in groundwater drought associated with anthropogenic warming
ated with anthropogenic warming is inferred to be due References
to enhanced evapotranspiration (ET). This is facilitated
by the thick capillary fringe in the Chalk aquifer, which
may enable ET to be supported by groundwater through Alexander, L. V. and Jones, P. D.: Updated Precipitation Series for
the U.K. and Discussion of Recent Extremes, Atmos. Sci. Lett.,
major episodes of groundwater drought.
1, 142–150, 2000.
– By extrapolation, as shallow groundwater systems are Allen, D. J., Brewerton, L. J., Coleby, L. M., Gibbs, B. R., Lewis,
common and since in temperate environments shal- M. A., MacDonald, A. M., Wagstaff, S. J., and Williams, A. T.:
The physical properties of major aquifers in England and Wales,
low groundwater contributes to ET mediated by plant
British Geological Survey Technical Report WD/97/034, Key-
transpiration, this may be a globally important pro-
worth, Nottingham, available at: http://nora.nerc.ac.uk/id/eprint/
cess effecting groundwater drought formation and prop- 13137/1/WD97034.pdf (last access: March 2019), 1997.
agation. Wherever droughts in shallow groundwater Bloomfield, J. P.: Characterisation of hydrogeologically significant
systems and/or aquifers with relatively thick capillary fracture distributions in the Chalk: an example from the Upper
fringes are influenced by ET it is inferred that they may Chalk of Southern England, J. Hydrol., 184 , 355–379, 1996.
be susceptible to changes due to anthropogenic warm- Bloomfield, J. P. and Marchant, B. P.: Analysis of ground-
ing. water drought building on the standardised precipitation in-
dex approach, Hydrol. Earth Syst. Sci., 17, 4769–4787,
https://doi.org/10.5194/hess-17-4769-2013, 2013.
Data availability. The groundwater level data used in the study Bloomfield, J. P., Marchant, B. P., Bricker, S. H., and Morgan,
are from the WellMaster Database in the National Groundwater R. B.: Regional analysis of groundwater droughts using hydro-
Level Archive of the British Geological Survey. The data are avail- graph classification, Hydrol. Earth Syst. Sci., 19, 4327–4344,
able under license from the British Geological Survey at https: https://doi.org/10.5194/hess-19-4327-2015, 2015.
//www.bgs.ac.uk/products/hydrogeology/WellMaster.html (last ac- Bonferroni, C. E.: Teoria statistica delle classi e calcolo delle prob-
cess: March 2019). abilità, Pubblicazioni del R Istituto Superiore di Scienze Eco-
The gridded monthly meteorological data (UKCP09) used in nomiche e Commerciali di Firenze, Firenze, Italy, 1936.
the study is available from the Met Office at http://catalogue. British Geological Survey: National Groundwater Level Archive,
ceda.ac.uk/uuid/87f43af9d02e42f483351d79b3d6162a (last access: available at: http://www.bgs.ac.uk/research/groundwater/
March 2019). datainfo/levels/ngla.html, last access: November 2017.
Chen, J. and Gupta, A. K.: Parametric statistical change point anal-
ysis, Pub. Birkhauser, New York, USA, 2000.
Dai, A.: Characteristics and trends in various forms of the Palmer
Supplement. The supplement related to this article is available
Drought Severity Index during 1900–2008, J. Geophys. Res.,
online at: https://doi.org/10.5194/hess-23-1393-2019-supplement.
166, D12115, https://doi.org/10.1029/2010JD015541, 2011.
Diffebaugh, N. S., Swain, D. L., and Touma, D.: Anthropogenic
warming has increased drought risk in California, P. Natl. Acad.
Author contributions. JPB conceived and coordinated the project. Sci. USA, 112, 3931–3936, 2015.
AAM prepared the SGI, SPI and STI data for analysis. BPM per- Doble, R. C. and Crosbie, R. S.: Review: Current and emerging
formed statistical analyses. JPB wrote the paper with input from methods for catchment-scale modelling of recharge and evapo-
AAM and BPM. transpiration from shallow groundwater, Hydrogeol. J., 25, 3–23,
2017.
Doll, P., Hoffmann-Dobreva, H., Portmanna, F. T., Siebert, S.,
Competing interests. The authors declare that they have no conflict Eicker, A., Rodell, M., Strassberge, G., and Scanlone, B. R.: Im-
of interest. pact of water withdrawals from groundwater and surface water
on continental water storage variations, J. Geodyn., 59–60, 143–
156, 2012.
Acknowledgements. We would like to thank our colleague Mengyi Doll, P., Schmied, H. M., Schuh, C., Portmann, F. T., and Eicker,
Gong for the change point analysis. This work was undertaken A.: Global-scale assessment of groundwater depletion and re-
in part with support from the Natural Environment Research lated groundwater abstractions: Combining hydrological mod-
Council (NERC), UK, through the UK Drought and Water Scarcity elling with information from well observations and GRACE
Programme project “Analysis of historic drought and water satellites, Water Resour. Res., 50, 5698–5720, 2014.
scarcity in the UK: a systems-based study of drivers, impacts and Downing, R. A., Price, M., and Jones, G. P.: The hydrogeology of
their interactions” (NERC grant NE/L010151/1) also known as the Chalk of north-west Europe, Clarendon Press, Oxford, UK,
the Historic Droughts Project and by the Groundwater Drought 1993.
Initiative (GDI) project (NERC grant NE/R004994/1). The paper Everitt, B. S.: The Cambridge Dictionary of Statistics, 2nd Edn.,
is published with the permission of the Executive Director of the Cambridge University Press, Cambridge, UK, 2002.
British Geological Survey (NERC). Fan, Y., Li, H., and Miguez-Macho, G.: Global patterns of ground-
water table depth, Science, 339, 940–943, 2013.
Edited by: Mauro Giudici Fleig, A. K., Tallaksen, L. M., Hisdal, H., and Hannah, D. M.: Re-
Reviewed by: three anonymous referees gional hydrological drought in north-western Europe: Linking a
Hydrol. Earth Syst. Sci., 23, 1393–1408, 2019 www.hydrol-earth-syst-sci.net/23/1393/2019/You can also read