Impacts of COVID-19 on Food Security - IFPRI Discussion Paper 01956 Panel Data Evidence from Nigeria - Ebrary
←
→
Page content transcription
If your browser does not render page correctly, please read the page content below
IFPRI Discussion Paper 01956

 August 2020

Impacts of COVID-19 on Food Security
 Panel Data Evidence from Nigeria

 Mulubrhan Amare

 Kibrom A. Abay

 Luca Tiberti

 Jordan Chamberlin

Development Strategy and Governance Division
INTERNATIONAL FOOD POLICY RESEARCH INSTITUTE
The International Food Policy Research Institute (IFPRI), a CGIAR Research Center established in 1975,
provides research-based policy solutions to sustainably reduce poverty and end hunger and malnutrition.
IFPRI’s strategic research aims to foster a climate-resilient and sustainable food supply; promote healthy
diets and nutrition for all; build inclusive and efficient markets, trade systems, and food industries;
transform agricultural and rural economies; and strengthen institutions and governance. Gender is
integrated in all the Institute’s work. Partnerships, communications, capacity strengthening, and data and
knowledge management are essential components to translate IFPRI’s research from action to impact.
The Institute’s regional and country programs play a critical role in responding to demand for food policy
research and in delivering holistic support for country-led development. IFPRI collaborates with partners
around the world.

AUTHORS
Mulubrhan Amare (m.amare@cgiar.org) is a Research Fellow in the Development Strategy and
Governance Division of the International Food Policy Research Institute (IFPRI), Washington, DC.

Kibrom A. Abay (K.Abay@cgiar.org) is a Research Fellow in IFPRI’s Development Strategy and
Governance Division, Cairo office.

Luca Tiberti (luca.tiberti@ecn.ulaval.ca) is Director of the Partnership for Economic Policy (PEP) and
Assistant Professor in the Department of Economics at the University of Laval, Quebec.

Jordan Chamberlin (j.chamberlin@cgiar.org) is a Spatial Economist at the Maize and Wheat
Improvement Center (CIMMYT), Nairobi Office.

Notices

1
 IFPRI Discussion Papers contain preliminary material and research results and are circulated in order to stimulate discussion and
critical comment. They have not been subject to a formal external review via IFPRI’s Publications Review Committee. Any opinions
stated herein are those of the author(s) and are not necessarily representative of or endorsed by IFPRI.

2
 The boundaries and names shown and the designations used on the map(s) herein do not imply official endorsement or
acceptance by the International Food Policy Research Institute (IFPRI) or its partners and contributors.

3
 Copyright remains with the authors. The authors are free to proceed, without further IFPRI permission, to publish this paper, or any
revised version of it, in outlets such as journals, books, and other publications.
Abstract

This paper combines pre-pandemic face-to-face survey data with follow up phone surveys
collected in April-May 2020 to quantify the overall and differential impacts of COVID-19 on
household food security, labor market participation and local food prices in Nigeria. We exploit
spatial variation in exposure to COVID-19 related infections and lockdown measures along with
temporal differences in our outcomes of interest using a difference-in-difference approach. We
find that those households exposed to higher COVID-19 cases or mobility lockdowns experience
a significant increase in measures of food insecurity. Examining possible transmission channels
for this effect, we find that COVID-19 significantly reduces labor market participation and
increases food prices. We find that impacts differ by economic activities and households. For
instance, lockdown measures increased households' experience of food insecurity by 13 percentage
points and reduced the probability of participation in non-farm business activities by 11 percentage
points. These lockdown measures have smaller impacts on wage-related activities and farming
activities. In terms of food security, households relying on non-farm businesses, poorer
households, those with school-aged children, and those living in remote and conflicted-affected
zones have experienced relatively larger deteriorations in food security. These findings can help
inform immediate and medium-term policy responses, including social protection policies aiming
at ameliorating the impacts of the pandemic, as well as guide targeting strategies of governments
and international donor agencies by identifying the most impacted sub-populations.

Keywords: COVID-19, Pandemic, Food security, labor market participation, food price.

JEL Codes: I12, O13, Q18, Q12, Q18

 iii
Acknowledgments

This paper has been prepared as an output of the Nigeria Strategy Support Program, which has
been managed by the International Food Policy Research Institute (IFPRI) and has been financially
made possible by the generous support of the American people through the United States Agency
for International Development (USAID) in connection with the Feed the Future Nigeria
Agricultural Policy Project. The research presented here was also funded by and conducted as part
of the CGIAR Research Program on Policies, Institutions, and Markets (PIM), which is led by
IFPRI. Abay and Tiberti acknowledge support from the Partnership for Economic Policy (PEP),
which is financed by the Department for International Development (DFID) of the United
Kingdom (UK Aid) and the International Development Research Centre (IDRC) of Canada. Abay
and Tiberti acknowledge support from the Partnership for Economic Policy (PEP), which is
financed by the Department for International Development (DFID) of the United Kingdom (UK
Aid) and the International Development Research Centre (IDRC) of Canada.

 iv
1. Introduction

The COVID-19 pandemic is ravishing local, national, and global economies. In addition to the
direct health impacts, the pandemic is having widespread effects on employment, poverty, food
security, nutrition, education and health, and the overall functioning of food systems (Barrett,
2020; Devereux et al., 2020; Swinnen, 2020; GAIN, 2020). COVID-19 is destabilizing supply
chains at all levels, and creating instability in food supply and food prices (Zurayk, 2020; Torero,
2020; Reardon et al. , 2020a; Reardon et al., 2020b; Ihle et al., 2020; Akter, 2020; FAO, 2020).
The World Bank's recent forecasts show that, globally, the pandemic is likely to push 49 million
people into extreme poverty in 2020 (World Bank, 2020a).1 More than 45 percent (23 million
people) of these people are in Sub-Saharan Africa, implying that the region will be hit hardest in
terms of increased extreme poverty. The United Nations World Food Programme (WFP)
estimated that the number of people globally facing acute food insecurity would almost double by
the end of 2020 (about 135 million people before the crisis), due to income and remittance losses,
and disruption of food systems associated with the pandemic (WFP, 2020a; WFP, 2020b).

 This paper quantifies the impacts of COVID-19 and associated governmental lockdown
measures on household food security and labor market participation in Nigeria. Nigeria is an
interesting case study, as about 83 million people were already living below the national poverty
line (World Bank 2020a). According to the recent World Bank projections, Nigeria is predicted to
be one of the three countries with the highest increase in the number of poor people.2 About 5
million Nigerians are projected to be pushed into poverty because of COVID-19 and associated
mobility restrictions and lockdown measures (World Bank, 2020a; IMF, 2020). Food insecurity
has been a major longstanding challenge in Nigeria, as reflected by Nigeria's high Global Hunger
Index (GHI), low Food Consumption Score 3 (FCS), and high-calorie deficiency (Global Hunger
Index, 2019). The country also experiences significant seasonal and geographical food price
fluctuations due to weather shocks to agricultural production, limited access to markets and

1 The share of the world’s population living on less than $1.90 per day is projected to increase from 632 million to
665 million people (World Bank, 2020a).
2 The three countries with the largest change in the number of poor are estimated to be India (12 million), Nigeria (5

million) and the Democratic Republic of Congo (2 million) (World Bank, 2020a).
3
 FCS is a composite score constructed on the basis of dietary diversity, food frequency, and relative nutritional
importance of different food groups.

 1
infrastructure, and global food price volatility on imported staple foods.4 Disruptions in economic
activities are likely to have direct repercussions on food security as household spending on food
comprises 58% of household expenditures, with poorer households spending more than 75% of
their resources on food (USDA, 2016; FAO, 2020). Disruptions in domestic economic activities
and international food markets are therefore very likely to affect the food security of Nigerian
households through various channels (Eriksson et al., 2008; Barrett et al., 2019; Arndt et al., 2020;
Devereux et al., 2020; Baldwin and Weder di Mauro, 2020; Haddad et al., 2020; Béné, 2020). In
addition, the availability of a large nationally representative panel of households observed before
and after the start of the pandemic makes Nigeria an ideal setting for an early empirical
examination of COVID-19’s impacts.
 Besides quantifying the impact of the spread of the pandemic and government lockdowns
on food security outcomes, this research also aims to shed light on key impact pathways and
differential impacts of the pandemic. COVID-19 could affect food security of households through
different pathways (Baldwin and Weder di Mauro, 2020; Devereux et al., 2020). For instance,
COVID-19 related lockdowns and social distancing measures can adversely affect incomes by
reducing economic and livelihood activities (Devereux et al., 2020; Barrett, 2020; Reardon et al.,
2020b), which directly affects food security. In Nigeria, recent projections show that the economy
will contract by between 3.5 to 5 percent in 2020 during the period the government-imposed
lockdown and mobility measures (World Bank, 2020c; IMF, 2020; Andam et al., 2020). These
lockdowns and restrictions are also disrupting food supply chains and community services,
including education-linked programs (e.g., school feeding) and social protection programs, which
ultimately positively affect food prices (WFP, 2020a). For countries like Nigeria that heavily rely
on imports of major staple foods such as rice and wheat, which registered marked rapid climbs in
spot prices, this is creating an added financial burden that directly affects food security of
households (World Bank. 2020a).5 National and state-level restrictions and lockdowns are
affecting food transportation within the country, with clear implications on food supply and,

4 Nigeria imported 2.4 million metric ton of rice in 2019/2020. Nigeria spent more than USD 4.1 billion on food import
(NBS, 2020).
5 For example, the cost of rice in retail markets soared by more than 30% in March alone (Bloomberg: Key Food Prices

Are Surging After Virus Upends Supply Chains: https://news.bloomberglaw.com/international-trade/key-food-prices-
are-surging-after-virus-upends-supply-chains

 2
consequently, on food prices. This is expected to generate significant repercussions on food
insecurity, particularly in poorer and vulnerable urban households (Ericksen et al., 2010; Tendall
et al., 2015; Gilligan, 2020). We thus evaluate direct effects on two key important channels through
which food security outcomes are likely affected: the disruption of economic activities and
increases in local food prices.
 The effect of the pandemic are expected to differ both by geography and by type of
household, with preexisting vulnerabilities to food security likely to be magnified (Amjath-Babu
et al., 2020; Béné, 2020; Devereux et al., 2020; Ravallion et al., 2020; Mobarak and Barnett-
Howell, 2020). Nigeria has significant longstanding geographical variation in poverty and food
insecurity – more than 75 percent of poor Nigerians live in the north of the country – and the
pandemic is likely to disproportionately exacerbate food insecurity in those already fragile and
conflict-affected zones (World Bank, 2020b, 2020c). Impacts are expected to be most severe for
poorer households in both rural and urban areas (Ericksen et al., 2010; Ravallion et al., 2020;
Mobarak and Barnett-Howell, 2020). As the spread of the pandemic initiates in urban areas,
government responses, including mobility restrictions and lockdowns, will likely be most intense
in urban areas and may affect urban residents more directly than rural households in the short term.
However, the impact of COVID-19 is also expected to vary across livelihood options, with those
activities that require face-to-face interactions likely to experience a significant loss in demand
(e.g., Abay et al., 2020; Baldwin and Weder di Mauro, 2020). Value chain disruptions may extend
deeply into rural areas, affecting both input supply and output demand for farmers and affecting
the income of those employed in both upstream and downstream agricultural value chains (Barrett
et al., 2019; Amjath-Babu et al., 2020, Reardon et al., 2020a). Closure or disruption of informal
food markets, where the poor obtain the majority of their food, may be more severe in extent and
food security impacts than impacts on formal markets (Devereux et al., 2020; Barrett, 2020). We
thus explore potential differential impacts along these dimensions, including livelihood strategies
and options.
 Combining pre-COVID-19 face-to-face surveys with post-COVID-19 phone surveys and
primary data on states' infections and lockdown measures, we exploit spatial variations in exposure
to COVID-19 along with temporal changes in various food security indicators using a difference-
in-difference approach. By comparing food security outcomes of households with varying
exposure to the pandemic before and after the outbreak of the pandemic we can plausibly quantify

 3
the overall and differential causal impact of the pandemic. We also quantify similar impacts
associated with government state-level responses, mainly lockdown and associated mobility
restrictions. With a similar methodology, we also test two main pathways that would, directly and
indirectly, impact households' food security, i.e., the effects of COVID-19 on labor market
participation and food prices.6

 We find that those households exposed to higher COVID-19 cases or more strict
government responses experience significant increase in food insecurity indicators. Also, as
plausible drivers of this result, because of COVID-19, labor market activities deteriorate, and food
prices increase in those areas most affected by the spread of the pandemic and lockdown measures.
For instance, doubling of the number of confirmed cases increase households' experience of food
insecurity by 2-3 percentage points, while it leads to a reduction in major economic activities by
1-3 percentage points. State-level lockdown measures have much larger impacts on these
outcomes: lockdowns increased households' experience of food insecurity by 13 percentage points,
and reduced non-farm business activities by 11 percentage points. These results remain consistent
across alternative indicators of food insecurity and labor market participation, albeit some
differences in the impacts across alternative activities. We show that food insecurity is also
affected by COVID-19-related increases in food prices. We also document important differential
impacts across various economic activities and households. For instance, state-level lockdown
measures are more impactful in disrupting non-farm business activities, while farming activities
appear to be less affected by state-level lockdowns. Similarly, poorer households, those with
school-aged children, and those households living in remote and conflict-affected zones bear the
highest brunt of the pandemic. In terms of livelihood options, those households engaged in non-
farm business activities appear to be hardest hit, while those engaged in wage-related activities are
relatively less affected.
 Although considerable anecdotal evidence has been generated recently on the impacts of
COVID-19 on the labor market and food security outcomes in Africa, rigorous empirical studies
based on household-level survey data have largely not been available before now. Understanding
the magnitude, distributional differences, and pathways of impacts of the COVID-19 pandemic on
households' food security and economic activities is critical for designing effective policies and

6 https://www.ifpri.org/blog/how-covid-19-may-disrupt-food-supply-chains-developing-countries

 4
interventions to mitigate the adverse effects of the pandemic. Using nationally-representative
household survey, this paper contributes new evidence on the effects of COVID-19 on food
security as well as on key impact pathways. These findings have important implications and hence
can inform immediate and medium-term policy responses. For instance, our findings can inform
social protection policies aiming at weathering the impacts of the pandemic, which rely heavily on
effective targeting strategies. This is particularly imperative for governments like Nigeria, which
has limited fiscal space and competing needs for post-COVID-19 recovery investment. Our
findings can help governments and international donor agencies improve their targeting strategies
to identify the most impacted sub-populations. The evidence that government responses, such as
lockdowns and other mobility restrictions, have disproportionately large negative impacts on
poorer households is consistent with arguments made by those who are critical of such policies for
low- and middle-income countries (e.g., Ravallion et al., 2020, Mobarak and Barnett-Howell,
2020; Bargain and Aminjonov, 2020).

 The remainder of this paper is organized as follows. Section 2 describes the context and
data. Our empirical strategy is presented in Section 3. Section 4 presents estimation results and
associated discussions, while Section 5 provides concluding remarks.

2. Context and Data

2.1 Context
Nigeria is Africa's most populous country, characterized by high poverty rate, large informal sector
economy, high dependence on imported staples, and high exposures to shocks. Nigeria is one of
the few African countries that first recorded COVID-19 cases and hence among those African
countries who experienced significant economic disruptions because of the pandemic. The first
COVID-19 case in Nigeria was recorded on February 27, and by late June, the number of
confirmed cases passed the 30,000 mark (NCDC, 2020). 7 As part of the measures to contain the
spread of the pandemic, federal and state-level governments have introduced social distancing and
mobility restrictions in March 2020 (FMBNP, 2020). The federal government closed all schools
in mid-March, and several states and local authorities introduced bans on public and social
gatherings. By late March, the Nigerian government closed its land and air borders to all travelers

7
 The Nigerian Centre for Disease Control (NCDC) is responsible for overall management of testing, isolation, and
treatment of COVID-19 patients.

 5
and suspended passenger rail services within the country (Ogundele, 2020; NCDC, 2020).
Furthermore, the federal government announced fiscal and stimulus measures, amounting up to 50
billion Naira to support households, and small and medium-scale enterprises affected by COVID-
19 (FMBNP, 2020).
 Nigeria's lockdown and mobility restrictions were mostly introduced by federal and state-
level governments. Starting from March 29, 2020, federal and state governments announced
lockdown measures and strict mobility restrictions for some states such as Abuja FCT, Lagos,
Ogun, Kano, Delta, Ekiti, Kano, Kaduna, Kwara, and Taraba states.8 Lockdown measures in other
states were introduced by state governments independently of the federal government, including
in Akwa Ibom, Borno, Osun, and Rivers. In most cases, the lockdowns remained in force for about
5-8 weeks. These measures restricted movement of residents and led to the closure of business
operations, and the closure of regional borders linking lockdown areas with the rest of the country.
 These lockdown and mobility restrictions are likely to disrupt major economic activities,
including local businesses. Nigeria is highly susceptible to income shocks and food insecurity
associated with the spread of the pandemic. As we show in the next sections, food prices are
already soaring in the country, food supply chains (domestic and international) are being disrupted,
informal sector unemployment rates are likely to be increasing, and poor households are likely to
be facing food shortages. All these effects are likely to increase food insecurity.

2.2 Data and sampling strategy
In this study, we combine the pre-COVID-19 face-to-face survey with post-COVID-19 phone
survey to quantify the overall and differential impact of COVID-19 on households' food security
and labor market participation. These data and surveys are part of the World Bank's Living
Standards Measurement Study – Integrated Surveys on Agriculture (LSMS-ISA) and are collected
in collaboration with the Nigerian Bureau of Statistics (NBS). The LSMS-ISA data for Nigeria,
also known as General Household Survey-Panel (GHS-P) include four rounds collected in 2010-

8
 In addition to lockdown measures, federal and state government implemented different measures includes: (i) travel
bans which includes restricted entry into the country for travelers from high risk countries; closure of two main
international airports; suspension of all railway passenger services in the country; closure of all air and land borders.
(ii) closure of schools and religious institutions. (iii) Bans on public and social gatherings across all states in Nigeria.
(iv) Curfew hours which restrict movement of people.

 6
11, 2012-13, 2015-16 and 2018-19. These data are nationally representative, and they provide
detailed information on employment, income, food, and nutrition security indicators.
 Following the COVID-19 pandemic, the LSMS-ISA program has initiated tracking of
national samples of households that had been interviewed during the latest rounds of the LSMS-
ISA surveys using phone surveys. 9 Among the total sample of households (4,976) interviewed in
the latest round (post-harvest January/February visit) of the GHS-P survey in 2019, 4,934 (99.2%)
provided at least one phone number. Out of the full sample of households with phone numbers, a
random sample of 3,000 households was selected for the phone survey, to collect a complete
sample of 1800 households that enable statistical monitoring of (monthly) changes in key
outcomes of interest. Out of these 3,000 households prepared for phone survey, 69 percent of
sampled households were successfully contacted, and among these, 94 percent (1,950) households
were fully interviewed (NBS and World Bank, 2020). The final complete sample for the phone
survey constitutes these 1,950 households, and they are expected to be contacted in subsequent
rounds of the survey. To create a balanced panel across rounds, we merged these households with
the immediately previous round (2019) and kept those households with complete information in
both rounds.
 To adjust for potential (systematic) attrition in the phone survey and construct nationally
representative statistics, one must construct and apply appropriate sampling weights. The LSMS-
ISA team constructed the sampling weights using the weights for the GHS-Panel as the basis, with
further adjustment for attrition in the phone survey. The weights for the final sample of households
from the phone survey were calculated in several stages, and readers are referred to NBS and
World Bank (2020).10 These weights are shown to sufficiently ensure comparable distribution of
observable characteristics from the GHS-P and the phone survey (NBS and World Bank, 2020).
 In this paper, we use the first round of the phone survey (the only available at the time of
writing), which was administered in April-May 2020.11 The LSMS-ISA phone surveys are planned
to be monthly surveys and hence are high-frequency surveys. These high-frequency phone surveys
covered topics including (1) knowledge regarding the spread of COVID-19; (2) prices and access

9These phone surveys have been (are being) conducted in Ethiopia, Malawi, Nigeria, Tanzania and Uganda.
10 See http://documents1.worldbank.org/curated/en/717901591889288314/pdf/Basic-Information-Document.pdf for
detail information on sampling weights.
11 The outcomes and information from 2019 were collected during January and February 2019.

 7
to food and non-food necessities; (3) employment and income losses; (4) food insecurity; and (5)
subjective wellbeing. We are more interested in those outcomes, which can be observed in the
face-to-face (pre-COVID-19) and phone (post-COVID-19) surveys. Since both the pre-and post-
COVID-19 LSMS-ISA data contain important information on households' participation in
economic activities and food insecurity experience, we can examine the patterns and dynamics of
food insecurity and labor allocation along multiple periods. As we discuss below, we are
particularly interested in tracking impacts on food insecurity and disruptions in economic
activities, which are both followed and measured in similar ways in both rounds.
 Table 1 presents weighted summary statistics of selected variables used in our analysis.
For comparison purposes and for those variables observed in both rounds (and that are not expected
to change significantly because of COVID-19), we report these summary statistics separately for
each round. Those observable household characteristics that are observed for both rounds appear
to be statistically comparable across both rounds. This is encouraging as most of these household
characteristics are not expected to change in such a short period significantly. About 19 percent of
our sample are female-headed in the 2019 round, while the corresponding figure for the 2020 round
amounts 18 percent. We also show a few other pre-COVID variables which are used to capture
eventual heterogeneity effects across the population.

 8
Table 1: Descriptive results of key explanatory variables
 Pre-COVID-19 Post-COVID-19
 (2019) (2020)
 Male headed households (yes=1) 0.81 0.82
 Age of head (years) 49.64 49.42
 Education of head (years) 8.21 8.87
 Family size (numbers) 5.53 5.52
 Value of assets (PPP US) 1677.66 -
 Urban households 0.38
 Households with school going children 0.74
 Households living in North East Nigeria 0.17
 Distance to road (km) 5.31 -
 Livelihood (income) sources during the last 12 months12
 Farming /agriculture 0.77 -
 Non-farm business 0.64 -
 Wage employment 0.34 -
 Remittances and assistances 0.38 -
 No. observations 1,906 1,906
Source: Authors' calculations based on Nigeria LSMS-ISA 2019 and 2020 rounds. Sample weights have been applied.

2.3 Definition of variables and descriptive results
Outcome variables
Food insecurity indicators: We measure food insecurity using three indicators, capturing
households' experience of food insecurity. In both rounds, households' food insecurity experiences
are elicited using the self-reported experience of hunger and food shortage in the last 30 days
(Hoddinott, 1999; Carletto et al., 2013; Bellemare and Novak, 2017). The first indicator asks if a
household head or any other adult in the household had to skip a meal because there was not
enough money or other resources to get food. The second indicator elicits whether the household
has run out of food and takes a value of 1 if the household ran out of food because there was not
enough money or other resources to get food. The third indicator takes a value of 1 if the household
or any other adult in the household went without eating for a whole day because of a lack of money
or other resources.
 These three indicators of food insecurity are strongly correlated among each other. Thus,
we also employ principal component analysis (PCA) to construct an aggregate index and measure

12We note that households were asked to mention multiple sources of livelihood and hence choices are not mutually
exclusive.

 9
of food insecurity. This food insecurity index, which is standardized for facilitating interpretation,
is a linear combination of the three indicators of food insecurity experience. We thus employ both
these disaggregate binary indicators as well as the composite food insecurity index.

Labor market participation: The 2019 and 2020 surveys collect information on households'
participation in income-generating activities over the last seven days. The major income-
generating activities include farming, non-farm business, and wage-related activities. We thus can
measure and quantify changes in labor allocation across both rounds. We define an indicator
variable for farming activities, which takes a value of 1 if the household head or any member of
the household worked on a household farm growing crops, raising livestock, or fishing, and 0
otherwise. Similarly, we define an indicator variable for non-farm business, which takes a value
of 1 if the household head or any member of the household operated family business and zero
otherwise. Both farm and non-farm activities are observed at the household level. We also generate
an indicator variable for participation in wage-related activities (observed at the individual level),
which assumes a value of 1 if the household head or any other member of the household did work
wage job, either at their place of work or from home, and 0 otherwise. We also generate an
indicator variable for participation in any economic activity which assumes a value of 1 if the
household head or any member of the household participated in any of the above economic
activities, and zero otherwise. Because of this, our estimations aim to quantify impacts of the
pandemic at the extensive margin of labor market participation.

Food consumer price index (CPI): The Food Consumer Price Index (CPI) we employ in this study
is collected and constructed by the Nigeria Bureau of Statistics (NBS), which measures the average
change in prices over time consumers pay for a basket of food items. Food CPI measures changes
in the retail prices of food items and is the principal indicator of changes in retail food prices. It is
used to measure consumer inflation in Nigeria's economy. We use food CPI for May 2019 and
May 2020, corresponding to both survey rounds we employ in this study.

 Table 2 reports key outcome variables: households' food security and labor market
participation rates in both rounds. The results in Table 2 show significant increases in all food
insecurity indicators. For example, households' food insecurity experiences, as measured by
incidence of skipping a meal, running out of food, and going without eating in the last 30 days

 10
have increased by 47, 32, and 20 percentage points, respectively. Our empirical estimations
explore whether these changes and increases in food insecurity can be attributed to COVID-19 and
associated mobility restrictions. On the other hand, participation in income-generating activities
significantly reduced in the post-COVID-19 round, while the food consumer price index increased
substantially.

Table 2: Descriptive results of key outcome variables
Key outcome Pre-COVID-19 Post-COVID-19 Difference
Variables (2019) (2020) test
Food security indicators
Skip a meal (0/1) 0.26 0.73 0.47***
Run out of food (0/1) 0.25 0.57 0.32***
Went without eating for a whole day(0/1) 0.05 0.24 0.20***
Food insecurity index (standardized PCA index) -042 0.43 0.85***
Labor market participation
Farm activities 0.65 0.45 -0.19***
Non-farm business activities 0.57 0.37 -0.20***
Wage employment 0.27 0.11 -0.15***
Work in any activity 0.95 0.69 -0.26***
Food consumer price index (CPI) 289.98 359.59 69.61***
No. observations 1,906 1,906
Source: Authors' calculations based on Nigeria LSMS-ISA 2018-19 and 2020 rounds. Values are weighted using the
 sampling weights discussed above.
Notes: Food security indicators are measured as household-level responses to a question that elicits food insecurity
 experienced in the last 30 days. The food insecurity index is constructed using principal component analysis.
 Labor market participation indicators take a value of 1 if any adult member of the household reported labor
 allocation for that category of activity within the last 7 days. The food consumer price index is computed at
 the state level.

 Households were also asked about the impact of the pandemic on major livelihood sources.
These are self-assessed subjective indicators, but they can provide suggestive evidence on the
differential sectoral (livelihood) impacts of the pandemic, which can complement our forthcoming
difference-in-difference estimations. Households were asked for major sources of livelihood in the
last 12 months and changes in associated income since the outbreak of COVID-19. As shown in
Figure 1, 72 percent of households reported that their income from farming and agricultural
activities has reduced, 83 percent of households reported a reduction in income from non-farm
businesses, and about half of them report reductions in wage-related incomes. These suggest that
non-farm businesses are the most affected, and wage-related activities are relatively least affected.

 11
This is not surprising as some wage-related activities are likely to be under formal contractual
agreements, and some of these activities may be performed remotely and hence less affected by
mobility restrictions.

Figure 1: Changes in income by sources since the outbreak of the pandemic. These statistics are
adjusted for sampling weights.
 1
 0.9
 0.8
 0.53
 0.7
 0.72 0.77 0.78
 0.6 0.83
 0.5
 0.4
 0.3
 0.43
 0.2 0.19
 0.11 0.19 0.17
 0.1
 0.09 0.06 0.04 0.04 0.05
 0
 Farm income Non-farm business Wage employment Remittances & Total income
 income income assistances income

 Increased Stayed the same Reduced

Key explanatory variables: state-level COVID-19 cases and government lockdowns

We compiled the COVID-19 cases and lockdown measures from the Nigerian Centre for Disease
Control (NCDC) (NCDC, 2020; IFPRI, 2020). As our post-COVID-19 survey was fielded in April
and May 2020, we extract confirmed COVID-19 cases until the end of May 2020.
 We compile government measures based on policy announcements by Federal and State
Governments of Nigeria (FGN, 2020a; 2020b; NCDC, 2020). We focus on the strictest mobility
restrictions, defining an indicator variable that takes a value of 1 for those states introducing
lockdown measures to contain the spread of the virus, while those states which did not introduce
lockdown measures take a value of 0. 13 The timing and length of lockdowns vary across states. As
our post-COVID-19 survey was fielded in April and May 2020 and our food security questions
elicit food shortage experiences in the last 30 days we consider lockdown measures introduced

13
 Nigeria has 36 states and one federal territory (the Federal Capital Territory). For simplicity, we refer to all these
as 37 states. All states are included in the analysis.

 12
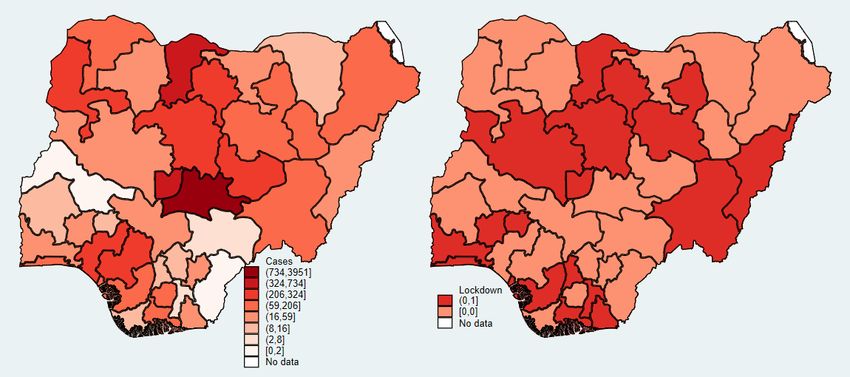
between March 28 to May 15, which resulted in 17 states out of the total 37 states in Nigeria (see
Figure 2).
 Thus, our main explanatory variables of interest are the number of COVID-19 cases and
an indicator variable for those states who introduced lockdown measures to contain the spread of
the pandemic.14 The number of COVID-19 cases may underestimate the true rate of infections in
most Nigerian states because of limited testing capacity, generating some form of non-classical
measurement error which could correlate with our outcomes of interest.15 However, it is worth
noting that what matters for household and state-level responses are actually confirmed cases and
not the actual unknown infection rates.
 The lockdown measures restrict movement of people and vehicles except for health
personnel, fire service, security personnel, power and water supply agencies, pharmaceutical and
medical services. We note that, although lockdown policies involve similar mobility restrictions,
their implementation and stringency are likely to vary across states. To gauge the relevance and
predictive power of our lockdown indicator, we conduct a quick validation exercise using data
from Google mobility report. We particularly use daily state-level human mobility data from
Google COVID-19 mobility reports. These data provides aggregate daily mobility changes after
the pandemic, relative to some pre-COVID-19 baseline period, by tracing users’ mobile device
location history.16 If our state-level lockdown indicator is a valid measure of mobility restrictions
we expect strong negative correlation between our indicator and the daily percentage change in
mobility from Google mobility reports. Our simple regressions in Table 1A show that our
lockdown indicator strongly predicts reduction in all types of mobility. For instance, lockdown
measures are associated with about 11 percentage change (reduction) in daily transport-related
mobilities. These results are encouraging.
 The average state-level COVID-19 cases (at the end of May) is 222, and 46 percent of the
states have imposed lockdown restrictions in the period March 28 through May 15. Figure 2
presents the geographic distribution of confirmed COVID-19 cases and lockdown interventions
(measured at the state levels) across states in Nigeria. As expected, federal and state-level

14We also construct an indicator variable assuming a value of 1 for states above the median confirmed COVID-19
case and 0 for those states below the median COVID-19 case in our sample.
15 The implication of such correlated non-classical measurement error is ambiguous (e.g., Abay et al., 2019).
16 For details about these data, see: https://www.google.com/covid19/mobility/

 13
governments are likely to introduce lockdown measures with increasing confirmed COVID-19
cases. However, some states with a high level of COVID-19 cases have abstained from introducing
lockdown measures while some other states with low COVID-19 cases have announced lockdown
measures. We exploit these variations in some of our estimations.

Figure 2: Confirmed COVID-19 cases and Lockdown restrictions by states

Source: Federal Government of Nigeria (2020) and Nigeria Center for Disease Control (NCDC, 2020).

"Heterogeneity" variables:

To better understand the differential impacts of COVID-19 cases and associated lockdown
measures on households' food security and labor market participation rates, we employ baseline
characteristics of households to differentiate "vulnerable" households and livelihoods. As the
impacts of the pandemic are likely to vary across households, we aim to uncover heterogeneous
impacts across various groups, especially those deemed to be vulnerable households and regions.
The availability of baseline surveys allows us to estimate the impact of the pandemic across various
socioeconomic groups and regions (see the mean value of these variables in Table 1). For instance,
we explore potential differential impacts across rural and urban households as well as across poor
and non-poor households. We also classify households in remote and more accessible areas as well
as across households living in conflicted affected and other states. Households with school-going
children may experience further deterioration in food security due to the nationwide school
closures and associated school-feeding programs. To test this hypothesis, we estimate differential

 14
impacts for those households with and without school-going children. We also construct indicators
of household sources of livelihood in the past twelve months, including farming/agriculture, non-
farm business, wage employment, remittances, and assistances.17 We then estimate heterogeneous
responses and impacts across livelihood options.

3. Empirical Strategy

To quantify the impact of COVID-19 on households' food insecurity (our main outcome of
interest) as well as labor market participation and food prices (our intermediate outcomes of
interest), we exploit spatial variations in the spread of the pandemic across states in Nigeria, along
with the temporal variations in our outcomes of interest. We specifically estimate the following
fixed effects specification to quantify the impact of COVID-19:
 ℎ = ℎ + 0 + 1 ∗ + ℎ (1)
where ℎ stands for food insecurity and labor market outcomes for each household h and round
t. 18 ℎ captures household fixed effects, Cases represent the number of confirmed COVID-19
cases for each state, which is expressed in absolute numbers as well as, in alternative specifications,
per million population in each state. is a dummy variable, assuming a value of 1 for the post-
COVID-19 round and 0 for the pre-COVID-19 round. The parameter associated with this round
dummy captures aggregate trends in food security and labor market outcomes. This variable also
captures aggregate potential differences in our outcomes of interest driven by differences in survey
methods (face-to-face or phone survey). ℎ is an error term that is assumed to be uncorrelated
with COVID-19 cases, at least conditional on household fixed effects and state-level policy
responses. The household fixed effects in equation (1) capture time-invariant heterogeneities
across households. The specification in equation (1) is a standard difference-in-difference
approach, except that our treatment intensity variable is continuous.
 Our identifying variation in equation (1) comes from a combination of spatial variations in
COVID-19 and temporal variations in our outcome of interest. The interaction term, between
COVID-19 cases and post-COVID-19 round dummy, captures differential temporal evolution in

17Remittances and assistances are defined as remittances and assistances received from inside the country or foreign
sources.
18 For the food price estimation, the unit of analysis is the state, and we control for state fixed effects.

 15
our outcome of interest across states with varying exposure to the pandemic. We hypothesize that
those states experiencing a higher intensity of the pandemic are more likely to witness a higher
reduction in labor market participation and a higher increase in food insecurity. Thus, the
estimation in equation (1) entails comparing the temporal evolution of food security and labor
market outcomes for those states with high and low exposure to the pandemic.
 Potential temporal variations in food security and labor market participation rates are
likely to be driven by both government responses to the pandemic as well as household-level
responses associated with precautionary measures to reduce the contraction of the virus. The
economic repercussions of the pandemic are expected to vary depending on individuals'
precautionary measures and state-level government responses (Abay et al., 2020; Koren and Peto,
2020). In line with this, various states in Nigeria have imposed alternative forms of restrictions
and lockdowns, which are likely to affect individuals' mobility and hence the labor market and
food security outcomes. To quantify the differential and compounding impact of these lockdown
measures, we estimate the following fixed effects specification:
 ℎ = ℎ + 0 + 1 ∗ + ℎ (2)
 where now stands for a dummy variable indicating for the introduction of
lockdown measures.19 To gauge and identify the relative impact of government measures and
individually-driven precautionary measures driven by the spread of the pandemic, we further
interact the spread of the pandemic with lockdown measures. More specifically, we create an
indicator variable for states recording above-median cases and interact this with lockdown
measures. However, the breadth and implementation of these lockdown measures are likely to vary
across states. Thus, although such an exercise can give us some latitude to identify the relative
impacts of the spread of the pandemic and government-induced restrictions, such results can only
provide suggestive evidence.
 The impacts of the pandemic are likely to vary across households with varying
socioeconomic status, livelihood options, and underlying conditions. We, thus, aim to uncover the
potential differential impact of COVID-19 across various groups of households. In particular, the
impacts are expected to be higher among those households and regions deemed to be vulnerable,
including poor households, those households with school-going children and those living in

 We note that as the number of COVID-19 cases are strongly correlated with government responses to the pandemic,
19

we cannot control for both COVID-19 cases and government measures in the same specification.

 16
conflict-affected and remote zones. Using baseline information on households' residence,
socioeconomic status, and livelihood options, we quantify the differential impact of the pandemic
on households' food security and labor market participation using the following empirical
specification:
 ℎ = ℎ + 0 + 1 ∗ ℎ ∗ + ℎ (3)
where all the terms, except the term "Vulnerable", are as defined above. Our vulnerable group of
households includes poorer, households with school children, urban households and those living
in remote and conflict-affected zones and neighborhoods. 1 in equation (3) capture differential
trends in food security and labor market outcomes of those deemed "vulnerable" households,
which can be attributed to the spread of the pandemic and associated lockdown restrictions.
 We also examine potential differential impacts across households with varying exposure
to the pandemic because of their livelihood strategies and sectoral engagement in labor markets.
For example, some sectors are likely to experience a disproportionally higher impact associated
with social distancing and lockdown measures. For example, several recent economywide analyses
of the impact of the pandemic show that services are the most affected sectors (e.g., Breisinger et
al., 2020). Abay et al. (2020) show that those sectors and services involving face-to-face
interactions experience much higher loss in demand for services, while those services meant to
substitute personal interactions (e.g., ICT services) enjoy a significant boost in demand.
Traditional small non-farm businesses in Africa are likely to involve personal interactions and
hence may be more affected than those activities that can be performed remotely. Similarly, rural
activities might be less prone to the spread of the pandemic and associated lockdown measures for
several reasons. First, the spread of the pandemic is likely to be higher among urban areas. Second,
government responses and restrictions are expected to be more strict and intense among urban
areas. Third, urban food systems and value chains are likely to be more affected by short-term
shocks than rural livelihoods. We thus estimate the following empirical specification to quantify
the differential impact of the pandemic across livelihood options.
 ℎ = ℎ + 0 + 1 ∗ ℎ ℎ ∗ + ℎ (4)
Where all notations except "Livelihood" are as defined above. As shown in Table 1, households’
livelihood options and sources of income in our sample include farming (agriculture), non-farm
business, wage-employment, and remittances and assistances.

 17
To account for systematic non-response in the post-COVID-19 phone survey, we weighted
all our estimates by the sampling weight associated with the LSMS-ISA phone survey data. 20 This
weighting procedure enables recovering unbiased and representative statistics under the
assumption that data are “missing at random” conditional on some observable factors that are
accounted in the construction of weights (e.g., Wooldridge, 2007; Korinek et al., 2007).As we are
following households across rounds, error terms are expected to be correlated across time. We,
thus, cluster standard errors at the household level.

4. Results

4.1. Food security impacts
In this section, we present estimation results on the impact of the pandemic and associated
lockdowns on food security, corresponding to equations (1) and (2). Table 3 shows the impact of
COVID-19 on food security outcomes, measured as binary indicators of food insecurity
experience.21 The number of reported COVID-19 cases for each state are transformed using an
inverse hyperbolic sine transformation, to accommodate those few states with zero reported
cases. 22
 The interaction between COVID-19 cases and the post-COVID-19 dummy captures the
temporal variation in the evolution of our outcomes of interest associated with varying exposure
to the spread of the pandemic. A positive and significant impact shows that states registering higher
numbers of COVID-19 cases are likely to experience greater increases in the probability of food
insecurity, relative to the pre-COVID-19 period. The coefficients in Table 3 show that doubling
the number of COVID-19 cases is associated with a 2.4-2.7 percentage point increase in the
probability that a household ran out of food or skipped a meal in the last 30 days.23 Similarly, one
percent increase in the number of COVID-19 cases is associated with 0.08 standard deviations
increase in food insecurity index. The size of the impact is plausible, although we expect

20 A discussion on the construction of these sampling weights are given in NBS and World Bank (2020).
21 Because of the low number of zero-valued cases in the infection rates, the inverse hyperbolic sine transformed values
differ very little from log transformed values and can be effectively interpreted in the same manner. The only state
which didn’t report COVID-19 cases in May 2020 was Cross Rivers.
22 As we have large positive values of COVID-19 cases for most states, such a transformation is expected to be

innocuous (e.g., Bellemare and Wichman, 2019).
23 We note that, as the spread of the pandemic remains fast globally, doubling of COVID-19 cases takes only a few

weeks (in some cases less than a week) in many countries, including in Nigeria.

 18
significant heterogeneities across different types of households and contexts, an empirical question
we address in the next section.24

Table 3: Impact of COVID-19 cases on household food security outcomes
 (1) (2) (3) (4)
 Skip a meal Ran out of food Went without eating Food insecurity index
 for a whole day
Post dummy (2020 round) 0.369*** 0.217*** 0.072 0.639***
 (0.052) (0.054) (0.050) (0.083)
COVID-19 cases*Post 0.025 ** 0.024 ** 0.027 *** 0.079***
 (0.011) (0.011) (0.010) (0.025)
Constant 0.262 *** 0.251 *** 0.056 *** -0.409 ***

 (0.010) (0.010) (0.009) (0.019)
Household fixed effects Yes Yes Yes Yes
R-squared 0.39 0.22 0.15 0.37
No. observations 3812 3812 3812 3812
Source: Authors' calculations based on Nigeria's LSMS-ISA 2018-19 and 2020 rounds.
Notes: All estimation results are adjusted by sampling weights accounting for systematic non-response in the phone
 survey. The number of confirmed COVID-19 cases are transformed using an inverse hyperbolic sine
 transformation to accommodate one state with zero case. Standard errors, clustered at the household level,
 are given in parentheses. * p < 0.10, ** p < 0.05, *** p < 0.01.

 The impacts shown in Table 3 are likely to be compounded by national and state-level
government responses to the pandemic, which included social distancing and mobility restrictions
as well as partial and complete lockdown measures. We thus estimate the empirical specification
in equation (2) to quantify the implication of variations in state-level responses to the pandemic.
We mainly focus on the strictest mobility restrictions and hence generate an indicator variable for
states introducing lockdown measures. We then compare temporal evolutions in food security
outcomes across states with and without lockdown measures. Table 4 generally shows that
lockdowns increase food insecurity. For example, we find that state-level lockdowns increase the
probability that a household skips a meal in the last 30 days by 13 percentage points.

24When we use the number of infections per 1 million inhabitants, the results are qualitatively the same. Results are
reported in the Appendix (Table 2A-6A).

 19
Table 4: Government responses and food security indicators
 (1) (2) (3) (4)
 Skip a meal Ran out of food Went without eating Food insecurity
 for a whole day index
 Post dummy (2020 round) 0.426*** 0.299*** 0.172*** 0.782***
 (0.027) (0.029) (0.024) (0.057)
 Lockdown*Post 0.130*** 0.071* 0.059* 0.215***
 (0.038) (0.038) (0.034) (0.076)
 Constant 0.262*** 0.251*** 0.056*** -0.409***
 (0.010) (0.010) (0.009) (0.019)
 Household fixed effects Yes Yes Yes Yes
 R-squared 0.41 0.27 0.19 0.37
 No. observations 3812 3812 3812 3812
Source: Authors' calculations based on Nigeria LSMS-ISA 2018-19 and 2020 rounds.
Note: Dependent variables are as defined in Table 2. All estimations are adjusted by sampling weights accounting for
 non-response in the phone survey. Standard errors, clustered at the household level, are given in parentheses.
 Lockdown is an indicator variable taking a value of 1 for those states which introduced lockdown measures to
 contain the spread of the virus. Standard errors, clustered at the household level, are given in parentheses. * p
 < 0.10, ** p < 0.05, *** p < 0.01.

 To jointly examine the effects of infection rates and lockdowns, we also interact the
indicator variables for the spread of the pandemic with lockdown measures. To facilitate this, we
construct an indicator variable assuming a value of 1 for states above the median confirmed
COVID-19 case and 0 for those states below the median COVID-19 case in our sample. Interacting
these indicators gives us four groups: high COVID-19 cases with lockdown, high COVID-19 cases
without a lockdown, low COVID-19 cases with lockdown, and low COVID-19 cases without
lockdown. The estimation results are shown in Table 5. As expected, households in states
recording high COVID-19 cases and with lockdown measures are hit hardest and hence experience
the greatest increase in food insecurity. Coefficient estimates suggest that both the spread of the
pandemic as well as government-induced lockdown measures are increasing food insecurity.
However, the former seems to dominate.

 20
Table 5: Disentangling the impact of COVID-19 cases and government measures
 (1) (2) (3) (4)
 Skip a meal Ran out of Went without eating Food insecurity
 food for a whole day index
Post dummy (2020 round) 0.409*** 0.238*** 0.125*** 0.672***
 (0.035) (0.036) (0.031) (0.070)
High COVID-19 cases*Lockdown*Post 0.203*** 0.176*** 0.119*** 0.430***
 (0.047) (0.048) (0.044) (0.093)
High COVID-19 cases*No-lockdown*Post 0.038 0.131** 0.103** 0.239**
 (0.055) (0.057) (0.049) (0.113)
Low COVID-19 cases*Lockdown*Post 0.018 0.025 0.077* 0.076
 (0.061) (0.055) (0.042) (0.110)
Constant 0.262*** 0.251*** 0.056*** -0.409***
 (0.010) (0.010) (0.009) (0.019)
Household fixed effects Yes Yes Yes Yes
R-squared 0.42 0.26 0.16 0.38
No. observations 3812 3812 3812 3812
 Source: Authors' calculations based on Nigeria LSMS-ISA 2018-19 and 2020 rounds.
 Note: "High" and "Low" COVID-19 cases are defined as above and below the median confirmed values in our sample,
 respectively. All estimations are adjusted by sampling weights for accounting non-response in the phone
 survey. The number of confirmed COVID-19 cases is transformed using inverse hyperbolic sine transformation
 to keep zero cases for one state. Lockdown stands for indicator variables for those states who introduced
 lockdown measures to contain the spread of the virus. Standard errors, clustered at the household level, are
 given in parentheses. * p < 0.10, ** p < 0.05, *** p < 0.01.

 4.2. Mechanisms and Intermediate outcomes
 The impact of COVID-19 on labor market participation
 Reduction in income is one of the most important mechanisms through which the COVID-19
 pandemic can affect food insecurity. Results in Table 6 show the implication of the spread of the
 pandemic on labor market participation rates. As expected, the spread of the pandemic is associated
 with a significant reduction in economic activity. The interaction term in column 1 of Table 6
 shows that doubling the number of COVID-19 cases is associated with a 2 percentage points
 reduction in the probability of participation in any economic activity (in the last seven days). The
 second column presents impacts on-farm activities, while the third and fourth columns report
 impacts on non-farm business and wage-related activities. Overall, these results imply that
 households in areas with a higher degree of exposure to the pandemic have experienced significant
 reductions in economic engagement. Wage-related activities are the least affected, probably
 because some of these activities can be performed remotely (e.g., Dingel and Neiman, 2020) and/or
 are under formal contracts. As shown in our data (not reported here for lack of space), the majority
 of wage workers are employed in the public sector and non-governmental organizations, which
 are less likely to fire employees and allow employees operate some of their functions in some

 21
You can also read