Smart Specialisation - Qualitative Analysis - Estonian Development Fund, February 2013 - Arengufond
←
→
Page content transcription
If your browser does not render page correctly, please read the page content below

Smart Specialisation –
Qualitative Analysis
Estonian Development Fund, February 2013

Draft, February 20, 2013
T                   Table of Contents

Foreword                                                                     3
Summary                                                                      4
1. Process of smart specialisation in Europe                                 6
2. Smart specialisation in Estonia                                           8
       2.1. Structure of Estonian economy from the viewpoint of innovation   8
       2.2. Quantitative analysis                                            13
       2.3. Qualitative analysis                                             14
       2.4. Global trends                                                    16
3. Result of growth area selection                                           18
       3.1. Selected growth areas                                            18
       3.2. Detailed analysis of growth areas                                19
            3.2.1. Information and communications technology (ICT)
            horizontally via other sectors                                   19
            3.2.2. Healthcare technology and services                        22
            3.2.3. More efficient use of resources                           22
3.3. Further activities                                                      23

Annex 1. Process of smart specialisation in Europe                           24
Annex 2. Workgroup participants, survey respondents & interviewees           26
F                         Foreword

Smart specialisation is a term that will be heard a lot in Europe in      Cheap labour used to be Estonia’s competitive advantage in Europe,
2013. The purpose of smart specialisation is to identify areas of         but this difference is decreasing unavoidably as the income levels
the economy where the potential for growth and the value added            in Estonia increasingly converge with those of Western Europe.
are above average, and where a competitive advantage can be               There needs to be renewed focus on so-called “smart” jobs to
achieved by investing in research and development. The European           avoid losing competitiveness even further. Estonia must move up
Commission has placed smart specialisation in the spotlight among         in the production chain and concentrate more on innovation and
research and development activities and innovation strategies, and        development. Smart specialisation is therefore very important, as
turned it into a precondition for receipt of EU funds. The growth         we need to find areas that increase our efficiency, to avoid relying
areas selected in the course of smart specialisation are priorities in    mainly on low wage levels as our competitive edge.
the 2014-2020 financing period. The starting point in the selection of
growth areas is the current specialisation of the Estonian economy
and research whilst the process of entrepreneurial discovery and
                                                                              Estonia must move up in
global economic trends are determining factors.                               the production chain and
It is important to emphasise that the most sought-after areas are
                                                                           concentrate more on innovation
those with strong potential for cooperation between industry and                  and development.
science. This focus is extremely important, as they do not always
go hand in hand in Estonia or elsewhere in Europe, which means            The process of smart specialisation influences strategic choices in
that there is a lot of potential to improve cooperation.                  the RD&I strategy and the entrepreneurial growth strategy prepared
                                                                          by the Ministry of Education and Research and the Ministry of
It is also important to understand the background of smart                Economic Affairs and Communications.
specialisation. The European economy is still in crisis and the
development of new innovation policies is seen as Europe’s new            We can definitely say that we are living in an era of major economic
source of innovation growth, which will improve its competitiveness.      change. The Economist recently wrote in a special issue (21 April
The crisis in Europe is, above all, a crisis of competitiveness. High     2012) that we have been hit by the third wave of the Industrial
sovereign debt is often named as the cause of the crisis, but this        Revolution. The first wave brought us the steam engine around
is actually a result caused, among other factors, by the weak             1850 and the second one allowed factories and mass production
competitiveness of Europe. In economic terms, Europe has two              to use electricity around the 1920s. The third wave we are
options in improving its competitiveness – cost-cutting (although         experiencing right now is based on an increasingly widespread
people hardly ever consent to pay cuts) or increasing productivity.       use of technology in industry and in practical solutions. Automation
Becoming more efficient is certainly a long process, which smart          represents a significant part of this: technology does an increasing
specialisation facilitates. The potential for noticeable efficiency       amount of work that used to be done by people, starting from factory
gains in the long run justifies the focus on smart specialisation         workers and train drivers to more complicated jobs. The crisis of
already in the short run.                                                 2008/2009 has accelerated this process considerably: companies
                                                                          had to become more efficient in hard times and technology was
Estonia has been in better macroeconomic shape since the                  something that enabled them to do so. Unfortunately, this means
recent crisis began than “old” European countries, but Estonia’s          that the number of unemployed people is increasing around the
problem is that its productivity is lower than in the West – people in    world. Competition has become a cross-border phenomenon,
Estonia work hard but add less value per hour than people doing           which means that having smart entrepreneurship is highly critical
the same work in some other European countries. This makes                to a state. Countries that have the skills required for complicated
sense considering our history – we have made great progress               jobs will find success, while life will be difficult for those that do not
in productivity in the last twenty years, but it would have been          focus on smart enterprise.
impossible for us to become as efficient as Finland after building
up our own state for just twenty years. The change of the political
and economic regime at the beginning of the 1990s meant that the          Kristjan Lepik
work done in many sectors was wiped out and people had to start           Estonian Development Fund
building new systems from scratch. Therefore, the goal of smart
specialisation in Estonia is the same as is it for the rest of Europe –
to become more competitive.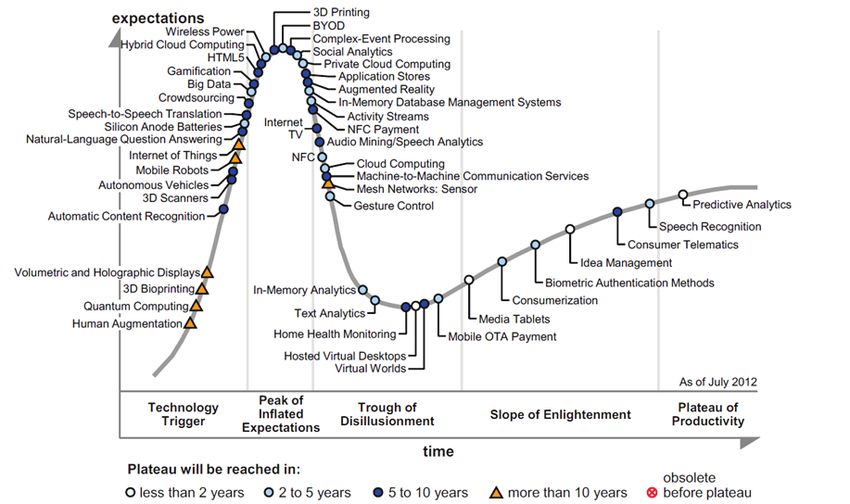
S                      Summary

The Ministry of Education and Research and the Ministry        that had the most in common and to hear the opinions
of Economic Affairs and Communications have launched           of entrepreneurs about the problems in our economic
the process of preparing an RD&I strategy and an               environment.
entrepreneurial growth strategy. Smart specialisation
has an important role in these new strategies. The             The process of entrepreneurial discovery refers to a
European Commission has placed smart specialisation in         bottom-up approach. The importance of using this
the spotlight among research and development activities        approach is also emphasised in European-level source
and innovation strategies, and turned it into a precondition   documents concerning smart specialisation. The use of the
for receipt of EU funds. The areas of growth selected in       top-down approach – where the public sector determines
the course of smart specialisation will be the priorities in   narrow growth areas with administrative guidelines – is not
financing for the 2014-2020 period. This means that smart      recommended.
specialisation has certain funding assigned to it.
                                                               The objective of the qualitative analysis is to identify the
Different parties have been involved in the smart              areas with the greatest potential, which is also the basis
specialisation process in Estonia. A quantitative              of the strategies prepared by the Ministry of Education
analysis was carried out with the support of the Ministry      and Research and the Ministry of Economic Affairs and
of Economic Affairs and Communications, Enterprise             Communications. Thanks to the interviews conducted, the
Estonia and the Estonian Research Council (under the           opinions of entrepreneurs were also taken into account in
guidance of Professor Urmas Varblane) and eight areas          this qualitative analysis.
were identified in which Estonia currently has the highest
economic potential. This qualitative analysis is a                  Involving entrepreneurs is
follow-up to the quantitative analysis and complements it.
Future trends (which were given an important place in the
                                                                   considered very important in
previous work of the Estonian Development Fund) are also               smart specialisation
considered in the qualitative analysis as well as possible
areas of cooperation between enterprise and research.          This analysis is divided into three chapters. Chapter 1
The Estonian Development Fund analysed the sectors as          describes the background of smart specialisation in Europe.
a matrix, looking at the horizontal and vertical sectors and   Chapter 2 explains the methodology of quantitative and
their crossing points.                                         qualitative analysis and contains a structural analysis of
                                                               the Estonian economy from the point of view of innovation
The team of the Estonian Development Fund met with             and an overview of global trends. The selection of growth
various entrepreneurs, researchers and professional            areas is given in Chapter 3.
associations in the course of the qualitative analysis. The
fund also organised a conference on 1 November 2012            Three important global trends (expanded on in Chapter
to hear the opinions of entrepreneurs and researchers.         2.4) were selected as the growth areas as a result of the
The list of related parties is given in Annex 2. Involving     qualitative analysis, and sub-sectors are highlighted as
entrepreneurs is considered very important in smart            more specific selections.
specialisation, which is why many interviews were
conducted with entrepreneurs from different sectors. The
objective of the interviews was to determine the growth
areas in Estonian scientific research and the private sector
Draft, February 20, 2013
5
1. Information and communications technology (ICT)
horizontally via other sectors. It is important to note
In Q1 2013 it will highlight
that the development of this sector around the world has the problems of growth areas
reached a stage where bigger opportunities can be found that need to be supported by
in the application of ICT technology in other sectors. The measures (the activities)
three sub-sectors of the highest priority are listed below,
but in the case of ICT the sub-sectors should not be
The ICT sector proved to be the strongest sector on the
strictly limited to the list and support may also be given to
basis of the qualitative analysis, which was also confirmed
other sectors that cross paths with ICT.
by interviews with entrepreneurs and the questionnaire
given in Chapter 2.3.
Sub-sectors:
a) use of ICT in industry (incl. automation and robotics);
Qualitative analysis is an important facet of smart
b) cyber security; and
specialisation, but still just one part of the overall process.
c) software development.
This analysis should not therefore be regarded as final, but
as a work in progress. The Estonian Development Fund
2. Healthcare technology and services. Demand for
will continue analysing smart specialisation and in Q1 2013
healthcare services is growing globally as the population
it will highlight the problems of growth areas that need to
ages.
be supported by measures (the activities) to ensure that
cooperation between entrepreneurship and research is as
Estonia has the greatest potential in:
efficient as possible. A detailed analysis of growth areas
a) biotechnology (a strong scientific basis); and
will also be provided.
b) e-health (use of IT for the development of medical
services and products).
The implementation of the smart specialisation policy
from 2014 must be considered very important, as smart
3. More efficient use of resources. The increasing global
specialisation requires regular monitoring and surveillance
population is likely to increase the need to use resources
in terms of growth areas as well as the regular assessment
more efficiently.
of projects and measures.
Estonia’s potential in this area is greatest in:
a) materials science and industry;
b) development of the ‘smart house’ concept (IT
solutions and more efficient construction of houses
(passive house)); and
c) food that supports health.1 Process of smart
specialisation in Europe
The long-term example of smart specialisation was 5. they rely on facts and contain reliable surveillance and
obtained from the Nordic skills and competence centre evaluation systems.
programmes, and the OECD also started supporting the
same trend recently with its analysis and publications. The European Union as a whole is moving forward with this
In 2012 Estonia participated in a joint project of the topic at present. Smart specialisation started in the EU in
OECD and the European Union (EU) which included 2011, when the European Commission (EC) launched the
mapping the current smart specialisation practices of the smart specialisation platform to support the determination
participating states and preparing a report on the role of of innovation and RD&I strategies in regions and Member
smart specialisation in guaranteeing the economic growth States (EC, 23 June 2011).
of regions. Although the concept of smart specialisation
is new and developing, it is ranked high in the innovation It is understood that highly different facets of reality are
policy of EU Member States. It is highlighted as a hidden behind macro-level indicators, which is why
precondition for the use of the funds of the European attention must be given to parts of the whole (GDP,
Regional Development Fund (ERDF) in the proposal of unemployment, etc.), i.e. the level of sectors and regions
the European Union Cohesion Policy (3) 2014-2020 for (regional GDP, unemployment, etc.) in order to change the
financing such investments from 2014-20201. big picture.
Smart specialisation means identifying the specific
Map of regional differences in level of innovation. Source: (RIS 2012)
features and resources of every state and region,
highlighting the competitive advantages of each region,
and assembling the region’s stakeholders and resources
around a knowledge-based vision of the future. The
national/regional research and innovation strategies (RIS3
strategies) of smart specialisation are integrated location-
based economic changes that perform five important
roles2:
1. they aim policy support and investments at the
country’s/region’s most important priorities, problems
and needs for the promotion of knowledge-based
development;
2. they rely on each country’s/region’s strengths,
competitive advantages and achievement potential;
3. they support innovation that is based on technology Leaders of Innovation
Followers of Innovation
and practice, and stimulate private sector investments; Moderate Innovators
Modest Innovators
4. they include stakeholders to the full and promote
innovation and experimentation; and
1
European Commission newsletter “RESEARCH AND INNOVATION STRATEGIES OF SMART SPECIALISATION”
2
European Commission newsletter “RESEARCH AND INNOVATION STRATEGIES OF SMART SPECIALISATION”Draft, February 20, 2013
7
One of the most important keywords of smart specialisation Smart strategic selection and evidence-based smart
is entrepreneurial discovery3, which points out the specialisation presume that the private sector joins
specialisation trend that may actually lead to results. Smart academia and that real products, services and companies
specialisation does not just attribute importance to the are produced by academia in addition to focusing on the
quality of research based on the number of times research quality of research. A number of parties from the private
work is quoted, but expects a clear, positive impact on the and public sectors must be involved. Early involvement of
real economy. The number of times research is quoted is the private sector reduces the risk that often threatens the
just one indicator used to evaluate the quality and volume spin-offs of universities: a small number of employees in
of research in a region, but often-quoted research of high a very specific area of activity and an impact on the real
scientific impact may have very little influence on the economy that is smaller than expected, which means
region’s real economy or social system. that it is impossible to earn back the (public) investments
made in the infrastructure, equipment and research in
One of the most important universities. The process of entrepreneurial discovery
refers to a bottom-up approach. The opposite of this
keywords of smart tactic would be a top-down approach, where the public
specialisation is entrepreneurial sector determines narrow growth areas with orders and
discovery3 administrative guidelines.
A longer description of the smart specialisation process is
given in Annex 1.
3
Entrepreneurial discovery means discovering something new in entrepreneurship, be it the development of a new company, production line or inno-
vative technology. It is accompanied by uncertainty, but discovering something new in entrepreneurship is also the path to higher profit margins.2 Smart specialisation
in Estonia
The Ministry of Education and Research and the Ministry
of Economic Affairs and Communications have launched It is rather unlikely that an
the process of preparing an RD&I strategy and an
entrepreneurial growth strategy. The Knowledge-based
increase in employment will be
Estonia strategies, which were prepared for the periods the main engine of economic
2002-2006 and 2007-2013, may be considered the growth in the coming years
predecessors of smart specialisation. The difference
of smart specialisation from the above is that the same
There are also signs that suggest that the technical
strategic guidelines are given to all EU Member States and
adaptation of the economy in recent times has taken place
that projects also have certain funding assigned to them.
quickly, making it difficult for the labour supply to keep up.
The north-easterly shift of the Beveridge curve4 (Figure 2)
Smart specialisation has an important role in new
may be given as an example, which can be regarded as
strategies. This chapter contains an analysis of the
a sign of an increase in structural unemployment as well
structure of the Estonian economy from the viewpoint of
as in the labour unit cost (which may also refer to future
innovation and gives the details of the quantitative and
competitiveness problems in the Estonian economy). This
qualitative analysis carried out to identify growth areas
means that despite the relatively high unemployment rate,
within the scope of smart specialisation. The chapter also
it is rather unlikely that an increase in employment will be
highlights the most important global trends in the coming
the main engine of economic growth in the coming years.
decade that Estonia must bear in mind.
Figure 1. GDP per capita as a ratio of European Union average
2.1. STRUCTURE OF ESTONIAN ECONOMY (source: Eurostat)
FROM THE VIEWPOINT OF INNOVATION
The economy of Estonia has grown strong over the last
two decades and climbed from 36% of average GDP per
capita in the EU in 1995 to 67% in 2011 (Figure 1).
Looking at the factors behind this rapid growth we can
assume that a similar speed of growth will not be achieved
again. Before the crisis the economic growth of Estonia
proceeded from the inclusion of workforce and capital,
while the development of technology produced around
one-third of the growth. Employment in Estonia is reaching
a level that corresponds to long-term potential economic
growth.
4
The Beveridge curve represents the relationship between unemployment and the job vacancy rate, which has the unemployment rate on the
horizontal axis and vacancies on the vertical axis. The shift of the curve up and to the right (north-east) should therefore refer to an increase in struc-
tural unemployment.Draft, February 20, 2013
9
Figure 2. Beveridge curve (source: Statistics Estonia)
Although overall uncertainty remains high on domestic
and export markets, Estonian companies must continue
to reorganise their production activities. This means that
the investment activity of companies is likely to remain
high in the phase when the economy is recovering from
the crisis, despite the low applicability level of production
capacities.
This in turn suggests that while the economic growth
of Estonia used to be based on involvement of labour
and capital, in future it is more likely to occur through
technological development and capital involvement.
Figure 3. R&D expenditure as a ratio of GDP (source: Eurostat)
This in turn suggests that
while the economic growth
of Estonia used to be based
on involvement of labour and
capital, in future it is more likely
to occur through technological
development and capital
involvement
Estonia’s research and development expenditure has
been growing strong in recent times and according to
Statistics Estonia amounted to as much as 2.41% of Figure 4. Share of persons employed in R&D activities among all
employed persons (source: Eurostat)
GDP in 2011. Although the result exceeded the European
Union average for the first time, the massive growth this
year was a one-off and based mainly on the construction
of an oil plant, which was classified as a research and
development activity and comprised one-third of the
relevant expenditure5. Growth has still been rather broad-
based, even without that one-off factor. However, the
research and development expenditure of Estonia, even
considering the one-off leap made in the previous year, is
still considerably lower than the relevant indicator of Nordic
countries and other technologically more developed
countries (Figure 3).
The share of persons employed
in research and development
among all employed persons
is relatively low in Estonia The share of persons employed in research and
compared to the international development among all employed persons is relatively low
in Estonia compared to the international level (Figure 4)
level and most of them are active in universities rather than in
5
The contribution of oil industry to the R&D expenditure of Estonia comprised one-third in 2011 (http://www.stat.ee/57493).Draft, February 20, 2013
10
Figure 5. Share of persons employed in knowledge-based activities
Extra 1: among total employment in the private sector in 2011 (source: Eurostat)
Base technology or technology applications?
Luxembourg
Switzerland
Ireland
States and regions face a very important question in scientific Iceland
United Kingdom
and entrepreneurial cooperation: should they focus on Japan*
Sweden
the development of base technology or use applications United States
Malta
of technology developed by others? European source Denmark
Finland
documents of smart specialisation (Forey et al.; 2012) use the Norway
Germany
term ‘key enabling technologies’ (KET). Another similar term is Cyprus
‘general purpose technology’ (GPT). This refers to technology Netherlands
Belgium
that has already been created and that can be applied France
Austria
horizontally through sectors, such as ICT, biotechnology and Slovenia
European Union
nanotechnology. Italy
Hungary
Czech Republic
Spain
Although Europe has been successful in developing several Greece
Estonia
forms of base technology, it has been less successful in their Slovakia
Portugal
application in the creation of products and services in the Latvia
Lithuania
private sector. Less developed European regions are advised
0 5 10 15 20 25
to focus on the application rather than the development of
technology.
enterprises. The share of persons employed in knowledge-
based areas of activities in the Estonian private sector may
Less developed European also be considered rather low in international comparison
regions are advised to focus on (Figure 5).
the application rather than the
The International Comparative Analysis of Research
development of technology Funding in Estonia (Ukrainski et al.; 2012) also stated that
“the impact of the Estonian R&D system is relatively weak
The opportunities to create something new in the base in the local context and it is not adequately connected to
technology of various sectors are different, but the Estonian entrepreneurship, which means that the system does not
Development Fund is largely of the opinion that Estonia’s generate enough economic output. This is why the policy
business opportunity lies in the application of existing recommendation is that Estonia must focus its RD&I
technology rather than the creation of new forms. Development activities on economic growth areas that are strong via
of technology is very resource-intensive, in terms of both smart specialisation, for example, in order to achieve an
capital and workforce, and it is difficult for Estonia to compete increase in added value.”
with large research centres. Detailed application opportunities
are highlighted in Extra 2. However, it is important to note that In conclusion, the R&D data of Estonia can be considered
if Estonia does not focus on competing in the development of to be in compliance with the picture that can be
technology, it is very important for the country to be involved expected from a transition country moving from simple
in the cooperation and networks aimed at the development subcontracting towards activities that add more value in
of these forms of technology. The information and knowledge the international production chain.
gained improve chances of success in the application of
technology. Production of added value has so far been rather intensive
in terms of energy and material-intensive in Estonia.
The EST_IT@2018 report of the Estonian Development Fund According to Eurostat, the cost of the materials required to
also points out that Estonia’s chances of achieving success produce one unit of added value in Estonia has increased
in base technology are small and adds that “the advantage since the turn of the millennium and remained more than
of Estonia is likely to lie in its knowledge of technology and four times worse than the European Union average in
the market, the ability to combine the new areas of technology 2009, only beating the relative indicators of Romania and
created elsewhere in suitable business models and to bring Bulgaria (Figure 6). However, the energy efficiency of the
products and services meant for export to the market at the Estonian economy has increased: according to the OECD,
right time.” (Rebane et al.; 2009) Estonia managed to create USD 2.3 worth of GDP with
one ktoe of energy in 1995, but the same indicator hadDraft, February 20, 2013
11
Figure 6. Productivity of resources in 2009, EUR/kg (source: Eurostat)
4
3
2
1
0
Netherlands
Switzerland
France
Italy
Germany
Belgium
Sweden
EU
Spain
Ireland
Austria
Greece
Turkey
Slovenia
Bulgaria
Luxembourg
Malta
Hungary
Lithuania
Latvia
United Kingdom
Portugal
Croatia
Czech Republic
Slovakia
Cyprus
Poland
Estonia
Romania
Finland
Denmark
risen to 4.1 in 2010. It remains obvious, however, Figure 7. Share of ICT specialists in total employment (source: OECD)
that we are lagging behind the OECD average (6.9) Sweden
Switzerland
as well as the world average (5.3). The economic Czech Republic
Norway
model of Estonia is also very rich in greenhouse Finland
Denmark
gases – in 2009 the country managed to produce Luxembourg
USD 1.5 of GDP at 1 kg of CO2 emissions. The Canada
Netherlands
relevant OECD indicator was 3.0 and the global United States
Australia
one 2.2. Germany
Iceland
EU15
United Kingdom
In conclusion, we can say that the Estonian model Estonia
Austria
of creating added value places a relatively large Belgium
France
burden on the environment and leaves a lot of Spain
Italy
space for development in the context of the green Slovenia
economy. Slovak Republic
Ireland
Poland
Hungary
According to Statistics Estonia the share of the Portugal
Greece
Estonian ICT sector in the added value produced
0 1 2 3 4 5 6
has been quietly growing since 2006 and comprised
5.2% in Q3 2012. This indicator is not as good as
that of the Nordic countries, but comparable to
the EU average (Figure 9). 21.8 thousand people modest impact of the ICT sector is also indicated by the
worked in the Estonian ICT sector in Q3 2012, OECD survey of how much the sector contributed to the
which comprised 3.4% of total employment. increase in labour productivity from 1995-2008, where
Estonia had the highest increase in labour productivity
among the surveyed states, but ICT contribution to this
Our share of ICT specialists in growth was among the lowest (Figure 8).
total employment is well below
the level of technologically The impact of the ICT sector as a whole on other economic
sectors has not been greatly researched. There are some
developed countries and places examples of such research, though. For example, Oulton
us below the EU average (2012) found that the main impact of the ICT sector
proceeds primarily from use of the services created by the
Our share of ICT specialists in total employment is well sector and not so much from its production side. However,
below the level of technologically developed countries and it was found that in the long term the ICT sector will
places us below the EU average (Figure 7). The relatively provide 0.54% of GDP growth per year in the case of theDraft, February 20, 2013
12
European Union, and even up to 0.74% if the use of ICT Figure 8. ICT contribution to labour productivity growth from 1995-2008
(source: OECD)
services is equalised with the relevant indicator of Sweden.
Sabbagh et al. (2012) listed 150 countries according to
their so-called ‘digitalisation’ by giving points from 0 to
100 on the basis of selected indicators. Estonia placed
among transition countries that scored 30-40 points and
where a 10-point increase in digitalisation would increase
GDP per capita by 0.59%. Similar to earlier surveys it was
again found that the impact of an increase in digitalisation
is larger the more developed the country is in any given
area. A background indicator that can be highlighted here
is the OECD (2012) survey of the impact of the Internet
on the added value created in the economy, which found
that the share of GDP created in the US in 2010 ranged
between 4.7-7.2%, depending on the methodology used.
Figure 6. ICT contribution to GDP (source: Eurostat)
An even narrower survey of the impact of a broadband
connection on GDP growth has also been carried out,
which indicated that a 10% increase in capacity varies
from 0.25% (Koutroumpis, 2009) to 1.38% (Qiang et al.,
2009).
However, it was found that in
the long term the ICT sector will
provide 0.54% of GDP growth
per year in the case of the
European Union
Overall, the ICT sector of Estonia rates as rather average
in international comparison despite the recent growth.
International experience suggests that further development
via a transition to other sectors will have a positive impact
on the economy as a whole, and the higher the level of
development achieved by the ICT sector itself, the bigger
this impact will be.Draft, February 20, 2013
13
2.2 QUANTITATIVE ANALYSIS the current situation therefore indicates where the process
of entrepreneurial discovery has already taken place.
The quantitative analysis ascertained the areas of activity
The workgroup managed by Urmas Varblane carried out
which in Estonia:
a quantitative analysis to ascertain Estonia’s key areas
with the highest potential growth. The analysis reflects the produce higher added value;
dynamics of the recent past and the current economic
are export-intensive and characterised by large
status of Estonia. To assess the future potential, qualitative
volumes of foreign trade; and
assessment methods must also be used, but the premise
of mapping the current status and the standpoint of have a high rate of employment.
smart specialisation is that developing one’s strengths
in the course of the entrepreneurial discovery process The workgroup managed by Urmas Varblane identified
creates the preconditions for making the right choices and eight potential growth areas. This chapter contains a brief
achieving a unique competitive advantage. An analysis of summary of the quantitative analysis.
Table 1. Quantitative analysis of Estonian economy by sector
Growth area Number of Employ-ment Sales revenue (€ Sales revenue Added value (€ Added value per
companies thousand) from exports (€ thousand) worker
thousand)
1 ICT 2 266 17 591 2 292 407 1 210 462 621 989 35,4
Health technology and
2 241 3 530 428 593 327 719 107 137 30,35
health services
3 Mechanical engineering 257 6 720 520 121 442 156 157 915 23,5
4 Logistics 992 10 738 2 275 490 1 489 123 534 520 49,8
5 Chemical products 367 2 285 364 033 456 556 77 052 49,8
Innovative house-building
6 563 255 003
(wooden houses)
Timber enhancement
(doors, windows,
7 furniture, design, 967 13 043 1 165 053 724 809 286 574 22
cellulose, paper and
cardboard)
8 Functional foodDraft, February 20, 2013
14
2.3 QUALITATIVE ANALYSIS potential of entrepreneurship in Estonia;
potential of research in Estonia; and
The team from the Estonian Development Fund met with extent of economic impact and probability
various entrepreneurs, researchers and professional of its realisation.
associations in the course of qualitative analysis. The fund
also organised a conference on 1 November 2012 to Experts from various sectors were sent tables with
hear the opinions of entrepreneurs and researchers. The instructions and asked to assess them6. Altogether 22
list of parties related to the process is given in Annex 2. experts responded to the survey.
Involving entrepreneurs is considered very important in
smart specialisation, which is why many interviews were Assessing the potential impact is important for the
conducted with entrepreneurs from different sectors. The consideration of scalability – do the company’s products
objective of the interviews was to determine the areas have the potential for a large increase in sales volumes?
of Estonian science and the private sector that had the How great is the capacity to offer products or services
most potential for cooperation and to hear the opinions outside Estonia? The extent of impact was assessed in
of entrepreneurs about the problems in our economic two parts – the potential volume of the impact and the
environment. The interviewees were selected from different probability of achieving the impact.
economic sectors and from the largest companies possible.
Interviews were also conducted with researchers from The evaluations prepared on the basis of the interviews
several foreign universities, as looking at something from a carried out by the fund are given in Table 2. The fund did
distance makes it possible to see additional opportunities not ask the interviewees to fill in the table, but prepared the
and problems. table on the basis of its own insight after the interviews had
been conducted. The choices made by the respondents
Involving entrepreneurs is in the survey are also given in Table 2. Many public sector
specialists, heads of research institutions and researchers,
considered very important in heads of clusters and associations or unions of companies
smart specialisation, which and managers representing single companies gave their
is why many interviews were answers. The combined result of both approaches is
conducted with entrepreneurs given in the table, although the methodology used for the
approaches is different. Its purpose is to give an overview of
from different sectors how much the results of the two analyses overlap.
The semi-structured method was used to conduct the The difference between the
interviews: some questions were always the same;
others varied depending on the sector the interviewee
opinions of the respondents
represented. The questions used in the interviews were and the Estonian Development
guiding and their purpose was to obtain a good overview Fund proved to be small and
of the interviewee’s knowledge of their area of activity and the two strongest areas are the
their opinion of the areas of cooperation between research
and entrepreneurship that have the greatest potential. The
same in both cases
interviewees were also asked to highlight the problems in
the economic environment that obstruct such cooperation The difference between the opinions of the respondents
as well as hindering innovation in the broader sense. and the Estonian Development Fund proved to be small
and the two strongest areas are the same in both cases
Qualitative analysis focuses on further developments and (incl. their order): ICT, and healthcare technology and
future trends in the economic environment, which are services. The fund also asked the research committee of
difficult to prove in quantitative terms. The fund therefore Tallinn University of Technology to evaluate the potential on
developed a model in which the eight sectors identified with the basis of the same model, and they likewise found that
quantitative analysis are assessed via qualitative analysis in ICT and healthcare technology and services are the two
the following areas: areas with the greatest potential.
6
The survey was explained as follows: “Please rate the potential of Estonian entrepreneurship and research by sector on a scale of 0-3. The res-
ponse should include future potential from 2014-2020. Please also rate the size of potential economic impact – how big the given sector’s economic
impact is and the probability that this impact will be realised (from 0-100%). For example, if the economic potential of the sector is large but the pro-
bability of its achievement is small, the score for the extent of impact may be 3 and its probability 20%.”Draft, February 20, 2013
15
Table 2. Results of survey and opinion based on Development Fund’s interviews by sector
Volume of Probability of
Enterprise Research Total impact Total score
impact impact
K AF K AF K AF K AF K AF K AF
ICT 2,4 3,0 2,1 2,0 2,5 3,0 0,8 0,8 2,0 2,4 6,5 7,4
Health technology and
1,8 1,5 2,6 3,0 2,0 3,0 0,6 0,6 1,3 1,8 5,7 6,3
health services
Mechanical engineering 2,1 2,0 1,4 1,5 2,0 1,5 0,6 0,6 1,2 0,9 4,7 4,4
Logistics 2,4 2,0 1,1 1,0 2,1 1,5 0,7 0,7 1,3 1,1 4,8 4,1
Chemical products 2,1 2,0 2,0 2,0 1,7 1,5 0,6 0,8 1,0 1,2 5,1 5,2
Innovative house-building
2,3 2,0 1,6 2,0 1,6 2,0 0,7 0,6 1,1 1,2 5,0 5,2
(wooden houses)
Timber enhancement 2,3 2,0 1,4 1,0 1,9 2,0 0,6 0,8 1,2 1,6 4,9 4,6
Functional food 2,0 1,5 2,4 2,5 1,9 2,0 0,6 0,7 1,2 0,7 5,7 4,7
Total impact = volume of impact * probability of impact; total score = enterprise + research + impact; DF – evaluation
based on interviews carried out by Development Fund; A – average estimate obtained in survey. The volume of
enterprise, research and impact is evaluated on a scale of 0-3 and the probability of impact on a scale of 0-100%. The
total score is the sum of the three areas.
The analysis of these areas is also the basis for the restrictions. This is why extending economic impact is
more detailed selection of growth areas. The Estonian difficult for this industry.
Development Fund also assessed sub-sectors and
Chemical products have potential in enterprise and
crossover points between sectors on the basis of the
research, but it is not as high as in ICT and healthcare
above model (research, enterprise and impact).
services and technology.
The following can be highlighted when we look at the
sectors in greater detail: The ICT sector was considered
Enterprise in Estonia is rather strong when it comes
the one with the greatest
to mechanical engineering, logistics and timber potential
enhancement, but the capacity of companies to
use research is weak. For example, a large share of Opinions shared by the entrepreneurs interviewed:
companies in forestry belongs to foreign owners and
The ICT sector was considered the one with the
conversations with entrepreneurs confirm that in most
greatest potential – this opinion was also shared by many
such cases, there is no desire to bring development
entrepreneurs active in other sectors (the food industry,
activities from the company’s home market to Estonia.
mechanical engineering, etc.). Lack of quality labour was
When it comes to functional food, however, we see mentioned as the biggest problem for the ICT sector.
that the research side is considered stronger than the
It is important to expand cooperation with foreign
entrepreneurship associated with it, and the limiting
countries, both by bringing foreign specialists here and
factor that often affects the food industry is that sales
sending Estonian people abroad.
of their products are frequently subject to geographicDraft, February 20, 2013
16
Representatives of different sectors said that bringing
strong specialists to Estonia is very difficult due to the Europe’s focus on smart
strict immigration policy.
specialisation is very important
Estonian companies often face a growth cap – they in such an environment, as the
cannot develop past a certain level with their available
skills, leading to a situation where the owners either
state’s support also encourages
have to sell the company or bring in foreign specialists. companies to contribute more
Emphasising the latter would help keep companies in to innovation
Estonia and in the hands of Estonian capital for longer.
The state’s support could create an amplified impact.
Europe’s focus on smart specialisation is very important
Cooperating with researchers is difficult. One of in such an environment, as the state’s support also
the problems is that the role of research articles in the encourages companies to contribute more to innovation.
evaluation of financing is very high and the current model It is also important to note that countries which are not
does not motivate researchers to carry out applied at the forefront of technology development, including
research. Estonia, have more to gain from smart specialisation.
The role of Competence Centres (CC) is seen as
However, there is no doubt that establishing a long-term
positive and they have intensified communication
strategy in enterprise is difficult in such an environment
between researchers and entrepreneurs. The laboratories
and flexibility may be considered important. How do you
of CCs offer entrepreneurs a great opportunity to carry
establish a national strategy with smart specialisation in
out tests, as it is often impractical for single companies
the midst of all this uncertainty? It is certainly difficult to
to have their own labs.
forecast what the situation in the world economy will be
Fragmentation of the current support measures is a like in 2020. However, there are some trends that continue
problem. It is difficult to obtain an overview of measures even in such a complicated environment. The Estonian
and many of them are very small in volume – we need Development Fund has always considered analysing future
more concentrated measures and support. trends an important activity (Matsulevitš et al.; 2012) and
used this competency to highlight trends.
The number of engineers and other scientists trained
in Estonia is too small.
Three such large trends are highlighted below.
Entrepreneurs felt positive about emphasising growth
areas: “a small state cannot afford to be mediocre in 1. Development of technology. The development
everything and must select sectors to focus on”. of technology has been fast in the last decade and it is
very likely to continue in the next decade. Looking at the
2.4. GLOBAL TRENDS ICT sector, it is important to note that the development
of technology has reached a point where many forms of
technology have progressed from the development phase
The global economic environment has been characterised to a phase where they can be applied in broader use (see
by high uncertainty since the crisis of 2008/2009. On one Extra 2). For example, when 3D printing becomes widely
hand, this is psychological – many people still remember used, it will lead to structural changes in many sectors.
the crisis and it makes them cautious. On the other hand, Another important question for states is whether their
the changes in many places have been structural and potential is bigger in the development of technology or its
there have been massive fundamental shifts. This has application in practice. The Estonian Development Fund
made entrepreneurs (and others) all over the world more is of the opinion that in many sectors Estonia has a better
cautious, which means that they often save money in chance of being competitive in application.
their accounts as a security buffer instead of investing in
innovation.Draft, February 20, 2013
17
Figure 10. Average life expectancy
in countries and number of healthy
years lost. Source: Institute for
Health Metrics and Evaluation 7
The Estonian Development States therefore have to choose
Fund is of the opinion that whether to reduce pension
in many sectors Estonia has expenditure or become more
a better chance of being efficient in cost management
competitive in application
3. Resources. The world’s population is growing fast and
2. Healthcare. The development of healthcare as well as increasing levels of development in emerging countries is
the increase in the level of welfare around the world means bringing about an even faster increase in the number of
that people are living longer. This trend is likely to continue people demanding welfare. This means that the use of
and although it may be regarded as socially positive, it is resources, and sometimes a lack of them, is becoming
causing a number of economic problems. The biggest of more critical. It is therefore understandable that large
these is related to pension expenditure – many Western countries are increasing their focus on procuring resources
countries are already struggling with social expenditure and and related innovation, i.e. more efficient use. The broad
the structural trend is that the situation will deteriorate further. term ‘green economy’ is likely to receive even more
States therefore have to choose whether to reduce pension attention by the world in the next decade. It is necessary to
expenditure or become more efficient in cost management. use existing resources more efficiently and to develop new
The first of these does not seem to be socially acceptable forms of technology that lead to greater efficiency.
in almost any country, which is why the emphasis will be
on reducing medical expenditure and making the service It is necessary to use existing
more efficient. This problem presents another opportunity
for those who manage to come up with more efficient
resources more efficiently
solutions. IT and biotechnology have great opportunities and to develop new forms of
here. The increase in the average age of the population per technology that lead to greater
country is given in Figure 10. The vertical axis shows the efficiency
number of healthy years lost. Both are going up and the
latter especially has an important role – the development
of medicine allows chronically ill people to live longer, but
it makes medical expenditure go up. The movement of
Estonia is highlighted in the figure.
7
http://www.healthmetricsandevaluation.org/gbd/visualizations/gbd-2010-healthy-years-lost-vs-life-expectancy3 Result of growth
area selection
Classic comparison of sectors is called vertical analysis: 1. Information and communications technology (ICT)
they are side by side and analysed separately. However, horizontally via other sectors. It is important to note
interdisciplinarity – sub-sectors at the crossover points of that the development of this sector around the world has
various sectors – is becoming increasingly important as reached a stage where bigger opportunities await in the
a result of globalisation and technological development. application of the technology in other sectors. The three
There are also sectors that move horizontally. For example, sub-sectors of the highest priority are listed below, but in
the ICT sector could be regarded as vertical at the end the case of ICT these sub-sectors should not be strictly
of the last century, but possibilities to use the ICT sector limited to the list: support may also be given to other
horizontally are greater now. Horizontally, the ICT sector sectors that cross paths with ICT.
offers opportunities to support other sectors.
Sub-sectors:
This is why the Estonian a) use of ICT in industry (incl. automation and robotics);
b) cyber security; and
Development Fund also c) software development.
analysed the sectors as a
matrix in the case of qualitative 2. Health technology and services. Demand for health
analysis, looking at the services is growing globally as the population is aging.
horizontal and vertical sectors Estonia has the greatest potential in:
and their crossover points a) biotechnology (a strong scientific basis); and
b) e-medicine (use of IT for the development of medical
This is why the Estonian Development Fund also analysed services and products).
the sectors as a matrix in the case of qualitative analysis,
looking at the horizontal and vertical sectors and their 3. More efficient use of resources. The increasing
crossover points. The smart specialisation documents of population of the world increases the need to use
the European Union also encourage people to look for resources more efficiently.
crossover points and activities.
Estonia’s potential in this direction is greatest in:
3.1. SELECTED GROWTH AREAS a) materials science and industry;
b) development of the ‘smart house’ concept (both
IT solutions and more efficient construction of
Three important global trends (given in Chapter 2.4) were
houses (passive house)); and
selected as growth areas as a result of the qualitative
c) food that supports health.
analysis, and sub-sectors are highlighted as more specific
selections. A more detailed analysis of the growth areas
is given below. During the selection of growth areas the
Estonian Development Fund looked for ones in which
Estonia’s potential for cooperation between enterprise and
research was strongest and also analysed future trends.Draft, February 20, 2013
19
The ICT sector proved to be the strongest sector on the that are globally scalable.
basis of the qualitative analysis, which was also confirmed
by interviews with entrepreneurs and the questionnaire The role of Skype must also be considered – the people who
given in Chapter 2.3. This is why the volume of the support work and have worked in the development centre in Tallinn
given to this sector should be at least twice as much as have gained experience as part of a global company, and
in health and resources (which could be supported with they have often also obtained the capital they need to put
equal volumes). The Estonian Development Fund will their ideas into action. Microsoft as its owner and the size
complete a more detailed analysis of the measures in Q1 of the company are likely to slow down the speed of further
2013. development, but the future projects of the people who
worked at Skype may even present bigger opportunities for
It is important to point out that a more detailed analysis Estonia. This means that the country must be ready to use
of the given sub-sectors will continue so that narrower this brain potential and offer fertile ground for carrying out
niches with more potential for success can be found in these projects in Estonia.
cooperation with entrepreneurs. Still, these narrower
decisions cannot be the result of the given analysis, as As indicated above, ICT may be
decisions on smart specialisations may not be top-down
ones. Details will be added to the analysis of growth areas
considered the sector with the
in Q1 2013 when the Estonian Development Fund will highest potential for Estonia
complete the next stage of the analysis.
As indicated above, ICT may be considered the sector
Details will be added to the with the highest potential for Estonia. ICT enterprise is
strong, and the research side has the skills and readiness
analysis of growth areas in to cooperate with it (especially the University of Tartu). We
Q1 2013 when the Estonian must point out that the emphasis in the acronym ‘ICT’ is on
Development Fund will ‘IT’, because ‘C’ (i.e. communications technology) is more
complete the next stage of the of a vertical sector.
analysis However, it is important to note that the ICT sector has
reached a stage in its development where many forms of
3.2. DETAILED ANALYSIS OF GROWTH technology are reaching the phase of mainstream application
AREAS (as shown in Extra 2). Use of ICT solutions horizontally or via
other sectors is a much bigger opportunity than ten years
ago. ICT can help other sectors become more efficient.
3.2.1. Information and communications technology
(ICT) horizontally via other sectors
Extra 1 points out that Estonia’s opportunities lie in the
application rather than the development of technology,
There have been several success stories in the Estonian ICT
and this applies to the ICT sector. We have to look at
sector in the last decade (the most notable of them being
global scales rationally and understand that it is difficult
Skype), but as the statistics given in Chapter 2.1 indicate,
for us to complete with the development capacities of
Estonia still has a lot of space for development in the area
Western countries and Asia. However, it is very important
of ICT. For example, the sector’s share in total employment
that the ICT sector in Estonia moves from the provision of
is well below the level of Scandinavia.
subcontracting (mainly as a service) towards products.
This means that we must invest in development activities,
The sector has a strong and well-organised professional
because it is the only way to make solutions scalable.
association (Association of Information Technology)
and many companies that have successfully entered
It is therefore important to keep an eye on the development
foreign markets in recent years (Grabcad, Transferwise,
of technology by others and be prepared to apply it. Being
ZeroTurnacount, Modesat, etc.). ICT entrepreneurs often
small is a downside for Estonia in some respects, but it
look for scalable business opportunities where the target
can also be seen as an opportunity – being a small country
markets are global, and they are also prepared to invest in
allows Estonia to be a great testing environment to see
development activities. The present development stage of
how technology can be applied. For example, e-voting
ICT makes it possible to find many small niches for EstoniaDraft, February 20, 2013
20
can already be considered Estonia’s success story on entrepreneurial opportunities have been used in this
the international stage and in 2013 Estonia will probably sector in Estonia so far, but as a whole the sector is facing
become the first country in the world to apply near field extensive development this decade. Global volumes
communications (NFC) nationwide. of enterprise are also smaller today than they are likely
to be in 2020. Virtual identity is playing an increasingly
Being a small country allows important role in people’s lives, but the risks associated
with this are not adequately understood – the role of
Estonia to be a great testing cyber security must definitely increase in this area;
environment to see how
technology can be applied 3. Software development/programming – these
are necessary for the creation of all kinds of solutions
(both software development centres and IT product-
We have highlighted three sub-sectors of ICT, but
based companies). The process is closely related to
unlike health and resources these must be regarded as
programming and software engineering, and with the
recommended trends, not fixed choices. It is difficult to
entire software layer on a broader scale – IT system
forecast a sector whose crossing point is seen as the
design, development, installation and administration
source of the best opportunities by entrepreneurs in
on servers and clouds, up to client administration and
2014, as it is changing fast. We should therefore trust the
data analysis. Zero Turnaround is a very successful
entrepreneurial discovery process and let entrepreneurs
example of the cooperation between Estonian research
evaluate the greatest opportunities as they come along.
and enterprise in this sector. Another major advantage
This is why it is very important to include a strong
of the software sector is its flexibility – someone who
committee of entrepreneurs and researchers in the
produces software in one sector can be quickly retrained
assessment of projects from 2014.
if necessary to offer solutions in other sectors if demand
changes.
ICT sub-sectors:
1. Use of ICT in industry (incl. automation and
robotics) – use of automation and robotics in industry
Extra 2: Developments in the ICT sector
has grown considerably since the crisis of 2008/2009.
Companies are trying to be more efficient and the need
ICT has undergone massive developments in recent years,
for people who do physical work is decreasing. This is
but the change in the sector’s position has been the biggest. It
why automation and the use of ICT solutions continue
could be regarded as a separate sector just 15 years ago, but
to have great potential, as most Estonian industrial
it has now reached a new phase. We can say that the sector
companies have not used this potential in full. There is a
has changed from vertical to horizontal – its development
good opportunity here for inclusion of ICT specialists in
has an impact on almost all other sectors and the biggest
making industrial processes more efficient;
impact lies in supporting other sectors rather than relying on
developments within the sector itself.
There is a good opportunity
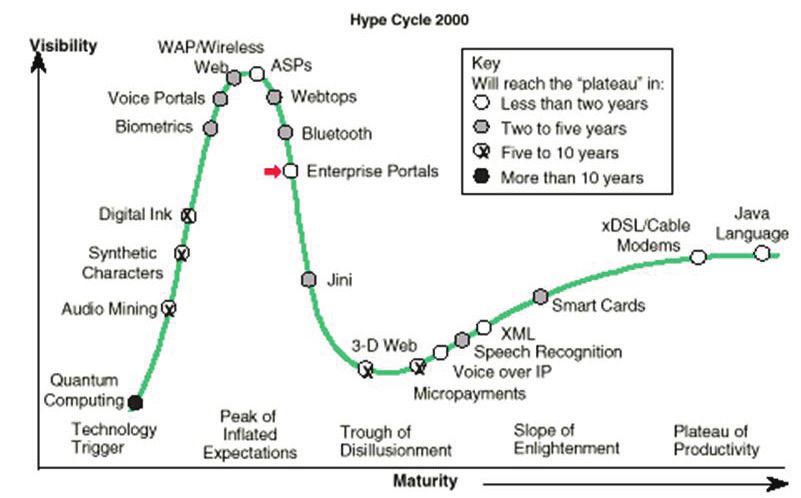
here for inclusion of ICT Technology research company Gartner uses the ‘hype-
specialists in making industrial cycle’ model8 when mapping technology and divides
its lifecycle into five phases:
processes more efficient
1. Technology trigger – researchers discover a form of
2. Cyber security – Estonia became known as a technology, but there is no practical application.
country with high cyber defence awareness in the 2. Peak of inflated expectations – the first applications
foreign media after the cyber-attacks of 2007 and we lead to unrealistic expectations about the speed of the
should continue taking advantage of this. Creation of the technology’s practical application.
NATO Cooperative Cyber Defence Centre of Excellence 3. Trough of disillusionment – arrives when applications
in Estonia is a positive sign. It is true that not many do not emerge quickly enough. Investments decrease.
8
http://www.gartner.com/technology/research/methodologies/hype-cycle.jspYou can also read