Clientelism and Political Manipulation of Local Government Budgets in West Bengal
←
→
Page content transcription
If your browser does not render page correctly, please read the page content below
Clientelism and Political Manipulation of
    Local Government Budgets in West Bengal ∗

 Pranab Bardhan†, Sandip Mitra‡, Dilip Mookherjee§and Anusha Nath¶

                                              November 18, 2019

                                                          Abstract
                 We provide evidence of clientelistic politics and its consequences for distri-
           bution of benefits by local governments in rural West Bengal, India. Consistent
           with a model of politically motivated allocations, government programs consisting
           of recurring private transfers expanded in villages within more competitive con-
           stituencies when bottom and upper tier governments were controlled by same par-
           ties. These effects were less significant for one-time private benefits, and absent
           for road benefits. Household votes responded positively only to receipt of recurring
           private benefits, which in turn rationalize the inter-village targeting patterns.

        JEL Classification: H40, H75, H76, O10, P48.
    ∗
        For help with the redistricting analysis and feedback at early stages of this project we thank Lakshmi Iyer. For useful
comments we are grateful to participants at various seminars and conferences where earlier versions have been presented.
For financial support we thank the Economic Development and Institutions network, and the International Growth Center,
MacArthur Foundation and the National Science Foundation for past grants that funded collection of the data on which
this paper is based.
    †
        University of California, Berkeley
    ‡
        Indian Statistical Institute
    §
        Boston University
    ¶
        Federal Reserve Bank of Minneapolis

                                                               1
1 Introduction
It is often argued that the functioning of democracy in contemporary middle and
low income countries is undermined by political clientelism and vote-buying (e.g.,
Stokes (2005, 2007), Kitschelt and Wilkinson (2007), Hicken (2011), Stokes et al
(2013), Bardhan and Mookherjee (2018a,b)). While there are a number of dif-
ferent definitions of clientelism, the most common one involves trades of private
benefits delivered to citizens by elected officials or political parties in exchange
for their political support (Hicken (2011)). The alleged consequences of such
practices are various. By conditioning delivery of benefits to households on their
political support, it prevents households from voting according to their true prefer-
ences. Instead of expressing their evaluation of competing candidates, households
vote strategically based on consequences for benefits they personally expect to
receive in return. This allows corrupt leaders to maintain successful political ma-
chines and perpetuate their grip on power by using their control over the benefit
targeting process. It may also motivate incumbent politicians to distort expendi-
ture programs and under (resp. over) provide benefits that are less (resp. more)
effective instruments of clientelism.
Rigorous quantitative evidence relating to these claims is however relatively
scarce. Direct evidence on conditioning of benefits on political support is hard to
find, as they tend to be expressed informally and form the basis of implicit quid
pro quo arrangements. One has to rely on indirect forms of evidence, and make
inferences based on observable symptoms and a theory that relates these to the
underlying mechanisms. In particular, the approach followed needs to distinguish
between clientelism and non-clientelistic mechanisms. A key difference between
clientelism and non-clientelistic (programmatic) politics is in the relative respon-
2siveness of household votes to private and public benefits. Public benefits being
non-excludable cannot be used as a clientelistic instrument by political parties or
candidates. Hence when clientelism prevails, votes respond only to private bene-
fits, and not to public benefits. Whereas in program politics, households vote their
‘true’ preferences which incorporate provision of both private and public goods.
However, many challenges need to be confronted in testing these contrasting pre-
dictions: one needs evidence of voting at the household level, and how it reacts to
exogenous variations in receipt of private and public benefits.
This is what this paper sets out to achieve. We focus on households in ru-
ral West Bengal, a state in eastern India, where local governments deliver and
implement various development and welfare programs, which include many pri-
vate benefits (workfare, subsidized loans and farm inputs, low income housing
and sanitation, food subsidies) and local public goods (mainly roads). We utilize
results from a 2011 survey where household heads report the different govern-
ment programs they benefitted from over the preceding eight years. Each survey
ended with the household head making a choice on a secret ballot between signs
of competing political parties.
We need to estimate the causal impact of benefits received on these votes. This
necessitates an identification strategy which isolates exogenous sources of varia-
tion in the flow of different kinds of benefits to households. We deal with this
in the following manner. Aggregating reported benefits to the level of the corre-
sponding village government at the lowest tier (gram panchayat (GP)) responsible
for their allocation across households within villages, we obtain an estimate of the
scale of each benefit program at the GP level. In West Bengal, the benefit distribu-
tion program is top-down, with expenditures on different programs flowing down
3the hierarchy (from Central to state to district to block to GP). Elected officials at
any tier receive their expenditure allotments from the next higher tier, and allocate
this across different units within their jurisdiction at the next lower tier. While al-
location of some programs are partly formula-bound, especially those sponsored
by the Central government, officials in intermediate tiers exercise considerable
discretion over the allocation of most of the programs to GPs at the bottom tier.
Budget allocations can then be manipulated by incumbents controlling upper
tiers in order to boost their re-election prospects. We develop a theoretical model
of such political budgeting, which predicts that an exogenous increase in politi-
cal competition will motivate politicians controlling upper-level governments to
contract (respectively expand) budgets to lower level governments that are non-
aligned (resp. aligned), i.e, controlled by the principal competing (resp. own)
party. Benefit programs with a larger impact on household votes will tend to be
manipulated more. The hypothesis of clientelism-based distortions then translates
into stronger manipulation of (and household responses to) private benefits, com-
pared with local public goods.
To obtain exogenous variation in political competition, we utilize redrawing of
boundaries between state legislative assembly constituencies carried out in 2007
by a politically neutral state Delimitation Commission composed of members of
the national judiciary. The Indian Constitution imposes many restrictions on the
process in order to ensure that redistricting cannot be manipulated by political
parties to extract partisan benefits. Appointed by the Central Election Commis-
sion at the federal level, the state Delimitation Commission followed a transpar-
ent process to determine the redrawing of constituency boundaries on the basis
of changes in population between 1971 and 2001. Iyer and Reddy (2013) who
4studied the 2007 Delimitation process in two other Indian states, concluded that
“for most part the redistricting was politically neutral”. Using our data for West
Bengal, we also find no evidence of any significant correlation between redis-
tricting and determinants of political manipulation incentives (incumbency, low
caste reservations status, or incumbent presence on the Delimitation Commis-
sion). Nevertheless, to address concerns for endogenous selection in analyzing
the impact of redistricting on resource allocation across local jurisdictions, we
use a difference-in-differences specification and control for pre-treatment trend
differences in benefit flows between treated and control areas. Specifically, our
estimates represent the effect of moving the same village with the same local gov-
ernment to a different state assembly constituency where the next election is likely
to be more contested (proxied by a lower winning margin for the incumbent in the
previous election), compared to other jurisdictions which are either not moved or
moved to less contested constituencies.
The empirical analysis is carried out in two steps. First we examine variations
in allocation of benefits across different GPs. The objective is to gauge political
manipulation of program budgets by elected officials at higher tiers — we refer
to this exercise hereafter as the upper layer analysis. This is contrasted with the
household level analysis, which investigates how variations in receipt of various
benefits by households (induced by exogenous shocks to GP budgets resulting
from redistricting) affected how their heads voted. Finally, we examine the con-
sistency of the results across the two layers: did upper level governments engage
in greater manipulation of the programs whose benefits were more effective in
generating political support from voters?
The upper-layer analysis provides evidence consistent with the hypothesis of
5clientelism. We find ‘recurring’ private benefits (public works employment in
particular) contracted (by 2.4 s.d.) in nonaligned GPs redistricted to more com-
petitive constituencies (‘HC-redistricted’), while increasing by 0.8 s.d. in aligned
GPs. Corresponding impacts for private one-time benefits (such as low income
housing, ration cards1 and access to sanitation and drinking water) were smaller
and statistically insignificant. In the case of public benefits (roads), the treatment
effects were even smaller and also statistically insignificant.
For the household-level analysis, we use the HC-redistricting shock (inter-
acted with alignment) as an instrument for the scale of each program at the village
level. The upper layer analysis results indicate that redistricting shocks are strong
predictors only of private recurring benefits. To generate supply-side variations in
one-time private benefits and road programs at the village level, we supplement
the redistricting shock with a measure of the program scale at the district level
(represented by the average benefit received in all other villages in the same dis-
trict), following Levitt and Snyder (1997). To obtain exogenous variations in sup-
ply at the household level, we interact these GP level supply shocks with house-
hold dummies for landlessness and caste. The IV estimates corroborate the results
of the upper-layer analysis: political support of household heads was strongly re-
lated to private recurring benefits (a 12% higher likelihood for voting for the local
incumbent). The estimated effect of private one-time benefits was smaller and sta-
tistically insignificant, and the same was true for road programs over which state
and district officials exercised discretion.
The rest of the paper is organized as follows. Section 2 describes related lit-
1
Ration cards entitle holders access to subsidized food and fuel through the public distribution
system.
6erature, while Section 3 describes the institutional context and data for our study.
Section 4 presents the theoretical model. Sections 5 and 6 respectively present the
empirical results for the upper-layer and household-layer respectively. Finally,
Section 7 concludes.
2 Related Literature
We start with the literature on political manipulation of allocations by upper level
government officials. One set of papers provides evidence of ethnic favoritism or
home-bias of elected officials (Burgess et al (2013), Hodler and Raschky (2014),
Hoffman et al (2017)). Another set of papers provide evidence of the role of po-
litical (rather than personal) motives of upper-level officials for various countries
in Europe, North and South America (Sole-Olle and Sorribas-Navarro (2008),
Brollo and Nannicini (2012), Finan and Mazzocco (2017) Levitt and Poterba
(1999), Stashko (2018)). These papers show effects of political competition and
re-election concerns of higher level officials on the allocation of funds for local in-
frastructure. But none of these papers provide evidence concerning manipulation
of private benefit programs, perhaps because most private transfers are program-
matic rather than discretionary in these middle and high income countries. Our
analysis differs by comparing political manipulation between private transfers and
infrastructure funds, in the context of a low income country.
There is also a corresponding literature on the effect of government benefits
on votes or political support from citizens. Levitt and Snyder (1997) provide
an IV estimate of US federal spending on votes in House districts, using as an
instrument the level of spending in all other districts in the same state. We use
7a similar instrument in our household level analysis, and like them also find a
large discrepancy between OLS and IV effects. But they find a $100 increase in
per capita spending resulted in a 2% increase in votes for the incumbent while
spending on private transfers had no effect. This is the reverse of what we find in
the context of West Bengal, presumably reflecting a different institutional setting
in the US wherein private transfers are programmatic while federal spending is
concentrated on discretionary public projects.
A number of papers examine the effects of programmatic private transfers on
voter behavior and political attitudes in various middle and low income coun-
tries, using various methods to overcome possible endogeneity concerns (De La
O (2013), Labonne (2013), Manacorda et al (2011), Pop-Eleches and Pol-Eleches
(2012)). Brollo, Kaufman and La Ferrara (2018) study voting effects of discre-
tionary enforcement of conditionality provisions in a CCT program in Brazil by
local government officials. In the Indian context, a number of authors have ex-
plored manipulation of MGNREGA funds by state and district officials to seek
electoral advantage (Dey and Sen (2016), Gupta and Mukhopadhyay (2016)).
While our findings regarding private recurring programs are similar, our main
contribution is in comparing effects across different kinds of benefit programs. In
this respect our work is closer in spirit to Wantchekon (2003) who shows in the
context of an RCT involving randomization of campaign promises of Presiden-
tial candidates in Benin that promises of private transfers generated higher voting
responses than promises of local public goods. However his finding could arise
under program politics if voters derived little utility from public goods. In our
context, we have independent confirmation of the value placed by households on
road projects. Despite constituting the second largest source of reported benefits,
8road programs nevertheless failed to generate voter support.
Finally, a number of authors have studied effects of dismantling clientelis-
tic programs and rise of formula-bound transfers in Latin American countries, a
question different from the one we analyze but is nevertheless broadly related (De
Janvry et al (2014), Dower and Pfutze (2015), Fried (2011), Frey (2015)).
3 Context and Data
India is a federal State with legislative, administrative and executive powers di-
vided between the central and state governments. Each state has a hierarchy of
administrative governments and elected bodies. A large range of benefit programs
are administered, with upper level governments raising the funds to pay for these
programs and devolving spending authority to lower level governments. Program
budgets flow down the hierarchy (shown in Figure 2). District level governments
(Zilla Parishads (ZP)) allocate funds to middle tier governments comprising an
elected body Panchayat Samiti (PS) and appointed bureaucrats Block Develop-
ment Offices which allocate funds to the GPs within the block. The elected GP
bodies then decide the allocation of resources and benefits across and within vil-
lages in their jurisdiction. Each district has one ZP, which covers approximately
20 PSs and 200 GPs. Each GP includes 10-15 villages; each village includes
200-400 households. Officials are directly elected to these three tiers; the local
government at each tier comprises an elected council representing sub-units at the
next tier below. These local government tiers run parallel to different levels of rep-
resentation in the national parliament and the state legislature. A district overlaps
with two to three parliamentary constituencies represented by a Member of Parlia-
9ment (MP) each. Blocks overlap with state assembly constituencies, which elect
Members of the Legislative Assembly (MLA) every five years. During the period
2003-2011 covered by our data, Parliamentary elections were held in 2004 and
2009, the state assembly elections in 2006 and 2011, and the panchayat elections
in 2003 and 2008.
During the period we study (2003-2011), there were two principal political
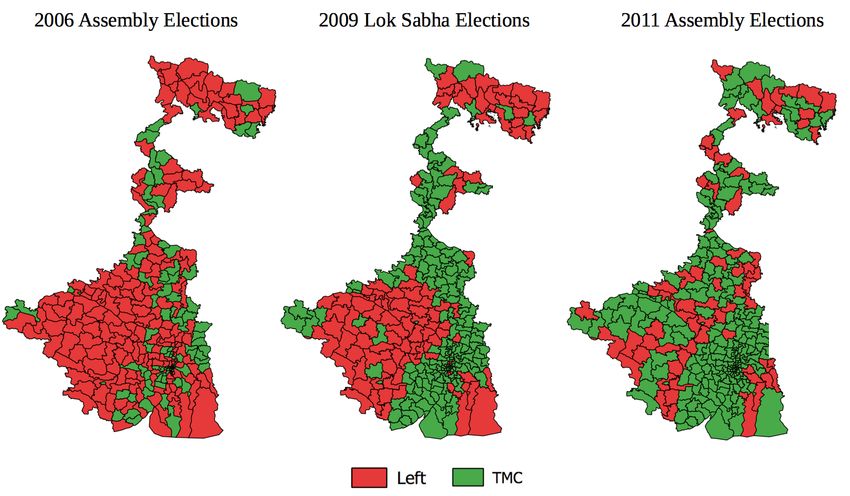
parties competing in West Bengal: the Left Front (LF) coalition led by Commu-
nist Party of India (Marxist) and the Trinamool Congress (TMC). The Left Front
dominated village, district and state governments from 1977-2011, and lost its
majority to the TMC in 2011. In the constituencies included in our sample, the
Left Front’s vote share share dropped from 50% to 41% while the TMC share rose
from 24% to 35% between the 2006 and 2011 state legislature elections (Table 1).
Figure 1 shows changes in electoral outcomes at the assembly constituency level
from the 2006 state assembly elections, to the 2009 Parliamentary elections, and
the 2011 Assembly elections, wherein Left Front dominance progressively gives
way to TMC dominance.
Boundaries of electoral constituencies for parliamentary and state elections are
periodically redrawn in order to equalize population sizes of constituencies. This
was the case in all Indian states following the 2001 Census, based on changes
in Census population figures between 1981 and 2001. The previous redistrict-
ing took place three decades earlier. The National Election Commission set up a
three member Redistricting Commission for each state, comprising a retired Chief
Justice, a member of the National Election Commission, and the State Election
Commissioner. An advisory committee comprised of 5 MPs and 5 state assem-
bly representatives representing different political parties provided input into the
10process. The state Redistricting Commission is required to follow various rules
concerning the redistricting process, including holding public hearings and ad-
dressing complaints. The redistricting went into effect in West Bengal during
2006-07. We therefore treat 2003-2006 as constituting pre-redistricting years, and
2007-2011 as post redistricting years. Iyer and Reddy (2013) studied redistrict-
ing in two other states and found the mandated rules were followed, and that the
outcomes were ‘politically neutral’ with few exceptions (which arose with regard
to redrawing boundaries of constituencies of incumbents on the advisory commit-
tee). In our sample, 26 out of 89 villages were redistricted. The bottom layer of
Figure 2 gives the breakdown of redistricted villages in our sample across juris-
dictions classified by political control of the PSs and GPs (in the 2008 panchayat
elections), and whether the redistricting was to a more competitive constituency
(measured by a lower winning margin in the previous (2006) state assembly elec-
tion).
Table 2, column 1 provides linear probability regressions of the likelihood that
any given village was redistricted, with regressors representing the control of the
LF over the corresponding GP, PS and interactions, whether it was represented
by an MP or MLA with a seat in the Delimitation Commissions, and whether the
assembly constituency seat was reserved for SC/ST candidates. These variables
were used by Iyer and Reddy (2013) to examine political motives for redistricting;
they found the last two regressors played a role in predicting the likelihood of
redistricting in Andhra Pradesh and Rajasthan. In contrast, in our random sample,
we find none of these variables predict the likelihood of redistricting. Conditional
on being redistricted, Column 2 examines the likelihood of our treatment variable:
the GP was redistricted into a more competitive assembly constituency (i.e., where
11the incumbent party had a lower winning margin in the most recent election), and
political alignment (the same party was the incumbent at both the assembly and
the GP level). We fail to find any significant association between this event and
LF control, SC/ST reservation or representation in the Delimitation Commission.
We subsequently use two definitions of ‘treatment’ villages: those redistricted
to higher competition constituencies and not meeting the alignment criterion, and
those redistricted in a manner meeting both alignment and higher competition
criteria. Non-redistricted or those redistricted to lower competition constituencies
villages constitute the control.
Next we describe the major benefits provided by the government to rural resi-
dents of West Bengal: these include a number of schemes sponsored by the Cen-
tral government (where the bulk of funds are provided by the Central government,
and the remainder by the state government). These programs were supplemented
by various state, district and block level benefit programs funded by state and local
funds.
The Central government sponsored schemes included an employment guar-
antee program (NREGA), a road building program (PMGSY), a credit program
(IRDP) and a low income housing and toilet construction program (IAY). The
NREGA act was passed by the Indian Parliament in 2005, and implemented across
different parts of India in three phases between 2006-2009. NREGA provides an
entitlement of 100 days work on a local infrastructure project selected and ad-
ministered by local governments, with a mandated minimum wage. The IRDP
program started in 1978, replacing a number of different programs with a single
integrated package of technology, services and assets aimed at improving the earn-
ing capacity of the rural poor. The most important component was a loan offered
12to the recipient, a certain fraction of which was a subsidy which did not have to be
repaid. The target groups were scheduled castes and tribes, agricultural workers,
artisans, marginal and small farmers not owning more than 5 acres of land. The
rural roads program PMGSY which started in 2000, has funded construction of
all-weather roads to 200,000 villages in India. State government officials are in-
structed to provided detailed plans for rural road construction, based on priorities
that depend on village population (in relation to set thresholds of 1000, 500 and
250), connectivity to core road network, with adjustments for desert areas, tribal
areas. Plans have to be approved by the Central ministry of roads, and subjected to
subsequent central audits. The housing program IAY which started in 1985 pro-
vides a lump sum financial amount to households with below-poverty-line (BPL)
cards to build houses. They are selected by local governments in consultation
with village assemblies. Houses built have to meet certain building norms, such
as inclusion of sanitation facilities and smokeless chulahs (cooking fireplaces).
Another important one-time private benefit is a Below-Poverty-Line (BPL) card.
These are issued to poor households identified by surveys of assets and incomes
by each state government, which entitle recipients to benefit from various wel-
fare schemes. These include ration cards under the public distribution system (for
foodgrain, kerosene, cooking gas) at highly subsidized rates, free housing, old age
pensions, subsidized healthcare services and many others.
These programs are supplemented by others sponsored by the state govern-
ment, some of which are funded by external aid donors such as the Asian Devel-
opment Bank and the UK government. Moreover, district and local governments
have access to untied fiscal transfers from the state government under guidelines
formulated by the State Finance Commission. The programs funded by these
13vary with respect to scale and purpose. In the case of road building, for instance,
some may be through the PMGSY, but many others could be funded by other pro-
grams. From administrative data pertaining to placement of PMGSY roads, we
identify villages in our sample where PMGSY roads were constructed between
2007-2011. There were 39 villages where at least one household reported re-
ceiving a road benefit. Out of these, 8 villages had a PMGSY road construction
according to administrative data, while the remaining 31 had none. Accordingly
we classify road benefits reported by residents of these villages into PMGSY and
non-PMGSY benefits respectively. The selection of villages where road programs
are initiated under the PMGSY was subject to mandates laid down by the Central
government, ostensibly leaving less room for discretion to district and block level
panchayats. Accordingly, our analysis below will study variations in the scale of
PMGSY and non-PMGSY road benefits separately.
It is important to note that we do not rely on administrative data for the dis-
tribution of benefits, owing both to lack of required degree of disaggregation and
concerns about reliability of these data. Instead we survey household heads and
ask them to report the major benefits they received from the local governments.
Two rounds of a longitudinal household survey were carried out in 2004 and 2011.
The sample was randomly selected (stratified by landownership) in 2004 from 89
villages in 59 GPs spread through all districts of West Bengal, excluding Kolkata
and Darjeeling. Approximately 25 households were surveyed in each village,
being selected on the basis of a random sampling design stratified by landhold-
ing. Table 3 provides a summary of the demographic characteristics for the 2402
households in the sample in 2004.
Table 4 provides summary statistics of the distribution of benefits over the
14period 2003-2011. 60% of the households received at least one benefit, and 53%
received at least one private benefit. Among private benefits, employment was
the single largest scheme, benefiting one out of three households. Prior to 2007,
18% benefitted from an employment program, which rose to 21% between 2007-
11 with with implementation of NREGA. Road programs constituted the next
largest program, benefitting a quarter of the population. One time private benefit
programs such as Below-Poverty-Line (BPL) identification cards, private house
or toilets, and drinking water access benefitted 15, 10 and 13% of the population
respectively.
Finally, we construct political support data from the poll responses of house-
hold heads in the two survey rounds 2004 and 2011. Table 1 shows that similar
to the observed shift in vote share in favor of the TMC in the state assembly elec-
tions between 2006-2011, vote shares in the poll shifted in favor of the TMC and
against the LF by a larger magnitude. The difference in magnitude of the shift is
not surprising since the sample (panel (b) in Table 1) covers a small fraction of
the population voting in the corresponding electoral constituencies (panel (a)).
4 Model
Elections take place at the end of every period t = 1, 2, ... In what follows we
focus on resource allocation decisions made at date t by incumbents (officials
elected at the end of date t − 1) at each level of government, which is followed by
an election at the end of date t to select officials in power at date t + 1.
There are two tiers in the local government hierarchy: the higher tier is a
panchayat samity (PS) whose jurisdiction corresponds to a state assembly con-
15stituency. There are two parties: L and T that nominate candidates in an election
to represent this constituency in the state assembly. In period t, constituency Ci is
controlled either by the L party (Ii = 1) or by the T party (Ii = −1) as a result of
the outcome of the election at the end of (t − 1). The elected official follows the
mandates of the party in allocating budgets for various programs to lower level
local governments or gram panchayats (GPs). For simplicity we refer to the juris-
diction of a GP as a village. At t, village v has a GP which is controlled either by
the L party (Iv = 1) or by the T party (Iv = −1) as a result of the past GP election
at the end of t − 1.
Constituency Ci is comprised of villages v ∈ Ci . nv denotes the population
proportion of village v ∈ Ci . Let ηi denote
P
v 0 ∈Ci nv0 Iv0 , which is positive (resp.
negative) if the L (resp. T) party has above-average control of villages in the
constituency.
Residents in village v belong to different socio-economic groups g = 1, . . . , G.
The demographic share of group g in village v is denoted by µvg . Members of
each group have identical preferences for benefits. There are K different benefit
programs; some of which deliver public (nonexcludable) goods, while others dis-
tribute private goods. Benefits are indivisible: each resident either receives one
unit or none. Receipt of benefit k generates a utility of βkg for a member of g.
Budgeting is top-down: for each program k the GP is assigned a budget or pro-
gram scale of Bkv units in period t by the upper tier constituency Ci . If the benefit
is a public good, every resident receives the same number (Bkv ) of units.
While private benefits could be recurring or one-time, we will initially ignore
this distinction and focus on the contrast between (recurring) private and public
16benefits.2 So assume for now that all private benefits are recurring, distributed
randomly within socio-economic groups via lottery. The budgetary decision made
by the GP then reduces to selecting πkg , the probability each member of g receives
µvg πkg ≤ Bkv .
P
benefit k, subject to the budget constraint g
Let P, R denote the set of public and private benefits respectively. In period
p
t, party p = L, T selects a policy πkg , the fraction of group g residents that will
p
receive benefit k = 1, . . . , K, satisfying the feasibility conditions πkg = Bkv for
p
all k ∈ P, and = Bkv for each k ∈ R.
P
g µvg πkg
Given an allocated program budget Bki , k = 1, . . . , K from the district gov-
ernment at the third tier, the party controlling constituency Ci selects an allocation
P
Bkv across villages in its jurisdiction, satisfying the budget constraint v∈Ci nv Bkv =
Bki , k = 1, . . . , K. We take the budgetary allocation across constituencies as
given. A previous version of this paper showed that the analysis of the two tier
model could be extended to three tiers (i.e., endogenizing constituency alloca-
tions) while generating similar results, so we focus on the simpler two tier model
here.
As mentioned previously, budgeting is top-down: in the first stage of the game,
the party controlling each constituency receives a budget from the district, and
allocates it between different GPs in its jurisdiction. This determines the distri-
bution of public benefits across villages. For private goods, at the second stage
of the budgeting game, each GP allocates the assigned budget among different
socio-economic groups within the village.
2
For one-time benefits, a household that has already received the benefit in the past is no
longer eligible. Hence one-time benefits are distributed randomly among eligible members, who
constitute a subset of each group.
17Finally, at the third stage of the game, at the end of t parties engage in electoral
campaigns and then households in each village vote for either party in elections
at both GP and constituency levels. Below we describe alternative specifications
of these electoral contests, corresponding to program politics and clientelism re-
spectively. In either version, elected officials at either tier seek to maximize the
probability of their party winning the corresponding election at the next date t + 1.
We study subgame perfect Nash equilibria of the three stage game. This re-
quires us to work backwards, starting with voting at the third stage.
4.1 Voting under Program Politics
Consider first a standard model of ‘program politics’ without clientelism (Dixit-
Londregan (1995), Grossman-Helpman (1996)). Voting is retrospective: for the
incumbent party, the current distribution pattern πkg is what voters expect in period
t + 1 if it were to be re-elected. For its opponent, it is the electoral platform of
that party, discounted by a ‘credibility’ parameter (1 − α) < 1, thus generating an
electoral advantage for the current incumbent.
Given their expectations, residents vote partly on the basis of utility they ex-
pect in period t + 1 from either party occupying office, and partly on the basis
of loyalty they feel towards each party based on historical attachment, identity or
candidate personality considerations. Suppose L is the current incumbent in the
GP. Relative loyalty θ̃ to the L party is uniformly distributed within group g in
1
village v with constant ‘swing’ density svg
and mean θvg , where svg > 0 is small
enough to ensure interior solutions for vote shares. A member of group g with
18L-loyalty θ̃ will then vote for L if
L T
X X
θ̃ + βkg πkg > (1 − α) βkg πkg (1)
k k
The resulting vote share of the L party in the period t election among village v
residents will be
σvp = θ̄v + L T
X X X X
µvg svg βkg πkg − (1 − α) µvg svg βkg πkg (2)
g k g k
1
where θ̄v ≡
P
2
+ g µvg θvg represents the mean popularity of party L in village v.
4.2 Voting under Clientelism
Now consider the implications of clientelism, based on the formulation in Bardhan
and Mookherjee (2018a). Here the incumbent can withhold distribution of private
benefits to residents that did not vote for it in the previous election.3 This provides
each party with an added tool to mobilize votes. Each resident will compare
their expected utility of voting for either party, which will incorporate their beliefs
regarding the winner of the election (represented by pL , the probability that L
wins) and the subsequent consequences for their receipt of private benefits. The
expected utility of a member of group g and preference θ̃ for the L party in period
(t + 1) upon voting for L is
L T
X X
θ̃ + pL βkg πkg + (1 − pL ) βkg πkg (3)
k∈R∪P k∈P
3
As explained in the Introduction, voting of residents can be monitored, or can be inferred
from their expressions of public support on the eve of the election. See Bardhan and Mookherjee
(2018a) for further details.
19since T will withhold distribution of private goods next period to this household
if it wins. Conversely the household will obtain expected utility of
L T
X X
pL βkg πkg + (1 − pL ) βkg πkg (4)
k∈P k∈P∪R
if it votes for T instead. Comparing (3) with (4), we see that the resident will vote
for L if
L T
X
θ̃ + βkg [pL πkg − (1 − pL )πkg ]>0 (5)
k∈R
Public goods distributed by either party therefore no longer matter: voting deci-
sions depend only on a comparison of private benefits distributed by either party,
weighted by their respective likelihoods of winning. This is the fundamental dif-
ference between program politics and clientelism: in the latter voters weigh in the
personal consequences they expect as a result of the way they vote. If the candi-
date they did not vote for wins the election, they will be punished for not voting by
the subsequent incumbent. This punishment consists of denial of private benefits
earmarked for their group. By the very nature of public goods, they cannot be ex-
cluded from what will be provided by the incumbent. Hence only private transfers
matter, not public goods. Voting no longer reflects the comparative evaluation of
policies of the competing candidates by citizens.
The resulting vote share of L in the village is
σvc = θ̄v + L T
X X
µvg svg βkg [pL πkg − (1 − pL )πkg ] (6)
g k∈R
4.3 Second Stage GP (Within-Village) Allocations
Elected officials controlling the GP allocate private benefits in period t to max-
imize the vote share of their own party in the next election. Expressions (2)
20and (6) show that under both program politics and clientelism, officials in either
∗
party have a dominant strategy {πkg } which maximizes
P
g µvg svg βg πkg subject
P
to g µg πkg = Bkv . From this we can characterize within village allocations and
resulting vote shares in the next election.
Consider any GP with village v that receives a budget Bkv for program k ∈ P∪
R. Under either program politics or clientelism, private benefit k will be allocated
within the village by a GP as follows. Groups will be ranked in order of priority
according to the distributional characteristic δvg ≡ svg βkg . Define g ∗ as follows:
it is the group g with the lowest value δvg such that Bkv ≥
P
{g 0 :δvg0 ≥δvg } µvg0 .
Then πkg equals one for all groups
P g with δvg > δvg∗ , zero for all groups with
Bkv − {g 0 :δvg 0 ≥δvg ∗ }
µvg0
δvg < δvg∗ , and πkg∗ = P
µvg
. The resulting vote share of the L
{g:δvg =δvg ∗ }
party in program politics will be
X X X X
σv = θ̄v + Iv α [ µvg (δvg − δvg∗ ) + δvg∗ Bkv ] + Iv α ( µvg δvg )Bkv
k∈R {g:δvg >δvg∗ } k∈P g
(7)
and in clientelism will be
X X
σv = θ̄v + Iv (2p − 1) [ µvg (δvg − δvg∗ ) + δvg∗ Bkv ] (8)
k∈R {g:δvg >δvg∗ }
where Iv = 1, −1 depending on whether the GP is controlled by the L or T party
respectively, and p denotes voter beliefs of that the current incumbent will be re-
elected.
In words, groups will be ordered by their ‘swing-weighted’ benefit δvg =
svg βkg for private benefit program k, which will be allocated by the GP within the
village to groups with the highest priority until the budget is exhausted. This will
increase the expected vote share of the current incumbent in the next election. De-
∂σv
fine νkv ≡ ∂Bkv
, the marginal vote-generating effectiveness of benefit k in village
21v. It is evident that in both program politics and clientelism, νkv is proportional
to Iv δvg∗ , positive for the incumbent and negative for the challenger. In program
politics the factor of proportionality is α the incumbency advantage parameter; in
clientelism it is 2p − 1 which depends on voter beliefs that the incumbent will be
re-elected.
Now we explain how these expressions are modified in the case of one-time
private benefits. νkv will be smaller compared with recurring private benefits, be-
cause those that have already received a one-time benefit are not eligible to receive
it again. Hence it will motivate only those who are yet to receive the benefit. The
marginal utility βkg will have to be weighted by the fraction of those within group
g who are yet to receive it. This adjustment will lower the distributional char-
acteristic of a one-time benefit relative to a recurring benefit for any group. The
adjustment would apply equally in both program politics and clientelism.
The key distinction between program politics and clientelism is thus the effect
of public benefits on voter support νkv is positive under program politics and zero
in clientelism. In addition, the vote-generating effectiveness of private benefits
depends on the incumbency parameter α in program politics, and on voter beliefs
p that the incumbent will be re-elected in clientelism. This distinction is blurred
if incumbency advantage is related to voter perceptions of re-election likelihoods.
4.4 First Stage PS (Across-Village) Benefit Allocations
Now consider the decisions made by the government controlling Ci , given the
budget allotment Bki that it has received from the government one tier above.
The vote share of party L in Ci is σi ≡
P
v∈Ci nv σv . The village vote share σv
in turn depends on benefit program budgets Bkv allocated to the corresponding
22GPs, as described in (7) and (8) corresponding to program politics and clientelism
respectively.
As in standard models of probabilistic voting, we assume the probability that
the party L candidate wins constituency Ci equals p(σi ), a smooth monotone in-
creasing function of its aggregate vote share. The function p smooths the winning
likelihood, owing to possible randomness in turnout or vote counting errors.
The party controlling Ci is the party that controls the corresponding PS. Let
Ii = 1, −1 depending on whether Ci is controlled by the L or the T party at t. The
incumbent selects an inter-village allocation Bkv , k = 1, . . . , K to maximize
d XX
nv (Bkv − Bki )2
X
Ii Rp( nv σ v ) − (9)
v∈Ci 2 v∈Ci k
subject to village level vote share equations (7) or (8) under program politics
P
and clientelism respectively, and the budget constraint v∈Ci nv Bkv = Bki , k =
1, . . . , K. R denotes exogenous political rents of office, and Bki is the budget
the PS receives from the next higher tier at the district level. The first term in (9)
represents the objective of enhancing re-election prospects, which motivates it to
bias inter-village allocations in favor of villages where benefit programs are likely
to generate most votes for the Ci incumbent. Budget distortions impose a cost
proportional to the variance of the resulting inter-village allocation, represented
by the second term in (9). This represents the cost of coping with complaints of
unfair treatment from village level representativeness, media watchdogs or audi-
tors appointed by upper level governments. The parameter d is assumed large
enough to ensure that the objective function (9) is concave over the relevant range
of vote shares, so that optimal allocations are characterized by interior first-order
conditions.4
4
We need d bigger than Rp” (σi∗ )(nv Iv νk )2 for all v, k holds at the equilibrium vote share σi∗ .
23The first order conditions for this maximization problem provides the follow-
ing characterization of the optimal inter-village allocation:
Proposition 1. The optimal inter-village allocation of program k across GPs lo-
cated in constituency Ci satisfies
∗ R 0 ∗ X
Bkv = Bki + pi (σi )[nv νkv Ii Iv − nv0 νkv0 Ii Iv0 ] (10)
dnv v0
where Bki denotes the per capita budget for the constituency, and σi∗ denotes the
resulting equilibrium vote share of the L party.
The inter-village allocation of benefit k within constituency Ci is biased in
favor of village v by an extent that depends on: (a) νkv : how effective the benefit
is in generating votes; (b) p0i : how competitive the constituency is; (c) Iv Ii = 1
or −1: whether political control is aligned between the two tiers. This yields the
following corollary.
Corollary 1. (a) In clientelism (but not in program politics), (local) public ben-
efits will not respond to shocks in political competitiveness or alignment.
(b) For private goods under either program politics or clientelism, aligned GPs
(where Ii Iv = 1) will receive higher budgets than non-aligned GPs (where
Ii Iv = −1). The gap between aligned and non-aligned villages will be
larger in more competitive (i.e., higher p0 ) constituencies, and for benefits
with larger vote-generating effectiveness νkv .
Hence alignment and competitiveness determine the direction and extent of
the budgetary manipulation by the upper tier government, which discriminates in
favor of GPs controlled by the same party at the lower tier. More competitive con-
stituencies will seek to bias inter-GP allocations more, particularly those benefit
24programs which are more effective in generating votes. In program politics lo-
cal government budgets for both public and private benefits will be manipulated,
whereas only private benefit program budgets will be manipulated in clientelism.
5 Empirical Results
5.1 Upper Layer Analysis: Effects of Redistricting on Inter-
Village Benefit Allocations
In this section, we examine how changes in political incentives of elected officials
at higher levels of the government affect allocation of benefits across villages.
To obtain exogenous variation in political competition, we utilize redrawing of
boundaries between state legislative assembly constituencies carried out in 2007.
The time period 2003-2006 constitutes the pre-redistricting years, and 2007-2011
as post redistricting years. We use difference-in-differences (DID) to obtain causal
estimates using the following specification. Let Bvt denote per-capita benefits of
any specific category reported by residents in village v in year t. We express this
in standardized units (subtract each village-year observation by the sample mean
and divide by the standard deviation).
Bvt = α0 + α1 Postt *HC Redistrictedv *Alignedv
+ α2 Postt *HC Redistrictedv
+ α3 Xvt + Fd(v) + τt + vt
where ‘Postt ’ is a dummy for years 2007-11 following redistricting, ‘HC Redis-
tricted’ is a dummy for villages redistricted to an assembly constituency with a
25lower winning margin in 2006, and ‘Aligned’ is a dummy for control by the same
party in both PS and GP levels. Xvt includes each of these three variables and
pairwise interactions, pre-2007 trends and dummies for representation on the De-
limitation Committee by the MLA/MP of the original constituency. Fd(v) is a
dummy for district d(v) in which village v is located, and τt is a year t dummy.
vt is the error term; standard errors are clustered at the PS level.
The main identification assumption for causal interpretation of a DID esti-
mate is the parallel trend assumption which requires that the trend in the outcome
variable for both treatment and control groups during the pre-treatment period
are similar. We now examine these trends. The top panel in Figure 3 depicts the
before-after time plots (for private and public (road) benefits respectively) for each
treatment category (aligned and nonaligned GP redistricted to a more competitive
constituency) and control (i.e., all other) villages. For both aggregate private and
public benefits the trends prior to redistricting were similar. After redistricting
the allocation to the aligned treatment increased the most, with the pre-post dif-
ferences more marked for private benefits. The bottom panel breaks down the
private benefit plots into recurring and one-time benefits. For both categories pre-
trends are similar though there are some sharp spikes between 2004-06 in the
allocation to the nonaligned-redistricted group; after 2007 larger spikes appear in
the aligned-redistricted group, consistent with our hypothesis.
The regression results for the effect of the two treatment variables on alloca-
tions of recurring, one-time private and road benefits per household are shown
in Table 5. For recurring benefits, Column 1 shows that redistricting to a more
competitive constituency was associated with a 2.4 s.d. rise in the gap between
the aligned and non-aligned treatment groups, along with a negative 1.5 s.d. im-
26pact on the non-aligned treatment category. These effects are significant at the 1%
level. Column 2 shows the effects on one-time private benefits move in the same
direction, but the point estimates are substantially smaller and fail to be significant
at 10%. Columns 3 and 4 show corresponding regressions for non-PMGSY and
PMGSY road benefits separately, since the latter program allows less scope for
discretion by the upper level governments at the block and district levels. We see
a negative 0.6 s.d. effect on non-PMGSY road benefits in politically non-aligned
GPs which is significant at the 10% level, and a zero effect in aligned GPs. The
standard errors for the non-PMGSY roads are comparable to those for recurring
private benefits, while the magnitude of the effect is substantially smaller. Effects
for both groups are also zero for PMGSY roads, consistent with the expectation
that this program allowed less scope for discretion. Hence overall, we see a much
smaller effect for road programs than for recurring private benefits.
The preceding results aggregated different types of benefits within the cate-
gories of recurring and one-time private benefits, which may raise concerns about
aggregation biases and interpretation of the results. Tables 6 and 7 therefore show
corresponding results for specific categories of private benefits. Table 6 shows
effects on recurring benefits. The results for employment programs (columns 1,
2) are similar to those of aggregate recurring benefits: there is more than a 2
s.d increase in the gap between allocations to the aligned and non-aligned GPs
upon redistricting to a more competitive constituency. The direction of impacts
on credit and minikits (subsidized agricultural inputs) are the same, but fail to be
statistically significant; Table 7 shows the same is true for various one-time private
benefits.
While the preceding regressions already controlled for pre-trends, Table 8
27conducts a placebo test using data for 2001-2006, where the redistricting date
is moved ahead hypothetically to 2003. For recurring benefits, we no longer see
the results of Table 5. The signs of the redistricting effects on recurring private
benefits are reversed and statistically insignificant.
In summary, we see large effects on program scales of recurring private ben-
efits, and smaller and insignificant effects for roads or one-time private benefits.
To investigate further the relative effectiveness of benefits of different kinds in
generating votes, we turn next to evidence at the household level.
5.2 Household Level Analysis: Effects of Benefits on Political
Support
Since there was no poll conducted during 2004-2007, we do not have data on
support before the redistricting. We therefore examine cross-sectional differences
in the likelihood of households expressing support for the GP-incumbent in the
2011 poll. Columns 1 and 3 of Table 9 reports OLS regression results for how the
likelihood of the household head voting for the incumbent party in our straw poll
varied with recurring, one time and road benefits received between 2007-2011.
The regression specification is
X
Liv = νk bk,iv + βXiv + iv (11)
k
where Liv is a dummy for the party supported by household head i in village v
in the 2011 straw poll, bk,iv is the total number of benefits of type k reported by
the household over the 2007-2011 period, and Xiv is a vector of household and
village controls. These include household characteristics (dummies for SC/ST,
religion, landless households, occupation, and years of education of the head), GP
28characteristics (dummy for Left control of GP and PS respectively) and district
dummies. Column 1 shows results for three categories of benefits: recurring, one-
time, and roads, while column 3 shows corresponding results when we collapse
recurring and one-time benefits into a single (private benefits) category, while
roads are disaggregated between non-PMGSY and PMGSY. We see a significant
positive effect for one-time benefits and private benefits, while road benefits do
not have a positive effect, irrespective of how these are disaggregated.
We are, however, interested in estimating the causal impact of receipt of ben-
efits of a given type on the household head’s vote in the straw poll. This requires
removing possible sources of endogeneity bias, that may result from instance from
reverse causality (benefit allocation within the village could have been targeted by
political incumbents to households based on information about their likely politi-
cal loyalties) or correlation with relevant omitted variables (e.g., households less
vulnerable and dependent on government benefits may happen to be less support-
ive of the current incumbent). Columns 2 and 4 report corresponding IV regres-
sion estimates, where receipt of different benefits at the household level is instru-
mented by exogenous sources of variation in the corresponding GP budget, inter-
acted with fixed household characteristics HCiv (consisting of landlessness and
SC/ST dummies). In the case of recurring private benefits, our results in the pre-
ceding section has shown GP budgets varied in different ways to the redistricting
treatment shocks Tv (dummy for redistricting to a more competitive constituency,
for aligned and non-aligned GPs respectively), which is plausibly exogenous from
the standpoint of a given household within the village in question. However, this
shock did not generate sufficient variation in the scale of one-time benefits and
road benefits in the GP. Following the strategy of Levitt and Snyder (1997), we
29therefore supplement the set of instruments with Skd(v) the scale of each program
(per capita benefits) at the district level excluding the GP in question (interacted
with HCiv ). The first-stage and second-stage regression specifications are as fol-
lows:
First-Stage:
bivk = τ1k Sk,d(v) ∗ Tv ∗ HCiv + τ2k Tv ∗ Sk,d(v) + τ3k Tv ∗ HCiv
+ τ4k Sk,d(v) ∗ HCiv + τ5k Sk,d(v) + τ6k Tv + τ7k HCiv + τ8k Xv + θd + ηivk
Second-Stage:
X
Liv = νk b̄ivk + ρ1 Tv + ρ2 HCiv + ρ3 Xv + αd + iv (12)
k
Columns 2 and 4 in Table 9 show IV results corresponding to the OLS spec-
ification in columns 1 and 3 respectively. Two regressors are treated as endoge-
nous in each: recurring and one time benefits in Column 2; private benefits and
non-PMGSY roads in Column 4 (based on the assumption that PMGSY road
placements were exogenous). The identification rank test shows the instruments
provide enough independent variation in the two endogenous variables in each
regression. The first stage F-statistics are significant at the 1% level, but fall be-
low the conventional threshold of 10% which suggests the instruments are weak.
For inference with weak instruments, we follow Andrews, Stock and Sun (2019).
In both columns 2 and 4, the weak-instrument-robust Lagrange multiplier test
statistic for joint significance of coefficients of the three endogenous variables are
significant at the 1% level. The weak-instrument-robust Hansen J test of overi-
dentifying restrictions has a p-value of 0.49.
While the OLS results (columns 1,3) show a statistically significant coefficient
only for one-time benefits, the IV estimates in Column 2 are positive and signif-
30icant for recurring benefits: a 12% increase in the likelihood of voting for the
incumbent, compared to a mean of 52%. Somewhat surprisingly, the correspond-
ing IV estimate of the coefficient of roads is negative and significant. The effect
of one-time benefits fails to be statistically significant, and the point estimate is
smaller in magnitude than the IV estimate of the effect of recurring benefits.
While the IV results for recurring and one-time benefits are consistent with
our theory, the negative effect of road benefits is not. One possible explanation is
as follows. As described in Section 3, the Central government sponsored PMGSY
program for constructing rural roads was launched in 2001 across the entire coun-
try. This supplemented programs funded and sponsored by the state and local
governments. Since PMGSY road placement was largely formula-bound and cen-
tral government funded, they shrank the role of local governments in providing
roads. Roads built under the PMGSY program tended to be marked clearly with
large signs indicating the role of the central government in its provision. At the
same time, this may have highlighted the relatively negligible role of local gov-
ernments to local residents. As the government at the Central level was dominated
by a different party (UPA coalition) than local governments in West Bengal (ei-
ther Left Front or TMC), this may have impacted support for the local incumbent
negatively.
To check the plausibility of this explanation, Table 10 reports results from a
survey of perceptions of household heads concerning the role and effectiveness of
local government leaders on different dimensions. Household heads were asked
to evaluate local officials on a scale from 1-5, with 5 being the highest. We regress
the assigned scores on road benefits received by the household, after controlling
for fixed household characteristics. In the subsample of PMGSY villages, a house-
31hold head that reported benefitting from these roads was significantly more likely
to assign a lower score to their local leaders on the latter’s involvement in pro-
vision of infrastructure. This did not obtain in villages without PMGSY roads.
Effects on other dimensions such as honesty or performance relative to previous
incumbents were not significant. This suggests that the PMGSY program resulted
in substitution between the salience of local and central governments in provision
of infrastructure.
Column 4 in Table 9 therefore breaks up road benefits into PMGSY and non-
PMGSY roads respectively, while aggregating recurring and one-time benefits
into a single category of private benefits. Consistent with the above explanation,
only the PMGSY road benefits exercised a significant negative impact on house-
hold votes for the incumbent. The non-PMGSY road benefits, which constituted
the large majority of road benefits overall, had an insignificant negative impact, in
contrast to a significant positive 12% impact of private benefits. These results are
consistent with the hypothesis of clientelism, rather than program politics.
6 Concluding Observations
The results of the household level analysis and upper level analysis are consis-
tent: households responded more sharply in favor of the local incumbent when
they received private recurring benefits, and upper level governments re-allocated
these programs across GPs located in more competitive constituencies depending
on political alignment. Household support did not respond positively to roads pro-
vided by local governments. Centrally provided roads lowered household support
for the local incumbents (who were not aligned with the party controlling the Cen-
32You can also read