Barclays CEO Energy-Power Conference - September 4-6, 2018

Page created by Peter Luna
 
CONTINUE READING
Barclays CEO Energy-Power Conference - September 4-6, 2018
Barclays CEO Energy-Power Conference
             September 4-6, 2018
Barclays CEO Energy-Power Conference - September 4-6, 2018
Forward‐Looking Statements

This presentation contains forward-looking statements within the meaning of federal securities laws regarding Marathon Petroleum Corporation ("MPC"). These forward-looking statements relate
to, among other things, the proposed transaction between MPC and Andeavor ("ANDV") and include expectations, estimates and projections concerning the business and operations, strategic
initiatives and value creation plans of MPC. In accordance with "safe harbor" provisions of the Private Securities Litigation Reform Act of 1995, these statements are accompanied by cautionary
language identifying important factors, though not necessarily all such factors, that could cause future outcomes to differ materially from those set forth in the forward-looking statements. You can
identify forward-looking statements by words such as "anticipate," "believe," "could," "design," "estimate," "expect," "forecast," "goal," "guidance," "imply," "intend," "may," "objective," "opportunity,"
"outlook," "plan," "position," "potential," "predict," "project," "prospective," "pursue," "seek," "should," "strategy," "target," "would," "will" or other similar expressions that convey the uncertainty of
future events or outcomes. Such forward-looking statements are not guarantees of future performance and are subject to risks, uncertainties and other factors, some of which are beyond the
company's control and are difficult to predict. Factors that could cause MPC's actual results to differ materially from those implied in the forward-looking statements include: the ability to complete
the proposed transaction between MPC and ANDV on anticipated terms and timetable; the ability to obtain approval by the shareholders of ANDV and MPC related to the proposed transaction
and the ability to satisfy various other conditions to the closing of the transaction contemplated by the merger agreement; the ability to obtain regulatory approvals of the proposed transaction on
the proposed terms and schedule, and any conditions imposed on the combined entity in connection with consummation of the proposed transaction; the risk that the cost savings and any other
synergies from the proposed transaction may not be fully realized or may take longer to realize than expected; disruption from the proposed transaction making it more difficult to maintain
relationships with customers, employees or suppliers; risks relating to any unforeseen liabilities of ANDV; future levels of revenues, refining and marketing margins, operating costs, retail gasoline
and distillate margins, merchandise margins, income from operations, net income or earnings per share; the regional, national and worldwide availability and pricing of refined products, crude oil,
natural gas, NGLs and other feedstocks; consumer demand for refined products; our ability to manage disruptions in credit markets or changes to our credit rating; future levels of capital,
environmental or maintenance expenditures, general and administrative and other expenses; the success or timing of completion of ongoing or anticipated capital or maintenance projects; the
reliability of processing units and other equipment; business strategies, growth opportunities and expected investment; MPC's share repurchase authorizations, including the timing and amounts of
any common stock repurchases; the adequacy of our capital resources and liquidity, including but not limited to, availability of sufficient cash flow to execute our business plan and to effect any
share repurchases, including within the expected timeframe; the effect of restructuring or reorganization of business components; the potential effects of judicial or other proceedings on our
business, financial condition, results of operations and cash flows; continued or further volatility in and/or degradation of general economic, market, industry or business conditions; compliance
with federal and state environmental, economic, health and safety, energy and other policies and regulations, including the cost of compliance with the Renewable Fuel Standard, and/or
enforcement actions initiated thereunder; the anticipated effects of actions of third parties such as competitors, activist investors or federal, foreign, state or local regulatory authorities or plaintiffs
in litigation; the impact of adverse market conditions or other similar risks to those identified herein affecting MPLX; and the factors set forth under the heading "Risk Factors" in MPC's Annual
Report on Form 10-K for the year ended Dec. 31, 2017, and in the Form S-4 filed by MPC, filed with Securities and Exchange Commission (SEC). We have based our forward-looking statements
on our current expectations, estimates and projections about our industry. We caution that these statements are not guarantees of future performance and you should not rely unduly on them, as
they involve risks, uncertainties, and assumptions that we cannot predict. In addition, we have based many of these forward-looking statements on assumptions about future events that may prove
to be inaccurate. While our respective management considers these assumptions to be reasonable, they are inherently subject to significant business, economic, competitive, regulatory and other
risks, contingencies and uncertainties, most of which are difficult to predict and many of which are beyond our control. Accordingly, our actual results may differ materially from the future
performance that we have expressed or forecast in our forward-looking statements. We undertake no obligation to update any forward-looking statements except to the extent required by
applicable law.

                                                                                                                                                                                                           2
Barclays CEO Energy-Power Conference - September 4-6, 2018
Additional Information

Additional Information and Where to Find It
In connection with the proposed transaction, MPC and ANDV have filed relevant materials with the SEC, including MPC’s registration statement on Form S-4
that includes a definitive joint proxy statement/prospectus and was declared effective by the SEC on August 3, 2018. INVESTORS AND SECURITY
HOLDERS ARE ENCOURAGED TO READ THE REGISTRATION STATEMENT AND ANY OTHER RELEVANT DOCUMENTS FILED WITH THE SEC,
INCLUDING THE DEFINITIVE JOINT PROXY STATEMENT/PROSPECTUS BECAUSE THEY CONTAIN IMPORTANT INFORMATION ABOUT THE
PROPOSED TRANSACTION. The final joint proxy statement/prospectus will be mailed to stockholders of MPC and ANDV. Investors and security holders will
be able to obtain the documents free of charge at the SEC's website, www.sec.gov, from MPC at its website, www.marathonpetroleum.com, or by contacting
MPC's Investor Relations at 419.421.2414, or from ANDV at its website, www.andeavor.com, or by contacting ANDV's Investor Relations at 210.626.4757.

Participants in Solicitation
MPC and ANDV and their respective directors and executive officers and other members of management and employees may be deemed to be participants in
the solicitation of proxies in respect of the proposed transaction. Information concerning MPC's participants is set forth in the proxy statement, filed March 15,
2018, for MPC's 2018 annual meeting of stockholders as filed with the SEC on Schedule 14A. Information concerning ANDV's participants is set forth in the
proxy statement, filed March 15, 2018, for ANDV's 2018 annual meeting of stockholders as filed with the SEC on Schedule 14A. Additional information
regarding the interests of such participants in the solicitation of proxies in respect of the proposed transaction are included in the registration statement and
joint proxy statement/prospectus and other relevant materials filed with the SEC when they become available.

Non-GAAP Financial Measures
EBITDA and Speedway margin are non-GAAP financial measures provided in this presentation. Reconciliations to the nearest GAAP financial measures are
included in the Appendix to this presentation. These non-GAAP financial measures are not defined by GAAP and should not be considered in isolation or as
an alternative to net income attributable to MPC, net cash provided by (used in) operating, investing and financing activities, Speedway income from
operations or other financial measures prepared in accordance with GAAP.

                                                                                                                                                                3
Barclays CEO Energy-Power Conference - September 4-6, 2018
Pro Forma MPC – A Leading Energy Company

                                             Largest refiner in North America
Refining

                                             16 refineries with >3 MMBPD of capacity
                                             Diversified footprint across 4 of 5 PADDs
                                             Export access: reaching every major global crude market
                                 Midstream

                                                                                  One of the largest midstream operators in North America
                                                                                  Nearly $5 B per year of run-rate EBITDA1
                                                                                  Established footprint in Marcellus / Utica and Permian
                                                                                                         v
                                                                                                                 Nationwide retail and marketing business
                                                                      Marketing

                                                                                                                 ~4,000 company owned / operated sites
                                                                                                                 ~7,800 branded locations
                                                                                                                 Assured placement of ~70% of MPC’s gasoline volume2

                                                    Strong Culture of Safety, Environmental Stewardship,
                                                  and Commitment to People and Supporting Communities
       Source: Company filings. Note: all information pro forma for acquisition of Andeavor unless otherwise noted.
       1Based on FactSet for 2019 consensus estimates for related midstream assets across both MPC and ANDV. 2Excludes Andeavor.                                       4
Barclays CEO Energy-Power Conference - September 4-6, 2018
Well-Positioned for the Long Term

                   Refining                                       Midstream                           Marketing

    Positive Global Macro Backdrop                          Positive U.S. Production Backdrop         Nationwide Platform1
                                                                                                 Consolidation + Changing Retail
                  Efficient Operator                        Footprint in Fastest Growth Basins
                                                                                                 Dynamics Creates Opportunities
 Ability to Source Advantaged Crude                            Refining Alignment Creates        Industry Leading Retail Loyalty
                                                                      Opportunities                         Program
        Export + IMO Opportunities

                                         Large scale, geographically-diversified, highly-integrated
1Nationwide   platform applies to pro forma MPC footprint
                                                                                                                                   5
Barclays CEO Energy-Power Conference - September 4-6, 2018
Integrated Model Enhances Earnings Stability and
     Sustainability
     MPC’s business mix has significantly diversified and non-refining segments now
     contribute more than 50% of mix. At the same time, positive backdrop has market
     estimates of cash flow yield improving and above the current energy sector average.
                                                      MPC EBITDA By Segment                                                                                                                   MPC FCF Yield
                                                                                                                                                                                                                           2

                                                                                                                                                                             12%                                          11%
                                                                                                                           ~65%                                              10%                 9%

                                                                                                                                                                               8%
          EBITDA

                                                                                                                                                                               6%

                                                                                                                                                                               4%                     S&P500 Energy
                                                                                                                                                                                                       Index = 2.7%3
                                                                                                                                                                               2%
                               ~15%
                                                                                                                                                                               0%
                      2013                   2014                  2015                   2016                  2017                  2018E1                                              LTM Q2 2018                    2020E1
                                            Midstream              Speedway              Refining & Marketing

Source: Public information. 1Per financial forecast in MPC Form S-4 declared effective August 3, 2018; see appendix slide for reconciliation of historical segment data. 2MPC FCF yield is defined as: (cash flow from operations - capex - MLP
distributions to public holders)/share count/share price (LTM uses price on June 29, 2018; 2020E uses price on August 27, 2018). 3Market cap weighted average based on last 12 months (LTM) as of August 16, 2018; data per Bloomberg.
                                                                                                                                                                                                                                                  6
Barclays CEO Energy-Power Conference - September 4-6, 2018
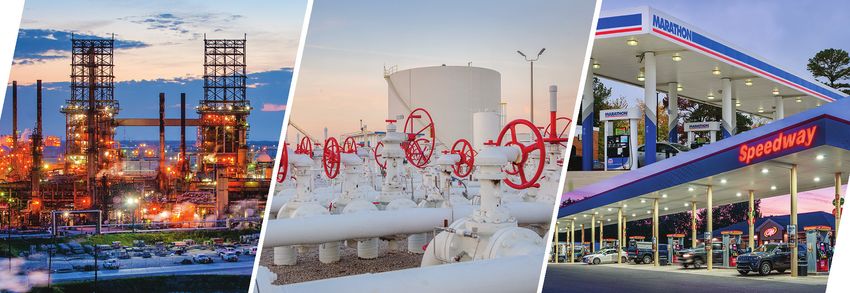
Committed to Creating Shareholder Value

MPC remains committed to creating shareholder value through its disciplined capital
strategy and returning capital beyond the needs of the business in a manner consistent
with maintaining the company’s investment grade credit profile.

                                                                                     Total Share Repurchases1                                                39%
                                                 40%   712
                                                                                                                                                                      700
                                                                                                                                                   35%
           Cumulative % of Shares Repurchased2

                                                                     666

                                                 30%                                                        28%                28%

                                                                                                                                                                            Shares Outstanding (MM)
                                                                             594                                                                                      600
                                                        Cumulative % of                  25%
                                                        Shares Repurchased                547
                                                                                                             531                528
                                                 20%    Shares Outstanding
                                                                             18%
                                                                                                                                                                      500
                                                                                                                                                    486
                                                                                                                                                             456

                                                 10%                 8%                                                                                               400

                                                 0%                                                                                                                   300
                                                       2011         2012     2013        2014               2015               2016               2017      1H 2018
 1Shares   adjusted for 2:1 stock split in June 2015. 2Cumulative repurchase represents percentage of the ~712 MM shares outstanding as of June 30, 2011.                                             7
Barclays CEO Energy-Power Conference - September 4-6, 2018
Responsible Corporate Leadership
                                                                  MPC facilities received from the
                                                   American Chemistry Council

              75%                       56                                    3                                  7
              MPC has earned
                                             Certificates of                        Certificates of                    Certificates of
                                             Excellence                             Honor                              Achievement

              of the Environmental
              Protection Agency’s
              Energy Star

                                                                                              16
              recognitions awarded
              to refineries.                                                                              MPC facilities have earned
                                                                                                          the federal Occupational
                                                                                                          Safety and Health
                                                                                                          Administration’s

                                10%
                                                                                                          Highest Voluntary Protection
                       That’s                                                                             Program status.
                     despite

                                                                                                                     20%
                 owning and                             MPC manages                                     MPC has

                                                               21
               operating just                                                                           placed in
                                                                                                          the top
               of total U.S. refining                                                          of companies in the EPA’s SmartWay Transport
               capacity.                       certified wildlife habitats consisting of   Partnerships, which recognizes the top performing freight

                                                          1,352
                                                                                             carriers for carbon, NOx, and particulate emissions.

                                                              acres.

                                                                                                                                               8
Barclays CEO Energy-Power Conference - September 4-6, 2018
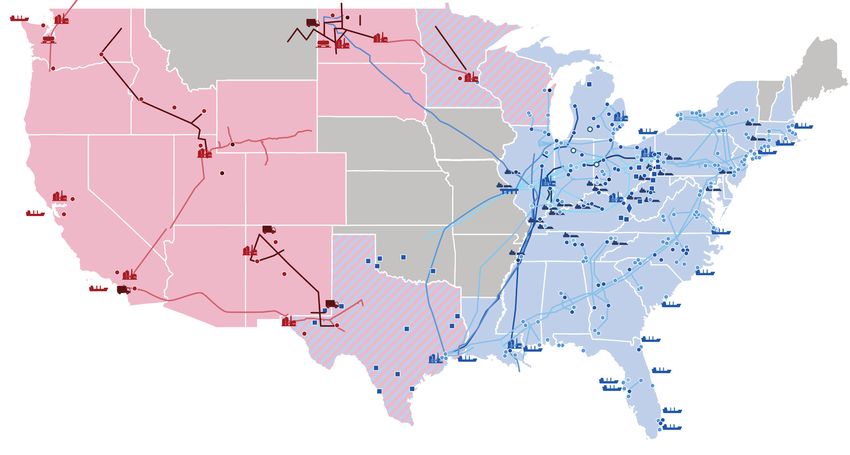
Global Macro and Refining
        Outlook
Barclays CEO Energy-Power Conference - September 4-6, 2018
Global & U.S. Economic Outlook Positive

Gasoline demand: growth estimates center around 0.6% per year as tailwinds from rising consumer
incomes and higher vehicle miles travelled are partially offset by continued fuel efficiency improvements.
Electric vehicle impact remains minimal through 2030. Distillate demand: expected to grow 1.2% per year
as a positive economic outlook supports fuel demand in transportation and industrial sectors and IMO 2020
regulations drive increased global shipping industry demand for distillates.

                  Global GDP Outlook                                       29   Global Gasoline Demand                                      50    Global Distillate Demand
4.0%                Forecast Range                                                     Forecast Range                                                    Forecast Range
                    Actual
                                                                                                                                            45
                                                                           27          Actual                                                            Actual
                    MPC Forecast
3.5%                                                                                   MPC Forecast
                                                                                                                                            40
                                                                                                                                                         MPC Forecast

                                                                           25

                                                                                                                                    MMBPD
                                                                   MMBPD

3.0%                                                                                                                                        35

2.5%                                                                       23
                                                                                                                                            30

2.0%                                                                       21                                                               25

                                                                                                                                                 2006

                                                                                                                                                        2009

                                                                                                                                                               2012

                                                                                                                                                                      2015

                                                                                                                                                                             2020E

                                                                                                                                                                                     2025E

                                                                                                                                                                                             2030E
         2012

                   2014

                             2016

                                       2018E

                                                 2020E

                                                           2022E

                                                                                2006

                                                                                       2009

                                                                                              2012

                                                                                                     2015

                                                                                                            2020E

                                                                                                                    2025E

                                                                                                                            2030E
Sources: MPC with range of estimates from IMF, World Bank, OPEC                                                                                                                                 10
Technology Advancements: Mixed Trends

  Technology Focus Areas   Description

                                         Fuel economy and emission standards have been and are anticipated to
  Fuel Economy and                       remain a headwind to gasoline demand growth. The EPA’s proposed
  Emissions Standards                    rollback of the planned 2021-2025 U.S. CAFE standards could add as
                                         much as 350 MBPD (3%) to U.S. gasoline demand by 2025.

                                         Global electric vehicle production doubled from 2015 to 2017 but still
                                         represents
Exports are a Sustainable Opportunity

        Over the past decade, U.S. distillate production growth has continued to outpace
        domestic demand growth – but found an outlet in Latin American markets. Exports
        remain a sustained opportunity as under-investment and political / economic challenges
        remain in many Latin American countries.

                       Distillate Production vs. Demand                                        800                   Distillate Exports
                                                                                  83%
        5                                                                                      600
                                                                                  81%
        4
MMBPD

                                                                                               400

                                                                                        MBPD
                                                                                  79%
        3                                                                                      200
                                                                                  77%

        2                                                                         75%           0
             2012       2013       2014      2015   2016        2017 2018 YTD

                                                                                                     2012

                                                                                                            2013

                                                                                                                     2014

                                                                                                                               2015

                                                                                                                                      2016

                                                                                                                                                  2017

                                                                                                                                                         2018 YTD
              Distillate Fuel Oil Production               Distillate Fuel Oil Demand
              Demand as % of Production                                                                     Brazil          Chile            Mexico
   Source: EIA                                                                                                                                                      12
Global Refining Capacity Relatively Balanced

        Net worldwide refining capacity growth appears relatively balanced at roughly
        1 MMBPD per year growth over the next few years -- with about 75% of new
        capacity coming from Asia and the Middle East which should support their domestic
        demand.
              Global Crude Distillation Capacity and Demand                                                                  U.S. Refinery Utilization
                                  Growth                                                                 100%
        2.0

                                                                                    Refinery Utilization %
MMBPD

                                                                                                             90%
        1.0

        0.0                                                                                                  80%
                2013    2014     2015    2016       2017 2018E 2019E 2020E 2021E                                   J   F     M     A     M        J   J    A     S    O     N      D
                                    Net Global Crude Distillation Capacity Growth
                                    Oil Demand Growth (ex. Biofuels)
                                                                                                                           5-year range (13-17)           5-year average (13-17)
                                    Forecast                                                                               2017                           2018
   Sources: MPC, EIA, Barclays                                                                                                                                                         13
Global Inventories Moderate

        Over the past year, strong demand growth has eliminated the surplus in gasoline and distillate
        inventories bringing them near or below their historical averages. Demand expectations
        through 2019 support continued moderate inventory levels.

                        Global Gasoline Inventories                                                        Global Distillate Inventories
      450                                                                             700

      425                                                                             650

      400                                                                             600
MMB

                                                                                MMB
      375                                                                             550

      350                                                                             500

      325                                                                             450
                J   F    M     A     M     J   J     A     S     O     N    D               J     F    M      A    M   J   J    A     S     O     N     D
                    5-year Range (13-17)           5-year Average (13-17)                       5-year Range (13-17)           5-year Average (13-17)
                    2017                           2018                                         2017                           2018
      Source: IEA                                                                                                                                       14
U.S. Inventories Support Refining Margins

       U.S. light product inventories are at or below their five-year averages on a days of supply
       basis, which have bolstered refining margins this year. A large fall turnaround season as well
       as continued export demand should keep U.S. inventory levels encouraging.

                              U.S. Gasoline Days of Supply                                           U.S. Distillate Days of Supply
       29                                                                               35

       26                                                                               30
Days

                                                                                 Days
       23                                                                               25

       20                                                                               20
              J      F       M     A   M    J   J     A     S     O     N    D               J   F     M     A     M    J   J    A     S     O     N     D
                     5-year Range (13-17)           5-year Average (13-17)                       5-year Range (13-17)           5-year Average (13-17)
                     2017                           2018                                         2017                           2018
  Source: EIA (includes exports)                                                                                                                         15
U.S. Refineries Among Most Cost Efficient in World

    The U.S. refining system is among the most cost efficient in the world given its access to
    low-cost natural gas and price-advantaged crudes – making it well-positioned to supply
    transportation fuels across the world.

                    Transportation Fuel Production Cost                                                            Net Cash Margin
                                                                                                  9                                             United States
          54                                                            Latin America
                                                          Middle East                             8

          52              $3                    Western Europe                                    7         $3

                                                                                        USD/BBL
                                                                                                                                                 Asia Pacific
USD/BBL

                                                                                                  6
          50

                                     United States                                                5
          48
                                                                                                  4               Latin America   Middle East
                    Asia Pacific
          46                                                                                          Western Europe
                                                                                                  3
 Source: Solomon Associates 2016 Fuels Study                                                                                                                    16
MPC has Some of the Best Assets in the U.S.

MPC’s refineries include 2 of the largest in the U.S. Garyville is the most cost efficient and
Galveston Bay has improved two quartiles since acquired in 2013. Rigorous routine and
turnaround planning improves operating abilities – while the integrated model enhances value
by increasing access to advantaged crude and securing placement of refined products.

                                                                            Cash Operating Cost Per Barrel

                                                                                                                                          Quartiles
                                                                                                         2016
                                                                                                          2016Study  Averages
                                                                                                               U.S. Average Performance
                                                                   $30M                                                                     4th
                      Higher Cost

                                                                                                                                            3rd

                                                                                                                                            2nd
                                                                                                             MPC 2018
                                                                                                            Forecasted1                     1st

                                                                             Average Utilized Capacity
 Source: Solomon Associates 2016 Fuels Study. 1MPC forecasted off current 6 plant refining system.                                                    17
Global Crude Production Sufficient to Meet Demand

    Global crude production growth is anticipated to average 550 MMBPD per year through 2030,
    comparable to growth rates seen over the last decade. At the same time, the U.S. is on track
    to become the largest oil-producing nation in the world and remains a significant source
    of global supply growth into the next decade.
                          Global Crude Production                                         U.S. Crude Production Forecast
                                                                              12
        90

                                                                              11
        80
MMBPD

                                                                                                                           Actual

                                                                      MMBPD
                                                                              10
                                                                                                                           MPC Forecast
        70                                                                                                                 STEO Forecast
                                                                              9                                            IEA Forecast

        60                                                                    8
          2010            2015         2020E          2025E   2030E                1Q17    3Q17     1Q18     3Q18    1Q19           3Q19
                                 ROW           U.S.
 Sources: IEA, EIA, MPC                                                                                                                    18
U.S. Rapid Growth Driven by Compelling Economics

  Total 2018E-2022E U.S. Production Growth +3.5 MMBPD                     14,000                     U.S. Crude Production
                                                                          12,000
                                   +250
                        Bakken                                            10,000

                                                        MBPD
                                   MBPD
                                                                               8,000
                                                                               6,000
                                                                               4,000
                                               SCOOP                                      2017           2018E        2019E     2020E         2021E      2022E

                                       +275
                                               /STACK                    Rest of U.S.       Bakken          SCOOP/STACK                Eagle Ford       Permian
                                   v   MBPD
                                                                                                   Breakeven WTI Price                                    $56

                                                           WTI Price ($/bbl)
                                                                                                                                             $52
              Permian
                                                                                                                  $49         $49
                                                                                   $47           $48
                          +2,450
                          MBPD            Eagle Ford

                                              +375
                                              MBPD

                                                                                                 STACK

                                                                                                                                                          SCOOP
                                                                                  Eagle

                                                                                                                 Permian -

                                                                                                                                            Permian -
                                                                                                                              Bakken
                                                                                                                 Delaware
                                                                                  Ford

                                                                                                                                             Midland
                                                                  Source: Goldman Sachs

Source: MPC                                                                                                                                                       19
The Global Crude Slate is Lightening

U.S. production will continue to shift global crude supply lighter. If Venezuelan
production does not recover, heavy crude supplies could be tighter.

          4                                                                   Crude Production Changes1
                                                                                    (2019 To 2030)
          3

          2                                                                                   L = Light
                                                                                              M = Medium
 MMBPD

          1                                                                                   H = Heavy

          0
                 L       M       M       M       H       M       M        L      H        L          M     M   M   H   L   L   H   L
         -1                                                                                                                            M   H
                                                                                                                                               M
         -2

Source: MPC. 1Changes are cumulative, and chart excludes changes of less than 150 MBPD.                                                            20
Infrastructure Constraints Driving Wider Differentials

Growing U.S. production and limited takeaway infrastructure has driven wider differentials
across many markets. Regional production forecasts imply continued market dislocations,
sustainably higher differentials, and ongoing opportunities for advantaged crude.

 WCS: limited new takeaway capacity until                                            $20
    Keystone XL or Trans Mountain Expansion

                                                               Differential ($/bbl)
                                                                                      $15
 WTI:              continued   U.S.   production,   ramping
    syncrude post outage, high fall inland refining                                   $10
    turnarounds and new inflow/outflow pipes
                                                                                       $5
 Midland: limited refining ability to absorb
    incremental light crude oil production; exports                                    $0
    needed to balance market                                                                ’15 -17 2018     ’15 -17 2018   ’15 -17 2018
                                                                                              Avg.   YTD       Avg.  YTD      Avg.   YTD
                                                                                               Midland-WTI       WCS-WTI       Brent-WTI
Source: Bloomberg                                                                                                                          21
Cushing Overview
                                                                    From
                                 From Bakken &                     Canada                        Flanagan
                                                                                                                     Chicago
                                 Guernsey, WY                                            Spearhead &
                                                                                      Flanagan South
                                                              Keystone
                                 Pony Express
                                                                                                           BP1

                   From
              Weld County, CO
                                                                                                            Wood River

                          White Cliffs &
                      Saddlehorn-Grand                                                       Ozark
                                  Mesa
                                                                                                                               Cushing Working
                                                               Cushing
                                                                                          Diamond                              Storage Capacity
                                                                                                                 Memphis

                                                                                                                                77.5 MM bbls
                                                                                 Red River
                                                 NuStar
                                          Centurion

                                                      Basin                         Longview
                                                                     Seaway
                                                                                   Keystone Marketlink
                                          Midland

              Key cities                                             Houston,
                                                                                           Beaumont,
              Local refineries                                      Texas City           Nederland, Port
              Pipeline                                                                       Arthur

Source: EIA                                                                                                                                       22
Transportation Costs Vary By Region and Mode

Our integrated business model creates opportunities to access the most cost-advantaged
feedstocks and premium product markets, driving sustainable results.
                                                               Hardisty
                                              Pacific
                                             Northwest

                                                                              Bakken

                                                                                                                  U.S. East Coast

                                                                                                         Patoka
                               U.S. West Coast
                                                                          Cushing                                 $3.35/bbl on Jones Act
                                                                                            $11.30/bbl

                                                                          $2.75-$3.50/bbl
                                Pipeline
                                Rail Rate*                                                          St. James
                                Ship
                                                                               Houston
                                                                                                                                Asia: $2.40/bbl
                 *Does not include load/unload or railcar lease costs                                                           Europe: $1.20/bbl

Source: Argus Petroleum Transportation North America                                                                                                23
IMO 2020: Changing Sulfur Content Regulations
                                                                             8
International Maritime Organization (IMO) has proposed
to lower the amount of sulfur content in marine fuel
from 3.5% to 0.5%, effective January 2020.                                   6

Key Questions:
      - Distillate Demand: incremental demand?                               4

                                                                     MMBPD
      - Residual Fuel: price pressure? new end markets?
      - Shipping Industry Reactions: purchase compliant fuel,                2
          invest in scrubbers, switch to fuel substitutes
      - Refining Industry Reactions: switch to light crude slates,
          adjust refining processes, invest in upgrading capacity            0
                                                                                 Total HSFO      Global     Bunker Fuel   Sell-Side
      - Duration: timeframe of impact? sustainability?                             Market     Consumption     Market     Estimated
                                                                                               of Marine                  Range on
      - Compliance levels: enforcement? non-compliance?                                       Shipping Fuel             Market Impact

Source: IEA                                                                                                                        24
Global Opportunity for Complex Refineries

                     U.S. refiners are structurally advantaged relative to their global peers given limited bunker fuel
                     production, complex refining assets, significant upgrading capacity, and ability to flex yields –
                     and therefore are poised to take advantage of any market disruptions.

                                  20%
                                               Residual Fuel Oil Production                                                                                                        Coking + Hydrotreating
                                                                                                                                                                                   as % of CDU (Top 20)1
RFO Production as % of Total RP

                                                                                                                                 30%

                                  15%
                                                                                                                                 20%
         Production

                                        World Average 8.1%
                                  10%                                                                                            10%

                                  5%                                                                                              0%

                                                                                                                                         USA

                                                                                                                                                                                                                               Greece

                                                                                                                                                                                                                                                                                Turkey
                                                                                                                                                                                                                     Germany

                                                                                                                                                                                                                                                                                                      Venezuela

                                                                                                                                                                                                                                                                                                                                 France
                                                                                                                                                                                                                                                        Canada

                                                                                                                                                                                                                                                                                                                  Qatar
                                                                                                                                                                  Argentina
                                                                                                                                                                              United Kingdom

                                                                                                                                                                                                                                                Egypt

                                                                                                                                                                                                                                                                                                                          Iraq
                                                                                                                                               Mexico
                                                                                                                                                        Romania

                                                                                                                                                                                               Netherlands
                                                                                                                                                                                                             Spain

                                                                                                                                                                                                                                        China

                                                                                                                                                                                                                                                                 South Africa

                                                                                                                                                                                                                                                                                         Kazakhstan

                                                                                                                                                                                                                                                                                                                                          Malaysia
                                  0%
                                        U.S.      Asia        Europe           South           Middle       CIS (FSU)
                                                 Pacific                      America           East

             Sources: Joint Oil Data Initiative (JODI), O&GJ - PennWell Knowledge Center. 1Top 20 with at least 250 MBPD of total crude distillation capacity.                                                                                                                                                                            25
Pro Forma MPC Well-Positioned Among U.S.
Refiners
Pro forma MPC is positioned to produce compliant                                                                                Coking + Hydrocracking Capacity
fuels and benefit from the adoption of the IMO low                                                              800
sulfur fuels requirements. Current investments:
                                                                                                                700

        – Garyville diesel maximization: completed 1Q18                                                         600

        – STAR Program: phased completion est. 2016-2022                                                        500

                                                                                                         MBPD
                                                                                                                400
        – Garyville coker expansion: completion est. 2020
                                                                                                                300
        – LARIC Feedstock Upgrade1: completion est. 2H18
                                                                                                                200

Investments are estimated to contribute 30 MBPD                                                                 100
of resid destruction + 70 MBPD of distillate
                                                                                                                   0
production at MPC and 30-40 MBPD gasoline and                                                                           PF MPC          VLO         PSX          CVX         XOM        PBF   BP
distillate yield flexibility at ANDV.                                                                                                         Hydrocracking                Coking

Source: O&GJ - PennWell Knowledge Center; includes distillate, gas oil, and resid hydrocracking. 1Los Angeles Refining Integration & Compliance project previously announced by ANDV.              26
IMO 2020 Market Perspectives Are Optimistic

                                                               Benny Wong – Morgan Stanley
                                                                      May 15, 2018

Source: Sell-Side Equity Research (firm, dates listed above)                                 27
Midstream Opportunities
Macro Infrastructure Backdrop Positive

        Strong production growth in crude, natural gas liquids, and natural gas has been
        resilient to lower commodity prices given low break-even economics and continued
        improving efficiencies -- additional infrastructure will continue to be required to
        connect supply sources to global demand markets.

                  U.S. Crude Production                               U.S. NGL Production                                     U.S. Natural Gas Production
        11                                                5                                                           90

        10                                                                                                            85
                                                          4
        9                                                                                                             80

                                                                                                               Bcfd
MMBPD

                                                  MMBPD

        8                                                                                                             75
                                                          3
        7                                                                                                             70

        6                                                 2                                                           65
             2012 2013 2014 2015 2016 2017 2018               2012   2013   2014   2015   2016   2017   2018               2012 2013 2014 2015 2016 2017 2018
    Source: EIA                                                                                                                                             29
Our Assets Positioned in Fastest Growth Basins

   U.S. gas production growth is concentrated in Marcellus and Permian. Growth
   in the number of rigs is not uniform, as 50% of rigs and 40% of DUCs are located in
   the Permian. Increases in drilling efficiency (e.g. longer laterals, improved fracturing
   proppants, multi-well pads) have driven increased production despite fewer rigs.

                          U.S. Oil Drilling Rigs                                     U.S. Gas Drilling Rigs
1,600
                                                                 800
1,200
                                                                 600

 800
                                                                 400

 400                                                             200

    0                                                             0
        2012      2013   2014    2015     2016     2017   2018         2012   2013   2014    2015    2016     2017   2018
 Source: Baker Hughes                                                                                                       30
Volume Growth Varies Across Regions

                                                                                                       U.S. Natural Gas Production
                                                                                 100
       Total 2018E-2022E U.S. Production Growth +19 Bcfd
                                                                                 80

                                                           Bcfd
                                                                                 60
                                                                                 40
                                                +11                              20
                                                Bcfd                                           2017             2018E           2019E              2020E             2021E                 2022E

                                       Marcellus / Utica                                 Rest of U.S.                Texas / New Mexico                          Marcellus / Utica

              Texas /                                                                                        Breakeven Henry Hub Gas Price
              New Mexico      v                                                                                                                                                              $3.95

                                                           Gas Price ($/MMBtu)
                     +8                                                                                                                                          $3.21         $3.28
                                                                                                                                      $3.00        $3.06
                                                                                                                          $2.93
                    Bcfd                                                          $2.65        $2.71          $2.75

                                                                                                                                                                                Pinedale

                                                                                                                                                                                              Barnett
                                                                                                                                                   Utica - Wet
                                                                                   Marcellus

                                                                                               Haynesville

                                                                                                              Marcellus

                                                                                                                          Marcellus

                                                                                                                                      - Gas (OH)

                                                                                                                                                                 Utica - Gas
                                                                                                                                                                  (PA/WV)
                                                                                                                                                    Gas (OH)
                                                                                                               - NE PA
                                                                                                 - Core

                                                                                                                           - WV

                                                                                                                                         Utica
Source: MPC                                                     Source: Goldman Sachs Research                                                                                                      31
Infrastructure Needed to Connect Supply to Demand

           Additional infrastructure will be needed to connect supply to demand. Key global
           demand drivers include: global LNG demand, increased Mexican pipeline export
           capabilities, and domestic industrial & power generation.

                   LNG Exports                                           Mexico Pipeline                                                 Industrial                                           Electric Power
                                                   +6.6                     Exports                                                                                                             Generation +2.5
       9                                                                                                                     23                                      +3.8
                                                                                                          +1.6
       8                                                           6                                                                                                                    29
       7                                                                                                                     21
                                                                                                                                                                                        28
       6
                                                                   5
       5                                                                                                                                                                                27
                                                                                                                             19
                                                            Bcfd

                                                                                                                      Bcfd

                                                                                                                                                                                 Bcfd
Bcfd

       4
       3                                                                                                                                                                                26
                                                                   4
       2                                                                                                                     17
                                                                                                                                                                                        25
       1
       0                                                           3                                                         15                                                         24
                                                                       2017

                                                                              2018E

                                                                                      2019E

                                                                                              2020E

                                                                                                      2021E

                                                                                                              2022E

                                                                                                                                  2017

                                                                                                                                                                                             2017
                                                                                                                                         2018E

                                                                                                                                                 2019E

                                                                                                                                                         2020E

                                                                                                                                                                 2021E

                                                                                                                                                                         2022E

                                                                                                                                                                                                    2018E

                                                                                                                                                                                                            2019E

                                                                                                                                                                                                                    2020E

                                                                                                                                                                                                                            2021E

                                                                                                                                                                                                                                    2022E
            2017

                   2018E

                           2019E

                                   2020E

                                           2021E

                                                    2022E

   Sources: EIA, MPC                                                                                                                                                                                                                32
NGLs Creating Processing & Fractionation Needs

   U.S. NGL production is forecasted to grow 1.9 MMBPD from 2018-2030, averaging
   6.5% annually through 2022 as the first wave of new ethane crackers comes online.
   Both processing and fractionation capacity will be needed to allow producers
   to debottleneck and realize full value of wet gas stream.

                                                           U.S. NGL Production Forecast
                            7

                            6             Forecast Range
                                          Actual
                                          MPC Forecast
                    MMBPD

                            5

                            4

                            3

                            2
                                2010   2012     2014       2016   2018E   2020E   2022E   2024E   2026E   2028E   2030E
Sources: EIA, MPC                                                                                                         33
Marketing & Retail Trends
Marketing & Retail: Adapting to Changing Dynamics

Industry consolidation will likely continue and create opportunities for our pro forma nationwide
footprint. Technology offers the ability to enhance operational efficiencies as well as combat
driving trends and changing retail dynamics.

            Fragmented Convenience Store Ownership
                                                                   Total U.S. Convenience
                                                                   Store Count = ~150,000
                Own 500+ Stores
                     17%

Own 51-500 Stores
      9%

                                                                   Own 1 Store
             Own 2-50                                                63%
              Stores
               11%

 Sources: National Association of Convenience Stores 2016 Survey                                35
Speedway Light Product and Merchandise Sales
Strong
The U.S. is entering a period of stagnant gasoline demand growth, but Speedway continues
to be a top performer in the industry. Superior locations and expanded offerings inside the
store drive foot traffic, and can be observed in merchandise sales performance.
                    300                                                      Light Product Volume
M Gal/Store/Month

                    200

                    100

                      0
                              Murphy USA                         Speedway          Couche-Tard      TA C-Stores    Casey's

                    200
                                                                             Merchandise Sales
  $M/Store/Month

                    150
                    100
                     50
                      0
                                Speedway                        Murphy USA         Couche-Tard        Casey's     TA C-Stores
        Sources: April 2017 – March 2018 data from Company Reports                                                              36
Speedway – Top-tier Performer in C-Store Space

                            40                                           EBITDA
         $M/Store/Month

                            20

                             0
                                  Speedway                    Murphy      Couche-Tard    Casey's         TA C-Stores
                                                               USA
                            100                                         Total Margin
           $M/Store/Month

                                                                                         Light Product   Merchandise
                             75                                                          Speedway LP     Speedway Merchandise
                             50
                             25
                              0
                                  Speedway                    Casey's      Couche-Tard   Murphy          TA C-Stores
                                                                                          USA
 Strong track record of performance with a focused retail management team, which creates
  significant opportunities with Andeavor combination
 Continued earnings growth from past organic investments and acquisitions
 Increased capital allocation for additional investments / growth over the long term
 Sources: April 2017 – March 2018 data from Company Reports                                                                     37
Andeavor Combination
Combination Creates a Leading Energy Company
Aligned Strategy, Focus, and Culture

                      Large scale, geographically diversified and highly integrated refining, marketing,
                            and midstream company with an initial enterprise value >$90 billion1

                                                                                                    High-quality,
                               Feedstock-                                                                                                  Two strong
                                                                                                    nationwide retail and
                               advantaged refining                                                                                         customer-focused
                                                                                                    marketing business
                               portfolio in the most                                                                                       MLPs, well-
                                                                                                    (~4,000 company
                               attractive regions                                                                                          positioned for
                                                                                                    owned/operated,
                               with over 3 MMBPD                                                                                           growth in key
                                                                                                    ~7,800 branded
                               of capacity                                                                                                 regions of the U.S.
                                                                                                    locations)

                                               Strong culture of safety and environmental stewardship,
                                                 commitment to people and supporting communities

                 Immediately EPS and                                                       ≥ $1.0 billion                   Significant incremental long-term
                   CFPS accretive2                                                    of expected synergies                        cash flow generation

                             “Must own” refining, marketing, and midstream company
1Calculation   based on April 27, 2018 closing market values. 2Based on consensus estimates at announcement.                                                     3939
Complementary Footprints Spanning the U.S.
Strong Presence Across Key Supply and Demand Centers

                                                                     MPC
                                                              MPC Refinery
                                                       Light Product Terminals
                                                              MPC-Owned and Part-Owned
                                                              Third Party

                                                       Asphalt/Heavy Oil Terminal
                                                              MPC-Owned
                                                              Third Party

                                                       Water Supplied Terminals
                                                              Inland
                                                              Coastal

                                                       Renewable Fuels
                                                              Ethanol Facility
                                                              Biodiesel Facility

                                                       Pipelines
                                                               MPC Owned and Operated
                                                              MPLX Owned and Operated
                                                              MPC Interest: Operated by MPLX
          ANDV                                                MPC Interest: Operated by Others
                                                              Pipelines Used by MPC
          ANDV Refinery
                                                              MPLX Interest Pipelines:
          Trucking                                            Operated by Others
          Rail Facility
                                                       MPLX Terminals
          Marine Terminal                                    MPLX Owned and
          Pipelines                                          Part-Owned Terminals
          Third-Party Pipelines                              Marketing/Retail Presence
          Terminal                                            Natural Gas Processing
          Natural Gas Processing                              Butane Cavern
          Marketing/Retail Presence                           Barge Dock

Source: Company filings                                                                  40
Committed to Delivering Substantial Synergies

                      Expected Synergy
  Impact Area                                                               Business Context
                          (millions)

  Cost Elimination         ~$255         ● Clearly identified cost efficiencies – allows for rapid achievement
                                         ● Over $10 billion of combined purchases per year
  Procurement              ~$150
                                         ● 1-2% improvement leads to $100-$200 million of savings
                                         ● Delivered > $200 million of synergies with Hess Retail acquisition
  Owned/Operated
                           ~$210         ● Comparable number of stores (1,100) across three platforms (multi-site operators,
  Retail
                                            Southwest retail, SuperAmerica) provides even greater opportunity
                                         ● Improved purchasing of over 1 billion barrels/year of crude oil and other feedstocks
                                           (every $0.01/bbl improvement is ~$10 million of earnings)
  Integrated System                      ● Value chain optimization (1/10 cent per gallon uplift is ~$50 million)
                           ~$165
  Optimization
                                         ● Permian and Bakken crude optimization
                                         ● Maximize throughput on owned and leased systems / assets
                                         ● Processing optimization through reciprocal application of refining expertise
  Refining                               ● Capital and maintenance efficiency improvements:
                           ~$220                 − Major capital projects
  Operations
                                                 − Turnaround work
                                                 − Routine maintenance

  Total                   ≥ $1,000
                                                                                                                                  41
Opportunity for Significant Shareholder Value Creation

            Accretion and Cash Generation                                                                               Growth and Value Creation

       Immediately                                      >$5 billion                                       Substantially enhanced                               ≥$1 billion
                                                                                                          growth platform across                           of expected synergies
                                                      of incremental cash
        accretive                                                                                           all segments, with
      to earnings and cash                          flow supports ≥15%                                       continued capital                                     Cash Flow Multiples
                                                                                                                                                            7.3x
         flow per share1                              long-term cash flow                                  investments to drive                               2019                 4.2x
                                                      accretion per share2                                   long-term growth                               6.6x                      2020
                                                                                                                                                         with synergies3         with synergies3

                         Financial Discipline                                                                                         Capital Return

                                                                                                                Expect continued                          Expect to complete 2018
                                                    Balanced approach to                                                                                    share repurchases
         Commitment to
        investment grade
                                                              // in
                                                        investment                                            strong, through-cycle
                                                                                                                 dividend growth
                                                    business and return of                                                                                  Authorized incremental
           credit profile                                                                                     in pro forma MPC of
                                                           capital                                                                                              $5 billion
                                                                                                                       ≥10%
                                                                                                                                                         share repurchase program

1Based on consensus 2019 estimates at announcement. 2≥15% accretion assumes no share repurchase activity beyond 2018. 32019 Based on consensus at announcement; 2020 based on management forecast

with expected synergies.
                                                                                                                                                                                                    42
Conclusion
Pro Forma MPC – A Leading Energy Company

          Refining                              Midstream                             Marketing

                                                                               Expanding Platform Across: Retail,
        Superior Operations                Significant Growth Opportunities        Wholesale, and Branded
Strategic Investment to Capture Value
                                           Strategic Alignment with Refining    Invest in Technology to Improve
New Technology to Optimize Assets                                                    Customer Experience
                                          Commercial Focus on Integration to
Industry Leader in Safety, Reliability,
                                                  Enhance Value                 Enhancing Margin with Non-Fuel
  and Environmental Stewardship
                                                                                           Sales

                                   Large scale, geographically-diversified,
                               highly-integrated downstream energy company
                                                                                                                    44
45
Appendix

           46
MPC EBITDA Reconciliation

                                     ($MM)                                                                           2013         2014          2015         2016          2017
                                     Segment EBITDA
                                     Refining & Marketing Segment
                                        Segment income from operations1,2                                             3,131         3,538        3,997        1,357         2,321
                                        Add: Depreciation and amortization                                              989         1,020        1,052        1,063         1,082
                                        Segment EBITDA                                                                4,120         4,558        5,049        2,420         3,403

                                     Speedway Segment
                                        Segment income from operations3                                                 375           542          673           733          729
                                        Add: Depreciation and amortization                                              112           152          254           273          275
                                        Segment EBITDA                                                                  487           694          927        1,006         1,004

                                     Midstream Segment
                                        Segment income from operations1                                                 275           342          464        1,048         1,339
                                        Add: Depreciation and amortization                                                96          102          144           605          699
                                        Segment EBITDA                                                                  371           444          608        1,653         2,038

1 On  February 1, 2018, we contributed certain refining assets and fuels distribution services to MPLX. The results of these new businesses are reported in the Midstream segment prospectively from February 1,
  2018, resulting in a net reduction to Refining & Marketing segment results and a net increase to Midstream segment results of the same amount. No effect was given to prior periods as these entities were not
  considered businesses prior to February 1, 2018.
2 Includes non-cash LCM inventory valuation charges of $345 million for 2015 and a benefit of $345 million from reversing the LCM inventory valuation reserve in 2016.
3 Full year 2015 includes non-cash LCM inventory valuation charge of $25 million. Full year 2016 includes a non-cash LCM benefit of $25 million.

                                                                                                                                                                                                                   47
Speedway EBITDA and Total Margin Reconciliation
                                   ($MM)                                                                        2Q 2017       3Q 2017      4Q 2017       1Q 2018        LTM
                                   Speedway Segment EBITDA
                                      Segment income from operations                                                  238          208          148            95          689
                                      Add: Depreciation and amortization                                               65           68            78           79          290
                                      Segment EBITDA                                                                  303          276          226           174          979

                                   Speedway total margin to Speedway income from operations
                                      Speedway income from operations                                                 238          208          148            95          689
                                      Plus (Less):
                                      Operating, selling, general and administrative expenses                         377          390          400           384        1,551
                                      Depreciation and amortization                                                    65           68            78           79          290
                                      Income from equity method investments                                          (21)          (20)         (15)          (14)         (70)
                                      Net gain on disposal of assets                                                   (6)          (2)           (2)            0         (10)
                                      Other income                                                                     (3)          (3)           (5)          (1)         (12)
                                      Speedway total margin                                                           650          641          604           543        2,438

                                   Speedway total margin:
                                      Gasoline and distillate margin1                                                 271          259          260           217        1,007
                                      Merchandise margin2                                                             371          374          337           319        1,401
                                      Other margin                                                                      8             8            7             7           30
                                      Speedway total margin                                                           650          641          604           543        2,438

1 The price paid by consumers less the cost of refined products, including transportation, consumer excise taxes and bankcard processing fees. Excludes LCM inventory valuation charge of $25 million for 2015 and
  the LCM benefit of $25 million in 2016
2 The price paid by consumers less the cost of merchandise

                                                                                                                                                                                                                     48
Committed to Delivering Substantial Synergies
 Well-defined, Achievable, Highly Accretive

                    Clearly identified and developed plan to achieve ≥$1 billion of expected synergies

                                        By Function                                                                                                 By Impact Area
                                             ($ millions)                                                                                                 ($ millions)
                                                                                                                                                                                               ≥$1,000
                                                                                                                                                                          $950
                                                                                        ≥$1,000
                                                                            $195
                                                                                                                                                  $710
                                                              $150
                                                 $95
                                                                                                                         $480
                   $210           $55

     $295

   Refining &       Retail       Logistics      Supply &    Procurement    Corporate        Total                        Year 1               Year 2                      Year 3            Run-Rate
   Marketing                                    Trading                                                                      Cost Elimination                               Procurement
                                                                                                                             Owned/Operated Retail                          Integrated System Optimization
                                                                                                                             Refining Operations

Note: Synergies-related costs or expenses include approximately $300 million of one-time expenses expected in the first two years following the merger and any incremental capital spending necessary to
      achieve some of the synergies, the total of which is expected to be immaterial relative to the projected capital spending of the combined business over the first five years.
                                                                                                                                                                                                           4949
MPC and Andeavor Strategic Evolutions
Track Record of Integrating Businesses and Driving Shareholder Value

$80                                      Acquired
                                      Galveston Bay
                                       refinery and
$60                                     integrated
                                      midstream and      Acquired former Hess
                                     marketing assets        retail assets
                    Formed MLP
$40
                                                                                         Acquired MarkWest                          MPC completes
$20                                                                                       Energy Partners                           Strategic Actions

 $0
        ’11          2012                 2013                2014                         2015                2016             2017                ’18
$125                                                                                                                            Acquired
                                                                                                                                Western
                                 Acquisition of Carson
                                 refinery, ARCO, and                                                                            Refining
$100                                 ampm master
                                   franchise license

 $75                                                                                        Acquired                                        MLP Merger
                                                                                         Great Northern                                    (TLLP/WNRL)
       Formed MLP                                                                                                Acquired
                                                                                         Midstream LLC
 $50                                                                 Acquired            (Williston Basin
                                                                                                              Dickinson, ND
                                                                                                               refinery and     Becomes
                                                                  QEP Midstream         logistics assets)       associated      Andeavor
 $25                                                             and Field Services
                                                             (later merged with TLLP)
                                                                                                             logistics assets

 $0
        ’11          2012                 2013                2014                         2015                2016             2017                ’18
                                                                                                                                                          5050
MPC Track Record of Executing and Integrating
Large Transactions

                                            Galveston Bay Achievements (since acquisition)
     Improved Environmental and                        Advanced Operational Excellence                       Lowered Operating Costs
         Safety Performance                            33 monthly process-unit rate records in         Reduced total cash operating expenses
   80% reduction in environmental incidents            2017 alone                                       over 20%
   Average yearly process safety incidents            Unplanned downtime cut by 50%                   Reduced fixed operating, turnaround and
    reduced by 50%                                                                                       routine maintenance costs

                                              Speedway Successful Hess Retail Integration
   Increased footprint by 13 states and more than 1,200 stores in              ~80% of acquired stores upgraded under remodel plan
    2014
                                                                                Exceeded synergy guidance every year since acquisition in 2014;
   Planned investments for system-wide remodels achieved under                  $210 million realized by 2017 vs. guidance of $190 million at
    budget, with higher returns, and ahead of schedule                           announcement

                                         MPLX’s Strategic Transformation (over past 5 years)
   Expansion into midstream natural gas business with MarkWest                 Completed dropdowns projected to generate ~$1.4 billion in
    merger in 2015                                                               annual EBITDA
   Largest processor and fractionator in the Marcellus/Utica with a            Exchanged GP economic interests, including IDRs, for LP units
    growing presence in Permian and STACK

                                                                                                                                                   51
Diversified Large-Scale U.S. Refining Portfolio
Sixteen Refineries with Over 3 Million BPD of Throughput Capacity

   Diversification across attractive PADDs                                        U.S. Refining Capacity1 (MBPD)
   Incremental access to advantaged feedstock supply      3,038
   Scale to deliver best-in-class operating capability
                                                                                                                                         PADD 5
                                                                       2,625
   Opportunity to capture substantial system synergies                                                                                  PADD 4
   Well-positioned to expand market presence                                                                                            PADD 3
                                                                                                                                         PADD 2
                   Pro Forma Refining Locations
                                                                                    1,881         1,867                                  PADD 1
                                                                                                               1,726

                                                                                                                          1,157
                                                                                                                                   919      890

                                                          Pro Forma     Valero        MPC       Phillips 66 ExxonMobil Andeavor   Chevron   Shell
                                                             MPC

                                                          Source: Company filings
                                                          1 Crude capacity; excludes refining capacity outside the U.S.                        5252
Geographic Diversification Increases Exposure to
Attractive Margins

                                                            Annual Refining Margins by Region ($/BBL)
 Andeavor’s California, Pacific   $30
  Northwest, and Mid-Con
  refineries add geographic        $25

  diversity to MPC’s existing
                                   $20
  refining earnings
                                   $15
 Attractive West Coast market
  dynamics
                                   $10

                                   $5
                                              2011          2012         2013          2014          2015         2016           2017

                                                       Midwest                       Gulf Coast                       West Coast

                                   Source: Bloomberg; US Midwest WTI 3-2-1 (87 Regular), US Gulf Coast LLS 3-2-1 (87 Regular),
                                           US West Coast ANS 3-2-1 (LA 85.5 CARBOB)                                                     53
Pro Forma Capital Structure

      Increased size, scale and diversity supports                                                      >$5 billion incremental cash flow expected in first five years
       commitment to investment grade credit profile
                                                                                                         Implicit leverage reduction via earnings growth even
      Equity-weighted acquisition funding mix (85/15) and                                                prior to synergy achievement
       consolidated earnings profile provides significant
                                                                                                         MPC expects to complete 2018 share repurchases
       financial flexibility
                                                                                                         Incremental $5 billion share repurchase authorization
      Committed to maintaining significant core liquidity;
                                                                                                          provides for additional capital return flexibility
       will target ~$8.5 billion

                                  Parent Debt/EBITDA1                                                                                Consolidated Debt/EBITDA

           1.8x                         1.9x                                                                         2.7x          2.6x          2.7x
                                                      1.6x                                                                  2.4x
                  1.5x   1.5x
                                                                    1.2x                                                                                       1.7x           1.6x          1.4x
                                                                                  0.9x

             ‘18 ‘19      ‘18           ‘18            ’18           ’18           ’18                                ‘18 ‘19       ‘18           ‘18            ‘18           ‘18           ‘18
           PF MPC 2         MPC          ANDV            PSX           VLO           HFC                             PF MPC 2        MPC           ANDV           PSX           HFC            VLO
Ratings:      TBD        BBB/Baa2 BBB-/Baa3 BBB+/A3 BBB/Baa2 BBB-/Baa3                                 Ratings:         TBD        BBB/Baa2 BBB-/Baa3 BBB+/A3 BBB-/Baa3 BBB/Baa2

      Note: Projections reflect FactSet consensus and sell-side research estimates as of 4/20/18. PF MPC adjusted for transaction-related items. Turnaround costs are expensed for both companies.
      1Parent excludes MLP’s debt and EBITDA 2Pro forma leverage reflects 85% stock/15% cash consideration and excludes one-time costs to achieve synergies.                                         5454
MPC and ANDV Mexico Opportunities
Desirable Supply Position into Mexico with Direct Supply from the East and West

MPC
 Bulk supplier via waterborne cargoes
  from Garyville and Galveston Bay
 Rail supply potential from Houston area
Andeavor
 Winner of PEMEX open season in
  northwest Mexico – physical shipper on
  logistics assets
 Delivery into Mexico and distribution to
  local jobbers
 Provides enhanced direct Mexico
  market insights
Pro Forma
                                             MPC Refinery
 Evaluate long-term trends and              ANDV Refinery
  participate in industry build-out          Current ANDV Operations
 System optimization opportunities          Projected ANDV Growth Regions
                                             Rail Facility

                                                                                  55
Pro Forma MPC Permian – Expanded Opportunities

 Accelerates MPC’s entry into Permian                                                          To Cushing/Ozark
                                                                                                 (MPC Midwest
  with attractive assets                                                                            refining)

 Andeavor crude oil gathering and
  marketing aligns naturally with MPC’s
  crude needs at Galveston Bay
 Allows for full crude oil integration –
                                                                                                     Galveston
  wellhead gathering to refinery supply                                                                 Bay

 Other enhanced growth opportunities:                MPC Refinery
                                                      ANDV Refinery                                               Increase
      – Long-haul pipeline opportunities                                                                         Exports via
                                                      ANDX Pipeline                                                 MPLX
      – Potential to build out MPLX Texas City tank   ANDV Pipeline

        farm and dock facility for crude exports      Gray Oak Pipeline
                                                      Third-Party Pipeline
                                                      Receipt Point/Station
                                                      MPC or MPLX pipeline equity (potential)
                                                      MPLX G&P Complex

 Source: Company filings                                                                                                       56
Integrates Bakken Crude System with
MPC Refining Demand
      MT       ND                                                                           Crude gathering and marketing aligns with
                                                                                             MPC demand in Midwest

                       DAPL & Enbridge
                                                       Robinson Lake
                                                                                Minot
                                                                                            Gain ability to aggregate DAPL supply on
                         Connections
                                                       Gathering & Processing
                                                                                             gathering and related assets
                                                                                                     Williston Basin – Bakken Shale
                                           DAPL
                                         Connection                 DAPL to MPC                                               North
                                                                  Midwest Refineries                                          Dakota
                                                                   (via Patoka, IL)
To Guernsey, WY

                                                                                                                     South             DAPL
                                                                                                                     Dakota

                                                                                               ANDV Refinery
                                         Belfield Gathering & Processing                       ANDX Gas Processing
                                             Dickinson Refinery                                ANDX Crude Oil Pipelines
              Fryburg Rail Terminal                                   To Mandan Refinery
                                                                                               ANDX Gas Pipelines                             Patoka, IL
                                                                                               ANDX Crude, Gas & Water Pipelines
                                                                                               ANDV Pipeline
                                                                                               ANDX Bakken Storage Hub
 Source: Company filings
                                                                                                                                                      5757
Second-Quarter 2018
     Earnings
Opening Comments

 Reported record operational performance and outstanding financial results
 $1.1 billion of capital returned to shareholders, including $885 million of share repurchases
 Continued optimistic outlook for our business as global demand remains strong, crude
  differentials appear wider in many markets, and low sulfur fuel market dynamics change
 Andeavor Combination: multiple milestones achieved and on-track for closing in the
  second half of 2018
   – Creates premier nationwide integrated downstream energy company
   – Tremendous benefits to combination including at least $1 billion of tangible annual
     gross run-rate synergies expected
   – Becomes a “must own” refining, marketing and midstream company

                                                                                                  59
Second-Quarter Highlights

 Reported second-quarter earnings of $1.06 billion, or $2.27 per diluted share, and income
  from operations of $1.71 billion
   – Refining & Marketing: segment income from operations of $1.03 billion, supported by
     record crude throughput volumes

   – Midstream: segment income from operations of $617 million achieving record gathered,
     processed and fractionated volumes as well as record pipeline throughputs

   – Speedway: segment income from operations of $159 million as gasoline and distillate
     margins were adversely impacted by the overall rise in crude oil prices

                                                                                              60
Second-Quarter 2018 Earnings

                                                                                                                                        2Q 2018                         2Q 2017
                                                           Earnings*                                                                $1,055 MM                            $483 MM
                                                           Earnings per Diluted Share*                                                           $2.27                           $0.93

                                                                 Earnings*                                                                                         Earnings per Diluted Share*
                                                                                             $1,092
                                                                                                                                             3
                1,000                                                                                                                                                                                              $2.31

                                                                                                                                             2

                                                                                                                                   $/Share
        $MM

                                                 $513                                          1,055                                                                                                                2.27
                   500                                                                                                                                                $0.98
                                                                                                                                             1
                                                   483
                                                                                                                   37                                                  0.93
                                                                     30                                                                                                                  0.06                                         0.08
                        0                                                                                                                    0
                                               2017                                          2018                                                                   2017                                          2018
                                                                                                                           1Q                2Q
*Earnings refer to Net Income attributable to MPC. Earnings also include pretax benefits/(charges) of $1 MM and ($67) MM in 2Q 2018 and 2Q 2017 respectively, related to items not allocated to segment results including litigation and impairment.

                                                                                                                                                                                                                                                       61
Earnings*
  2Q 2018 vs. 2Q 2017 Variance Analysis

  1,400
                                                                                                                                     60
  1,200                                                                                                  285
                                                                                                                                                              (37)                       (31)                                               1,055
  1,000                                              463                                                                                                                                                            (89)

      800                                                                      (79)
$MM

      600
                          483
      400

      200

           0
                        2Q 2017                 Refining &                 Speedway                  Midstream**                Items not                Interest and                   Income               Noncontrolling                 2Q 2018
                                                Marketing**                                                                    Allocated to            Other Financing                   Taxes                 Interests
                                                                                                                                Segments                    Costs
 *Earnings refer to Net Income attributable to MPC.
 **Results related to the Feb 1, 2018 dropdown of refining logistics and fuels distribution to MPLX, which totaled $232 MM for the quarter, are presented in the Midstream segment prospectively. Prior period information has not been recasted to reflect
   these businesses being reported in the Midstream segment.

                                                                                                                                                                                                                                                              62
Refining & Marketing Segment Income
  2Q 2018 vs. 2Q 2017 Variance Analysis
    1,600
                                                                                                                         48                                                                    76
    1,400                                                                                       180                                                                     56
    1,200                                                               320                                                                   (75)
                                                                                                                                                                                                                                         1,025
    1,000
                                                  243
                                                                                                                                                                 Crude      173
                                                                                                                                                                                                                  (385)
$MM

                                                                                                                                                                 Volumetric 102
        800                                                                                                                                                      Product (219)

        600                562

        400

        200

             0
                        2Q 2017                   *LLS                **Sweet/               **LLS/WTI               **LLS                  **Market                 Other                ***Direct               ***Other               2Q 2018
                                                 6-3-2-1              Sour Diff.                Diff.                Prompt                 Structure                Margin               Operating
                                                  Crack                                                                vs.                                                                  Costs
                                                                                                                    Delivered
 *Represents ex-RIN/CBOB adjusted crack spread, which incorporates the market cost of Renewable Identification Numbers (RINs) for attributable products and the difference between 87 Octane Gasoline and 84 Octane CBOB Gasoline. Based
  on market indicators using actual volumes.
 **Based on market indicators using actual volumes.
 ***Second quarter results reflected a $232 MM reduction associated with the refining logistics and fuels distribution business that were dropped to MPLX on Feb. 1, 2018. Prior period segment results were not recasted to reflect these businesses
    being reported in the Midstream segment. Other R&M for the quarter reflected $340 MM of expense with an offsetting reduction to direct operating costs of $108 MM.

                                                                                                                                                                                                                                                        63
Speedway Segment Income
 2Q 2018 vs. 2Q 2017 Variance Analysis

      250                     238

      200                                                     (32)                 (5)
                                                                                                (24)                               159
                                                                                                              (8)
      150                                                                                                                 (10)
$MM

      100

        50

           0
                           2Q 2017                      Light Product           Merchandise   Operating   Depreciation   Other*   2Q 2018
                                                           Margin                 Margin      Expense

 *Reflects the absence of a $6 MM gain related to asset sales in the 2Q 2017.

                                                                                                                                            64
Midstream Segment Income
  2Q 2018 vs. 2Q 2017 Variance Analysis
         700                                                                                            328
                                                                                                                                                                                                                             617
         600                                                                                                                                                      (43)

         500

         400
$MM

                                            332
         300

         200

         100

               0
                                            2Q 2017                                                    MPLX*,**                               MPC Retained Equity and Other                                               2Q 2018
                                                                                                                                                       Affiliates**
  *Results related to refining logistics and fuels distribution dropdown into MPLX, which totaled $232 MM for the quarter, are presented in the Midstream segment prospectively from Feb. 1, 2018. Prior period information does not reflect the results of
   these new businesses.
  **In the 2Q 2018 results, MPLX includes approximately $25 MM of equity method income that prior to Sept. 1, 2017 would have been included in the MPC Retained Equity and Other Affiliates column.

                                                                                                                                                                                                                                                              65
Total Consolidated Cash Flow
 2Q 2018

       8,000
                                                            544
       7,000                                    1,842                  (6)
       6,000                                                                      (788)
                                                                                                                                 45      4,999
       5,000              4,653
                                                                                                (1,096)
                                                                                                                  (195)
$MM

       4,000

       3,000

       2,000

       1,000

              0
                         3/31/2018             Operating   Working   Net Debt   Cash Capital     Return of   Net Distributions   Other   6/30/2018
                           Cash                Cash Flow   Capital              Expenditures     Capital to          to                    Cash
                          Balance               before                              and        Shareholders* Noncontrolling               Balance
                                                Working                         Investments                      Interests
                                                Capital
 *$211 MM dividends plus $885 MM share repurchases
 Note: Excludes restricted cash

                                                                                                                                                     66
Capitalization and Select Cash-Flow Data

                                                                                                                  MPC               MPLX              MPC
    As of June 30, 2018                                                                                                                             Excluding
                                                                                                               Consolidated   Adjustments(a)          MPLX
    ($MM except ratio data)
    Debt                                                                                                          17,267        11,875               5,392
    Mezzanine equity                                                                                               1,003            1,003                -
    Equity                                                                                                        18,818            8,366           10,452
    Total capitalization                                                                                          37,088        21,244              15,844
    Debt-to-capital ratio (book)                                                                                    47%                 -             34%
    Cash and cash equivalents                                                                                      4,999               3             4,996
    Debt to LTM Adjusted                     EBITDA(b)                                                              2.6x                -             1.2x
    Debt to LTM Adjusted EBITDA, w/MPLX LP distributions(b)                                                         N/A                 -             1.0x
                                                                                                                    2Q         1Q            4Q          3Q

    For the Quarter:
    Cash provided by (used in) operations                                                                          2,386      (137)         2,745       1,906
    Cash provided by operations before changes in working capital(c)                                               1,842      796           1,424       1,586
    (a)Adjustments   made to exclude MPLX debt (all non-recourse) and the public portion of MPLX equity
    (b)Calculated   using face value of total debt and adjusted EBITDA. Refer to appendix for reconciliation
    (c)Non-GAAP.     Refer to appendix for reconciliation

                                                                                                                                                                67
3Q 2018 Outlook

                                                          Other                                                                                                                                                       Total               Corporate
                                                                                                    Percent of          Sour Crude Oil Turnaround                     Depreciation             Other
                                     Crude               Charge/                Total                                                                                                                                Direct               and Other
                                                                                                    WTI-priced           Throughput     and Major                         and               Manufacturing
                                  Throughput*          Feedstocks            Throughput*                                                                                                                            Operating            Unallocated
                                                                                                      Crude              Percentage    Maintenance                    Amortization             Cost**
                                                       Throughput*                                                                                                                                                   Costs                 Items***

                                                         in MBPD                                                                                Refinery Direct Operating Costs ($/BBL of total throughput)

                      GC Region      1,100                   200                  1,300                  19%                   64%                  $0.80                  $1.00                 $3.50                 $5.30
Projected
            3Q 2018

                      MW Region       650                     50                   700                   53%                   34%                  $3.75                  $1.80                 $4.10                 $9.65
                      MPC Total      1,750                   200                  1,950                  32%                   53%                  $1.90                  $1.30                 $3.80                 $7.00              $85 MM****
                      GC Region      1,123                   217                  1,340                  14%                   69%                  $0.90                  $1.05                 $3.52                 $5.47
    3Q 2017

                      MW Region       722                     35                   757                   38%                   38%                  $1.60                  $1.72                 $3.96                 $7.28
                      MPC Total      1,845                   172                  2,017                  23%                   57%                  $1.20                  $1.34                 $3.83                 $6.37                $85 MM

    *Region throughput data includes inter-refinery transfers, but MPC totals exclude transfers
    **Includes utilities, labor, routine maintenance and other operating costs
    ***We adopted Accounting Standards Update 2017-07, Retirement Benefits Presentation of Pension and Postretirement Cost, as of Jan. 1, 2018, and applied the standard retrospectively. As a result, we reclassified prior period amounts from
       Selling, General and Administrative expenses to Net Interest and Other Financial Costs to conform to current period presentation. Excludes impairment gains reported 3Q 2017.
    ****Excludes transaction costs related to the pending merger with Andeavor

                                                                                                                                                                                                                                                       68
MPLX - Second-Quarter 2018
         Earnings
MPLX - Second-Quarter Highlights

 Reported adjusted EBITDA of $867 million and distributable cash flow of $695 million
  which provided 1.36x distribution coverage and resulted in 3.7x leverage

 Adjusted EBITDA increased 83% year-over-year, 23% year-over-year excluding the
  impact from dropdowns

 Record volumes across our G&P and L&S segments

 Declared 22nd consecutive quarterly distribution increase to $0.6275 per common unit
  for the second-quarter 2018

 Announced several new Permian infrastructure investments

                                                                                         70
MPLX - Logistics & Storage Segment

 Reported 2Q adj. EBITDA of $526 million,
  which increased 32% year-over-year after
  adjusting for the impact of dropdowns
                                                    Headquarters

 Pipeline throughputs averaged 3.39 MMBDP,         MPLX Pipelines:
                                                    Owned & Operated

  ~10% increase over 2Q 2017                        MPLX Interest Pipelines:
                                                    Operated by Others

                                                    MPLX Operated Pipelines:
                                                    Owned by Others

 Completed major expansion work on Ozark           MPLX Refining
                                                    Logistics Assets

  and Wood River-to-Patoka pipeline systems         MPLX Terminals:
                                                    Owned and Part-owned

                                                    Barge Dock

   – Current capacity 345 MBPD, expected to         Cavern

     increase to 360 MBPD by end of third quarter
                                                    MPC Refineries

 Expanded marine fleet by 12 barges
                                                                               As of March 31, 2018

                                                                                                      71
MPLX - Gathering & Processing Segment

 Reported 2Q adj. EBITDA of $341 million, which increased 18% year-over-year

 5 processing plants (Sherwood 9, Houston 1, Argo, Omega, Majorsville 7) brought
  online year-to-date and 3 additional plants by year-end

 Total processing system capacity is now 8.7 Bcf/d

 Announced multiple new projects across both the Marcellus/Utica and the Permian

                                                                                    72
MPLX - Gathering & Processing Segment
  Marcellus & Utica Operations
                                                                                    Processed Volumes(a)
 Gathered volumes averaged 2.8 Bcf/d,
                                                                                          Capacity at                                           Utilization of
  ~46% increase over 2Q 2017                                                                End of
                                                                                                                          Average
                                                                                                                                                 Available
                                                           Area                                                            Volume
                                                                                            Quarter                                               Capacity
 Processed volumes averaged 5.2 Bcf/d,                                                    (MMcf/d)
                                                                                                                          (MMcf/d)
                                                                                                                                                     (%)(b)
  ~10% increase over 2Q 2017
                                              Marcellus                                       4,920                         4,286                   87%
 Commenced operations of 200 MMcf/d               Houston                                      720                           562                   78%
  Majorsville 7 plant in July                      Majorsville                                 1,070                          987                   92%
                                                   Mobley                                       920                           712                   77%
 Expect to add 600 MMcf/d of incremental          Sherwood                                    1,800                        1,664                   92%
  processing capacity by end of 2018               Bluestone                                    410                           361                   88%
  which would take total regional capacity    Utica                                           1,325                          876                    66%
  to slightly over 7 Bcf/d                         Cadiz                                        525                           485                   92%
                                                   Seneca                                       800                           391                   49%
                                              2Q 2018 Total                                   6,245                         5,162                   83%
                                              1Q 2018 Total                                   6,245                         5,050                   83%
                                             (a)Includes amounts related to unconsolidated equity method investments on a 100% basis
                                             (b)Based on weighted average number of days plant(s) in service. Excludes periods of maintenance

                                                                                                                                                                 73
MPLX - Gathering & Processing Segment
 Marcellus & Utica Fractionation

                                                                       Fractionated Volumes(a)
 Achieved 2Q 2018 fractionated                                              Capacity at                                 Utilization of
                                                                                                      Average
  volumes of ~407 MBPD                                  Area
                                                                               End of
                                                                                                      Volume
                                                                                                                          Available
                                                                               Quarter                                     Capacity
                                                                                                      (MBPD)
 Achieved ~16% growth in quarterly                                           (MBPD)(b)                                       (%)(c)

  fractionated volumes over 2Q 2017          2Q18 Total C3+                       287                    231                   80%

 Expect to add 100 MBPD of new             2Q18 Total C2                         244                    176                   72%
  fractionation capacity by end of 2018
                                            1Q18 Total C3+                        287                    219                   76%
  across the Sherwood, Harmon Creek,
  and Hopedale complexes                    1Q18 Total C2                         244                    176                   72%
                                          (a)Includesamounts related to unconsolidated equity method investments on a 100% basis
                                          (b)Excludes Cibus Ranch condensate facility
                                          (c)Based on weighted average number of days plant(s) in service. Excludes periods of maintenance

                                                                                                                                             74
MPLX - Gathering & Processing Segment
  Southwest Operations
                                                                                       Processed Volumes(a)
 Gathered volumes averaged 1.5 Bcf/d,
  ~6% increase over 2Q 2017                                                                 Capacity at
                                                                                                                         Average
                                                                                                                                                 Utilization of
                                                                                              End of                                              Available
                                                                 Area                                                     Volume
 Processed volumes averaged 1.4 Bcf/d,                                                       Quarter
                                                                                                                         (MMcf/d)
                                                                                                                                                   Capacity
  ~8% increase over 2Q 2017                                                                  (MMcf/d)                                                 (%)(b)

 Commenced operations of 75 MMcf/d                West Texas(c)                                  400                        275                        69%
  Omega plant in Western Oklahoma                  East Texas                                     600                        396                        66%
  (STACK) in July                                  Western OK                                     425                        405                        95%
 Executing Permian growth strategy
                                                   Southeast OK(d)                                253                        253                       100%
   – 200 MMcf/d Argo plant in Delaware Basin
                                                   Gulf Coast                                     142                        105                        74%
     continued ramping up operations
                                                   2Q 2018 Total(d)                             1,820                      1,434                        79%
   – Acquired equity interest in Agua Blanca gas
     pipeline                                      1Q 2018 Total(d)                             1,784                      1,325                        77%
                                                   (a)Includes amounts related to unconsolidated equity method investments on a 100% basis
   – Constructing new 200 MMcf/d processing        (b)Based  on weighted average number of days plant(s) in service. Excludes periods of maintenance
                                                   (c)West Texas is composed of the Hidalgo plant in the Delaware Basin

     plant in Delaware Basin called Torñado        (d)Includes Centrahoma volumes sent to third parties. Processing capacity and utilization based on the higher of the

                                                      partnership’s portion of Centrahoma JV or the average volume processed

                                                                                                                                                                      75
You can also read