SOCIAL SECURITY WORKS FOR HAWAII - WWW.SOCIALSECURITYWORKS.ORG
←
→
Page content transcription
If your browser does not render page correctly, please read the page content below

Social Security Works
      for HAWAII

www.socialsecurityworks.org   2014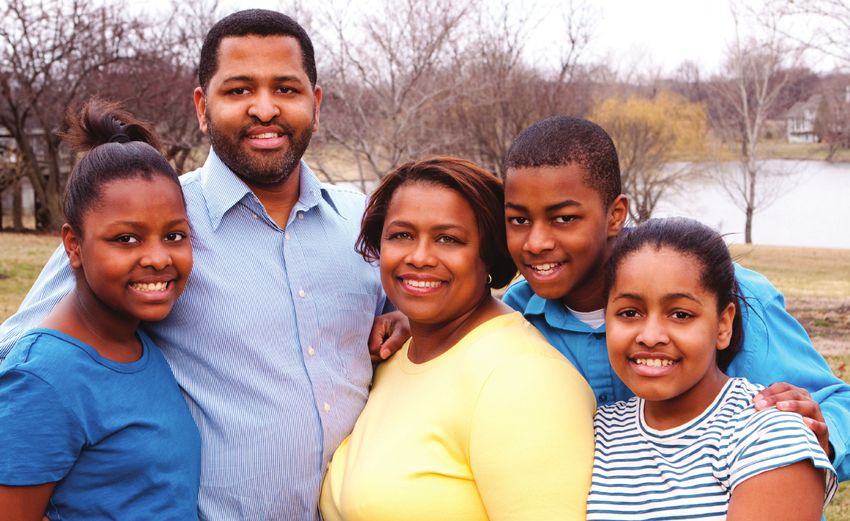
Our Social Security Works for America series of reports is written for public officials, members of the press, advocates, educators and other
   concerned citizens. In addition to providing information about Social Security’s history, character and vitality, as well as compelling, real-life
   stories, each report includes statistics about the number of people who receive benefits, the types of benefits they receive and the total
   amount of funds flowing from these programs into every state, its congressional districts and counties. Reports are available online for all
   50 states, Washington D.C., Puerto Rico, American Samoa, Guam, the Northern Mariana Islands and the U.S. Virgin Islands. A summary
   report, “Social Security Works for the United States,” is also available.

   Please note that a one-page fact sheet summarizing the data in this report can be found at the end of the report, directly following the endnotes.

   For congressional district-level Social Security data, please see “Appendix 1: Social Security Works for Hawaii’s Congressional Districts,”
   toward the back of the report, just before the endnotes.

   For county-level Social Security and demographic data, please see “Appendix 2: Social Security Works for Hawaii’s Counties,” toward
   the back of the report, just before the endnotes.

ACKNOWLEDGMENTS
Like our Social Security system, this report is the product of the foresight and hard work of many people. Social Security Works partnered
closely with the Alliance for Retired Americans, which is coordinating the release of this report in Hawaii.

Many people shared in writing, designing and producing this, our fifth set of state reports. We are especially grateful to Benjamin Veghte,
Ph.D., Research Director of Social Security Works (SSW), the lead researcher, whose commitment to excellence drove the project to its
successful conclusion. Likewise, the outstanding contributions of Stephanie Connolly, SSW’s Legislative and Policy Associate, including
drafting the appendices and compiling and verifying data, were crucial to its completion. Michael Phelan, SSW’s Deputy Director, and
Alex Lawson, SSW’s Executive Director, managed the actual production of the report. We would like to thank Lacy Crawford, SSW’s
Communications Director for assembling, sometimes writing and editing the personal stories included in all 50 state reports. Linda Benesch,
Communications Associate, and Jasmine Jefferson, Legislative Associate, also helped proofread the data.

Very importantly, we want to acknowledge our appreciation to Gus, Suzie, Ruby and Mike for sharing their stories and views about the
importance of Social Security to their lives. Graphic design was provided by Deepika Mehta.

Social Security Works also benefited from the work and commitment of several persons who provided original research and analysis for
this report. We would like to thank Dr. Roberto Gallardo of the Mississippi State University Extension Service for calculating Social Security
data on the metropolitan and non-metropolitan counties in each state and sharing the results of his unpublished work, as well as the
Center for Rural Strategies for commissioning Dr. Gallardo’s research. Arloc Sherman, Senior Researcher, and Danilo Trisi, Research
Associate, at the Center on Budget and Policy Priorities generously provided access to unpublished poverty data analyzed by the Center,
including the numbers of African American and Latino seniors Social Security lifted out of poverty in 2012.

The data presented in this report speak volumes about the importance of Social Security to families, communities, and state and local
economies. We hope the report is useful to you as you work to strengthen Social Security in this 79th anniversary year. Please contact Social
Security Works Communications Director, Lacy Crawford (lcrawford@socialsecurityworks.org), if you have questions about this report.

Nancy Altman and Eric Kingson
Founding Co-directors, Social Security Works; Co-chairs, Strengthen Social Security Coalition
Authors of Social Security Works! Why Social Security Isn’t Going Broke and How Expanding It Will Help Us All (The New Press, January
2015), available for purchase at http://amzn.to/1uBmbce

                     The Alliance for Retired Americans is a grassroots organization representing more than 4 million retirees and seniors
                     nationwide. Headquartered in Washington, DC, the Alliance’s mission is to advance public policy that protects the
                     health and economic security of older Americans by teaching seniors how to make a difference through activism.
                     Learn more about The Alliance and its work at www.retiredamericans.org

                     The mission of Social Security Works is to protect and improve the economic status of all Americas, especially
                     disadvantaged and at-risk populations, and, in so doing, to promote social justice for current and future generations of
                     children as well as young, middle-aged and older adults. www.socialsecurityworks.org

                     The Strengthen Social Security Coalition is made up of more than 320 national organizations and many state
                     organizations, representing more than 50 million Americans. The Coalition is united around core principles, which
                     include that Social Security benefits should not be cut and, instead, should be increased for those who are most
                     disadvantaged, and the belief that our nation’s Social Security, Medicare and Medicaid systems are fundamental to
                     the well-being of America’s families and to the type of nation we are. www.strengthensocialsecurity.org

Social Security WorkS for HAWAII
Introduction
                         “We can never insure one-hundred percent of the population against one-hundred percent
                         of the hazards and vicissitudes of life. But we have tried to frame a law which will give some
                         measure of protection to the average citizen and to his family against the loss of a job and
                         against poverty-ridden old age. This law, too, represents a cornerstone in a structure which is
                         being built but is by no means complete. It is a structure intended to lessen the force of possible
                         future depressions. It will act as a protection to future Administrations against the necessity of
                         going deeply into debt to furnish relief to the needy. The law will flatten out the peaks and valleys
                         of deflation and of inflation. It is, in short, a law that will take care of human needs and at the
                         same time provide for the United States an economic structure of vastly greater soundness.”
                                                     —Franklin D. Roosevelt, August 14, 1935

In 1935, when President Franklin D. Roosevelt                   and its counties; how many dollars flow into these
signed the Social Security Act into law he called               jurisdictions in a year; the types of benefits and the
it a cornerstone, the foundation of a structure to              types of people who receive benefits. Perhaps more
be maintained and built upon by and for future                  importantly, the report presents the story of hard-
generations. Social Security could not protect all              working Americans and their families whose lives are
Americans against every risk, but, as the President             immeasurably better because of the protections they
said, it could lessen the consequences of lost                  have earned.
earnings in old age for workers and their families.
                                                                As you read through this report, think of the people
Since then, we have built our Social Security structure         you know. Family members who live in dignity in old
carefully and deliberately. In 1939, we added Survivors         age because they can count on a monthly Social
Insurance benefits for widows and dependent                     Security check that they or another family member
children, eventually extending it to widowers as well.          have earned. Think of that older person who has
Disability Insurance benefits were added in 1956,               outlived his modest savings, but who, thanks to Social
followed by Medicare and Medicaid in 1965. The                  Security, can continue to live independently. Think
automatic cost-of-living adjustment (COLA) was                  of a friend’s mother, who relied on Social Security to
added in 1972, designed to maintain the purchasing              provide for her family after she was severely disabled
power of benefits no matter how long someone                    in a workplace accident. Think of a neighbor, whose
lives. We built, maintained and strengthened these              widowed father needed Social Security to pay the bills
institutions for a reason: to enable working men and            when her mother passed away suddenly.
women to protect themselves and their families. We
built them because we, as a nation, value hard work,            Think, too, of how the institution of Social Security,
personal responsibility and human dignity; we care for          like the nation’s highway system, is part of a rich
our parents, our children, our spouses, our neighbors           legacy built by those who came before, a legacy that
and ourselves.                                                  keeps working in good times and bad. Throughout the
                                                                past few difficult years, Social Security has been even
This report highlights the remarkable success of                more vital than before for Hawaiians, and the lifeblood
Social Security for Hawaii and the nation. The                  of many small businesses. Virtually all of the jobs our
numbers tell part of the story: how many people                 Social Security system supports stay in America.
receive benefits in Hawaii, in its congressional districts

Social Security WorkS for HAWAII                                                                                                 1
Social Security Works
We built our Social Security system because it is          (DI) benefits provide 75 percent of the income or more
the most efficient, secure, universal and fair way for     for nearly 6 in 10 non-institutionalized beneficiaries.9
Americans to replace wages in the event of death,          Nonetheless, 1 in 5 DI beneficiaries remains in poverty.10
disability, or old age. For 79 years, even as our
nation has endured wars, political crises and severe       Through their hard work and payroll tax contributions,
economic recessions, Social Security has never             nearly all American workers earn Social Security’s
missed a payment; it has paid every dollar of earned       retirement, disability and survivorship protections
benefits, on time and in full.                             for themselves and their families. Social Security is
                                                           the primary disability and life insurance protection
The importance of Social Security—the nation’s family      for most Hawaii workers. Social Security provides
insurance against lost wages due to old age, disability,   a 30-year-old worker with a spouse and two young
or death—cannot be overstated. Nationwide, Social          children, earning $30,000-$35,000, disability and
Security provided $812 billion in benefits to 58 million   life insurance protections worth about $583,000
beneficiaries in 2013—nearly 1 in 5 (18.3 percent)         and $550,000, respectively.11 Today, 210 million
Americans.1 Social Security is not just a retirement       working Americans have earned these protections for
program for seniors, however. Over 17 million people       themselves and their families.12
under age 65 received Social Security benefits in
2013—about 3 in 10 (29.5 percent) beneficiaries.2          There is a significant chance that a worker will need
                                                           these protections before she retires. Nationwide,
In fact, Social Security is the nation’s largest and,      just over 1 in 4 people who turned 20 in 2013 are
despite its modest benefits, most generous children’s      projected to become severely disabled during their
program. There were about 9.2 million children             working years.13 An estimated 1 in 8 of today’s 20-
receiving Social Security benefits in 2013.3 These         year olds will die before reaching retirement age.14
include over 4.4 million children who received Social      Taken together, this means that roughly 1 in 3 young
Security benefits directly,4 and, additionally, an         adults entering the workforce today will die or become
estimated 4.8 million children who lived in households     disabled before reaching the full retirement age.15
where all or part of the income of the household
comes from Social Security.5

For the vast majority of beneficiaries—young and
old alike—Social Security’s benefits are modest, but
vital. The average Social Security benefit was $14,006
a year in 2013, and $14,777 for retired workers.6
Almost two-thirds (64.6 percent) of elderly couples
and unmarried beneficiaries relied on Social Security
for half of their income or more in 2012.7 The program
lifted 22 million Americans out of poverty in 2012,
including 1 million children.8

Social Security benefits are particularly important for
disabled workers. Social Security Disability Insurance

Social Security WorkS for HAWAII                                                                                    2
Figure 1                                                         Figure 2
  Hawaii’s Social Security Beneficiaries,                                  Poverty Rate for Hawaii
                  2013                                                  Beneficiaries 65+ with/without
                                                                         Social Security, 2010-2012
                                       10%
                                     Disabled
                                     Workers                                                              35.5%
                                                   6%                    33.8%
                                                Widow(er)s
                                                             s
                                                         use
                                                    % Spo
                                                   4
                                                        6%
                                                      Children
                   74%
                                                                          HI
             Retired Workers
                                                                                                                         9.7%
                                                                                      8.5%

                                                                                65+                             Women 65+

                                                                               n Poverty rate without Social Security
                                                                               n Poverty rate with Social Security

             Source: Social Security Administration, 2014                  Source: Center on Budget & Policy Priorities, 2013

Social Security Works for Hawaii’s                               • Without Social Security, the elderly poverty rate
Residents and Economy                                              in Hawaii would have increased from 1 in 12 (8.5
• Social Security provided benefits to 246,477                     percent) to one-third (33.8 percent) [Figure 2].24
  Hawaiians in 2013, 1 in 6 (17.6 percent) residents.16
• Hawaiians received Social Security benefits totaling           Social Security Works for Hawaii’s Women
  $3.4 billion in 2013, an amount equivalent to 5.4              • Social Security provided benefits to 126,716
  percent of the state’s total personal income.17                  Hawaii women in 2013, 1 in 5 (18.2 percent) Hawaii
• The average Social Security benefit in Hawaii was                women.25
  $13,985 in 2013.18                                             • Social Security provided benefits to 8,496 Hawaii
• Social Security lifted 73,000 Hawaiians out of                   spouses in 2013, 1 in 29 (3.4 percent) beneficiaries
                                                                        ID
  poverty in 2012.19                                               [Figure 1].26
                                                                 • Social Security lifted 29,000 Hawaii women aged
Social Security Works for Hawaii’s Seniors20                       65 or older out of poverty in 2012.27
• Social Security provided benefits to 184,442                   • Without Social Security, the poverty rate of elderly
  Hawaii retired workers in 2013, three-quarters (74.8             women would have increased from 1 in 10 (9.7
  percent) of beneficiaries [Figure 1].21                          percent) to one-third (35.5 percent) [Figure 2].28
• The typical benefit received by a retired worker in
  Hawaii was $15,287 in 2013.22
• Social Security lifted 51,000 Hawaiians aged 65 or
  older out of poverty in 2012.23

Social Security WorkS for HAWAII                                                                                                3
Social Security Works for Hawaii’s
Widow(er)s
• Social Security provided Survivors benefits to         Gus, Wisconsin
  15,306 Hawaii widow(er)s in 2013, 1 in 16 (6.2
  percent) Hawaii beneficiaries [Figure 1].29            Gus was a “tunnel rat” in Vietnam—one
• The typical benefit received by a widow(er) in         of the volunteer Army infantrymen who
  Hawaii was $14,460 in 2013.30                          specialized in entering the web of narrow
                                                         tunnels created by the VietCong. The
Social Security Works for Hawaii’s Workers               tunnel rats would kill enemy soldiers hiding
with Disabilities31                                      there and plant explosives to destroy these
• Social Security provided disability benefits to
                                                         underground avenues of guerilla warfare.
  23,328 Hawaii workers in 2013, 1 in 10 (9.5
  percent) Hawaii beneficiaries [Figure 1].32
• The typical benefit received by a disabled worker      For his service in this capacity he was
  beneficiary in Hawaii was $13,164 in 2013.33           awarded the Silver Star, the third highest
                                                         decoration for valor given by the Army.
Social Security Works for Hawaii’s Children              Sixteen days after he was mustered out
• Social Security is the primary life and disability     of the Army, he returned to his home in
  insurance protection for 98 percent of Hawaii’s        Wisconsin—and was in a serious car crash,
  307,266 children.34                                    sustaining a high-level spinal cord injury.
• Social Security provided benefits to 14,905
  Hawaii children in 2013, 1 in 16 (6 percent) Hawaii
                                                         Because his injury was sustained outside
  beneficiaries [Figure 1].35
• Social Security is the most important source of
                                                         military service, he was not eligible for
  income for the 59,382 children living in Hawaii’s      service-connected disability compensation
  grandfamilies, which are households headed by a        and had to turn to Social Security Disability
  grandparent or other relative.36                       Insurance. “To put it quite simply,” he says,
                                                         “SSDI was a life saver.”
Social Security Works for Hawaii’s African
Americans
• In Hawaii, Social Security provided benefits to 1 in
  13 (7.8 percent) African American households in
  2012, 667 households.37
• Nationwide, Social Security lifted 1,231,000
  African Americans aged 65 or older out of poverty
  in 2012.38 Without Social Security, the poverty
  rate among African American seniors would have
  increased from 1 in 6 (18 percent) to half (51
  percent).39
• Nationwide, Social Security provided nearly
  three-quarters (71.5 percent) of the income of
  African American elderly couples and unmarried
  individuals receiving benefits, on average, in 2012.
  Social Security made up 90 percent of the total
  income for nearly half (46.4 percent) of these
  African American elderly households.40

Social Security WorkS for HAWAII                                                                         4
• African Americans were 12.6 percent of the                 longer life expectancies, higher incidence of
  population in 2011, but represented 19 percent of          disability and larger families.46
  disabled worker beneficiaries.41
                                                          Social Security Works for Hawaii’s Asian
Social Security Works for Hawaii’s Latinos                Americans, Hawaiian Natives and Pacific
• In Hawaii, Social Security provided benefits to 1 in    Islanders
  5 (19.3 percent) Latino households in 2012, 6,035       • In Hawaii, Social Security provided benefits to 2 in
  households.42                                             5 (39.2 percent) Asian American, Hawaiian Native
• Nationwide, Social Security lifted 999,000 Latinos        and Pacific Islander households in 2012, 82,684
  aged 65 or older out of poverty in 2012.43 Without        households.47
  Social Security, the poverty rate among Latino          • Nationwide, Social Security provided, on average,
  seniors would have increased from 1 in 5 (21              over two‐thirds (67.7 percent) of the total income
  percent) to half (52 percent).44                          for Asian American households with beneficiaries
• Nationwide, Social Security provided three‐               aged 65 or older in 2012. Social Security was
  quarters (74.5 percent) of the total income of Latino     90 percent of the income for over 4 in 10 (44.4
  elderly couples and unmarried individuals receiving       percent) Asian American elderly households.48
  benefits, on average, in 2012. Social Security was      • Nationwide, Asian Americans and Pacific Islanders
  90 percent of the income for more than half (52.6         receive a high rate of return from Social Security
  percent) of these Latino elderly households.45            because of their long life expectancies. An Asian
• The Social Security Administration estimates that         American or Pacific Islander man aged 65 in 2011,
  Latinos receive a higher rate of return on their          can expect to live until age 85, compared to age 82
  Social Security contributions than the overall            for all men. An Asian American or Pacific Islander
  population—the highest of any group. That’s               woman aged 65 can expect to live until age 88,
  because they tend to have lower lifetime income,          compared to age 85 for all women.49

Social Security WorkS for HAWAII                                                                               5
Susie, North Dakota

                                                          Susie worked with her husband in their
                                                          family shoe store for more than 22 years.

                                                          “That’s how we made our living,” she
                                                          says. “We made about $100,000 a year
Social Security Works for Hawaii’s Rural                  during good years. It wasn’t all profit,
Communities                                               we also had expenses but we got by.”
• Social Security is more important to Hawaiians
                                                          And even though her husband passed
  living in rural or non-metropolitan counties than to
                                                          away 19 years ago, she’s reminded of
  Hawaiians living in metropolitan counties. 1 in 5 (21
  percent) rural Hawaiians received Social Security       their sacrifices and successes when she
  in 2012, compared with 1 in 6 (17.2 percent)            receives her earned Social Security and
  metropolitan Hawaiians.50                               Medicare.
• Social Security is more important to the local
  economies of Hawaii’s rural or non-metropolitan         She began work as a waitress at 14
  counties than to those of its metropolitan counties.    years old in tiny Reeder, North Dakota.
  Total personal income in Hawaii’s rural counties        From there she maintained a series of
  was $8.9 billion in 2012 of which $680.8 million,       jobs including later on, at her own shoe
  or 7.6 percent, was from Social Security. By            store. Today, she receives about $700
  comparison, total personal income in the state’s
                                                          a month from Social Security along
  metropolitan counties was $53.4 billion, of which
                                                          with support from Medicare. Even in
  $2.6 billion, or 4.9 percent, was from Social
  Security.51                                             Dickinson, the money doesn’t go far. “I’m
                                                          on both Medicare and Social Security, and
Social Security Works for Immigrants                      together they pay less than I earned when
• Social Security is critical for all immigrants, of      I worked,” Susie says.
  whom 7 in 10 (71.5 percent) were Latino or Asian
  American in 2012.52                                     At 68 years old, Susie has the benefit of
• New immigrants tend to have lower career                hindsight when she surveys her life and
  earnings, so Social Security is likely to be a larger   the lives of other seniors. When asked
  source of retirement income for them. Nationwide,       how she feels about some who say
  the median household income of foreign-born
                                                          seniors could afford to get by on $50 less
  residents was $47,420 in 2012, 10.6 percent lower
                                                          each month if Social Security were cut to
  than the median for native-born Americans, which
  was $52,428.53                                          cut, she has a stark reminder for younger
• Social Security is a lifeline for older workers who     generations: “Yes, $50 is a big deal! That
  have serious health problems, difficult jobs or         means that I will have to drastically cut
  major work disabilities, among whom immigrants          my food budget. It’s already being cut as
  are disproportionately represented.54 Nearly 6 in       we speak. I don’t even do entertainment
  10 (55.7 percent) immigrant workers aged 58 or          out of the house anymore, because I
  older work in physically demanding jobs or difficult    can’t afford it. My way of living has been
  conditions, compared with 4 in 10 (43.8 percent)
                                                          reduced dramatically.”
  native-born workers.55

Social Security WorkS for HAWAII                                                                       6
• An analysis by the office of the Social Security
  Administration’s Chief Actuary shows that
  providing a path to citizenship for the country’s 11        Ruby, Arizona
  million unauthorized immigrants would net Social
  Security $284 billion by 2024, extending Social             I was born when Franklin Delano
  Security’s full solvency by two years.56                    Roosevelt was elected into office in
                                                              1932, and three short years later he
Social Security’s Promise for Same-Sex                        signed Social Security into law. I am
Couples and Their Families                                    retired now, so Social Security affects
As a result of the June 26, 2013 Supreme Court
                                                              my life that way, but it also affected my
decision regarding the Defense of Marriage Act
                                                              life, and my children’s lives, through
(DOMA), the federal government now recognizes the
rights of legally married same-sex couples to many            survivors’ benefits because we
federal benefits, including Social Security. While the        received benefits after their father died
Justice Department has determined that the Social             prematurely. It was a hunting accident.
Security Administration (SSA) must follow state law in        A guy across the hill from him shot, and
Social Security cases, SSA encourages all potentially         my husband was hit, so I was left with
eligible same-sex couples—whether married, in civil           the five kids.
unions or registered domestic partnerships—to apply
for benefits (such as survivors, spousal, and related         It was such a shock that I didn’t really
family benefits). Even if they are not yet legally eligible
                                                              know what I was going to do. It was
now, they may become so in the future; applying
                                                              really difficult. I got to the point where
now creates a “protective filing date” which could
potentially entitle them to retroactive benefits later.57     for three months, I could barely do
The Social Security and Marriage Equality (SAME) Act,         anything and I finally had to go to the
for example, would amend the Social Security Act to           doctor. I could barely put one foot in
grant survivor benefits to any individual legally married     front of me to physically walk to the
anywhere in the United States, regardless of whether          doctor’s office. I don’t know what
he or she lives in a state that recognizes same-sex           I would have done without Social
marriage.58                                                   Security. When I went to work, I only
                                                              earned one dollar thirty cents an hour.
Just as Social Security’s protections are critical for
                                                              It was tough but it was workable.
persons in traditional marriages, the availability of
Social Security’s spousal and children protections are
                                                              Without Social Security I don’t know
similarly crucial for:                                        how it would have been.
• The 50,000 same-sex couples who are married
   under state law,59
• The 90,000 couples in civil unions,60
• Others who are in long-term committed
   relationships but living in states that do not permit
   same-sex marriages or civil unions; and
• The estimated 250,000 children being raised by
   same-sex couples.61

Social Security WorkS for HAWAII                                                                           7
Although not all of these same-sex couples and their                                                      to cover every penny of the cost; it simply does not
families have become eligible for Social Security,                                                        have borrowing authority.63 This is why Social Security
Social Security now works for many of our fellow                                                          has nothing to do with reducing the federal budget
Americans who are part of the lesbian, gay, bisexual                                                      deficit, and should not be part of any deficit reduction
and transgender (LGBT) community. As the population                                                       legislation considered by our nation’s leaders.
ages and as more states recognize the civil rights of
these fellow Americans, Social Security will become                                                       To reduce the federal debt, Congress should be
ever more important to them.                                                                              looking at its causes. It should not cut Social Security,
                                                                                                          which has not and cannot contribute a single penny
Social Security Works Financially                                                                         to the federal budget deficit. The large run-up in
A public trust, Social Security is the nation’s most                                                      federal deficits in recent years resulted primarily
conservatively financed and carefully monitored                                                           from huge tax cuts in 2001 and 2003; the unpaid
institution. Social Security does not, and, by law,                                                       costs of the Iraq and Afghanistan wars; the Great
cannot add a penny to the federal deficit or debt                                                         Recession, which dramatically reduced tax collections
(which is simply the accumulation of annual deficits).62                                                  and increased unemployment compensation and
While the federal budget has run a deficit in every                                                       other spending; the economic stimulus and recovery
year but five over the last half century, Social Security                                                 spending; and the Wall Street bank bailout [Figure 3].64
is not allowed to pay benefits unless it has the funds
                                                                                                          Not only is Social Security independent of the budget
                                                                                                          and self-funded; it is also among the most transparent
                                                                                                          pension programs in the world. Each year since 1941,
                                                        Figure 3                                          Social Security’s Trustees issue a report about the
                               Economic Downturn and Legacy of                                            program’s financial health. The annual Trustees Report
                                  Bush Policies Drive Deficits                                            projects income and outgo 75 years into the future—
                                                                                                          further than private pension programs and the Social
                                                n   Wars in Iraq and Afghanistan
                                                                                                          Security programs of nearly every other nation. It is
                                                n   Bush-era tax cuts
                                                n   Recocvery measures
                                                                                                          intended to provide Congress an extremely long lead
                                                n   TARP, Fannie and Freddie                              time to make adjustments that are needed from time
                                                n   Economic downturn                                     to time. Except for Medicare, no other federal program
                        $1.5                                                                              is subject to this type of scrutiny.

                                                                                                          It is only because Social Security is required to
                        $1.2
                                                                                                          project its finances 75 years into the future that we
                                                               Projected DEFICIT under                    even know about its modest long-term shortfall. This
                                                                  current policies
                        $0.9                                                                              year’s report, signed by Social Security’s trustees—
Deficit, in trillions

                                                                                                          the secretaries of the Treasury, Health and Human
                                                                                                          Services and Labor, the Commissioner of Social
                        $0.6                                                                              Security and two Public Trustees appointed by the
                                                                                                          President—projects that Social Security can pay all
                                                                                                          benefits in full and on time for nearly two decades.65
                        $0.3
                                                DEFICITS WITHOUT                                          After that, if Congress were not to act, it could still
                                                 THESE FACTORS
                                                                                                          pay 77 cents on every dollar of earned benefits for the
                         $0                                                                               remainder of the next 75 years.66
                           2009   2010   2011   2012    2013    2014   2015   2016   2017   2018   2019

          Source: CBPP analysis based on Congressional Budget Office February 2013 estimates.
          Note: All components include the associated debt-service costs.

Social Security WorkS for HAWAII                                                                                                                                  8
Social Security’s projected shortfall is incredibly modest
as a share of the economy. Even with the retirement
of the baby boomers, Social Security’s costs are Mike, Ohio
projected to go from their current level of just under 5
percent of Gross Domestic Product (GDP) to a peak Mike was a small business owner. He
of 6.2 percent in 2035, remaining just below that level had his own home construction
thereafter.67 The cost of bringing Social Security into business. While on vacation in the
actuarial balance is equal to 1 percent of GDP.68 This Bahamas, he suffered a massive stroke.
increase in Social Security spending is smaller than He was only 60 years old. Although
the increase in spending on public education that
he did receive some initial medical
occurred when the boomers were children.69
attention in the Bahamas, his family,
Our Social Security system can and should keep all its through the help of friends, was able
commitments without cutting benefits. For example, to charter a plane to bring him back to
one approach would have everyone pay the same states for treatment.
payroll contribution rate (6.2 percent) as about 94
percent of all American workers do.70 While the vast His stroke left him paralyzed on his right
majority of Americans must make contributions on side and with aphasia, which means he
all of their wages, millionaires and billionaires only understand, but cannot speak. While
do so on the first $117,000 of their earnings this most SSDI cases take usually a couple
year.71 Asking all Americans to pay the same rate
of years to get approval, Mike’s case
would come close to closing Social Security’s entire
was so compelling, he was approved
projected 75-year funding gap.72
immediately. In the seven years since
his accident, Mike has managed to go
through his IRA, which he used to pay
for unexpected medical expenses.
If he did not have SSDI and now his
retirement benefit, his family does not
know what he would have done.
Social Security WorkS for HAWAII 9Conclusion: Maintaining a Legacy
for All Generations
Social Security represents the best of American Maintaining our Social Security system must not be
values—rewarding hard work, honoring our parents, reduced to a matter of simple arithmetic. Any changes
caring for our neighbors, and taking responsibility we make to Social Security must help advance the
for ourselves and our families. It is based on a program’s mission of providing economic security
promise that if you pay in, then you earn the right to and dignity for America’s working families. Closing
guaranteed benefits. the program’s modest funding gap is a means to
achieve this mission, not an end in itself. Cutting
Given that the administration of the Social Security benefits now merely to avoid cutting them later would
program is funded from the contributions of insured solve the arithmetic problem at the expense of Social
workers, not general revenues, part of the promise Security’s fundamental promise. For example, basing
of Social Security is excellent customer service. Social Security’s cost-of-living adjustments on the
Indeed, SSA has long been known for this,73 all while stingier chained CPI (Consumer Price Index), a cut
operating extremely efficiently on an administrative proposed by many in Washington, would undermine
budget amounting to less than one percent of the adequacy of Social Security’s modest benefits. It
revenues. In recent years, however, Congress has would hit long-time beneficiaries, such as people with
repeatedly severely limited SSA’s budget, restricting disabilities and the oldest old, the hardest, at a time in
its use of its own dedicated surplus, which has their lives when most have little else on which to live.
required field office closures, staff reductions, Under the chained CPI, the average earner retiring at
suspension of benefit statements and other measures age 65 would see a cumulative benefit cut of $4,642
that have significantly compromised the agency’s at age 75, $13,921 at age 85, and $28,015 at age 95.75
service, even as the agency has coped with the
enormous increase in caseloads stemming from the As important as Social Security is today, the need for
aging of the Baby Boom generation.74 It is critical that it will only increase in coming years. Our nation faces
Congress permit SSA to spend more of its surplus an impending retirement income crisis. More than half
so that it can re-open closed offices, open new ones, (53 percent) of today’s working Americans are not
and continue to provide stellar customer service to the expected to have sufficient resources to maintain their
American people. standard of living in old age.76 The outlook is even
more dismal when anticipated health and long-term
Our Social Security system has withstood the test of care expenditures are counted; then, roughly two-
time. Like our interstate highway system, however, thirds of working-age households are not expected to
Social Security requires periodic maintenance to be able to maintain their living standard in retirement.77
remain strong. Now it is our turn to maintain and build
upon that structure, as those who came before have The retirement income crisis is the result of changes in
done. It is our turn to preserve and improve these the economy that have diminished private sources of
valuable systems for ourselves and for those who retirement income. Employers have been increasingly
follow. It is our turn to build a legacy for our nation’s terminating traditional pension plans and either not
children and grandchildren so when they become replacing them, or replacing them with far more risky
workers, they will have the economic security that and inadequate 401(k) accounts. Just over half (52.5
Social Security provides. percent) of all working heads of household are eligible
Social Security WorkS for HAWAII 10for an employer-sponsored retirement plan; less than 2013, Social Security benefits replace 41 percent
half (44.6 percent) actually participate.78 Among those of pre-retirement earnings.81 That replacement
households nearing retirement (aged 55-64) with a rate alone ranks 30th out of 34 among countries
401(k) plan, IRA, or both, the median balance was in the Organization for Economic Cooperation and
$100,000.79 But 45 percent of households do not even Development.82 Social Security’s replacement rate
own a retirement account, and 6 in 10 households will drop to 36 percent of pre-retirement earnings by
nearing retirement have less than a year’s salary worth 2025, mostly due to the ongoing increase in the full
of retirement savings. Hence the median retirement retirement age to 67.83 If health care costs continue to
account balance for all U.S. households aged 55-64 is rise faster than inflation, Medicare Part B and Part D
only $12,000.80 premiums will further reduce Social Security benefits’
value.84
Were it not for Social Security, the retirement income
crisis would inevitably be much worse. Social Security The solution is clear. It is time to double down on
continues to prove steady, stable, and reliable. In what works. It is time to expand Social Security,
a world of stagnant wages and risky or inadequate not cut it. Social Security Works and the Strengthen
401(k) plans, Social Security is a fortress of security Social Security Coalition, which includes over 300
and reliability. In this uncertain world, where no one national and state groups representing over 50 million
is invulnerable to the tragedy of premature death or Americans, support legislation in Congress that
serious and permanent disability, Social Security is would do just that. Expanding Social Security is not
there to cushion the economic blow of such tragedies. only affordable; it is a wise public investment. With
64.6 percent of total income growth over the past
Further, Social Security benefits, while growing thirty years going to the top one percent, while the
in importance, are already modest and declining. aggregate income of the bottom 90 percent actually
For a lifetime average earner retiring at age 65 in declined,85 and other sources of retirement security
dwindling or unreliable, this is not the time to accept
further cuts to Social Security as a “reasonable
compromise,” as little “tweaks” that will do no lasting
harm. Rather, this is the time for reasonable people
to talk about expanding Social Security, just as the
majority of Americans want.
At base, this is about what kind of nation we want
to live in and leave for those who follow. We are the
wealthiest nation in the world. Our nation is much
wealthier than it was in 1935, 1939, 1956, 1965, or
1972, when Social Security’s key structures were built
and improved. The consequences of not expanding
Social Security are far worse—a deeper retirement
income crisis; greater income inequality; a more
sluggish consumer economy—than the cost of doing
what is right.
Social Security WorkS for HAWAII 11Appendix 1: Social Security Works for Hawaii’s Congressional Districts
Congressional Districts
State Total
1 2
Total annual benefits
$3,557M $1,813M $1,744M
($ in millions)*
Number of residents in
1,378,239 687,223 691,016
state/congressional district
Number of residents receiving
246,477 123,923 122,554
Social Security benefits
Percent of residents receiving
17.9% 18.0% 17.7%
Social Security benefits
Women 126,716 N/A N/A
Social Security Beneficiaries by category
Retired workers 184,442 96,003 88,439
Disabled workers 23,328 9,278 14,050
Widow(er)s 15,306 7,714 7,592
Spouses
8,496 4,726 3,770
Children
14,905 6,202 8,703
Sources: “U.S. Census Bureau, ACS Demographic and Housing Estimates, “2010-2012 American Community Survey 3-Year
Estimates,” 2013.
SSA, “Hawaii,” Congressional Statistics, December 2013, 2014.
SSA, Annual Statistical Supplement, 2014, “Table 5.J5.1: Number by state or other area and sex, December 2013,” July 2014.
*The annual benefits for the Congressional districts were calculated by taking the monthly benefits and multiplying by 12. The
state annual benefits number is the sum of the congressional district numbers.
Social Security WorkS for HAWAII 12Appendix 2: Social Security Works for Hawaii’s Counties
Social Security Benefits,
Hawaii County Demographics, 2012 Social Security Beneficiaries by Characteristic, 2013*
2012-2013
% of
Median % of % of Total
% in Population Annual Population
Metropolitan/ 2012 Household Population Personal Total Retired Disabled
County Poverty, Over Age Total Benefits, Receiving Widow(er)s Spouses Children
Non-Metropolitan Population Income, Over Age Income, Beneficiaries Workers Workers
2012 65, 2012 2013 Benefits,
2012 65, 2012 2012
2013
Hawaii Total (5
N/A 1,392,313 $66,086 11.8% 210,801 15.1% $3,557,076,000 5.3% 17.7% 246,475 184,440 23,330 15,305 8,495 14,905
Counties)
Social Security WorkS for HAWAII
Hawaii Non-Metropolitan 189,191 $49,048 18.9% 30,112 15.9% $552,612,000 7.9% 21.0% 39,695 28,215 5,300 2,400 1,075 2,705
Honolulu Metropolitan 976,372 $70,779 10.4% 147,427 15.1% $2,417,568,000 4.7% 17.0% 165,805 125,870 13,570 10,615 6,280 9,470
Kalawao Non-Metropolitan 90 $0 0.0% 27 30.0% $0 0.0% 0.0% 0 0 0 0 0 0
Kauai Metropolitan 68,434 $55,614 12.3% 11,035 16.1% $197,652,000 6.9% 20.3% 13,925 10,435 1,355 845 430 860
Maui Metropolitan 158,226 $59,281 11.2% 22,200 14.0% $389,244,000 5.9% 17.1% 27,050 19,920 3,105 1,445 710 1,870
*State totals in this appendix may not equal state figures cited elsewhere in the report, because individual county figures provided by SSA are rounded.
2012 Population: US Census Bureau, 2012 Population Estimates, “Annual Estimates of the Resident Population for Selected Age Groups by Sex for the United States, States, Counties and Puerto Rico Commonwealth
and Municipios: April 1, 2010 to July 1, 2012,” 2013. http://factfinder2.census.gov/. The total state population given in Appendix 2 may not match the state population in Appendix 1 because it is the sum of the individual
county population estimates, which have a higher margin of error than congressional district population estimates.
Metropolitan/Non-Metropolitan: Unpublished calculations of US Census data performed by Dr. Roberto Gallardo, Mississippi State University Extension Service, on behalf of the Center for Rural Strategies, and shared
with Social Security Works. For the purposes of this analysis, “metropolitan” refers to counties with at least one urbanized area of 50,000 people or more, and adjacent counties in which 25 percent of the workforce or
more commutes to county with 50,000 people or more. “Non-metropolitan” refers to counties designated by the Office of Management and Budget (OMB) as non-metropolitan, including micropolitan areas, or “small
cities,” with urban clusters of 10,000-49,999 people, and non-core areas lacking a centralized population of any kind. Dr. Gallardo’s initial calculations distinguished between “small cities” and “rural” counties. For Social
Security Works, he created a weighted average of “small cities” and “rural” counties that allowed us to classify both as “non-metropolitan” figures. US Department of Agriculture, Economic Research Service (ERS), What is
Rural?, May 10, 2013. http://www.ers.usda.gov/topics/rural-economy-population/rural-classifications/what-is-rural.aspx#.UeSGcGTTWGN
Total Personal Income, 2012: Unpublished calculations of US Census data performed by Dr. Roberto Gallardo, Mississippi State University Extension Service, on behalf of the Center for Rural Strategies, and shared with
Social Security Works, ibid.
Median Househould Income, 2012: US Census Bureau, Small Area Estimates Branch, Small Area Income and Poverty Estimates, 2012, “Table 1: 2012 Poverty and Median Income Estimates - Counties,” 2013.
http://www.census.gov/did/www/saipe/data/statecounty/data/2011.html
Percentage in Poverty, 2012: US Census Bureau, Small Area Estimates Branch, Small Area Income and Poverty Estimates, 2012, “Table 1: 2012 Poverty and Median Income Estimates - Counties,” 2013.
http://www.census.gov/did/www/saipe/data/statecounty/data/2011.html
Population over 65, 2012: US Census Bureau, 2012 Population Estimates, “Annual Estimates of the Resident Population for Selected Age Groups by Sex for the United States, States, Counties and Puerto Rico
Commonwealth and Municipios: April 1, 2010 to July 1, 2012,” 2013. http://factfinder2.census.gov/ http://factfinder2.census.gov/
Percent of Population Receiving Benefits, 2013: SSA, OASDI Benefits by State and County, 2013, “Table 4. Number of beneficiaries in current-payment status, by county, type of benefit, and sex of beneficiaries aged 65
or older, December 2013,” July 2014. http://www.ssa.gov/policy/docs/statcomps/oasdi_sc/
Annual Total Benefits, 2013: SSA, OASDI Benefits by State and County, 2013, “Table 5. Amount of benefits in current-payment status, by county, type of benefit, and sex of beneficiaries aged 65 or older, December
2013,” July 2014. http://www.ssa.gov/policy/docs/statcomps/oasdi_sc/
Social Security Beneficiaries by Characteristic, 2013: SSA, Ibid, Table 4.
13Endnotes 1 Total annual benefits in 2013: $812,045,000. Social Security Administration (SSA), Annual Statistical Supplement, 2014, “Table 5.J1—Estimated total annual benefits paid, by state or other area and program, 2013,” July 2014. http://www.ssa.gov/policy/docs/statcomps/supplement/2014/5j.html. Total beneficiaries as of December 2013: 57,978,610. SSA, ibid., “Table 5.J2—Number, by state or other area, program, and type of benefit, December 2013.” Total U.S. population 2013: 316,128,839. U.S. Census Bureau, “Annual Estimates of the Resident Population for Selected Age Groups by Sex for the United States, States, Counties and Puerto Rico Commonwealth and Municipios: April 1, 2010 to July 1, 2013,” 2013 Population Estimates, 2014. http:// factfinder2.census.gov/ 2 Calculated by subtracting number of beneficiaries 65 and older (40,865,508) from total beneficiaries (57,978,610). SSA, ibid., “Table 5.J3—Number and total monthly benefits for beneficiaries aged 65 or older, by state or other area and sex, December 2013.” 3 There are an estimated 9,189,620 children receiving benefits, including 4,412,620 children receiving benefits directly and an estimated 4,777,000 children under age 18 supported by a parent, guardian, or other relative receiving benefits. The number of children supported by a parent, guardian, or other relative receiving benefits dates from 2010, so it likely understates the total for 2013. Unless otherwise specified as children under 18, the term “children” used in this section is consistent with the Social Security Administration’s use of the term to include three groups: “children under age 18,” receiving benefits through a parent receiving retirement or disability benefits, or a deceased parent; “students aged 18-19,” which refers to children receiving benefits at ages 18 and 19 who are matriculated in an institution of secondary education; and “disabled adult children,” which refers to those adults with a severe disability that began before age 22, at a time when a parent was receiving retirement or disability benefits or was deceased. Children receiving benefits directly: SSA, Annual Statistical Supplement, 2014, “Table 5.J10—Number of children, by state or other area and type of benefit, December 2013,” July 2014. http://www.ssa.gov/policy/docs/statcomps/supplement/2014/5j.html#table5.j10. Definition and eligibility of disabled adult children: SSA, Benefits for Children with Disabilities, 2013, 2014, p. 11. http://www.ssa.gov/pubs/EN-05-10026.pdf. Children dependent on a parent, guardian, or relative receiving benefits: Congressional Research Service (CRS), Thomas Gabe, Social Security’s Effect on Child Poverty, December 22, 2011, Figure 1, pp. 3-4. http:// socialsecurity-works.org/wp-content/uploads/2013/07/CRS_Children-Social-Security_2011.pdf 4 Of the 4,412,620 children who received benefits directly in 2013, 3,236,746 were under age 18; 145,708 were students aged 18-19; and 1,030,166 were disabled adult children. SSA, Annual Statistical Supplement, 2014, “Table 5.J10—Number of children, by state or other area and type of benefit, December 2013,” July 2014. http://www.ssa.gov/policy/docs/statcomps/supplement/2014/5j.html#table5.j10 5 The estimated 4,777,000 children not receiving benefits directly, but living in households that do, include 1.816 million children under age 18 with a parent or guardian receiving benefits, and 2.961 million children under age 18 in families where a relative other than a parent is receiving benefits. These data are from December 2010, the most recent year available, so it likely understates the total for 2012. Congressional Research Service (CRS), Thomas Gabe, Social Security’s Effect on Child Poverty, December 22, 2011, Figure 1, pp. 3-4. http://socialsecurity-works.org/wp-content/uploads/2013/07/CRS_ Children-Social-Security_2011.pdf 6 Average benefit found by dividing total spending by total beneficiaries. Total annual benefits from SSA, Annual Statistical Supplement, 2014, “Table 5. J1—Estimated total annual benefits paid, by state or other area and program, 2013 (in millions of dollars),” July 2014. http://www.ssa.gov/policy/docs/ statcomps/supplement/2014/5j.html. Total beneficiaries from SSA, ibid., “Table 5.J2—Number, by state or other area, program, and type of benefit, December 2013.” Average retired worker benefit found by multiplying average monthly retired worker benefit by 12. SSA, ibid., “Table 5.J6—Percentage distribution of monthly benefit for retired workers, by state or other area and monthly benefit, December 2013.” 7 SSA, Income of the Population 55 or Older, 2012, Table 9.A1, April 2014. http://www.ssa.gov/policy/docs/statcomps/income_pop55/2012/sect09.html 8 Center on Budget and Policy Priorities (CBPP), Social Security Keeps 22 Million Americans Out of Poverty: A State-by-State Analysis, October 25, 2013. http://www.cbpp.org/cms/?fa=view&id=4037. 9 Michelle Stegman Bailey and Jeffrey Hemmeter, “Characteristics of Noninstitutionalized DI and SSI Program Participants, 2010 Update,” Research and Statistics Note Nr. 2014-02, February 2014, Table 2. http://www.ssa.gov/policy/docs/rsnotes/rsn2014-02.html 10 Stegman and Hemmeter, ibid., Table 5. 11 $583,000 value of disability benefits includes $405,000 of Disability Insurance benefits, and $178,000 of Old-Age and Survivors Insurance benefits once the disabled worker reaches the full retirement age. Estimates of illustrative worker’s career earnings and corresponding value of disability and life insurance benefits understate current amounts, since they are in wage-indexed 2011 dollars for a worker beginning to receive benefits in 2012, the most recent year for which data was available. SSA, The Insurance Value of Potential Survivor and Disability Benefits for an Illustrative Worker, Unpublished Memorandum from Michael Clingman, Kyle Burkhalter, and Chris Chaplain, Actuaries, to Alice H. Wade, Deputy Chief Actuary, September 27, 2012. 12 SSA, “Estimated Number of Fully Insured Workers, by Age Group and Sex, on December 31, 1970-2013.” http://www.ssa.gov/OACT/STATS/ table4c2FI.html (accessed July 11, 2014). 13 SSA, “Fact Sheet,” April 2, 2014. http://www.ssa.gov/pressoffice/factsheets/basicfact-alt.pdf 14 SSA, ”Fact Sheet,” ibid. 15 Robert Baldwin and Sharon Chu, “A Death and Disability Life Table for Insured Workers Born in 1985,” Actuarial Note 2005.6, SSA Office of the Chief Actuary, February 2006. http://www.ssa.gov/oact/NOTES/ran6/an2005-6.pdf 16 Total beneficiaries from SSA, Annual Statistical Supplement, 2014, “Table 5.J2—Number, by state or other area, program, and type of benefit, December 2013,” July 2014. http://www.ssa.gov/policy/docs/statcomps/supplement/2014/5j.html#table5.j2. State population data from U.S. Census Bureau, “Annual Estimates of the Resident Population for Selected Age Groups by Sex for the United States, States, Counties and Puerto Rico Commonwealth and Municipios: April 1, 2010 to July 1, 2013,” 2013 Population Estimates, 2014. http://factfinder2.census.gov/ 17 Total annual benefits from SSA, Annual Statistical Supplement, 2014, “Table 5.J1—Estimated total annual benefits paid, by state or other area and program, 2013 (in millions of dollars),” July 2014. http://www.ssa.gov/policy/docs/statcomps/supplement/2014/5j.html#table5.j1. Benefits’ equivalent percentage of total personal income calculated using state figures from Bureau of Economic Analysis, Regional Economic Accounts, “SA1-3 Personal Income Summary (thousands of dollars),” May 30, 2014. http://www.bea.gov/regional/index.htm 18 Average benefit found by dividing total spending by total beneficiaries. Total annual benefits from Social Security Administration (SSA), Annual Statistical Supplement, 2014, “Table 5.J1—Estimated total annual benefits paid, by state or other area and program, 2013 (in millions of dollars),” July 2014. http:// www.ssa.gov/policy/docs/statcomps/supplement/2014/5j.html#table5.j1. Total beneficiaries from SSA, Annual Statistical Supplement, 2014, “Table 5.J2— Number, by state or other area, program, and type of benefit, December 2013,” July 2014. http://www.ssa.gov/policy/docs/statcomps/supplement/2014/5j. html#table5.j2 19 Center on Budget and Policy Priorities (CBPP), Social Security Keeps 22 Million Americans Out of Poverty: A State-by-State Analysis, October 25, 2013. http://www.cbpp.org/cms/?fa=view&id=4037. State estimates are based on a three-year average (for 2010-2012) to improve their reliability; the national data are for 2012. 20 For the purposes of this report, “seniors” describes individuals aged 65 or older. Social Security WorkS for HAWAII 14
21 SSA, Annual Statistical Supplement, 2014, “Table 5.J2—Number, by state or other area, program, and type of benefit, December 2013,” July 2014.
22 For the purposes of this analysis, “typical” is used to describe the “median” benefit. Herein, all references to “typical” will reflect this description.
Monthly median benefit multiplied by 12 to calculate annual figure. SSA, Annual Statistical Supplement, 2014, “Table 5.J6—Percentage distribution of
monthly benefit for retired workers, by state or other area and monthly benefit, December 2013,” July 2014. http://www.ssa.gov/policy/docs/statcomps/
supplement/2014/5j.html#table5.j6
23 CBPP, ibid.
24 CBPP, ibid.
25 SSA, Annual Statistical Supplement, 2014, “Table 5.J5.1—Number, by state or other area, and sex, December 2013,” July 2014. http://www.ssa.gov/
policy/docs/statcomps/supplement/2014/5j.html#table5.j1. Percentage of women receiving benefits calculated using total female population from U.S.
Census Bureau, “Annual Estimates of the Resident Population for Selected Age Groups by Sex for the United States, States, Counties and Puerto Rico
Commonwealth and Municipios: April 1, 2010 to July 1, 2013,” 2013 Population Estimates, 2014. http://factfinder2.census.gov/
26 Total spouses receiving benefits calculated by adding number of spouses of retired workers to number of spouses of disabled workers. SSA, Annual
Statistical Supplement, 2014, “Table 5.J2—Number, by state or other area, program, and type of benefit, December 2013,” July 2014. http://www.ssa.gov/
policy/docs/statcomps/supplement/2014/5j.html#table5.j2
27 Unpublished tabulations of Current Population Survey data for March 2011, 2012, and 2013, performed by the Center on Budget and Policy Priorities
for Social Security Works. The state-level data are averaged for the 3 years from 2010-2012, to increase reliability. Data for the United States as a whole are
from 2012.
28 CBPP, unpublished, ibid.
29 SSA, Annual Statistical Supplement, 2014, “Table 5.J2—Number, by state or other area, program, and type of benefit, December 2013,” July 2014.
http://www.ssa.gov/policy/docs/statcomps/supplement/2014/5j.html#table5.j2
30 Monthly median benefit multiplied by 12 to calculate annual figure. SSA, Annual Statistical Supplement, 2014, “Table 5.J9—Percentage distribution
of nondisabled widow(er)s, by state or other area and monthly benefit, December 2013,” July 2014. http://www.ssa.gov/policy/docs/statcomps/
supplement/2014/5j.html#table5.j9
31 The data here are for disabled workers receiving disability benefits. It does not include those disabled workers and “disabled adult children” who
receive old-age (retirement) or survivors benefits. In this report, any use of the term “disabled worker” will refer only to those disabled workers receiving
disability benefits.
32 SSA, Annual Statistical Supplement, 2014, “Table 5.J2—Number, by state or other area, program, and type of benefit, December 2013,” July 2014.
http://www.ssa.gov/policy/docs/statcomps/supplement/2014/5j.html#table5.j2
33 Monthly median benefit multiplied by 12 to calculate annual figure. SSA, Annual Statistical Supplement, 2014, “Table 5.J8—Percentage distribution of
disabled workers, by state or other area and monthly benefit, December 2013,” July 2014. http://www.ssa.gov/policy/docs/statcomps/supplement/2014/5j.
html#table5.j8
34 In this case, “children” refers to individuals under age 18, and includes neither disabled adult children, nor individuals aged 18-19. When discussing
Social Security’s insurance protections for children, children under age 18 was considered the most appropriate group to reference in this analysis, since
even students aged 18-19 receiving benefits as dependents of a disabled or deceased parent must have qualified for benefits before age 18. While
disabled adult children may receive benefits for a severe disability sustained at age 18 or later, it must occur before age 22, meaning that a large proportion
of beneficiaries will likely have begun receiving benefits before age 18 as well. Population under age 18: U.S. Census Bureau, “Annual Estimates of the
Resident Population for Selected Age Groups by Sex for the United States, States, Counties and Puerto Rico Commonwealth and Municipios: April 1, 2010
to July 1, 2013,” 2013 Population Estimates, 2014. http://factfinder2.census.gov/. Data on percentage of children insured from SSA, Survivors Benefits,
June 2013, p. 4. http://www.ssa.gov/pubs/EN-05-10084.pdf
35 SSA, Annual Statistical Supplement, 2014, “Table 5.J10—Number of children, by state or other area and type of benefit, December 2013,” July 2014.
http://www.ssa.gov/policy/docs/statcomps/supplement/2014/5j.html#table5.j10
36 U.S. Census Bureau, 2010-2012 American Community Survey 3-Year Estimates, “Relationship to Householder for Children under 18 Years in
Households,” 2013. http://factfinder2.census.gov
37 The term “households” as it is used here refers to households reporting income in the past 12 months. Households receiving Social Security benefits
are those households listed as receiving “Social Security income.” U.S. Census Bureau, 2010-2012 American Community Survey 3-Year Estimates,
“Selected Population Profile in the United States,” 2013. http://factfinder2.census.gov/
38 CBPP, unpublished, ibid.
39 CBPP, unpublished, ibid.
40 SSA, Income of the Population 55 or Older, 2012, Table 9.A3, April 2014. http://www.ssa.gov/policy/docs/statcomps/income_pop55/2012/sect09.
html#table9.a3
41 SSA, Social Security is Important for African Americans, April 2014. http://www.ssa.gov/news/press/factsheets/africanamer.htm This is the most recent
statistically valid data available.
42 The term “households” as it is used here refers to households reporting income in the past 12 months. Households receiving Social Security benefits
are those households listed as receiving “Social Security income.” U.S. Census Bureau, 2010-2012 American Community Survey 3-Year Estimates,
“Selected Population Profile in the United States,” 2013. http://factfinder2.census.gov/
43 CBPP, unpublished, ibid.
44 CBPP, unpublished, ibid.
45 SSA, Income of the Population 55 or Older, 2012, Table 9.A3, April 2014. http://www.ssa.gov/policy/docs/statcomps/income_pop55/2012/sect09.
html#table9.a3
46 SSA, Social Security is Important to Hispanics, April 2014. http://www.ssa.gov/news/press/factsheets/hispanics.htm. This is the most recent statistically
valid data available. Fernando Torres-Gil et al., “Hispanics’ Large Stake in the Social Security Debate,” June 28, 2005. http://www.cbpp.org/files/6-28-
05socsec.pdf
47 The term “households” as it is used here refers to households reporting income in the past 12 months. Households receiving Social Security benefits
are those households listed as receiving “Social Security income.” For states in which there are large numbers of Asian American residents as well as
Native Hawaiian and Pacific Islander residents, the numbers of beneficiaries and residents were added to calculate percentage of total Asian American,
Native Hawaiian and Pacific Islander residents receiving benefits. U.S. Census Bureau, 2010-2012 American Community Survey 3-Year Estimates,
“Selected Population Profile in the United States,” 2013. http://factfinder2.census.gov/
48 SSA, Income of the Population 55 or Older, 2012, Table 9.A3, April 2014. http://www.ssa.gov/policy/docs/statcomps/income_pop55/2012/sect09.
html#table9.a3
49 SSA, Social Security is Important to Asian Americans and Pacific Islanders, April 2014. http://www.ssa.gov/news/press/factsheets/asian.htm. This is the
most recent statistically valid data available.

Social Security WorkS for HAWAII                                                                                                                            15
You can also read