ANALYSIS OF CURRENT GROUNDWATER USE IN THE WEST COAST REGION, BRITISH COLUMBIA - TIM BENNETT1, ISMENA BYSTRON1, PAT LAPCEVIC2, MEGAN WAINWRIGHT3 ...
←
→
Page content transcription
If your browser does not render page correctly, please read the page content below
WATER SCIENCE SERIES

                  Analysis of Current Groundwater Use in the West
                  Coast Region, British Columbia

                  Tim Bennett1, Ismena Bystron1, Pat Lapcevic2,
                  Megan Wainwright3 and Tommy Diep1

                  January 2021

No . 20 21 - 01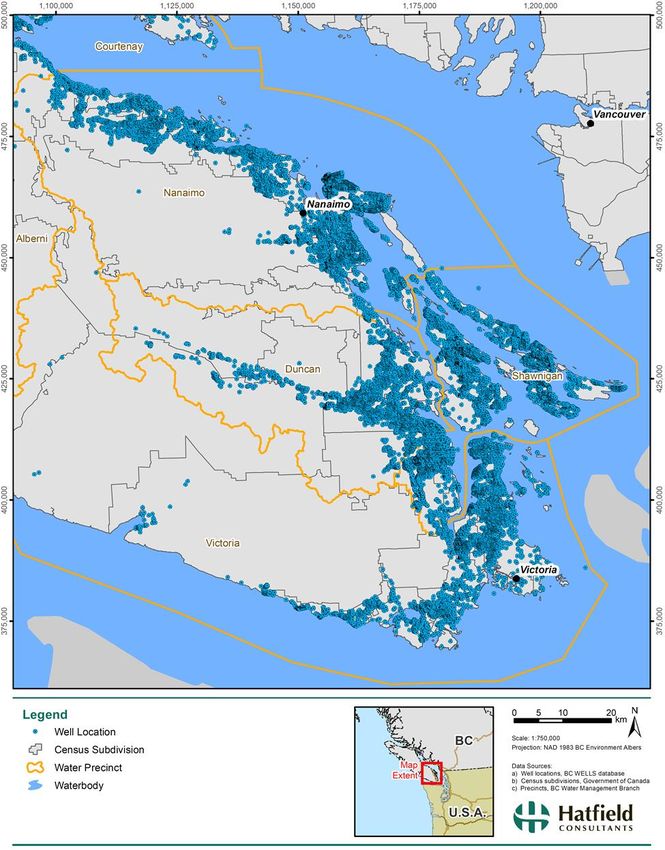
The Water Science Series is a water-focused technical publication for the Natural Resources Sector. The Water
Science Series focuses on publishing scientific technical reports relating to the understanding and management of
B.C.’s water resources. The series communicates scientific knowledge gained through water science programs
across B.C. government, as well as scientific partners working in collaboration with provincial staff. For additional
information visit: http://www2.gov.bc.ca/gov/content/environment/air-land-water/water/water-science-
data/water-science-series.

ISBN: 978-0-7726-7890-4
Citation:
Bennett, T., I. Bystron, P. Lapcevic, M. Wainwright, and T. Diep, 2021. Analysis of Current Groundwater Use in the
    West Coast Region, British Columbia. Water Science Series WSS2021-01, Province of British Columbia, Victoria
Author’s Affiliation:
1
 Tim Bennett, M.Sc., P.Eng.; Ismena Bystron, M.Sc, Tommy Diep, B.A.
Hatfield Consultants
250-800 Harbour Side Drive
North Vancouver, BC
V7P 0A3

2
 Pat Lapcevic, M.Sc., P.Geo
Ministry of Forests, Lands, Natural resource Operations and Rural Development
2080A Labieux Road
Nanaimo, BC
V9T 6J9

3
 Megan Wainwright, B.Sc., A.Ag.
Ministry of Forests, Lands, Natural resource Operations and Rural Development
2100 Labieux Road
Nanaimo, BC
V9T 6E9

© Copyright 2021
Cover Photographs:
Tommy Diep, 2018.
Acknowledgements
Funding for this study was provided by the Ministry of Forests, Lands, Natural Resource Operations and
Rural Development (FLNR).
We would like to thank numerous people for their support and feedback: Sarah Johnstone from Hatfield
Consultants; Raj Lalla, Tanya Dunlop, Sylvia Barroso and Klaus Rathfelder from B.C. Ministry of Forests,
Lands, Natural Resource Operations and Rural Development and the Ministry of Environment and
Climate Change Strategy; and Lynne Magee from Island Health.

    Disclaimer: The use of any trade, firm, or corporation names in this publication is for the information and convenience of
    the reader. Such use does not constitute an official endorsement or approval by the Government of British Columbia of
    any product or service to the exclusion of any others that may also be suitable. Contents of this report are presented for
    discussion purposes only. Funding assistance does not imply endorsement of any statements or information contained
    herein by the Government of British Columbia.

    WATER SCIENCE SERIES No. 2021-01                                                                                             i
EXECUTIVE SUMMARY

A desktop study was completed to estimate groundwater demand by water use purpose and aquifer,
and to estimate the number of properties which may require groundwater licences, for water
management precincts within the West Coast Region of British Columbia.
This study is an update of a previous study completed in 2015 on behalf of the Ministry of Forests,
Lands, Natural Resource Operations and Rural Development (FLNR). The aim of the original study was to
gain an understanding of groundwater usage in the West Coast Region in advance of new Water
Sustainability Act (WSA) requirements for groundwater licensing of non-domestic users. Pertinent
information was compiled and integrated from a variety of data sources including: BC Assessment
Authority Data (parcel/property information), municipal water service areas, groundwater and surface
water licences, Island Health water supply system data, inventory of land-based aquaculture
(hatcheries) facilities, registered groundwater wells, and mapped aquifers. In this study, an inferred
groundwater user was defined as a groundwater user on an occupied lot with one or more registered
wells and no other identified source of water (e.g., outside of a municipal water source and does not
have an existing surface water licence). A potential groundwater user was defined as a groundwater
user on an occupied lot that does not have any registered wells, and no identified alternate water
source (e.g., outside of a municipal water source and does not have an existing water licence).
The results indicate that there are 3,306 inferred groundwater users potentially requiring groundwater
licences within the West Coast Region. These groundwater users include 2,775 individual non-vacant,
non-residential lots with registered wells and no other identified water source (out of 307,000 lots
within the Region). An estimated additional 513 and 18 transitioning groundwater licences may be
expected for water supply systems and aquaculture, respectively. Over 90% of the anticipated number
of groundwater applications are in the following five water management precincts: Nanaimo, Victoria,
Duncan, Shawnigan and Courtenay. Over 50% of these applications would be expected to be for
agricultural uses.
Water use purposes associated with the largest groundwater demands estimated in the region (by
volume) are aquaculture (39%), followed by water supply systems (34%) and agriculture (20%). If
supplied solely by groundwater, these uses could constitute at least 90% of the total anticipated
groundwater demand in the West Coast Region. The water management precincts with the highest
groundwater demand are Nanaimo and Duncan, followed by Courtenay and Alberni. Approximately 75%
of the total groundwater demand in the Region is found in these four precincts.
Finally, in 38 out of the 229 classified aquifers in the Region the potential annual groundwater demand
exceeds more than 50% of the estimated annual recharge volume to the aquifer. In these aquifers,
more detailed information and analysis (e.g. development of an aquifer water budget) will be required
prior to authorizing the use of additional groundwater to ensure that long-term impacts to the
groundwater resource are understood.

 WATER SCIENCE SERIES No. 2021-01                                                                         ii
CONTENTS

EXECUTIVE SUMMARY .................................................................................................................................. II
CONTENTS .................................................................................................................................................... III
LIST OF FIGURES ........................................................................................................................................... IV
LIST OF TABLES ............................................................................................................................................. IV
LIST OF APPENDICES .................................................................................................................................... IV
1. INTRODUCTION..................................................................................................................................... 1
     1.1 BACKGROUND ................................................................................................................................. 1
2. STUDY AREA .......................................................................................................................................... 2
3. METHODOLOGY .................................................................................................................................... 4
     3.1 DEVELOPMENT OF A GIS INVENTORY OF GROUNDWATER USERS ............................................................. 4
           3.1.1 Data Sources and Compilation ....................................................................................... 4
           3.1.2 Geoprocessing Workflow ............................................................................................. 14
     3.2 GROUNDWATER DEMAND QUANTIFICATION ...................................................................................... 14
           3.2.1 Inferred and Potential Groundwater Users ................................................................. 15
           3.2.2 Assigned Groundwater Demand by Lot Use ................................................................ 16
           3.2.3 Potential Groundwater Demand for Major Users ....................................................... 22
           3.2.4 Water Precinct and Aquifer Ranking by Groundwater Demand.................................. 24
     3.3 TRANSITIONING GROUNDWATER LICENSING WORKLOAD ..................................................................... 25
4. RESULTS AND DISCUSSION ................................................................................................................. 27
     4.1 GROUNDWATER DEMAND............................................................................................................... 27
     4.2 AQUIFER DEMAND ......................................................................................................................... 29
     4.3 TRANSITIONING GROUNDWATER LICENCE WORKLOAD ........................................................................ 36
     4.4 ANALYSIS LIMITATIONS ................................................................................................................... 39
5. CONCLUSIONS ..................................................................................................................................... 40
     5.1 RECOMMENDATIONS ..................................................................................................................... 40
REFERENCES ................................................................................................................................................ 41
APPENDICES ................................................................................................................................................ 43
     APPENDIX A1: BRITISH COLUMBIA ASSESSMENT AUTHORITY (BCAA) ACTUAL USE CODES (AUC) .................... 43
     APPENDIX A2: BC AQUIFER SUBTYPE DESCRIPTIONS .................................................................................. 45

 WATER SCIENCE SERIES No. 2021-01                                                                                                                              iii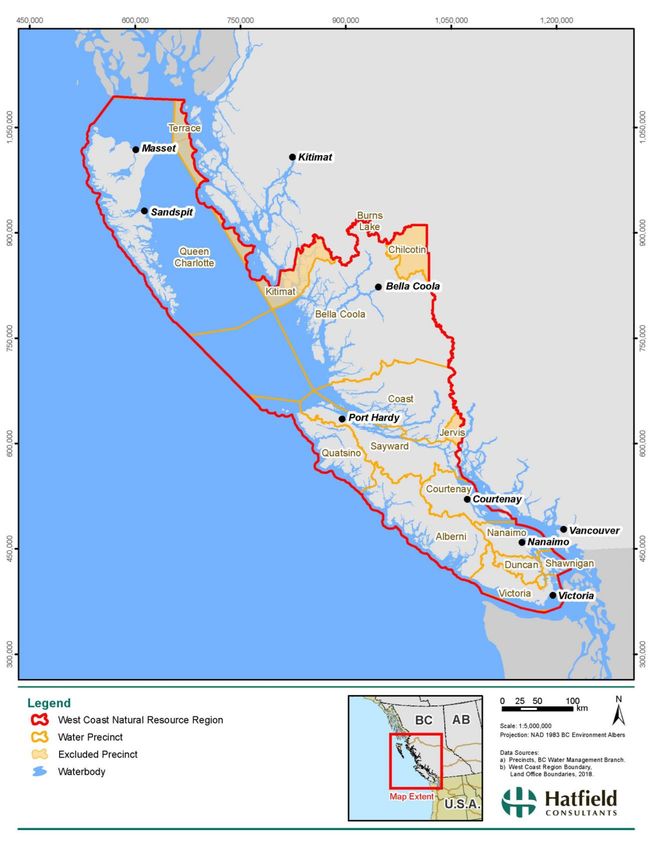
LIST OF FIGURES

Figure 1: FLNR West Coast Region Administrative Boundaries. .................................................................................. 3
Figure 2: Identified municipal water service area (MSA) data for the South Vancouver Island and the
          Southern Gulf Islands.................................................................................................................................... 7
Figure 3: Distribution of surface water and groundwater licence points of diversion in a portion of the
          study area. .................................................................................................................................................... 8
Figure 4: Locations of registered wells from the GWELLS database in a portion of the study area. ......................... 10
Figure 5: Example of registered, potable water supply systems with groundwater sources. ................................... 11
Figure 6: Example showing mapped aquifers in Southern Vancouver Island and the Gulf Islands. .......................... 13
Figure 7: Flowchart illustrating process to estimate which lots inferred and potential groundwater
          demand. ...................................................................................................................................................... 15
Figure 8: Flowchart illustrating work process to estimate number of inferred and potential groundwater
          users requiring a groundwater licence. ...................................................................................................... 26

LIST OF TABLES

Table 1:       Examples of BC Assessment Authority (BCAA) primary and actual use code descriptions. ......................... 5
Table 2:       Assigned groundwater demand by primary actual use code (AUC). .......................................................... 16
Table 3:       Surface water licence quantities associated with specific industrial operations in BC. ............................. 21
Table 4:       Summary of water systems regulated by Island Health using groundwater .............................................. 23
Table 5:       Inferred groundwater demand, by water precinct and water use sector (West Coast Region). ............... 28
Table 6:       Groundwater supply and demand, by aquifer. ........................................................................................... 30
Table 7:       Number of lots with registered wells and unknown water sources, by precinct. ...................................... 37
Table 8:       Anticipated number of transitioning groundwater licence applicants, by precinct and water use. .......... 38
Table 9:       Top five water precincts, ranked by demand, potential for high demand compared to recharge,
               and expected number of licences. .............................................................................................................. 39

LIST OF APPENDICES

Appendix A1: British Columbia Assessment Authority (BCAA) Actual Use Codes (AUC)
Appendix A2: BC Aquifer Subtype Descriptions

 WATER SCIENCE SERIES No. 2021-01                                                                                                                                        iv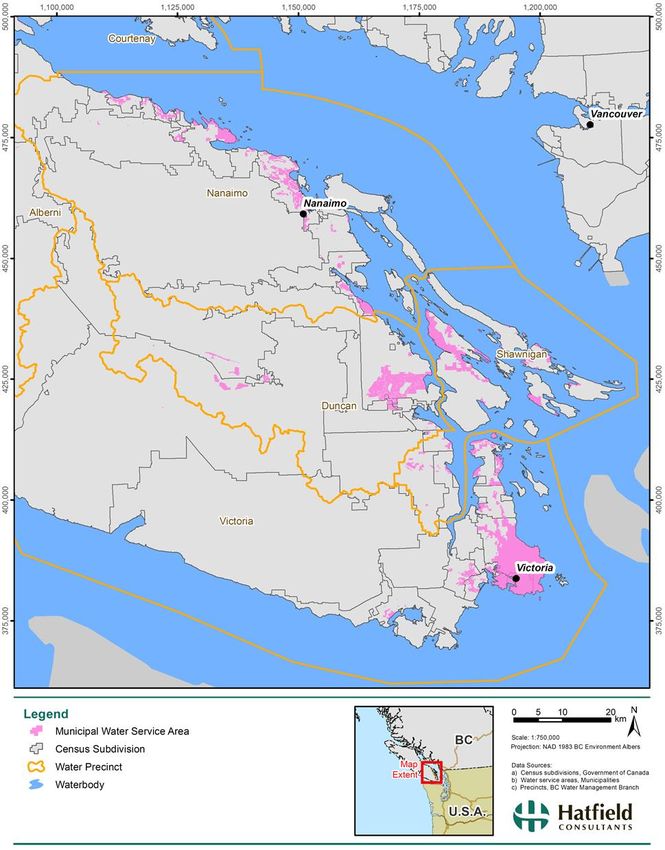
1. INTRODUCTION

Groundwater is an important resource in the West Coast Region of British Columbia (BC). The Region
consists of Vancouver Island, Haida Gwaii, the Gulf Islands, numerous smaller islands and a portion of
the central coast of mainland BC (Figure 1). Dug and drilled wells are used throughout the region to
supply groundwater for several purposes including urban and rural residential water supply,
aquaculture, agricultural, commercial, and industrial uses. In areas like the Gulf Islands, groundwater is
often the only viable source of freshwater. Additionally, groundwater provides base-flow to streams in
the region and ensures aquatic habitat is sustained during the dry season. Prior to 2016, groundwater
extraction did not require a water licence and only large users (75 L/s or more) were required to
complete an environmental assessment. Beginning in 2016 with the implementation of the Water
Sustainability Act, existing users of groundwater for all purposes except domestic (i.e., private homes)
are required to obtain a licence from the Province to continue extracting and using groundwater. Our
current understanding of the number of users and the volume of groundwater extraction from aquifers
in the region is limited. As demand for groundwater increases, we are particularly interested in
understanding the amount of groundwater currently being extracted from aquifers in the region and
whether this volume is sustainable. Additionally, groundwater extraction can reduce the amount of
base-flow in some streams and impact aquatic habitat.
This study is an updated version of an analysis conducted in 2015, which was completed to provide a
preliminary quantitative estimate of existing demand for groundwater in the West Coast Region, on
behalf of the Ministry of Forests, Lands, Natural Resource Operations and Rural Development (FLNR).
This study considers updated provincial data on lot occupancy and use, the results of recent water use
studies, additional Provincial data on the appurtenancy of surface water and groundwater licences, and
individual large groundwater users (i.e., aquaculture) in the Region.
The outcomes of this study include:
      •    Development of a methodology to estimate groundwater use using assessment data;
      •    Development of an updated GIS database which compiles groundwater use information in the
           Region;
      •    Identification of lots with inferred and potential groundwater use and the type of use;
      •    Estimation of potential total groundwater demand, by aquifer and water precinct;
      •    Estimation of the ratio of groundwater demand to inferred recharge, by aquifer; and
      •    Quantification of the inferred and potential existing groundwater users requiring a transitioning
           groundwater licence.

1.1       Background
The Water Sustainability Act (WSA) became legislation in BC in the spring of 2016. Under the WSA, as of
February 2016 all non-domestic users of groundwater in BC require an authorization to extract or divert
groundwater. Prior to the WSA being enacted, groundwater extraction and use was not regulated and
did not require a licence. The Water Sustainability Regulation requires existing groundwater users to
apply for a water licence prior to March 1, 2022. Up to this date, existing groundwater users can apply
for a “transitioning” water licence and obtain a precedence date based on the date they first began
using groundwater. This is important because BC assigns water rights based on a First-in-Time-First-in-
Right (FITFIR) system and enables groundwater users to be incorporated into the surface water licensing
system in a fair manner. The legislation excludes “domestic” groundwater users from the requirement
to apply for a water licence. A “domestic” groundwater user generally refers to a property owner that

 WATER SCIENCE SERIES No. 2021-01                                                                              1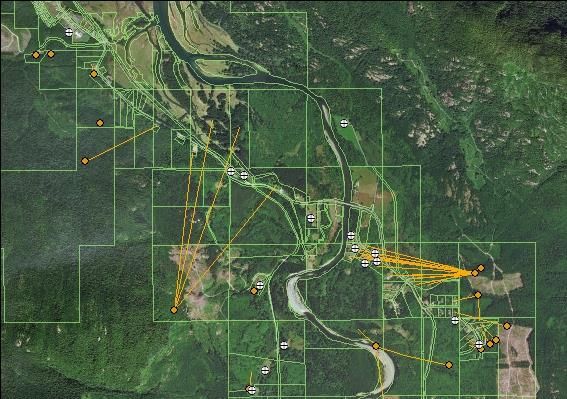
uses water for household purposes such as drinking water, food preparation, sanitation, fire prevention,
animals kept for household use or as pets, and irrigation of a garden no more than 1000 m2 (Province of
BC, 2016).
In advance of groundwater licensing for non-domestic users FLNR commissioned a study to better
understand groundwater use in the West Coast Region. The aim of that study was to provide a
preliminary (relative) indication of groundwater demand in different sectors, water precincts, and
aquifers, and to estimate the number of potential applications for a groundwater licence from existing
users. Completed in 2015, the study involved a Geographic Information System (GIS) analysis to identify
lots which may be using groundwater in the West Coast Region based on information from a variety of
data sources (e.g., BC Assessment Authority Data, municipal water service areas, surface water licence
data, Island Health water supply system data, and documented groundwater wells and aquifers).
Inferred groundwater demand was determined based on lot use and was used to estimate groundwater
demand to recharge ratios by aquifer. Finally, the number of expected groundwater licence applications
was estimated based on the number of non-domestic and non-vacant lots which were inferred to rely
on groundwater for their water supply.
This study represents an update to the original (2015) study and incorporates data that is accurate up to
November 2018.

2. STUDY AREA

FLNR’s West Coast Natural Resource Region and the Study Area are shown in Figure 1. The West Coast Natural
Resource Region encompasses Vancouver Island, Gulf Islands, Haida Gwaii, and a portion of the western British
Columbia mainland (shown in red in Figure 1). The Study Area comprises the Water Management Precincts
within the West Coast Region, which the exception of those precincts that are only partially within the West
Coast Natural Resource Region (i.e., Jervis, Burns Lake, Kitimat, Terrace, and Chilcotin, because some of the
Water Management Precinct boundaries are not consistent with the Natural Resource Region boundary).
The population of the Study Area is approximately 800,000 residents, with most residents residing in the
cities of Victoria, Nanaimo, and Duncan.

 WATER SCIENCE SERIES No. 2021-01                                                                           2
Figure 1: FLNR West Coast Region Administrative Boundaries.

 WATER SCIENCE SERIES No. 2021-01                             3
3. METHODOLOGY

The study approach included:
    •   Development of a GIS inventory of parcel lots with inferred or potential groundwater use;
    •   Assignment of groundwater demand by type of water use, and estimation of total groundwater
        demand (by Region, water precinct, and aquifer);
    •   Determination of the relative groundwater demand to potential available supply in each aquifer;
        and
    •   Identification of the potential number of lots requiring a transitioning groundwater licence.
Where information was limited, a conservative approach was applied to estimate the number of lots,
users, and groundwater demand. These steps are outlined in greater detail below.

3.1 Development of a GIS Inventory of Groundwater Users
A GIS inventory of parcel lots with inferred or potential groundwater use, and the estimated type of
water use, was developed by:
    •   Compiling data pertinent to lot use and associated water sources; and
    •   Applying a geospatial workflow to identify occupied lots with registered wells, or without
        registered wells and no alternate documented source of water supply.

3.1.1 Data Sources and Compilation
Several data sources were acquired and compiled as input to conduct the GIS analysis. Some of the
primary datasets and/or data source types are listed below and described in the following sections:
    •   BC Assessment Authority Data (BCAA);
    •   Water precinct boundaries;
    •   Regional District/Municipal Water Service Areas;
    •   Surface and groundwater licences and pending applications;
    •   Documented groundwater wells (Provincial GWELLS database);
    •   Mapped BC aquifers (as of 2018);
    •   Island Health water supply systems data; and
    •   Inventory of land-based freshwater aquaculture facilities (hatcheries) registered with the
        Ministry of Environment under the Land Based Fin Fish Waste Control Regulation.
The datasets mentioned above, except for the Island Health water supply system data, were all provided
by FLNR in March 2018. It is noted that some of the datasets utilized in this study are living datasets
which are revised and updated continuously. The Island Health and aquaculture dataset are current as
of October 2018.
BC Assessment Authority Data
British Columbia’s Assessment Authority (BCAA) maintains a dataset based on the province’s legal
cadastral fabric (i.e., property boundaries). This study utilized the attribute information from this
dataset to identify individual lots based on their associated land use. Primary Actual Use Codes (AUCs)
were used to separate the parcel fabric into specific categories of land use, and to identify occupied lots.
The listing of AUCs is extensive and is attached as Appendix A1. A sampling of the AUC descriptions is
listed in Table 1.

 WATER SCIENCE SERIES No. 2021-01                                                                          4
AUCs influenced the geospatial workflow and results significantly, so many of the assumptions and
limitations associated with these analyses are associated with the BCAA dataset. The workflow relies on
the codes for determinations such as excluding parcels (e.g., all “vacant” coded parcels), assigning
groundwater demand estimates, and estimating the number of expected groundwater licence
applications. However, these codes can be missing for some parcels (not included in the BCAA dataset or
not able to be linked to the cadastral fabric), and land use may be misrepresented or not fully described.
For example, AUCs denote the primary purpose or activity for which a property is being used for, but
there may be other uses on the property not captured in the single AUC identified for each parcel (e.g., a
“residential” coded parcel may also have uses that would require a groundwater licence).
Table 1: Examples of BC Assessment Authority (BCAA) primary and actual use code descriptions.
Use Category Primary Actual Use Code Description
000 Single Family Dwelling
032 Residential Dwelling with Suite
Residential 050 Multi-Family (Apartment Block)
057 Stratified Rental Townhouse
070 2 Acres or More (Outbuilding)
111 Grain & Forage (Vacant)
Farm 140 Small Fruits
170 Poultry
200 Store(s) And Service Commercial
205 Big Box
213 Shopping Centre (Regional)
Commercial
220 Automobile Dealership
276 Lumber Yard or Building Supplies
240 Greenhouses and Nurseries (Not Farm Class)
Unknown 300 Stratified Operational Facility Areas
402 Meat & Poultry
Industrial 417 Plywood Mills
446 Cement Plants
560 Water Distribution Systems
Transport / Utilities
570 Irrigation Systems
610 Parks & Playing Fields
Civic, Institutional &
612 Golf Courses
Recreational
650 Schools & Universities, College or Technical Schools
WATER SCIENCE SERIES No. 2021-01 5Regional District/Municipal Water Service Area (MSA) Data Several regional districts and municipalities were approached to obtain data regarding their Municipal Water Service Areas (MSAs). All data made available by municipalities or regional districts were gathered and compiled into a single reference water service area dataset (Figure 2). The water service area dataset is limited and incomplete, as not all municipal data could be obtained. Where the areal extent of the water service area was unavailable (e.g., not readily available, compiled, or in digital format for some municipalities), the water service area for that municipality was inferred from the extent of identified residential areas on 1:50,000 scale National Topographic Data Base mapping. This dataset served as a proxy to the actual water service area, but it is recommended that this dataset be replaced with actual MSA boundaries in future analyses. The light pink areas depicted in Figure 2 provide an illustration of compiled water service areas for the southern portion of the West Coast Region. All lots within a water service area were excluded as a potential groundwater user or licensee based on their inferred access to an established water supply, which may underestimate the actual groundwater use. However, water suppliers (including private, municipal, or regional districts) whose water source includes groundwater were captured as a large groundwater user or potential licensee. Water suppliers and their potential for groundwater use were evaluated by considering Island Health (IH) data (see subsequent section on IH potable water sources). Provincial Surface Water Point of Diversions and Groundwater Licence Data FLNR provided three spatial datasets containing water licence information (points of diversions [PODs], groundwater licences, and groundwater licence applications; Figure 3). The PODs were associated with land parcels (via Parcel Identification Number), and the groundwater points represent wells or well fields (by Well Tag Number [WTN]) or other groundwater diversion (e.g., dugouts). Land parcels associated with a groundwater or surface water licence were assumed to not require a groundwater licence. The surface water licence database only included ‘active’ licences. FLNR also provided a dataset of parcels to which a surface water licence is appurtenant. This dataset assists in identifying parcels supplied with water from a source outside of the lot boundary. This dataset was incomplete at the time of this study’s analysis. WATER SCIENCE SERIES No. 2021-01 6
Figure 2: Identified municipal water service area (MSA) data for the South Vancouver Island and the Southern Gulf
          Islands.

 WATER SCIENCE SERIES No. 2021-01                                                                               7
Figure 3: Distribution of surface water and groundwater licence points of diversion in a portion of the study area. WATER SCIENCE SERIES No. 2021-01 8
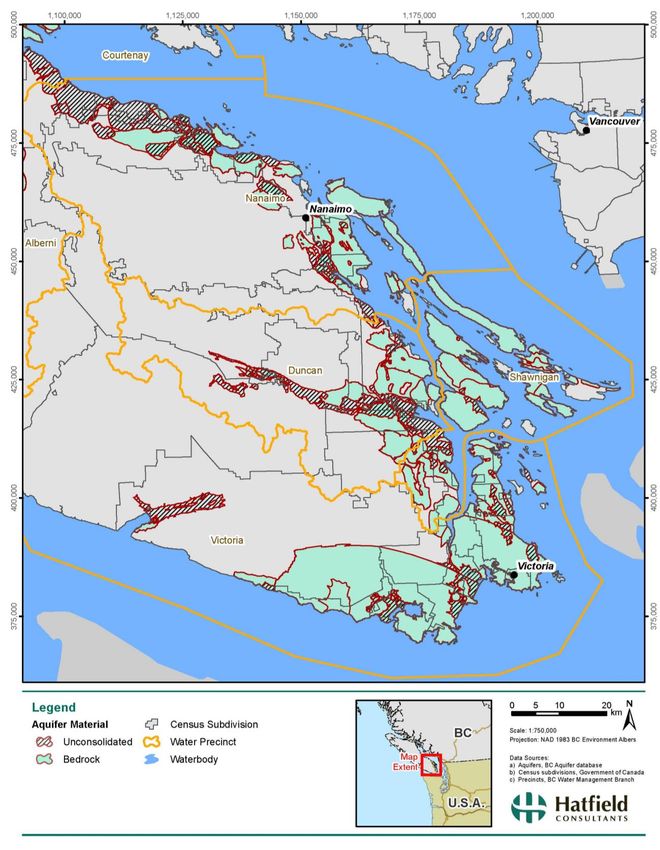
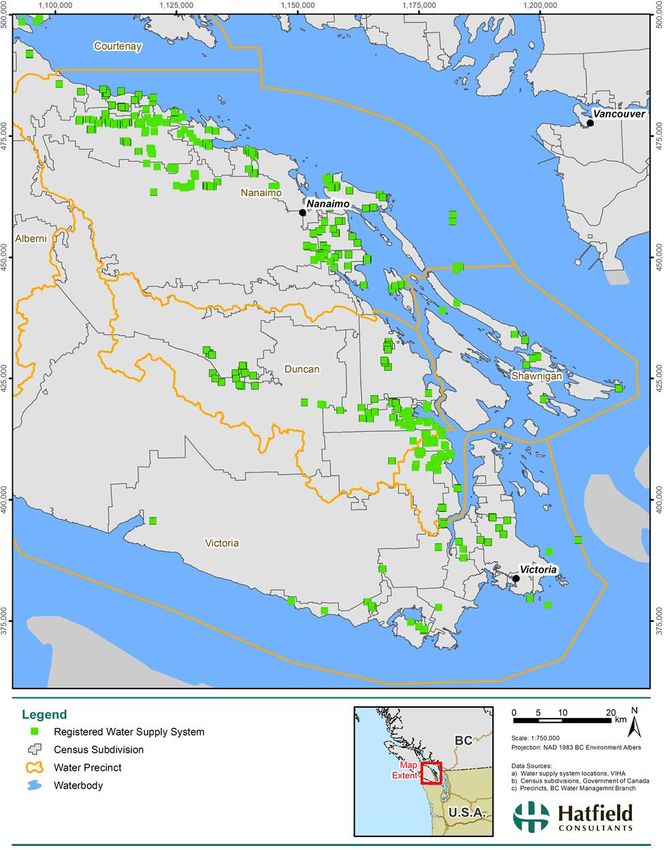
Provincial GWELLS Data
The GWELLS database provides a record of registered wells in the province, along with general
information about those wells largely based on drillers’ well construction reports (e.g., well location,
static water level, well yield, etc.). The Province provided a filtered point dataset from this database,
which excluded duplicate wells with overlapping coordinates. This dataset was generated on March 8,
2018 and at the time included over 35,000 unique wells within the West Coast region. This dataset was
incorporated into the GIS methodology to correlate the location of registered wells to lots (BC Ministry
of Environment, 2011). Figure 4 provides an illustration of the registered well locations within the
southern portion of the study area. The known limitations of the GWELLS dataset include: the database
may underestimate the number of wells in the region because well record submission by drillers and
well owners has been voluntary until 2016; well location information varies in degree of accuracy (e.g.,
in some cases the well may be located incorrectly); and, the database may not represent the current
status of wells that may be deactivated or no longer in use. The dataset did not include information
regarding the well use (e.g., commercial, industrial, domestic, irrigation, etc.) because this data field was
not populated historically. As a result, the type of well use was assigned based on the parcel’s BCAA
Primary Actual Use Code.
Properties with one or more registered wells were considered inferred groundwater users, unless the
property fell within an MSA.
Island Health Water Supply Systems Data
Under the Drinking Water Protection Act, water supply systems are defined as domestic water systems
other than those serving a single-family residence and those excluded by regulation. Island Health (IH)
maintains a database of registered water supply systems ranging from small (e.g., a small commercial
facility) to large systems (e.g., hotels, municipal water supply). The IH dataset provided is current as of
November 28, 2018 and includes information such as the location of well or surface water diversion,
water source (e.g., surface water, groundwater) and the number of connections (e.g., 2-14, 15-300, 301-
10,000, 10,001-20,000 and > 20,000). The 2018 IH dataset was incomplete, with numerous systems
identified but without detailed information regarding source, number of connections, or location.
Missing information from the 2018 dataset (e.g., water source, coordinates) was supplemented with
additional data from the following sources: the 2015 VIHA water supply system data, web searches for
the location of facilities with large connections (>300 connections), and a FLNR spreadsheet that
associates groundwater wells to drinking water systems created as part of a project in the 2000’s known
as the Drinking Water Inventory Management Project (DWIMP). The final improved dataset had 513
groundwater systems with known locations, which were incorporated into the analysis.
Figure 5 illustrates a portion of the locations and sources of water supply systems in the Southern
Vancouver Island study area. The point data shows the location and its attributes indicate type of source
and the number of water supply systems of various sizes. This dataset does not directly indicate which
properties are connected to the water source. It was noted that in more densely populated areas the
systems are often larger and/or more numerous. For the purposes of quantifying groundwater use
associated with the water supply systems, it was assumed that the water supply systems serve lots
within identified MSAs.

 WATER SCIENCE SERIES No. 2021-01                                                                           9
Figure 4: Locations of registered wells from the GWELLS database in a portion of the study area.

 WATER SCIENCE SERIES No. 2021-01                                                                  10
Figure 5: Example of registered, potable water supply systems with groundwater sources.

 WATER SCIENCE SERIES No. 2021-01                                                         11
Provincial Water Precincts Data
Water precincts represent jurisdictional areas within a provincial Water District and were created by
BC’s Water Management Branch for administrative purposes. The precincts dataset was used to group
the results (e.g., groundwater demand, number of potential water licence applicants, etc.).
Provincial Aquifer Dataset
The provincial dataset includes mapped and classified aquifers in the region (Figure 6). Most aquifer
boundaries are delineated based on area of development at the time they are mapped, inferred
presence of groundwater divides, or mapped or inferred boundaries of the geologic units. It is important
to note that aquifers exist in three dimensions and overlying multi-aquifer systems may result in
overlapping aquifer boundaries when displayed on a two-dimensional map or landscape. The dataset
used was provided by FLNR in March 2018, but there have been many new aquifers mapped in the
Region since that time (e.g., in the Queen Charlotte precinct) that are not included in this study.
Aquifers are classified in accordance with provincial methodology (Kreye et al. 1994; Berardinucci and
Ronneseth 2002). The dataset attributes correspond to the classification scheme and include aquifer
boundaries and areal extent, degree of aquifer development, vulnerability, aquifer productivity, and
aquifer demand. From this dataset, the aquifer areal extents were used to estimate potential recharge
to each aquifer. A groundwater demand vs potential aquifer recharge ratio was estimated on an aquifer
basis. Under the BC Aquifer Classification System, aquifer demand is subjectively and qualitatively based
on the density and distribution of wells at the time of mapping. In this study, groundwater demand is
quantitatively estimated using a GIS exercise which may differ from the BC Aquifer Classification System.
BC aquifers have also been assigned a subtype based on depositional environment and aquifer
properties (Wei et al., 2009). The descriptions of the subtype codes can be found in Appendix A2.
Provincial Aquaculture Data
Hatcheries in the West Coast Region are known to be large groundwater users for their operations. FLNR
conducted a desktop review of 46 land-based hatcheries and provided tabular data which included
licensed and application volumes, associated aquifer numbers (where known), and estimated
groundwater consumption volumes for hatcheries presumed to be in operation (Wainwright, 2019). The
review found an estimated 25 active land-based hatcheries that are assumed to be using groundwater.
Hatcheries with associated surface water licences were not considered in the assessment of
groundwater demand. This dataset is unverified (i.e., hatchery facilities were not contacted to confirm
current groundwater use), and may have changed since this analysis was conducted.
Agricultural Water Demand Model Studies
Agricultural water demand models have been completed for the regional districts of Comox Valley,
Cowichan Valley, Nanaimo, and Salt Spring Island (van der Gulik et al., 2013a; van der Gulik et al., 2013b;
van der Gulik et al., 2014; Tam and van der Gulik, 2017). These reports model agricultural water
demand on a parcel basis within a given district by incorporating soil, climate, crop type, and irrigation
data. The modelling reports provide surface water and groundwater irrigation demands in a dry (2003
data) and wet (1997 data) year on an aquifer basis. For the purpose of this study, the groundwater
irrigation demands in a dry year are matched to our inventory of aquifers. It is noted that these
groundwater irrigation demand values were calculated based on aquifer information at the time. The
reports referred to aquifer locations and not aquifer numbers or names, so the demands were matched
as best as possible to one or more aquifers when aquifer locations could not be further verified. As such,
the estimated demands in some aquifers may be over-estimated (adopting a conservative approach).

 WATER SCIENCE SERIES No. 2021-01                                                                        12
Figure 6: Example showing mapped aquifers in Southern Vancouver Island and the Gulf Islands.

 WATER SCIENCE SERIES No. 2021-01                                                              13
3.1.2 Geoprocessing Workflow
A GIS workflow was developed within the ArcGIS 10.5 environment to establish a relationship between
the cadastre and water use information. This workflow forms the linkage between cadastre, lot
occupancy, lot area, type of lot and inferred water use, lots with registered wells, lots that a surface
water or groundwater licence is appurtenant to, and lots within a water service area. The results from
this process generated a large data file in .csv format which summarized this information for all lots in
the study area.
The workflow began with a process that appends a BCAA AUC to each parcel in the cadastre feature
class and prepared the database for further analysis, including removing features outside the West
Coast Project area. There was an intermediate step performing a spatial join between the parcel data
and four separate datasets which represented both surface and groundwater licences (surface water
point of diversions, groundwater licences, groundwater licence applications and land parcels with water
licences). This new integrated dataset contained information representative of the current water
licences and was used to identify parcels with no associated water licences. Subsequent steps involved
performing a spatial join between the cadastral layer and each thematic layer within the study area –
groundwater or surface water licences, water service area, and groundwater wells. As a result, the
target parcel dataset inherited the attributes from the other key thematic layers based on a common
spatial reference.
When this workflow was complete, the resulting dataset contained an explicit relationship for each
parcel, well, water service area, and surface or groundwater water right that could be queried and
summarized using Structure Query Language (SQL) commands. Data summaries generated through SQL
queries provide additional insight and characterization of the parcels by grouping the results
thematically (i.e., group inferred parcels by water precinct or by regional district, etc.). For this study,
water precincts were used to group the output results (i.e., the number of inferred lots per water
precinct), and the outputs from the SQL queries were used in further quantitative analysis.
In summary, the geoprocessing workflow was as follows:
    •   Create an empty table schema and join the AUC table and cadastre fabric;
    •   One-to-many records spatial join of output table with Aquifers spatial table;
    •   One-to-one record spatial join with Water Service Areas spatial table;
    •   One-to-one record spatial join with unique locations of Wells spatial table;
    •   One-to-one record spatial join with Points of Diversion spatial table; and
    •   SQL database queries on attribute tables to return counts by aquifer, and totals (sums) by
        aquifer.
The GIS exercise demonstrated the advantage of using the cadastre fabric as the basis of the analysis,
which allowed additional attributes (which may be incomplete, e.g., the GWELLS database) from
seemingly disparate layers to be added spatially. The resultant dataset is an inventory of lots with
inferred water use information, which can be used to identify candidate parcels for future groundwater
licensing.

3.2 Groundwater Demand Quantification
The groundwater demand within each water precinct and mapped aquifer was quantified to estimate
the ratio between groundwater demand and recharge on an aquifer basis. The total groundwater
demand (i.e., annual groundwater volume used) was calculated for all lots that are inferred or potential
groundwater users, based on individual lot use and known or estimated water use for specific major
water users (e.g., aquaculture, water supply), as described below. It should also be noted that domestic

 WATER SCIENCE SERIES No. 2021-01                                                                          14
groundwater users are included in the estimation of groundwater demand, whereas they are not
included in the estimation of potential number of groundwater licence applicants (e.g., licensing
workload characterization, discussed in subsequent sections).
3.2.1 Inferred and Potential Groundwater Users
Inferred groundwater users include those occupied lots with one or more registered well, and are not
within a MSA (it is assumed that if a surface water licence is appurtenant to a lot with a registered well,
the lot is drawing water from both surface and groundwater sources; Figure 7).
Potential groundwater users include those occupied lots that do not have registered wells, but have no
alternate documented water source (i.e., no surface water licences and they are outside of a MSA;
Figure 7).
Note: While the Water Sustainability Act does not authorize domestic groundwater use (i.e. private well owners using
groundwater for their home), it is possible to have a non-domestic user of groundwater source their water from a
residential lot.
Figure 7: Flowchart illustrating process to estimate which lots inferred and potential groundwater demand.
WATER SCIENCE SERIES No. 2021-01 153.2.2 Assigned Groundwater Demand by Lot Use
Groundwater demand for each water precinct or mapped aquifer was calculated based on the AUCs
assigned to each lot and associated groundwater consumption values estimated for those land uses. The
total groundwater demand was calculated for each occupied lot, irrespective of the number of wells on
the lot, as it was assumed that all wells provide water associated with the land use.
In addition to vacant lots, several land use types were assumed to have no associated water demand
and were assigned a groundwater demand of 0 m3/d. These land use types (and their AUC codes) are
listed below:
• Residential –residential or 2-acre outbuilding (20, 70), and parking (43);
• Commercial – parking lots (260), garages (262), storage and warehouses (272, 273, 274, 275),
marine facilities (280), sign or billboards (288);
• Industrial – storage plants (434, 435), pipelines (436), logging related land uses (426, 427), sand
and gravel (445), docks and wharves (478), and parking lots (490);
• Civic, Institutional and Recreational category – government reserves (615), cemeteries (642),
ranger stations (632), and recreational land (660); and
• Unknown land use (unknown AUC).
In addition, lots associated with AUC 403 (seafood) were not assigned a standard water demand, as the
consumption values for seafood-related industries (e.g., hatcheries) vary considerably with the size and
type of operation. It is assumed that these facilities are captured in the Aquaculture dataset.
Groundwater demand values assigned to the remaining lots (based on land use) and the total number of
those lots, are summarized in Table 2 below. The rationale for these assigned water quantities are
described in greater detail in the following sections.
Table 2: Assigned groundwater demand by primary actual use code (AUC).
Number of Non-vacant Lots
Water
Use Category Primary AUC (Number) Inferred Potential Consumption Units
groundwater groundwater Value
user (1) user (2)
Residential Single family dwelling (0), 12,757 49,360 2 m3/d
residential dwelling with suite
(32), 2 acre or more (single
family dwelling or duplex) (60)
Other multi-family 25 663 0.65 m3/d
Duplex (33, 34, 35, 41) 7,053 8,695 1.30 m3/d
Triplex (47) 4 11 1.95 m3/d
Fourplex (49) 0 17 2.6 m3/d
Row Housing (39, 52), 6 102 9.7 m3/d
condominiums (30), apartment
blocks (50)
High-rise (54) 0 0 32.6 m3/d
WATER SCIENCE SERIES No. 2021-01 16Table 2: (Cont’d.)
Number of Non-vacant Lots
Water
Use Category Primary AUC (Number) Inferred Potential Consumption Units
groundwater groundwater Value
user (1) user (2)
Farm Grain & forage (110), mixed 1,075 914 18.4(3) m3/ha
(180), other (190), small fruits /d
(140), tree fruits (130), vegetable
(120)
Beef (150), dairy (160) 174 158 5 m3/d
Poultry (170) 86 77 5 m3/d
Commercial Mixed commercial and 81 448 30 m3/d
administration
e.g., stores and service
commercial (200), stores and
living quarters (202), stores
and/or offices with apartments
(203), stores and offices (204),
office buildings (208)
Shopping centers 20 68 30 m3/d
e.g., regional shopping centres
(213), retail strips (214), big box
(205)
Rental units 116 302 20 m3/d
e.g., hotels (230), motels (232,
223), manufactured home park
(224), campgrounds (236), bed &
breakfasts (4+ units) (237),
resorts (238)
Bed & breakfasts (Table 2: (Cont’d.)
Number of Non-vacant Lots
Water
Use Category Primary AUC (Number) Inferred Potential Consumption Units
groundwater groundwater Value
user (1) user (2)
Marine and navigational 15 52 30 m3/d
facilities (505), bus company
(510), airports and heliports
Transportation, (515)
communication Other 56 585 5 m3/d
and utilities e.g., railway (500), telephone
(520), gas distribution systems
(550), electrical power systems
(580)
Civic, 593 15,830 (7) 40 (5) m3/d
institutional & Parks and playing fields (610)
recreational 2.1 (6) m3/d/
ha
Schools and universities (650), 58 253 15 m3/d
churches & bible schools (652)
Government buildings (620) and 56 203 30 m3/d
recreational and cultural
buildings (600)
Golf courses (612) 15 13 160 m3/d
Hospitals (640) 1 16 150 m3/d
Other 52 111 5 m3/d
e.g., campgrounds (614), works
yards (630)
Notes:
1. Lots with registered wells or active licences, outside of an MSA and non-vacant.
2. Lots with unknown water sources, outside of an MSA and non-vacant (not used in demand calculations)
3. Farm irrigation category assigned values based on standard irrigation duty, except where data was available for specific
aquifers from the Agricultural Water Use Demand Models.
4. Water consumption assigned by FLNR estimates for individual facilities. Number of lots shown for reference only.
5. Lots with unknown area size were assigned an average calculated water consumption value.
6. Lots with known area size were assigned a demand of 2.1 m3/d/ha to 35% of the lot area.
7. Although these are potential groundwater users, it is assumed that the majority of these would not be not irrigated.
WATER SCIENCE SERIES No. 2021-01 18Residential Residential water use was estimated to be 2 m3/d for single family residential lots, and for other multifamily residential lots the water use ranged from 0.65 to 32 m3/d. The single-family dwelling value of 2 m3/d was based on discussion with FLNR West Coast Region water allocation staff (i.e., 2 m3/day is typically allocated for domestic purpose). Domestic purpose (as defined in the WSA), includes household purposes and fire prevention, water for animals or poultry for household use or as pets, and irrigation of a garden not exceeding 1000 m2. The multifamily residential lot value of 0.651 m3/d was based on an average household size of 2.2 people as per the 2016 census (Statistics Canada, 2017), and average residential water consumption of 261 Litres per day per person (Statistics Canada, 2013). The water consumption value (0.651 m3/d) was multiplied by two (2) for duplexes, three (3) for triplexes, four (4) for fourplexes, fifteen (15) for row housing, condominiums and apartment blocks, and fifty (50) for high-rises. Under the BC Homeowner Protection Act, the average number of units per new registered multifamily residential buildings was 14.5 in 2016 (BC Housing, 2016). The Capital Regional District (Victoria) saw one of the largest increases in BC of registered buildings with 50+ units in 2017 (BC Housing, 2017). The water consumption value was multiplied by 50 for the minimum number of units in a high-rise multifamily building. Farm (irrigation) For the assessment of aquifer-specific groundwater demand, irrigation demand was obtained from the agricultural water demand models completed for the Districts of Nanaimo, Cowichan, Comox and Salt Spring Island (van der Gulik, et al., 2013a; van der Gulik, et al., 2013b; van der Gulik, et al., 2014; Tam and van der Gulik, 2017). For the assessment of precinct groundwater demand and for aquifers not included in the agricultural water demand model studies, an irrigation rate of 18.4 m3/ha/d was used. This rate was based on the modelled irrigation demand of the total area irrigated (from both groundwater and surface water sources) in each study region (i.e., Districts of Nanaimo, Cowichan, Comox and Salt Spring Island), based on a dry year (2003). In the modelling studies the total irrigated area is assumed to be the crop (irrigable) area, not the total lot size. In addition, the length of the growing season for several crop types was considered. This calculation is conservative and may overestimate demand because a dry year (2003) was used, and it was assumed that all cropland is irrigated. The water consumption rate (18.4 m3/ha/d) was then used to estimate water use for lots assumed to be irrigating crops with groundwater by multiplying the rate by 65% of the total lot area. This calculation assumes that on average, only 65% of the lot area is used for agricultural irrigation. This value was based on a preliminary review of aerial imagery for randomly selected agricultural areas in the region. Farm (other uses) Beef and dairy farm lots were assigned a value of 5 m3/d, based on an assumed average water use of 45 Litres per day (Lpd) per cow (between 12.5 and 85 Lpd each) and an average BC ranch size of 109 cows (Canadian Beef, 2016; van der Gulik, et al., 2013a; van der Gulik, et al., 2013b; van der Gulik, et al., 2014; Tam and van der Gulik, 2017). Poultry water use values were assigned a value of 5 m3/d. This is an average value based on as assumed average water use of 0.225 Lpd per chicken (between 0.09 – 0.36 Lpd/chicken) and an average flock size of approximately 22,000 chickens (Agricultural and Agri-Food Canada, 2017; van der Gulik, et al., 2013a; van der Gulik, et al., 2013b; van der Gulik, et al., 2014; Tam and van der Gulik, 2017). WATER SCIENCE SERIES No. 2021-01 19
Commercial
The majority of occupied commercial properties (over 90%) with inferred or potential groundwater use
include the following AUCs:
    •   Stores and commercial services, stores and living quarters, stores and/or offices with
        apartments, office buildings;
    •   Automobile paint shops and garages, dealerships and lots; and
    •   Bed and breakfasts (4 units), campgrounds, seasonal resorts, hotels and motels.
Stores and office buildings were assigned a water use of 30 m3/d. This was based on a water
consumption of 60 L/ft2/year and average size of 175,000 ft2 (Real Property Association of Canada, 2011,
2013.
‘Bed and breakfast’ style properties with less than 4 units (comprising 20% of the lots) were assigned a
water use of 2 m3/d, based on an assumed occupancy of 8 full time residents and average water
consumption per person in Canada of 251 Lpd.
Larger rental properties (bed and breakfasts with 4 or more units, hotels, motels, resorts, etc.) were
assigned a water use of 20 m3/d. This was based on an estimated average of 50 rooms per property,
65% double occupancy rate, and 251 Lpd per person water consumption.
Shopping centres and senior assisted-living residences were assigned specific water use values based on
a large anticipated water use, although there are limited number of lots (Table 2).
Shopping centres were assigned a water use of 30 m3/d. This is based on an average daily water
consumption of 7,000 Gallons (EPA, 2007).
Senior’s residences were assigned a water use of 20 m3/d. This is based on British Columbia’s median
size of senior’s residences of 62 spaces (Canada Mortgage and Housing Corporation, 2014), and average
water consumption per person in Canada of 251 Lpd.
Other commercial properties, which only account for less than the remaining 10% of commercial lots,
were assigned a water use value of 5 m3/d.
Industrial
Specific industrial operations anticipated to have high water demands were assigned a water
consumption value based on an assessment of volumes allocated in surface water licences. The water
consumption value was based on the median licensed quantity for all surface water licences within BC
with the same purpose and/or licensees in the industry of interest. For example, the water consumption
value assigned to coal mining was based on the median quantity allocated in BC surface water licences
for ‘Mining (coal)’ purpose.
Seafood AUC parcels are shown in Table 2, however many of the parcels were assumed to overlap with
the Aquaculture dataset (see Section 3.2.3). In a separate analysis, water consumption values were
estimated by FLNR for 25 individual land-based hatcheries (i.e., groundwater demand was estimated for
each facility).
Median quantities selected as average values are weighted (biased) by the water use associated with
the largest licensed users. Surface water licence quantities associated with those specific industrial
operations and purposes are summarized in Table 3. Other industrial land uses (e.g., sawmill, cement
plants, wineries) were assigned a water consumption value of 100 m3/d.

 WATER SCIENCE SERIES No. 2021-01                                                                          20
Table 3: Surface water licence quantities associated with specific industrial operations in BC.
BCAA Land Surface Water Surface Water Licence Quantity (m3/d)
Number of
Industry Use Code Licence
Operations (1) Range Median Average
Category Purpose
Mining 7 Mining- 2,000 –
Mining (coal) 5,000 175,000
Washing (Coal) 1,200,000
Mining 94 Mining-
2 – 36,000 3,000 4,400
(non-coal) Processing Ore
1. The number of operations was estimated based on an evaluation of licences, purposes and licensees. For example, some water
licence quantities were consolidated and assumed to correspond to a single operation/facility based on the location and licensee.
Transportation, Communication and Utilities
Most of the occupied transportation, communication and utility properties with inferred or potential
groundwater use comprise the following AUCs:
• Railways;
• Electrical power systems;
• Water distribution systems;
• Telephone;
• Marine and navigational facilities;
• Airport and heliports; and
• Miscellaneous.
The majority of these AUCs are assumed to have no water use as mentioned in Section 3.2.2, with the
remainder of AUCs assigned a water use of 5 m3/d.
Marine and navigational facilities, airports, and heliports were assigned a water use value of 30 m3/d,
similar to the commercial building use.
Civic, Institutional and Recreational
The majority of occupied civic, institutional and recreational properties (over 90%) with inferred or
potential groundwater use include the following AUCs:
• Parks and playing fields;
• Schools and universities;
• Government buildings;
• Churches and bible schools;
• Recreational and cultural buildings;
• Campgrounds;
• Golf courses; and
• Hospitals.
Where the lot areas of parks and playing fields were not known, a water consumption value of 40 m3/d
was assigned. Otherwise, the water consumption value used was 2.1 m3/ha/day multiplied by 35% of the
lot area. The modelled annual water consumption for ‘Golf and Recreational Turf’ in the Districts of
Nanaimo, Cowichan and Comox were used to calculate the average water consumption value of
2.1 m3/ha/day (van der Gulik, et al., 2013a; van der Gulik, et al., 2013b; van der Gulik, et al., 2014). This
water use value was applied to 35% of the lot area assuming an average park size of 0.6 km2. This
calculation assumed that 35% of the park areas are irrigated, similar to a GIS exercise which had estimated
that 35% of the parks and playing fields at City of Vancouver are irrigated (Klein, pers. communication).
WATER SCIENCE SERIES No. 2021-01 21Schools and universities, churches, and bible schools were assigned an average water use of 15 m3/d. Student water consumption at schools ranged between 0.011 and 0.1 m3/d (3 and 23.6 Gallons per day) (Dziegielewski, et al., 2000; Santa Fe Water Division, 2009). School water usage is 7 m3/day based on an average 0.038 m3/d (10 Gallons per day) for an average of 173 students per school on Vancouver Island. University of Victoria (2011) reported a water consumption of nearly 700,000 m3/year from April 2009 to March 2010. Based on this, a university is expected to consume approximately 1,900 m3/d. Unfortunately, universities were not separated within the dataset so an average water use value of 15 m3/d was applied to all educational institutions. Government, recreational and cultural buildings were assigned a water use value of 30 m3/d, similar to the commercial building value. Golf courses were assigned a water consumption of 160 m3/d, based on an average golf course size of 50 acres (reported golf course areas range from 30 to 200 acres) and assumed irrigation of 8.4 m3/ha/year (equivalent to 1 acre-ft/acre/year). Hospitals were assigned a water use of 150 m3/d, based on an estimated 2,400 hospital beds in BC, and a water consumption of 44.8 m3/year (118,500 US Gallons/year) per hospital bed (Ontario Health Coalition, n.d., US Energy Information Administration, 2012). This water consumption value is for hospitals ranging in size from 18,580 to 46,450 m2 (200,000 to 500,000 ft2), which is suitable as the size of Nanaimo Regional General Hospital is currently 35,520 m2 (382,815 ft2) (Island Health, 2012). With 20 lots assigned an AUC code (640) corresponding to hospitals, this corresponds to approximately 150 m3/d/hospital. With the exception of the AUCs mentioned in Section 3.2.2 with a 0 m3/d, the remaining civic, institutional, and recreational use AUCs (i.e., campgrounds (614), work yards (630) and ski hills (654)) were assigned a value of 5 m3/d. 3.2.3 Potential Groundwater Demand for Major Users Aquaculture Aquaculture operations are one of the largest water users in the West Coast Region. Relatively high water demands for aquaculture operations often include a groundwater source. Groundwater is often preferentially selected (even when surface water is available) due to more desirable temperature and water quality parameters (which can include high salinity). Potential groundwater demand for aquaculture was assigned from tabulated data provided by FLNR. The tabulated data was based on the inventory of land-based freshwater aquaculture facilities (hatcheries) registered with the Ministry of Environment under the Land Based Fin Fish Waste Control Regulation, and did not include net pen facilities or hatcheries that use salt water in their operations or facilities that did not appear to be associated with water licences. Available information for each hatchery was reviewed and cross-referenced with hatchery discharge permit data, water licence information, well and aquifer data, aerial imagery, and web queries to assess and refine the groundwater withdrawal estimate for each hatchery. A dataset containing all Environmental Management Act (EMA) authorizations downloaded from the ENV website and groundwater application forms submitted by hatcheries provided supplementary information for the review. Factors used to indicate which hatcheries are likely withdrawing groundwater included whether the facility has a waste discharge permit, has at least one well on or near the property assumed to be associated with the hatchery (e.g., as indicated by information contained in the well drilling report), whether it appears their surface water licence may not provide sufficient volume for operations given the discharge permit volume (i.e., the facility is likely using a mix of groundwater and surface water), whether the facility has WATER SCIENCE SERIES No. 2021-01 22
You can also read