Exploring COVID-19 Transmission Risk and Vulnerability Through the Aotearoa Co-incidence Network (ACN)
←
→
Page content transcription
If your browser does not render page correctly, please read the page content below
Note: This paper has not yet undergone external peer review

Exploring COVID-19 Transmission Risk and
Vulnerability Through the Aotearoa Co-incidence
Network (ACN)
as at September 2, 2021, author list alphabetical

Emily P. Harvey1,2 , Matt Hobbs3,4 , Joshua Looker5 , Dion R.J. O’Neale1,6,* , Will
Scarrold1,6,7,8 , and Steven Martin Turnbull1,6,*
1 Te Pūnaha Matatini, University of Auckland, Auckland, Aotearoa New Zealand
2 M.E.  Research, Takapuna, Auckland, Aotearoa New Zealand
3 School of Health Sciences, University of Canterbury, Christchurch, Canterbury, Aotearoa New Zealand
4 GeoHealth Laboratory, University of Canterbury, Christchurch, Canterbury, Aotearoa New Zealand
5 Engineering Science, University of Auckland, Auckland, Aotearoa New Zealand
6 Physics Department, University of Auckland, Auckland, Aotearoa New Zealand
7 Mathematical Institute, University of Oxford, Oxford, United Kingdom
8 Institute for New Economic Thinking, Oxford Martin School, Oxford, United Kingdom
* Corresponding author e-mail addresses:d.oneale@auckalnd.ac.nz; s.turnbull@auckland.ac.nz

EXECUTIVE SUMMARY

The current study uses data from Aotearoa New Zealand’s Integrated Data Infrastructure (IDI) to create a co-incidence network
of workplace employment and school enrolment. The Aotearoa Co-incidence Network (ACN) provides a highly insightful tool
to explore the manner in which the regions of Aotearoa New Zealand are connected to each other through co-incidence of
individuals at workplaces and schools. We summarise the method used to create the ACN, and detail the ways in which it
can be used to inform the Aotearoa New Zealand response to disease outbreaks, such as COVID-19. Specifically, we show
how analysis of the network can be used to inform the strategy of mitigating existing outbreaks (“stamp-it-out”) by revealing
those sets of areas between which an outbreak is likely to spread most quickly. We also show how analysis of the network
structure can reveal spatially limited communities which can inform regional responses to disease outbreak (i.e., regional based
interventions) should they need to occur, as well as specific areas of high transmission risk — both of these results can be used
to aid a “prepare-for-it” strategy. Finally, we cross-reference our findings with data on disease vulnerabilities (i.e., long-term
health conditions, ethnicity, and deprivation) to highlight specific areas with a combination of high risk of contagious disease
transmission and elevated vulnerable to such diseases. A web-based app1 , developed alongside this publication allows for
visualisation and exploration of transmission risk and vulnerability and is presented as a useful tool for decision and policy
makers to inform more equitable responses to diseases such as COVID-19.
Not Externally Peer Reviewed

Key points:

    • The Aotearoa Co-incidence Network (ACN) represents the connections induced by interactions between individuals
      from dwellings in different regions of Aotearoa. The ACN details the number of connections made through shared
      workplaces and schools, which gives an indication of likely transmission spread should an outbreak of disease (e.g.,
      COVID-19) occur.

    • The ACN makes no assumptions about the likely point of occurrence for an initial outbreak. That is, the transmission
      risk represented is an estimate of the risk of onward transmission to a region, for an initial outbreak that occurs at an
      arbitrary location in the country. Clearly, some regions (e.g. those with MIQ facilities and international airports) are at
      higher risk of being locations for seeding an outbreak. Such additional information should be considered alongside the
      ACN.

    • We identify several spatially contiguous communities in the ACN based on the patterns of connections. Interestingly,
      these communities are similar to the Territorial Authority (TA) boundaries, with some exceptions. The communities tend
      the cover multiple TAs, and in some cases extend boundaries. For example, the community detected in the Auckland
      region covers Auckland TA but also extends further south. This community more closely reflects the actual region
      covered when Alert Level 3 was implemented in the Auckland region in August 2020.

    • We use PageRank centrality to highlight geospatial areas that have the highest transmission risk based on the structure
      of connections in the ACN. Cross-referencing transmission risk with data on vulnerability allows us take an equity-
      focused approach to determining areas most in need of support (be that from governmental, iwi, or community sources).

    • We find that the regions with highest risk for transmission are located in urban areas, especially Hamilton, Wellington,
      and Palmerston North. Areas of low-transmission risk include Thames-Coromandel, Mackenzie, and Waitomo.

    • When we consider the intersection of transmission risk and vulnerability, we find that the most at risk regions include
      places such as South Auckland, Invercargill, Whangārei, New Plymouth, and Napier, as well as Wellington and Hamilton.

Introduction
    Understanding how individuals form connections across geographic regions is an important goal when it comes to
understanding how society works. This challenge is especially relevant in the context of COVID-19, where efforts are
increasingly being made to understand where transmission occurs between individuals, which areas are most at risk in terms
of transmission, and which areas are most vulnerable as a consequence of transmission. Knowledge of how the connections
shared between individuals and regions in society can potentially shape transmission is valuable. Firstly, this information can
be used to inform a ‘prepare for it’ strategy, where forms of support, planning, and allocation of resources (such as increased
testing or vaccination roll-outs) are preemptively established to aid areas that may be deemed high risk. In Aotearoa New
Zealand, these kinds of strategies were demonstrated by the government itself, with its early introduction of border closures
and strong nationwide lockdown in response to COVID-19 in March, 2020. These strategies were also demonstrated by
specific communities themselves, with some iwi implementing roadblocks during the first community outbreak of COVID-19 in
Auckland to prevent further transmission to other regions2 . Knowledge of how individuals and regions are connected can also
aid ongoing responses to outbreaks as they unfold. These forms of ‘stamp-it-out’ strategies may include the implementation of
regional changes in ‘Alert Levels’ (i.e., mandated mask use, reduced gathering sizes, workplace and school closures).
    Network approaches can be used to provide detailed accounts of how individuals are connected and the interaction contexts
in which they operate, and thus help inform these prepare-for-it and stamp-it-out strategies. Networks can be created by
summarising connections between individuals in society depending on whether they share an interaction context where disease
transmission could take place, such as having the same workplace or school. Creating a network of this size and detail is
now possible with the advent of sources of ‘big data’ which allow researchers to document, explore, and interpret potential
interaction contexts at national level.
    In Aotearoa New Zealand, for example, individual-level micro-data is available that details physical places of employment
as well as the schools in which students are enrolled. Previous research has identified both of these contexts as key environments
where disease transmission takes place3, 4 . Thus, there is significant utility of these data on workplace employment and
education enrolment to inform strategic responses to outbreaks of infection disease. While confidentiality rules associated with
the use of this individual-level data can introduce some limitations, these data can be reported on at an aggregated level to
highlight the connections present between different geographic regions. Using these data, we are able to create a network of
‘co-incidences’, and detail the ways in which different areas of Aotearoa New Zealand are connected.

                                                                                                                          Page 2
Not Externally Peer Reviewed

    The following study, and associated web-based Shiny application1 , provides a detailed summary of how around 2000
different geographical areas of Aotearoa New Zealand, defined as Statistical Areas (SA2s), are connected to one another based
on the shared interactions of their inhabitants across different work and school contexts. The Aotearoa Co-incidence Network
(ACN) provides a nationally representative network where individuals are connected through all workplaces and schools.
Creating a network with this structure can be a complex process. However, the following study makes use of a methodology
that simplifies the network structure in a way that is computationally efficient and maintains the information required to inform
strategies to mitigate potential disease transmission. We are able to not only detail the specific connections between different
SA2s, but also explore properties of the ACN to identify SA2s and communities of SA2s that are most at risk of transmission.
    While understanding which areas of Aotearoa New Zealand are most at risk when it comes to transmission, in terms of
equity it is also important to identify which areas may be most vulnerable in terms of health/adverse complications should an
outbreak occur. We make use of a separate data set informed by Aotearoa New Zealand Ministry of Health guidelines, provided
by Wiki, Marek, Hobbs, Kingham and Campbell (2021)5 , to highlight spatial vulnerabilities to COVID-19. These vulnerabilities
are considered in terms of age (i.e., age 65+ being most vulnerable), long term health conditions, and socio-economic factors.
By cross-referencing our findings regarding SA2s which are have a higher risk of transmission with Wiki et al.’s5 findings on
vulnerability, we identify specific geographical locations that should be provided with increased support to contribute to an
equitable response to COVID-19.

Methodology
Data
    The source of data for the co-incidence network is obtained through the Aotearoa New Zealand Integrated Data Infrastructure
(IDI). The IDI is a collection of government data sets, operated by Tatauranga Aotearoa Statistics New Zealand, containing
micro-data from a range of sources linked at the level of individuals for the population of Aotearoa New Zealand. The ACN is
built from data regarding individuals shared employment in workplaces and enrolment in schools. Given the various group
nodes we include in the network, we draw upon several different data sources. We are able to derive information on nodes
representing individual and dwellings from the 2018 census. For workplace nodes with employee information, we use Inland
Revenue tax records. These records contain all employment records for an individual, allowing for possibility to represent
individuals with multiple jobs. We obtain data on schools school enrolment data provided by the Ministry of Education. This
includes information on primary school students up to high school (ages 5 to ∼ 17). Our data is limited in that it does not
include other sources that are harder to obtain. For example, inhabitants from different SA2s may also interact in community
events (e.g. supermarkets), on public transport, or at large public gatherings (e.g. concerts). We do not model these interactions,
but instead point to a separate project which does aim to do this6–8 . Despite the limitations of the data used, previous research
has identified workplaces4 and schools3 as key contexts for infectious disease transmission, highlighting the utility of the ACN.
    Data provided by the IDI (e.g., census and tax records) can only be accessed in a secure data-lab environment, and in order
to bring any of these data into the public domain various steps are required to ensure that any single individual or business
are not identifiable. There are numerous rules dictating how data must be transformed to ensure confidentiality. For the ACN,
we structure our data as an edge-list, where one geographic region is connected to another region via a weighted link that
corresponds to the number of shared connections inhabitants have through either working in the same workplace (physical
location), or through enrolment in the same school. Weights are suppressed when cell sizes are too low (when individuals or
underlying dwellings in the cell is fewer than 6), and each individual weighting is randomly rounded to base 3. While random
rounding is designed to preserve total counts and keep distributions relatively the same, suppression of values below 6 means
that information will be lost regarding rarer connections. This may limit the use of the ACN for a limited number of the smallest
rural areas, and smaller workplace sectors and schools where there are fewer individuals.
    The geographic regions we use to partition Aotearoa New Zealand are the Statistical Area 2 units from 2018 (henceforth
referred to as SA2s). SA2s are a part of the statistical geography hierarchy defined by Statistics New Zealand9 , and contain a
population numbering from fewer than 1,000 individuals (in more rural SA2s) to over 4,000 individuals (in more urban SA2s).
In the current study, we exclude SA2s defined as belonging to an ‘Area Outside Territorial Authority‘ (these mainly consist of
people living at sea) or the Chatham Islands (an isolated set of islands east of the South Island with a population of 600 people).
This leaves 2,147 SA2s in the final dataset.

Methods
    We begin by constructing a bipartite network (a network of two different node types) consisting of dwelling nodes in one set,
and workplace and school nodes in the other set. Each of these nodes has specific attributes. Dwelling nodes have a geographic
location, workplaces have a specific industry sector (ANZSIC0610 ), and schools have a type (primary, high school, intermediate
or composite). We create edges between the dwelling nodes and the workplace and school nodes where individuals from that
dwelling are employed or enrolled. This creates a network, as illustrated by the sketch in Figure 1:A.

                                                                                                                           Page 3
Not Externally Peer Reviewed
To simplify this network, we project it on to the dwelling nodes. In simple terms, this process involves drawing direct
edges between dwellings that were originally connected by a pair of edges linking them to a shared workplace or school. This
step is represented in Figure 1:B. In addition to making the network simpler, a benefit of this projection is the fact that it
removes workplace and school nodes from the network, allowing them to remain confidential. The confidentiality of workplaces
and schools (as well as individuals) is a requirement of extracting data from the IDI. It also allows us to make the regions
corresponding to an individual’s place of usual residence the focus of the analysis making it possible to directly compare with
vulnerability data.
The final step involves aggregating edges, between pairs of regions, at the level of the geographic regions in which
dwellings are located. This is highlighted in Figure 1:C. This step aggregates edges between dwellings located in both different
geographic regions (i.e., edges in C connecting two different squares), and also edges between dwellings located in the same
geographic location (i.e., the self-loop edge in the top left of C). For more information regarding the processing of data, see the
supplementary material (Appendix B).
The ACN in itself provides a highly insightful tool for understanding how Aotearoa New Zealand is connected through
employment and school enrolments. On a basic level, understanding how one specific geographic area connects to other parts
of Aotearoa New Zealand is extremely useful if there happens to be an outbreak of infectious disease in that area. Specifically,
this tool can inform policy and decision makers in terms of intervention strategies for pursuing elimination of an outbreak,
such as the ‘stamp-it-out’ strategy pursued in Aotearoa New Zealand. The ACN contributes to this strategy by providing an
understanding of which other areas may be at potential risk of onwards transmission resulting from interactions with individuals
from an area that has a known outbreak. We are also able to explore the structural properties of the ACN to glean further
insights about which SA2s are the most well-connected, how connections differ between urban and rural areas, and which
regions tend to be more closely connected.
In addition to providing an indication of the strength of connection between two specific SA2s, we also explore the structural
properties of the ACN to highlight patterns of connections between SA2s, and highlight which SA2s are the most connected in
Aotearoa New Zealand. We explore the use of community detection and centrality measures to identify specific communities of
spatial areas that may be used to define regional boundaries based on transmission risk, and further our understanding of areas
that are most at risk in terms of transmission.
Structural Properties of the ACN
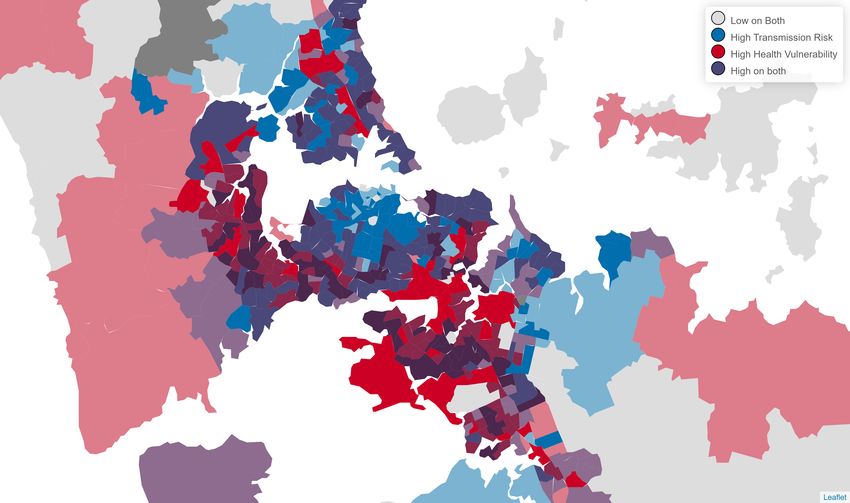
The ACN has consists of a single connected component of 2147 nodes (each representing an SA2 geospatial unit) connected
by 669,878 edges. When using all types of connections between SA2s, the median number of connections is 30 [lower quartile:
3, upper quartile: 266], with a minimum connection weight of 1 (i.e. a single pair of individuals sharing a workplace or school),
and a maximum connection weight of 46,645 (i.e. 46,645 pairs of individuals spread across a set of shared workplace or school
interaction contexts). While the range of connections weights appears large, the manner in which the network is structured
explains how the weight of connection can increase quadratically if many individuals from a pair of SA2s share the same
workplace or go to the same school. For example, if 100 students living in SA2i go to the same school as 100 students from
SA2 j , the connection weight is 100 × 100 (i.e., each of the 100 students from SA2i connected to each of the 100 students from
SA2 j ), giving 10,000 potential interactions. For more details on network properties, see the supplementary material (Appendix
B).
Community Detection
While many insights can be gained by exploring each of the connections that single SA2s share with their neighbors, further
analysis can be done to simplify the network in a way that summarises the broader patterns of connections in the network. One
such method, community detection, allows us to partition the network into different communities. Each of these communities
represents a cluster of SA2s that tend to be more strongly connected to other regions within the same community, than they
are to SA2s in other communities. Partitioning the ACN into these communities is a useful technique for reducing it to a
manageable size11 and providing an overview of how different areas are connected. A key benefit of this analysis is that it
can offer a heuristic for defining the extent of regional based interventions, should an outbreak occur. For example, if there
is a outbreak that emerges in a particular SA2, we may recommend applying an intervention for the SA2s that have been
classified in the same community and restricting travel between SA2s in that community and those located outside it. We would
recommend this action because the SA2s within the community are likely to be at a higher risk of onward transmission due
to their higher level of connections. Conversely, the number of links between SA2s in that community to SA2s outside it is
relatively low, meaning that if travel across the boundary of the community is restricted then it is likely to impact fewer people
than alternative placements of a travel boundary.
There are many methods of community detection, but we focus on methods that employ modularity maximisation. This
method involves dividing the network into alternative partitionings and then selecting the partitioning which maximises the
Page 4
Not Externally Peer Reviewed

                                                              A

                                                              B

                                                              C

Figure 1. A. A representation of the Aotearoa Co-incidence Network, highlighting how connections occur between
dwellings in different geographic regions. This first illustration highlights the manner in which dwellings in one region can
share connections with dwellings in different regions through enrolment in the same school. A co-employment network takes
the same structure, only with a workplace as the central node in the place of a school. B. Projection of A. The second
illustration shows how we can simplify the network by focusing on the indirect connections shared by dwellings based on the
underlying connection though the school (or workplace). C. Aggregated to the Level of Region. To simplify the network
even further (and remove confidential information on dwellings), we can aggregate up to the level of region. In this case we can
see how the blue region has two links to other domains, and a self-loop. This is because the blue region contained two
dwellings connected to the school in the centre of A, while other regions contained only one. NB. In practice, connections will
be shared between regions via multiple schools and multiple workplaces, and the simplified network C will contain edge
weights representing the aggregate of all of these different connections.

                                                                                                                         Page 5
Not Externally Peer Reviewed
modularity — the ratio of the number of edges within groups relative to those between groups.
In the current study, we considered various community detection algorithms that employ modularity maximisation. We
limited our tests to three community detection algorithms suitable for a network the size of the ACN (over 2000 nodes). These
were Louvain, Fast and Greedy, and Infomap. Each of these achieved similar levels of modularity. Two of the these, the Louvain
and Fast and Greedy community detection algorithms, identified the same 11 communities, each with a modularity score of
0.69. The other algorithm, Infomap, identified 32 communities with a modularity score of 0.68. While Infomap detected
different communities to the other two algorithms, visualisation of these communities shows that similar partitions exist in all
cases. The main point of difference is that the Infomap algorithm further partitioned the 11 communities found by the Louvain
and the Fast and Greedy algorithms (Appendix C, Figure 16). For the purposes of this paper we will report the findings from the
Infomap community detection on the basis that it provides more granular information but for a similar modularity (0.68 vs 0.69)
and hence for a similar quality of partitioning into connected regions. We also note that it is non-trivial that the community
detection algorithms should all identify collections of regions that are, with very few minor exceptions, spatially contiguous.
The same methods applied to a similar network but with SA2s linked by distance weighted centroid–centroid distances when
they share a land transport connection does not produce the well defined, contiguous communities observed here.
Centrality
Partitioning the network according to which SA2s are more or less connected to one another allows us to determine potential
regional boundaries in the case of an outbreak of disease transmission. However, community detection does not tell us anything
about which areas are potentially the most likely to have an outbreak spread to them, given an arbitrary initial location of an
outbreak. In order to find out which SA2s are most at risk of transmission spread, we explore the centrality of the SA2s in the
network. Centrality refers to the importance of the SA2 in the network in terms of the number and pattern of connections it
shares with other areas11 .
Previous studies investigating centrality in human flow networks have employed PageRank as an indicator of the importance
of a geographic location in disease transmission12 . There are a number of reasons why PageRank might be an appropriate choice
of centrality measure as a proxy for transmission risk. PageRank is able to consider the weights of connections between SA2s,
the fact that our network is not directed, and it is commonly used11 . Theoretically, PageRank is also a good proxy measure for
transmission risk since it considers not only the connections from one SA2 to its neighbours, but also the connections from
those to next-nearest neighbour SA2s and so on. While the other measures of centrality mentioned previously may also consider
these longer range connections, PageRank does so in a way that distinguishes SA2s that share more connections with highly
connected areas. PageRank does this by deriving the centrality score from the neighboring SA2s in a way that is proportional to
the number of connections (their degree) from that neighboring SA2. As outlined by Newman11 , the vertices (or SA2s in the
current study) that are connected to many others will pass only a small amount of centrality on to neighboring SA2s, even if the
centrality of that SA2 is high. In terms of our network, ensuring that areas with high centrality only pass on their centrality
proportionality is an important condition. Not doing so may obscure areas that have many connections to many areas of higher
transmission risk.
One way of testing which centrality score is most useful as a proxy of transmission risk is by comparing the qualitative
results it produces with those from empirical evidence of transmission spread. Based on what has been observed for the spread
of COVID-19, we would expect urban areas to be over-represented in terms of transmission risk, while rural areas tend to
be safer13, 14 . We find that each of the centrality measures we tested reflected this trend, with the exception of betweenness
centrality which measures the probability of a node being on a path between an arbitrary pair of nodes, without considering the
probability of transmission occurring between those two nodes (see Appendix D, Figure 17), for more information.
Vulnerability
Understanding the structural properties of the ACN, such as the centrality of different SA2s, allows us to see which areas
have the highest risk of transmission. As described above, this knowledge may be highly informative when it comes to strategies
to mitigate the impacts of disease as it highlights areas that need to be supported in terms of resources to prevent transmission
spread and reduce spread should an outbreak occur. However, we also need to consider how vulnerable an area would be should
an outbreak occur. In an effort to see potential strategies through an equitable lens, we shift our focus to highlight specific areas
that have both high transmission risk and high vulnerability to an outbreak, as defined by New Zealand’s Ministry of Health15 .
We obtained data on vulnerability at SA2 level from Wiki et al.5 , who calculated vulnerability across Aotearoa New Zealand
in terms of health, socio-cultural, and socio-economic factors. Long-term health conditions (LTCs) were sourced from the
National Minimum Dataset (NMDS) for the period 2011–2016. LTCs included in this study were cancer, cardiovascular
conditions, diabetes, renal conditions, and respiratory illnesses. Ethnicity is also an important consideration as Māori and
Pacific populations are likely to experience higher levels of risk at an earlier age than Pākehā/European/Other ethnic groups16 .
As outlined by Wiki et al.5 , this is partly due to the fact that chronic health conditions and co-morbidities are often experienced
at an earlier age for these ethnic groups. Socioeconomic deprivation was based on the deprivation decile provided by the
Page 6Not Externally Peer Reviewed
New Zealand Deprivation Index (NZDep2018)17 . Importantly, this measure also captures living conditions, as it measures
bedroom occupancy threshold (i.e. overcrowding) and damp/mould, which are known contributors to a higher risk of COVID-19
mortality5 . Due to the strong association between COVID-19 vulnerability and age, each of these factors is combined with the
percentage of individuals over 65 years to generate a score of vulnerability.
To understand which SA2s have both high transmission risk and high vulnerability, we cross-reference SA2s and identify
areas that have high scores on both dimensions. We create a new bivariate categorical variable which takes on a value determined
by the SA2 scores of transmission risk and vulnerability, split into tertiles. Figure 2 provides an example of how areas of
vulnerability and/or transmission risk are highlighted. In simple terms, if an SA2 scores in the bottom third of all SA2s in terms
of both dimensions, they will be assigned a value of A. If an SA2 scores in the top third in terms of transmission risk, but in the
bottom third in terms of vulnerability, they will be assigned a value of F. When it comes to illustrating these data on a map,
areas of high transmission risk will be coloured blue, areas of high vulnerability will be coloured red, while areas that are high
on both dimensions will be coloured purple. We report distributions at the level of Territorial Authority, which is the geospatial
unit one step above SA2 in terms of resolution.
D G I
Higher Vulnerbability
B E H
A C F
Higher Transmission Risk
Figure 2. Bivariate Legend. The above legend shows the allocation of values at the intersection of vulnerability score and
transmission risk. SA2s labeled A are low in terms of both vulnerability and transmission risk, those labelled F (coloured blue)
have higher levels of transmission risk, those labelled D (coloured red) has higher vulnerability, while those labelled I are high
in terms of both dimensions.
Results and Discussion
The final co-incidence network is available to explore in the Shiny app1 . Figure 3 presents the example of connections
shared between central SA2s in Auckland, Wellington and Christchurch and other SA2s. In this example, we can see that the
majority of connections are made to SA2s in close proximity to the selected SA2, with fewer connections as distance increases.
This is a common trend across Aotearoa New Zealand and reflects the fact that individuals are likely to be based in geographic
locations close to their place of employment or educational enrolment. With that being said, the ACN is able to reveal further
details that are not so obvious. For example, in the case of Wellington Central, we do see a significant number of connections
to the north of the South Island, presumably capturing people who share a place of employment on inter-island ferries that
connect these two regions.
Page 7Not Externally Peer Reviewed
Connections from City SA2s
Queen Street (Auckland) Wellington Central Christchurch Central
Number of Connections (Log)
2.5 5.0 7.5 10.0
Figure 3. Connections from Queen Street (Auckland), Wellington Central (Wellington), and Christchurch Central
(Christchurch). The map presented above shows all of the connections shared between SA2s centrally located within
Auckland, Wellington and Christchurch and other SA2s. Increased connections are denoted with darker green shades. In this
example, we can see that the majority of connections are made to SA2s in close proximity to the selected SA2, with fewer
connections as distance increases.
Community Detection
The Infomap community detection algorithm detected 32 different communities on the ACN. The resulting communities are
presented below in Figure 4. Figure 4 highlights the geographic communities that are present when we consider the connections
that individuals share through co-employment in the same workplaces, and co-enrolment in the same schools. Importantly,
these communities strongly reflect established TA boundaries with a few exceptions. There are some instances where the
boundaries of the communities do not line up with established TA boundaries. Firstly the Auckland community extends further
south than the Auckland TA boundary, to SA2s such as Port Waikato-Waikaretu and Maramarua. Secondly, the TA of Ruapehu
is split across the middle along the boundary of National Park and Tangiwai. Westland TA is also split along the border of SA2s
Waitaha and Westland Glaciers-Bruce Bay. Finally, Ashburton TA is also split, such that Ashburton Lakes (an SA2 located
between Mount Sunday, Mount Hutt, and Mount Barrosa) is included in the neighboring community that contains Christchurch,
Selwyn and Hurunui.
While there is no reason per se for the regions identified by our community detection method to match the bureaucratically
defined boundaries of Territorial Authorities (TAs), the common definition of TAs as regions based on community interests and
roading access is not entirely dissimilar to the concept of commuities formed from areas where people are likely to interact
through work or education. The extended southern border of the community centered on Auckland, with respect to the Auckland
TA is explained by the high level of commuting that occurs from regions south of Auckland. It is perhaps worth noting that
during August 2020 community outbreak of COVID-19 in Aotearoa New Zealand when a regional level lockdown was first
applied to Auckland TA, it was found that the regional intervention caused significant disruptions for workers commuting
across the southern TA border. The position of this southern border was adjusted, to approximately the location of the southern
Auckland border in the ACN communities during a second regional lockdown in February 202118 . The other two regions
(Ruapehu and Westland) where there are notable distinctions between the ACM communities and the TA boundaries are likely
to be explained by significant features of natural geography which reduce connectivity between these neighboring SA2s.
Page 8Not Externally Peer Reviewed
Figure 4. Aotearoa Co-incidence Network Communities. This map highlights geographic communities that are detected
by the Infomap community detection algorithm when we consider the connections that individuals share through
co-employment in the same workplaces, and co-enrolment in the same schools. Territorial Authority (TA) boundaries are
superimposed with black lines. We find much in common with the overlap between TA boundaries and the boundaries of the
detected communities, although the communities cover the area of multiple TAs. Importantly, this map highlights the fact that
in reality TAs often share many connections.
Centrality
We used PageRank centrality to determine which SA2s are the most connected in Aotearoa New Zealand. Figure 5 shows a
map of Aotearoa New Zealand according to this transmission risk. We find that major urban areas tend to have higher levels of
transmission risk compared to rural areas (see Figure 6: D). The majority of SA2s with PageRank scores in the 30th percentile
are classified as “Rural other”, while the majority of SA2s with PageRank scores in the 60th percentile and higher are classified
as major urban areas.
Page 9Not Externally Peer Reviewed
PageRank Transmission Risk
Hamilton Auckland
Christchurch Wellington
Dunedin
PageRank
Lower Higher
Figure 5. Transmission Risk Through PageRankCentrality. The above map presents the transmission risk as determined
through PageRank centrality for SA2s across Aotearoa New Zealand. Increased transmission risk (higher page centrality) is
denoted with darker colours. The Territorial Authorities in focus represent (from North to South) Auckland, Hamilton,
Wellington, Christchurch, and Dunedin. This map highlights urban areas as having increased transmission risk over more rural
areas.
Page Rank Centrality (Deciles) by Urban/Rural Definition
1.00
Urban/Rural
0.75
Inland water
Large urban area
Proportion
Major urban area
0.50 Medium urban area
Rural other
Rural settlement
Small urban area
0.25
NA
0.00
1 2 3 4 5 6 7 8 9 10
Page Rank (Deciles)
Figure 6. Distribution of PageRank by Urban/Rural Classification. This shows the proportion of SA2s classified
according to Urban/Rural definitions by PageRank deciles. The deciles indicate the percentile in which the PageRank for a
specified SA2 falls; a decile of 1 presents SA2s that have PageRank scores in the lowest 10%, while a decile of 10 presents
SA2s that score in the 90% or higher.
Page 10Not Externally Peer Reviewed
To gain more insight into which areas of Aotearoa New Zealand are higher in terms of transmission risk, we show the
distribution of PageRank across Territorial Authorities (TAs; see Figure 7). Wellington, Hamilton, and Auckland (specifically
Auckland District Health Board) tend to be areas of high transmission risk. This is unsurprising given the that these areas
tend to be more densely populated and connected (see supplementary material, Figure 15). Hamilton especially tends to have
pairs of SA2s with high connection rates - i.e., lots of people per SA2s working in the same location. The density of these
connections suggests that transmission risk is especially high and that an outbreak in this area may spread especially quickly
before an Alert level change. Surprisingly, Auckland does not have the highest level of transmission risk on average, although
this may be explained in terms of the high level of variability in connections across Auckland, as well as potential data quality
issues with at-risk populations from Auckland that are missing from Census 2018 data.
Vulnerability
While centrality provides an indication as to which SA2s have the highest risk of transmission, understanding which of
these SA2s would be most vulnerable to an outbreak in terms of age, long term health conditions, ethnicity, and deprivation
can facilitate an equitable response from governmental, iwi and community support systems. By cross-referencing SA2
centrality scores with the measures of vulnerability first outlined by Wiki et al. (2021)5 , we classify points of focus for a public
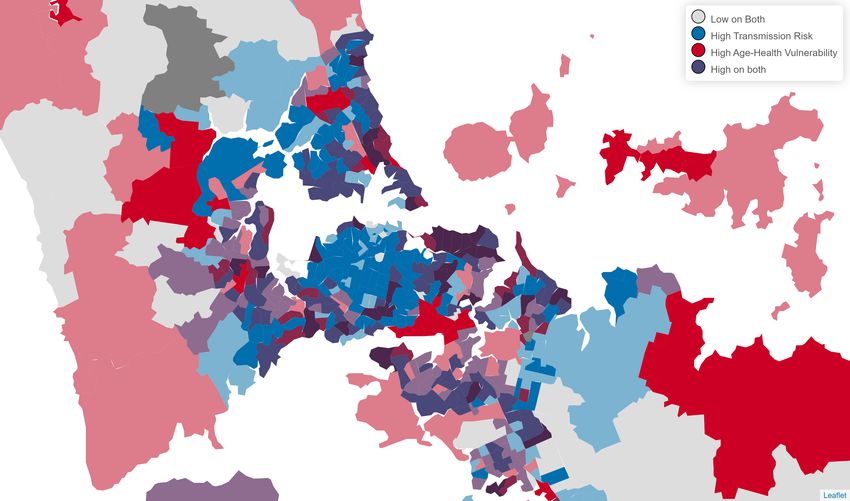
health response to disease outbreaks such as COVID-19. Figures 8 and 11 highlight regional differences at the intersection of
transmission risk, health and socio-economic vulnerability. We visualise the distribution of transmission risk and vulnerability
across TAs to explore geospatial patterns on a broad level (these distributions are also presented by District Health Boards in
Appendix E, Figures 19 and 20). In terms of the combination of transmission risk and health vulnerability (Figure 10), we
find that Invercargill, Whangārei, and Whanganui tend to have a distribution of SA2s with higher scores. Waitomo, Mackenzie,
and Tararua tend to have a lower distribution on this score. Auckland TA contains SA2s that vary in terms of their transmission
risk and vulnerability. While the majority of SA2s in Auckland have high transmission risk, some areas are more vulnerable
than others. As highlighted in Figure 9, areas in central SA2s tend to have less vulnerabilities despite high transmission risk,
while areas in South Auckland and along the eastern Waitematā Habour have increased health vulnerabilities. When health
vulnerabilities are considered without age information, the vulnerability in West and South Auckland is even greater (see
supplementary material Figure 18).
In terms of the combination of transmission risk and socioeconomic vulnerability (Figure 11), we find that Invercargill,
Napier and Whangārei tend to have a distribution of SA2s with higher scores. Mackenzie, Waikato, and Queenstown-Lakes
tend to have a lower distribution on this score (see Figure 12).
These results show that Wellington, Hamilton, and areas of South Auckland which had high distributions in terms of
transmission risk, remain particularly vulnerable to outbreaks of disease - especially in terms of socioeconomic factors. This
analysis also highlights other areas, such as New Plymouth, Invercargill and Tauranga, as regions that would be particularly
vulnerable in terms of the combination of transmission risk and both vulnerability factors. Closer inspection of the distributions
of transmission and vulnerability scores reveals a bimodal distributions for many areas, such as New Plymouth. This indicates
that a selection of SA2s in these TAs appear to have a high transmission risk and these areas within the TA may be particularly
vulnerable. Use of the Shiny app1 helps highlight these areas. For example, in New Plymouth this area of particular vulnerability
is located in the urbanised areas, and includes SA2s from Spotswood to Fitzroy-Glen Avon. In contrast, the rural parts of New
Plymouth TA are do not have the same vulnerability.
The case of New Plymouth highlights an important point of consideration. The current report summarises areas of
transmission risk and vulnerability on the broad level of TA, but the distributions shown in Figures 10 and 12 are wide and
variable. For this reason we encourage readers to explore the app1 and underlying data itself to draw further insights into what
areas may be most at risk of an outbreak and vulnerable to it should it occur. To provide some further examples of the insights
that can be gained by using a finer geospatial resolution, we highlight two further cases in more detail: South Auckland, and
Māori Hill in Dunedin.
South Auckland comprises a set of SA2s in the Auckland TA, and are characterised as urban areas SA2s with a high
proportion of individuals identifying as Māori and/or Pacific19 . SA2s in South Auckland tend to have high levels of transmission
risk. Furthermore, many of these SA2s are vulnerable in terms of health and socioeconomic factors. However, the percentages
of individuals older than 65 in these areas tend to to be lower than 10%. Considering the high proportion of individuals
identifying as Māori and/or Pacific in South Auckland, and the fact that the age vulnerability for these groups to COVID-19 is
lower20 , means that South Auckland should be considered highly vulnerable to an outbreak (see Appendix E, Figure 18).
Māori Hill scores highly in terms of transmission risk, and this may relate to the high number of workers employed in
the health sector. Māori Hill contains the Dunedin’s largest private hospitals. This increases potential transmission risk, and
combined with the high number of individuals over 65 and a high health vulnerability score, this area is thus still vulnerable.
However, inhabitants of this SA2 also tend to be wealthier, reducing their socioeconomic vulnerability.
Page 11Not Externally Peer Reviewed
Distribution of PageRank by Territorial Authority (TA)
TA 2018 Wellington
Hamilton
Auckland (DHB)
Palmerston North
Dunedin
Invercargill
Christchurch
New Plymouth
Tauranga
Nelson
Napier
Whangarei
Hastings
Waitemata (DHB)
Porirua
Counties Manukau (DHB)
Lower Hutt
Upper Hutt
Gisborne
Selwyn
Manawatu
Queenstown−Lakes
Rotorua
Whanganui
Timaru
Grey
Tasman
Marlborough
Western Bay of Plenty
Central Hawke's Bay
Whakatane
Waipa
Waikato
Ashburton
Gore
Clutha
Kapiti Coast
Waimakariri
Buller
Taupo
Kawerau
Westland
Matamata−Piako
South Waikato
Masterton
Carterton
South Taranaki
Waitaki
Rangitikei
Central Otago
Far North
Stratford
Southland
Wairoa
Horowhenua
Opotiki
Otorohanga
South Wairarapa
Kaipara
Tararua
Hauraki
Waimate
Hurunui
Ruapehu
Waitomo
Mackenzie
Thames−Coromandel
−2.5 0.0 2.5 5.0
PageRank
Figure 7. Distribution of PageRank by Territorial Authority (TA). Y axis is arranged according to mean PageRank per
TA. SA2s located in Auckland TA have been split into its three District Health Boards.
Page 12Not Externally Peer Reviewed
Health Vulnerability and PageRank Transmission Risk
Hamilton Auckland
Christchurch Wellington
Dunedin
D G I
Higher Health
Vulnerbability
B E H
A C F
Higher Transmission
Risk
Figure 8. Health Vulnerability and Transmission Risk. The colour map indicates area of low health vulnerability and low
transmission in grey, areas of higher health vulnerability in red, and areas of higher transmission risk in blue. Areas of high
health vulnerability and transmission risk are coloured purple.
Page 13Not Externally Peer Reviewed
Figure 9. Health Vulnerability and Transmission Risk for Auckland. The colour map indicates area of low health
vulnerability and low transmission in grey, areas of higher health vulnerability in red, and areas of higher transmission risk in
blue. Areas of high health vulnerability and transmission risk are coloured purple.
Page 14Not Externally Peer Reviewed
Health Vulnerability and Transmission Risk
Invercargill
Whangarei
Whanganui
Napier
New Plymouth
Tauranga
Dunedin
Christchurch
Gisborne
Timaru
Hastings
Hamilton
Nelson
Rotorua
Kapiti Coast
Auckland (DHB)
Palmerston North
Gore
Lower Hutt
Waitemata (DHB)
Porirua
Kawerau
Grey
Central Otago
Buller
Wellington
Marlborough
Masterton
Central Hawke's Bay
Counties Manukau (DHB)
Ashburton
Upper Hutt
Whakatane
Taupo
South Waikato
Waitaki
Western Bay of Plenty
Horowhenua
Waimakariri
Tasman
Kaipara
Opotiki
Thames−Coromandel
Manawatu
Clutha
Waipa
Wairoa
Rangitikei
Hauraki
Far North
Stratford
Selwyn
Westland
South Wairarapa
South Taranaki
Queenstown−Lakes
Carterton
Waimate
Matamata−Piako
Waikato
Ruapehu
Southland
Hurunui
Otorohanga
Tararua
Mackenzie
Waitomo
Figure 10. Distribution of Transmission Risk and Health Vulnerability by Territorial Authority (TA). Grey represents
SA2s with low transmission risk and vulnerability, red represents low transmission risk and high vulnerability, blue represents
low vulnerability and high transmission risk, and purple represents SA2s with high scores on both dimensions.
Page 15Not Externally Peer Reviewed
Socioeconomic Vulnerability and PageRank Transmission Risk
Hamilton Auckland
Christchurch Wellington
Dunedin
Higher Socioeconomic
D G I
Vulnerbability
B E H
A C F
Higher Transmission
Risk
Figure 11. Socioeconomic Vulnerability and Transmission Risk. colour map indicates area of low socioeconomic
vulnerability and low transmission in grey, areas of higher socioeconomic vulnerability in red, and areas of higher transmission
risk in blue. Areas of high socioeconomic vulnerability and transmission risk are coloured purple.
Page 16Not Externally Peer Reviewed
Socioeconomic Vulnerability and Transmission Risk
Invercargill
Napier
Whangarei
Gisborne
Whanganui
New Plymouth
Hastings
Tauranga
Nelson
Buller
Dunedin
Gore
Wairoa
Kawerau
Palmerston North
Timaru
Christchurch
Hamilton
Westland
Rotorua
Grey
Central Otago
Marlborough
Opotiki
Central Hawke's Bay
Waitaki
Rangitikei
Far North
Kapiti Coast
Tasman
Whakatane
Western Bay of Plenty
Masterton
Manawatu
Kaipara
Horowhenua
Lower Hutt
Porirua
Taupo
South Waikato
Clutha
Auckland (DHB)
Upper Hutt
Thames−Coromandel
Wellington
Hauraki
Counties Manukau (DHB)
Ashburton
Stratford
South Taranaki
Ruapehu
Waipa
Waitemata (DHB)
South Wairarapa
Waimakariri
Matamata−Piako
Tararua
Carterton
Waitomo
Southland
Waimate
Selwyn
Hurunui
Otorohanga
Queenstown−Lakes
Waikato
Mackenzie
Figure 12. Distribution of Transmission Risk and Socioeconomic Vulnerability by Territorial Authority (TA). Grey
represents SA2s with low transmission risk and vulnerability, red represents low transmission risk and high vulnerability, blue
represents low vulnerability and high transmission risk, and purple represents SA2s with high scores on both dimensions.
Page 17Not Externally Peer Reviewed
Limitations
While the methodology and results provided by the ACN are highly insightful and can inform Aotearoa New Zealand’s
response to COVID-19, there are some areas where we believe further progress could be made. Firstly, given that IDI data
are represented at area level, and thus our data are presented at area-level, no conclusions can be made at the individual level.
This is especially relevant given data quality issues present in Aotearoa New Zealand’s 2018 census data, which contained a
significant level of missing data regarding individuals’ dwelling or usual residence, especially for the Māori and Pacific Island
sub-populations. It is also important to emphasise that the ACN looks specifically at the number of connections individuals
share through workplaces and schools only. The ACN will thus undercount the ‘complete’ number of connections shared
between two geographic regions where there is a lower number of school-aged individuals, or higher levels of unemployment.
Other research is currently underway to create a more complex network that considers a wider range of data sources and
addresses equity issues with these sources (8 ).
Furthermore, since the input data used to form the ACN are also from 2018, this means that the ACN may not be
representative for the current (2021) New Zealand population. We use census data as our source of individuals’ location and
dwelling information, and while workplace and school information is available at more recent date, we have to source these data
from 2018 otherwise network edges would not be representative or consistent. The current work is completely reproducible for
researchers who have access to the IDI, which means that the ACN can be updated with the release of the next census in 2023.
One such area that further progress on the ACN can be made is the inclusion of additional sources of workplace or education
data. For example, we do not use information regarding tertiary enrolments, even though it is available in the IDI. This is
due to uncertainty about what these data truly represent when it comes to representing interaction contexts in the network.
Further work is needed to establish a reliable method of linking tertiary students to a physical location with the IDI. Unlike
high schools which tend to have a single location with all students on location at the same time, many tertiary institutions have
multiple campuses with students attending at different times of day. There would also need to be efforts made to filter out
specific tertiary courses that are conducted entirely online or by correspondence.
The inclusion of information regarding workplace and school location would be highly useful in modelling the trajectories
of outbreaks. However, this was not possible in the current work since the inclusion of this information would break the
assurance that the confidentiality of individuals, workplaces, and schools would be maintained. Furthermore, the resulting
network would be much more complex and would require significant computing power and sophisticated analysis. Other work
is currently underway to create a fully representative multilayer network of Aotearoa New Zealand, the Populated Aotearoa
Interaction Network (PAIN). The PAIN includes representations of individuals, workplaces, schools, and community events.
With that being said, the relative simplicity and efficiency of the ACN outlined in the current study, in combination with the
insights that it provides, is a big strength of the current approach and its methodology.
Conclusion
The current report used data on individuals’ employment and school enrolments to create a network of co-incidences: the
Aotearoa Co-incidence Network (ACN). Exploration of the connections that make up the ACN1 , as well as the structure of the
network itself, provides a useful means of understanding transmission risk in Aotearoa New Zealand. The ACN facilitates the
identification of locations of interest should there be an outbreak of infectious disease in a particular geographic area. Through
further analysis of these connections, we also reveal regional communities, that, while comparable to Territorial Authorities,
offer new geographic boundaries that may inform the regional application of Alert Level changes should they need to occur.
Through use of PageRank centrality, a measure of how ‘important’ different areas in the ACN are in terms of the connections
they share, we also gain an idea of the transmission risk associated with different areas. We find that the highest risk regions for
transmission are located in urban areas, especially Hamilton, Wellington, and Auckland. Areas of low-transmission risk include
Thames-Coromandel, Mackenzie, and Waitomo. Finally, we investigated how this transmission overlaps with measures of
geospatial vulnerability. In terms of the combination of transmission risk, health, and socioeconomic factors, we find that areas
such as Invercargill, Napier, Whangārei, as well as Hamilton, Wellington, and South Auckland are particularly vulnerable.
Acknowledgements
We would like to thank Adrian Ortiz-Cervantes for his help with structuring the workplace queries for the Census and
Inland Revenue (IR) data tables inside the Integrated Data Infrastructure (IDI), managed by Statistics Aotearoa New Zealand.
We would also like to acknowledge Dr Jesse Wiki for making the data regarding vulnerability open access and for sharing such
valuable data for use in the current study. Finally, we would like to thank S. Datta, N. French, M. Luczak-Roesch, M. McLeod,
A. Mizdrak, F. Morgan, and M. Parry for providing an initial internal review of this work.
Page 18Not Externally Peer Reviewed
Disclaimer
The results in this paper are not official statistics. They have been created for research purposes from the Integrated Data
Infrastructure (IDI), managed by Statistics Aotearoa New Zealand. The opinions, findings, recommendations, and conclusions
expressed in this paper are those of the author(s), not Statistics NZ. Access to the anonymised data used in this study was
provided by Statistics NZ under the security and confidentiality provisions of the Statistics Act 1975. Only people authorised
by the Statistics Act 1975 are allowed to see data about a particular person, household, business, or organisation, and the
results in this paper have been confidentialised to protect these groups from identification and to keep their data safe. Careful
consideration has been given to the privacy, security, and confidentiality issues associated with using administrative and survey
data in the IDI. Further detail can be found in the Privacy impact assessment for the Integrated Data Infrastructure available
from www.stats.govt.nz.
Page 19Not Externally Peer Reviewed
References
1. The Aotearoa Co-incidence Network: A Shiny App. https://gitlab.com/tpm-public-projects/aotearoa-connection-network/
-/tree/production. Accessed: 30-July-21. App also hosted at: https://stur600.shinyapps.io/aotearoa-coincidence-network/.
2. The Guardian. New zealand’s māori tribes set up checkpoints to avoid ’catastrophic’
coronavirus deaths. Retrieved from: https://www.theguardian.com/world/2020/mar/24/
new-zealands-maori-tribes-set-up-checkpoints-to-avoid-catastrophic-coronavirus-deaths (2020).
3. Prem, K. et al. The effect of control strategies to reduce social mixing on outcomes of the covid-19 epidemic in wuhan,
china: a modelling study. The Lancet Public Heal. 5, e261–e270 (2020).
4. Irini, F. et al. Associations between mobility patterns and covid-19 deaths during the pandemic: A network structure and
rank propagation modelling approach. Array 11, 100075 (2021).
5. Wiki, J., Marek, L., Hobbs, M., Kingham, S. & Campbell, M. Understanding vulnerability to covid-19 in new zealand: a
nationwide cross-sectional study. J. Royal Soc. New Zealand 51, S179–S196 (2021).
6. Harvey, E. et al. Network-based simulations of re-emergence and spread of COVID-19 in Aotearoa New Zealand. Tech.
Rep., Te Pūnaha Matatini (2020).
7. Harvey, E. et al. Alert Level 2.5 is insufficient for suppression or elimination of COVID-19 community outbreak. Tech.
Rep., Te Pūnaha Matatini (2021).
8. Harvey, E. et al. Network Modelling of Elimination Strategy Pillars: Prepare for it; Stamp it out. Tech. Rep., Te Pūnaha
Matatini (2020).
9. Stats NZ. Statistical standard for geographic areas 2018. Retrieved from https://www.stats.govt.nz/methods/
statistical-standard-for-geographic-areas-2018 (2017).
10. Stats NZ. Industrial Classification (ANZSIC06) . Retrieved from https://catalogue.data.govt.nz/dataset/
industrial-classification-anzsic06 (2015).
11. Newman, M. Networks (Oxford university press, 2018).
12. Zhang, Y., Wang, L., Zhu, J. J. & Wang, X. The spatial dissemination of covid-19 and associated socio-economic
consequences. arXiv preprint arXiv:2104.08213 (2021).
13. Li, X. Association between population mobility reductions and new covid-19 diagnoses in the united states along the
urban–rural gradient, february–april, 2020. Prev. Chronic Dis. 17 (2020).
14. Huang, Q. et al. Urban-rural differences in covid-19 exposures and outcomes in the south: A preliminary analysis of south
carolina. PloS one 16, e0246548 (2021).
15. Ministry of Health. COVID-19: Advice for higher risk people. Retrieved from: https://www.health.
govt.nz/our-work/diseases-and-conditions/covid-19-novel-coronavirus/covid-19-information-specific-audiences/
covid-19-advice-higher-risk-people (2020).
16. Steyn, N. et al. Estimated inequities in COVID-19 infection fatality rates by ethnicity for Aotearoa New Zealand. The New
Zealand Med. J. 133 (2020).
17. Atkinson, J., Salmond, C. & Crampton, P. Nzdep2018 index of deprivation: interim research report, december 2019. Tech.
Rep., University of Otago - Wellington, New Zealand (2019).
18. New Zealand Police Ngā Pirihimana o Aotearoa. Update on auckland checkpoints (with maps). Retrieved from:
https://www.police.govt.nz/news/release/update-auckland-checkpoints-maps (2021).
19. Huakau, J. Locality Population Snapshot South Auckland. Retrieved from: https://www.waipareira.com/wp-content/
uploads/2017/11/TPM6.-Locality-Population-Snapshot-SOUTH-Auckland.pdf (2014).
20. Plank, M., Sporle, A., Hannah, K., McLeod, M. & Steyn, N. Research shows māori are more likely to die from covid-19
than other new zealanders. The Conversat. (2020).
21. Rodrigues, F. A. Network Centrality: An Introduction. In Macau, E. E. N. (ed.) A Mathematical Modeling Approach from
Nonlinear Dynamics to Complex Systems (Springer International Publishing, 2019).
22. Kitsak, M. et al. Identification of influential spreaders in complex networks. Nat. physics 6, 888–893 (2010).
23. Wang, J., Li, C. & Xia, C. Improved centrality indicators to characterize the nodal spreading capability in complex
networks. Appl. Math. Comput. 334, 388–400 (2018).
Page 20You can also read