New build homes, flood resilience and environmental justice - current and future trends under climate change across England and Wales - LSE
←
→
Page content transcription
If your browser does not render page correctly, please read the page content below
New build homes, flood
resilience and environmental
justice – current and future
trends under climate change
across England and Wales
Viktor Rözer and Swenja Surminski
November 2020

Centre for Climate Change Economics
and Policy Working Paper No. 381
ISSN 2515-5709 (Online)

Grantham Research Institute on
Climate Change and the Environment
Working Paper No. 353
ISSN 2515-5717 (Online)
The Centre for Climate Change Economics and Policy (CCCEP) was established by the University of Leeds and the London
School of Economics and Political Science in 2008 to advance public and private action on climate change through
innovative, rigorous research. The Centre is funded by the UK Economic and Social Research Council. Its third phase
started in October 2018 with seven projects:
         1. Low-carbon, climate-resilient cities
         2. Sustainable infrastructure finance
         3. Low-carbon industrial strategies in challenging contexts
         4. Integrating climate and development policies for ‘climate compatible development’
         5. Competitiveness in the low-carbon economy
         6. Incentives for behaviour change
         7. Climate information for adaptation

More information about CCCEP is available at www.cccep.ac.uk

The Grantham Research Institute on Climate Change and the Environment was established by the London School of
Economics and Political Science in 2008 to bring together international expertise on economics, finance, geography, the
environment, international development and political economy to create a world-leading centre for policy-relevant
research and training. The Institute is funded by the Grantham Foundation for the Protection of the Environment and a
number of other sources. It has 11 broad research areas:

         1.    Climate change adaptation and resilience
         2.    Climate change governance, legislation and litigation
         3.    Environmental behaviour
         4.    Environmental economic theory
         5.    Environmental policy evaluation
         6.    International climate politics
         7.    Science and impacts of climate change
         8.    Sustainable finance
         9.    Sustainable natural resources
         10.   Transition to zero emissions growth
         11.   UK national and local climate policies

More information about the Grantham Research Institute is available at www.lse.ac.uk/GranthamInstitute

Suggested citation:
Rözer V and Surminski S (2020) New build homes, flood resilience and environmental justice – current and future trends
under climate change across England and Wales. Centre for Climate Change Economics and Policy Working Paper
381/Grantham Research Institute on Climate Change and the Environment Working Paper 353. London: London School of
Economics and Political Science

This working paper is intended to stimulate discussion within the research community and among users of research, and its content may
have been submitted for publication in academic journals. It has been reviewed by at least one internal referee before publication. The
views expressed in this paper represent those of the authors and do not necessarily represent those of the host institutions or funders.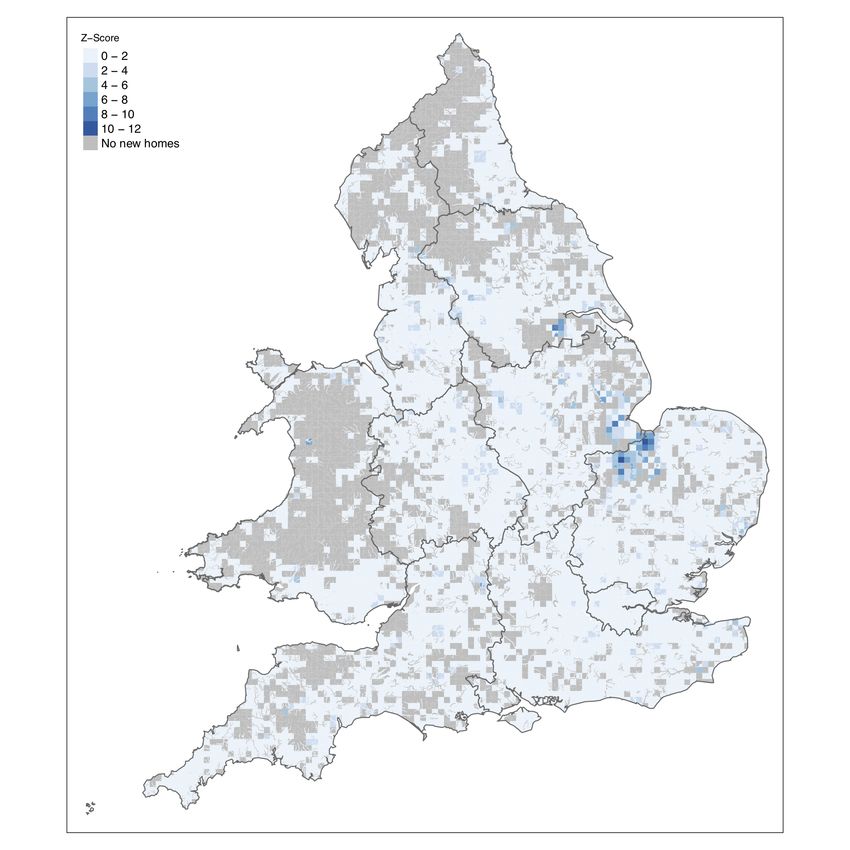
New build homes, flood resilience and
environmental justice – current and future trends
under climate change across England and Wales
              Viktor Rözer & Swenja Surminski
              Grantham Research Institute on Climate Change and the Environment, London
              School of Economics and Political Science, Houghton Street, London, WC2A 2AE,
              UK
              E-mail: v.roezer@lse.ac.uk

              November 2020

              Abstract. Despite improvements in the management of flood r isk a nd the
              introduction of new regulations, losses from flooding remain h igh. An important driver
              is the continuation of new assets being built in flood p rone l ocations. O ver t he last
              decade over 120,000 new homes in England and Wales have been built in flood prone
              areas. While the yearly rates of new homes in flood r isk a reas h ave i ncreased only
              moderately on the national level, significant d ifferences be tween an d wi thin regions
              as well as between different fl ood ty pes ex ist. Us ing pr operty le vel da ta on new
              homes built over the last decade and information on the socio-economic development
              of neighbourhoods, we analyse spatial clusters of disproportional increase in exposure
              and investigate how these patterns evolve under different future climate s cenarios. We
              find that a disproportionately higher number of homes built in struggling or declining
              neighbourhoods between 2008 and 2018 is expected to end up in high flood r isk areas
              over their lifetime as a result of climate change. Based on these findings, w e discuss
              several issues regarding future spending on flood d efences a nd a ffordability of private
              level flood p rotection a s well a s fl ood in surance in th e fa ce of cl imate change.

1. Introduction

Flood risk is commonly understood as a function of hazard, exposure and vulnerability
and can be altered through de- or increasing any of the three components. The largest
share in increases in flood risk and subsequent losses over the last decades in many areas
of the world including the UK can be attributed to an increase in exposure [1], but is
likely to be dwarfed by the effects of climate change induced sea level rise and changes
of precipitation patterns over the coming decades [2]. Therefore, managing the creation
of new risk through spatial planning and other incentives that aim to reduce the amount
of new assets in flood prone areas (including areas that are likely to become flood prone
in the future) and in some cases retreat is seen as a key component of long-term flood
risk management and adaption [3]. At the same time altering the flood vulnerability of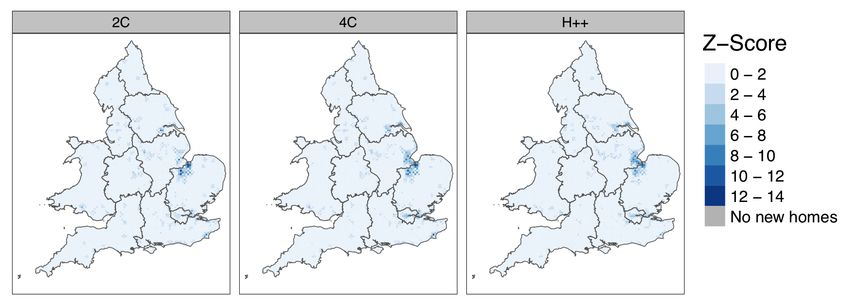
New build homes, flood resilience and environmental justice                               2

communities by making people and assets more resilient to flooding both through ex-
ante adaptation and efficient ex-post recovery is increasingly included in both national
policies and local flood risk management practice [4]. Resilience in this context means
the ability of communities or individuals to manage their flood risk in a way that it
enables them to pursue there social, ecological and economic development objectives
over time (also described as ”bouncing forward”)[5]. Together with a gradual shift of
the responsibility towards private households and businesses to manage their own flood
risk over the last decades, the question of an uneven distribution in the capacity of
communities, neighbourhoods and individuals to respond to and recover from flooding
in the context of environmental justice is emerging in both the academic literature
and policy debate [6, 7]. Understanding differences in social vulnerability and flood
resilience is therefore seen as key for a sustainable long-term management of flood risk.
In this context, several studies linking local deprivation with flood exposure have been
conducted in the UK [8, 9, 10, 11, 12, 13, 14], the US [15, 16] and elsewhere [17]. However,
only few studies have analysed the long-term changes under the effects of climate change
and no studies are available that provide an empirical analysis that captures the recent
and dynamic changes of flood exposure as well as its role for social vulnerability and the
wider development of a community in the context of climate change. Yet, understanding
the long-term effects of new properties and their flood exposure on the wider socio-
economic development of communities is essential to improve future planning decisions
where both trade-offs exist between the anticipated stimulation of the local economy
through investments in the property market and the long-term effects of an increase in
the exposure to flooding in a community. Not taking these trade-offs into account and
not planning new properties in a resilient and forward looking way, can jeopardise the
long term sustainability of these property developments, especially in cases where the
flood hazard is increasing as a result of climate change. This is especially important
where the requirement to factor in flood resilience measures when building new homes
increases the costs of the project and might be attenuated or waived to not threaten its
viability and affordability [18]. We address this lack of evidence on the long-term effects
of recent increases in flood exposure in this paper for the example of England and Wales
by investigating 1) where new homes have been built over the last decade in England
and Wales geographically and over time 2) how they are contributing to the current and
future flood risk of their neighbourhoods, and 3) how the socio-economic development of
the neighbourhoods they have been built in might affect their long-term flood resilience
under changing flood hazards as a result of climate change. We further discuss how
the findings of this study can support identifying neighbourhoods that might face socio-
economic tipping points as a result of flooding which can lead for example to sudden
large-scale out-migration [19] following a flood event, significant increases in mortgage
defaults and foreclosures [20] or drop in insurability with implications for systemic risk
[21, 22, 23].
New build homes, flood resilience and environmental justice                                          3

2. Background

In the past, flood risk management has been seen as an isolated task with the single
purpose to prevent harm to people and assets from flooding, mainly through structural
defences that should keep the water out [24]. Devastating flood disasters over the
last decades in the UK and elsewhere with structural flood defences failing or being
overtopped was a reminder that there is no absolute protection from floods, which led
to increasingly risk based approaches [25, 21]. One component to manage floods in an
risk-based approach is to avoid increases in exposure by shifting development to areas
with the lowest flood risk probability [26]. In this context the Planning Policy Guidance
Note 25 (PPG25) was introduced in 2001 in England and Wales making the Environment
Agency a statutory consultee on applications for planning permissions in flood risk areas
[27]‡. It requires the local planning authorities, who are largely independent in setting
their local development plans, to perform a so-called sequential test that aims to prevent
new developments being permitted in areas known to be at risk from flooding . In case
this is not possible an exception test can be applied which regulates development in areas
with higher flood risk under the condition that the sustainable benefits should out weight
the increase in flood risk and that the new development is both resilient and resistant
to flooding [29]. However, faced with competing interests and institutional agendas
such as constrains on building on protected land (e.g. the green belt around urban
areas in England) and pressure to meet national housing targets, local authorities in the
UK frequently permit new developments in flood zones. The Adaptation Committee of
the UK’s Committee on Climate Change estimated in 2019 that 54,500 new properties
were built between 2014 and 2017 [30]. While the planning system stipulates that new
buildings should only been built in accordance with requirements to ensure their current
and future flood resilience, set by the Environment Agency, there are no nation-wide data
sets available to monitor whether this is met. In addition, most of these requirements
are based on current flood risks not taking into account a potential future increase in
flood risk as a result of climate change [18]. At the same time, the effectiveness of other
attempts to disincentivise new homes in flood risk areas such as the exclusion of homes
build after 2009 from the national flood insurance pool FloodRE remains unclear [21].
While the academic and policy debate about acceptable levels of property development
in flood risk areas and how new buildings can be made more resilient continues, there
are significant gaps in the understanding on how new properties in or near flood risk
areas affect the wider long-term future sustainable development in the neighbourhoods
and communities they are built in. This concerns both the potential changes to the
flood hazard as a result of climate change as well as local socio-economic changes over
the lifetime of new property developments. Based on the theoretical framework of flood
disadvantage outlined by [6], we analyse where new homes over the last decade have
been built in flood risk areas in England and Wales and investigate the links between the
‡ The planning policies are likely to be superseded by new legislation currently discussed and outlined
in the Planning for the Future White Paper [28]
New build homes, flood resilience and environmental justice                              4

socio-economic development trajectories of the neighbourhoods they have been built in.
We also investigate how climate change might affect these new homes over their lifetime
by applying three different climate change scenarios as used by the UK Committee on
Climate Change. This information is urgently needed for the called shift from mainly
risk based approaches to a holistic forward looking resilience strategy that allows for a
more just flood risk management.

3. Materials and Methods

We combine property level information of new residential dwellings built between 2008
and 2018 in England and Wales from the AddressBase Premium dataset provided by
Ordnance Survey (OS) with information on their current and future flood exposure
under three different climate change scenarios as well as the socio-economic development
trajectories of the neighbourhoods the new residential homes have been built in. The
flood risk of a new home is determined by whether the geolocation of the property
inside a flood risk area defined by the official risk maps for flooding from river and sea
(RoFRS) as well as from surface water (RoFSW) available for England and Wales. The
flood risk maps have national coverage, include local expertise, and take into account
flood defences and their condition.
      Homes are considered as being at a high to medium risk of flooding (HFR), when
the property is in an area with a 1% (0.5% for sea) or higher annual chance of flooding.
Properties are at a low risk of flooding (LFR) in case they are located in an area with
a 1% (0.5% for sea) to 0.1% annual chance of getting flooded (for further details see
Appendix A.1.1 and Appendix A.1.2).
      The change in the flood risk by the 2050s as a result of climate change is estimated
for the different flood types (sea, surface, river) across England and Wales based on three
climate change scenarios as defined by the UK Climate Change Committee (CCC) [31]:
a lower end scenario based on a 2° change in Global Mean Temperature (GMT) (2C),
a 4°C change (4C) and a worst case scenario (H++) which does not refer to a specific
GMT, but is considered a credible high end change scenario. A total of 11,908 local
impact areas with sizes ranging from 3 to 23 km2 are defined across England and Wales
to capture the local and flood type specific changes to the flood risk for the different
climate change scenarios. Following the approach from [32] we derive impact functions
for each of the local impact areas and flood types by counting the number of new build
properties that would get flooded for a 3%, 1% and 0.1% annual chance of flooding.
Assuming no future changes in structural flood protection, we use the different regional
scenarios for changes in the return period or standard of protection for river, sea and
surface water flooding and the local impact functions to calculate the change in the
number of properties built between 2008 and 2018 having a 1% or higher annual chance
of flooding for each flood impact area by the 2050s for the three different CC scenarios
(see Appendix A.1.4 for details).
      The information of the recently built homes and their current and future
New build homes, flood resilience and environmental justice 5
flood risk under climate change is then combined with information on the socio-
economic development of the neighbourhoods the homes have been built in. The
neighbourhood development trajectory data set developed by [33] uses gridded
information on demographic characteristics, socio-economic development and housing
data of decadal censuses from 1971 to first create representative neighbourhood
typologies for each census year and then use sequence analysis to derive seven
representative trajectories characterising the wider socio-economic development of
neighbourhoods from longitudinal transitions of these neighbourhood typologies over
time (see Appendix A.1.3 for details). The data is available on a 1 km2 grid for England
and Wales.
In accordance with the three research questions outlined in section 1, we conduct
three different analysis:
First, we analyse year to year changes in new homes in flood risk areas for the period
between 2008 and 2018, both in total and by flood type. We use the non-parametric
Mann-Kendall (MK) test to analyse trends in the absolute number and share of new
homes in HFR and LFR. The non-parametric Theil–Sen estimator is used to estimate
the magnitude and direction of both the national trend for England and Wales as well
for each local authority (LA) district with a significant trend based on the MK test [34].
The difference in slope from the Theil-Sen estimator between the national trend and
the trend in each LA district is used as a measure for the strength of the local deviation
from the national trend.
Second, we analyse spatial trends in flood exposure of homes built between 2008 and
2018. For that we analyse the number of new homes in HFR both for the current and
the future flood hazard for the 2050s for the three CC scenarios. Hot spots are assessed
by using local spatial auto-correlation. We use the local Gi (d) statistic (local Getis Ord)
to identify clusters [35] of local flood impact areas. For each local flood impact area
the local Gi (d) statistic is estimated based on the distance between neighbouring flood
impact areas and both the respective absolute number and share of homes in HFR. The
threshold distance for neighbouring flood impact areas was set that each area has at
least one neighbour (see Appendix A.2.1 for details).
Third, we analyse how the flood exposure of homes built between 2008 and 2018 is
distributed among different socio-economic neighbourhood types. We calculate for each
of the seven neighbourhood types the difference between the share of all new build homes
and those in HFRs. This difference provides a measure whether the share of homes in
high flood risk areas for a specific neighbourhood type is higher (positive values), or lower
(negative values) compared to what would be expected based on the overall distribution
of homes built between 2008 and 2018 in the respective neighbourhood type. The
difference is calculated for current and future flood risks under different CC scenarios to
analyse how future changes in the flood hazard is affecting the exposure to flooding of
recently built homes over their lifetime in different socio-economic neighbourhood types
(see Appendix A.2.2 for details).New build homes, flood resilience and environmental justice 6 4. Results For the property data set, we find that for current hazard levels around 5% of the 1.3 million homes built between 2008 and 2018 in England and Wales are located in HFRs. Another 10% of new homes were built in LFRs. The majority of the 62,413 homes in HFRs are either affected by river (42%) or surface water flooding (41%). Full summary statistics are presented in Table B1 in the Appendix. Time trends We find significant trends for the year-to-year rate of new build homes in flood risk areas in some local authority (LA) districts. Of the 335 LA districts in which new homes have been built between 2008 and 2018, 29 show significant trends for HFR and 38 for LFR. Of those LA districts with significant trends 7 LA districts for HFR and 9 for LFR have trends below the national trend, while the majority of LA districts with significant increases have trends above the national trend. Only three out of the 335 LA districts have significantly declining trends in the ratio of new homes built in HFR and 8 LA districts in LFR. Figure B1 in the Appendix shows all LA districts with significant year to year trends in new build homes in flood risk areas including their deviation from the national trend. For the absolute number of new build homes in flood risk areas in England and Wales between 2008 and 2018 we find a significant increase in numbers in LFR and a non-significant increase in HFR (see Figure 1). Looking at the different flood types, we find that the rate of new homes built in areas at risk from surface water flooding has almost tripled between 2008 and 2012 and remains at a high level after reaching a peak in 2012, while the rate of new homes in areas at risk from river has decreased over time. Figure 2 shows the yearly rate of new build homes by flood type for HFR and LFR respectively. These findings can in part be explained by changes in the planning system, and also reflect the availability of flood risk maps: flood risk maps for river and sea were formally introduced in today’s shape and form in 2004, while the surface water flood risk maps were introduced in 2013, around the time when the rate of new homes at risk from surface water flooding starts to stabilize.
New build homes, flood resilience and environmental justice                                                                                                       7

                                                    15000
                                            zones
                                         areas
                                     flood

                                                    10000
                                  inrisk
                           in flood
                       homes

                                                                                                                                          Flood Zone
                                                                                                                                          Flood Risk Area
                     homes

                                                                                                                                              3 (>1%)
                                                                                                                                              High/medium
                                                                                                                                              HFR  (>1%) (>1%)
                 build

                                                                                                                                              2 (1%
                                                                                                                                              LFR
                                                                                                                                              Low     − 0.1%)
                                                                                                                                                   (0.1%
                                                                                                                                                  (0.1%   - 1%)
                                                                                                                                                        - 1%)
            newbuild
         of new
  Number of

                                                     5000
 Number

                                                        0

                                                            2008    2009   2010   2011   2012   2013   2014   2015   2016   2017   2018

                                                                   Figure 1. Number of new homes build per year in high/medium (HFR; >1%) and
                                                                   low (LFR, 1% - 0.1%) flood risk zones between 2008 and 2018.
New build homes, flood resilience and environmental justice 8
A3 B
6
3 [%]
[%]2 [%]
[%]
zone
zone
in HFR
in LFR
2
in flood
in flood
built built
builtbuilt
Flood Type
4
new homes
homes
Multi
of homes
homes
River
of new
Sea
Surface
of new
of new
1
ShareShare
ShareShare
2
0
2008 2009 2010 2011 2012 2013 2014 2015 2016 2017 2018 2008 2009 2010 2011 2012 2013 2014 2015 2016 2017 2018
Figure 2. Year to year change in the share of new homes built in flood risk areas as
percentage of all new build homes for different types of flooding. A shows results for
high/medium flood risk (HFR; >1%) areas. B shows results for low flood risk areas
(LFR, 1% - 0.1%).
Spatial trends and hot spots
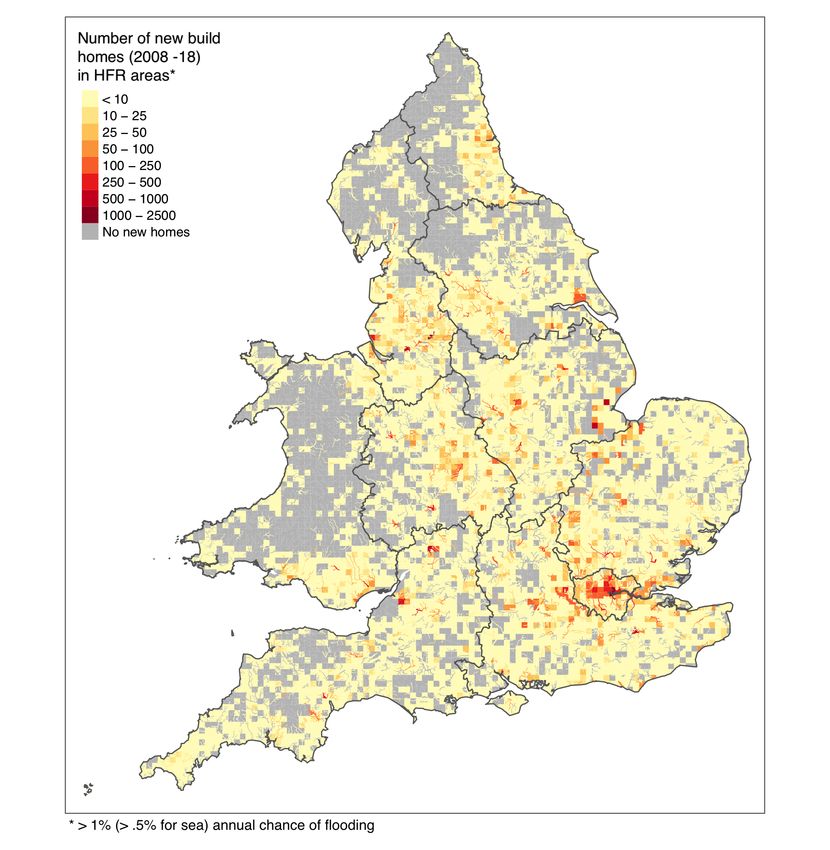
We find a high total number of new build homes in HFR in parts of London and in the
Thames Valley for current hazard levels. Other clusters include urban areas in estuaries
such as in Liverpool, Hull or Bristol as well as smaller areas along rivers in the East
Midlands or Yorkshire and the Humber (see Figure 3).
Looking at the share of new build homes in HFR as a proportion of all buildings
built in the respective area during the same period, a strong clustering with high shares
appear mainly in estuaries on the border between the East of England and the East
Midlands as well as along the river Trent in Yorkshire and the Humber (Figure 4 -
top left). This is also confirmed by the hot spot analysis based on local spatial auto-
correlation (Figure 5): we find two significant local clusters with high shares of new
build homes in HFR in estuaries on the border between the East of England and the
East Midlands and along parts of the river Trent. The latter was also severely affected
during the 2019/2020 winter flood season [36].
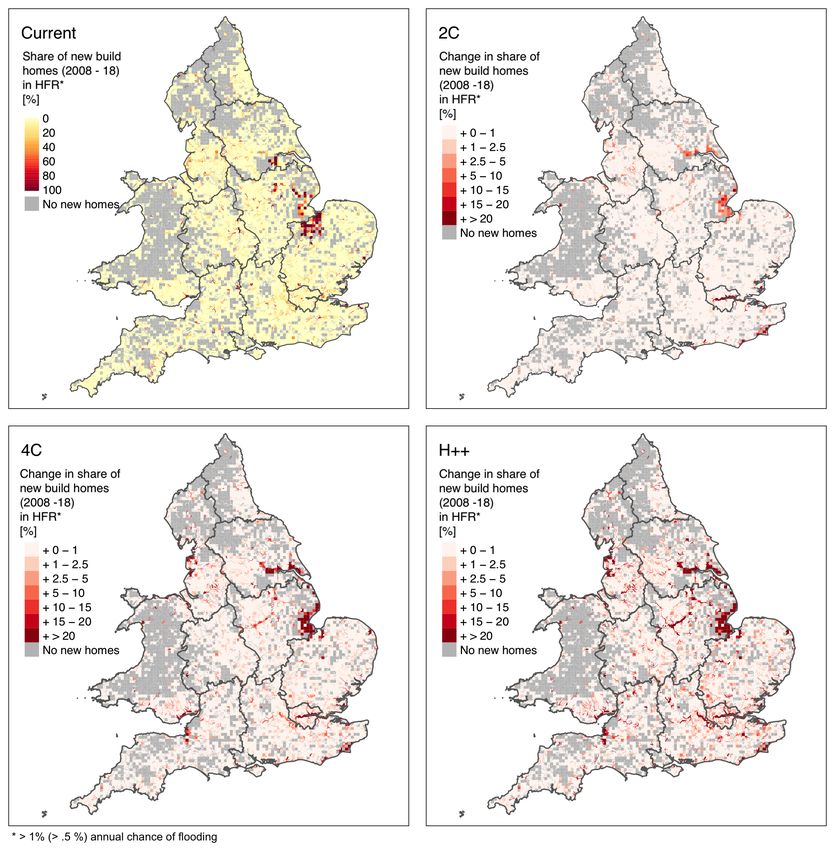
For the different climate change scenarios we find that existing hot spots are
expected to be further amplified with more homes built between 2008 and 2018 expectedNew build homes, flood resilience and environmental justice 9
to fall into HFRs by the 2050s without further action. But also new hot spots are
expected to emerge without further intervention for these homes, especially along lower
lying coastal areas in the South East of England, along the Thames river banks in
London and along the Ouse in Yorkshire and the Humber (Figure 4). We find the
highest expected shift in the share of homes built between 2008 and 2018 in HFR by
2050 as a result of climate change to range from 2%-points for the 2C scenario to 35%
for the high-end scenario (H++). Here, the largest changes are expected along coastal
areas and estuaries in the East of England and in Yorkshire and the Humber, but also
in smaller areas in the South East and the North West of England. Results of the local
hot spot analysis for different climate change scenarios are shown in Figure B2 in the
Appendix.
Figure 3. Spatial distribution of the total number of homes built between 2008 and
2018 in high/medium flood risk (HFR; >1%) areas across England and Wales.New build homes, flood resilience and environmental justice 10
Figure 4. Top left: Share of homes built between 2008 and 2018 in high/medium
flood risk (HFR; >1%) areas as percentage of the total number of homes built in the
same time period for local impact areas across England and Wales. Top right - bottom
left: Change in share of homes built between 2008 and 2018 in HFR areas by the 2050s
as a result of changing flood hazard levels for three different climate change scenarios
(2C: 2 degree warming by 2100, 4C: 4 degree warming by 2100 and H++: credible
high end warming scenario)New build homes, flood resilience and environmental justice 11
Figure 5. Spatial clusters (hot spots) with high shares of new build homes in
high/medium flood risk (HFR; >1%) areas, 2008–2018. High positive Z-score values
indicate hot-spots with a high number of neighbouring impact areas with a high share
of new build homes in flood zones.
Current and future flood exposure by neighbourhood type
Figure 6 shows the distribution of homes in HFR built between 2008 and 2018 by
the different socio-economic development trajectories of the neighbourhoods they have
been built in. When comparing to the overall number of homes built in the different
neighbourhood trajectory types in the same period, we find that under current flood
hazard conditions a disproportionately lower share of new homes in HFR in England and
Wales were built in areas with Increasing struggling homes-owners, characterised by [33]
as areas transitioning from a “families in council rent type to a struggling [home-owner]
type” as well as in Upwarding thriving neighbourhoods, described as neighbourhoods
that have persistently been thriving over the last four decades. A disproportionately
higher share of new homes in HFR were built in the Ageing manual labour (describing
neighbourhoods transitioning from blue collar families to an ageing demographics type)
and Stable affluent (describing neighbourhoods that have persistently remained affluent
over the last four decades) neighbourhood types. For other neighbourhood types theNew build homes, flood resilience and environmental justice 12
share of new homes in HFR is nearly proportionate to all new homes built between 2008
and 2018 in those respective areas. Under the assumption that neighbourhoods across
England and Wales remain on their current socio-economic development trajectories over
the coming decades, we find that the susceptibility to changes in the flood hazard as a
result of climate changes of homes built between 2008 and 2018 differs depending on the
neighbourhood type they are located in. The results show a socio-economic polarisation
in flood exposure for homes built between 2008 and 2018 over their lifetimes as a result
of climate change with increasing deviations in the share of homes located in HFR in
three of the eight neighbourhood types (Figure 6). Most noticeably in the Increasing
struggling homes-owners neighbourhood type, where a climate change induced change
of the flood hazard is expected to lead to a disproportionately larger share of homes
built between 2008 and 2018 ending up in a HFR by the 2050s for all CC scenarios,
while the share under current hazard levels is disproportionately lower.
Current 2C 4C H++
Increasing struggling home−owners
Ageing manual labour
Other
Rejuvenating
Increasing socioeconomic diversity
Stable multicultural urban
Upwarding thriving
Stable affluent
−10 −5 0 5 10 −10 −5 0 5 10 −10 −5 0 5 10 −10 −5 0 5 10
Deviation new−build
Deviation homes
of new build in flood
homes zonecompared
in HFR comparedtotoallallnew
newhomes
homesbyby neighbourhood
neighbourhood [%−points]
[%-points]
Figure 6. Deviation of the share of new-build homes (2008 - 2018) in high/medium
flood risk (HFR) areas from the share of all homes built in the respective neighbourhood
types based on [33] in percent points. Positive values indicate a disproportionately
higher, negative values a disproportionately lower share of homes in HFR areas relative
to the share of all homes in a specific neighbourhood type. The deviations are shown
for the seven different neighbourhood types and for current flood hazard conditions
as well as for flood hazard conditions by the 2050s for the 2C, 4C and H++ climate
change scenarios.
5. Discussion and Conclusion
Our study extends previous research on flood exposure, spatial planning and
environmental justice [6, 7, 8, 9, 10, 11, 13, 14] by including the effect of recently built
homes on the flood exposure of different socio-economic neighbourhood types and how
changes in the hazard due to climate change is affecting these homes in neighbourhoodsNew build homes, flood resilience and environmental justice 13
they were built in over the homes’ lifetime.
Our analysis shows that the around 17,000 new homes that have been built in HFR
and LFR areas in England and Wales on average each year over the last decade, are
not only highly spatially concentrated with 34 local authority districts (10% of all local
authority districts where new homes have been built) being responsible for 90% of all
new homes built in flood risk areas, but also unevenly distributed between different
socio-economic neighbourhood types. Our results indicate that a spatial shift in flood
risk areas as a result of climate change is expected to result in more homes built over
the last decade to end up in HFR areas over their lifetime without further action;
disproportionately higher in multi-cultural urban neighbourhoods and areas dominated
by increasingly struggling home-owners.
It is difficult to consider all dynamic and mutually influencing processes when
analysing the interplay between new build homes, current and future flood exposure and
socio-economic development in the context of climate change. Many aspects especially in
a forward looking analysis are difficult to include without introducing large uncertainties
such as where new homes will be built in the coming decades and how they might
further shape the socio-economic development of the neighbourhoods they will be built
in. While we specifically analyse where new homes have been built between 2008 and
2018 and what happens to those homes and in their respective neighbourhoods over the
coming decades, it is possible that neighbourhoods might leave their identified socio-
economic development trajectory in the future in case of significant disruptions such as
through changes of investment flows into a neighbourhood (e.g. when a council decides it
can no longer defend a neighbourhood from increasing flood hazards) or simply a change
in preferences or demand (e.g. raise in attractiveness of suburban or countryside homes).
We partly address this issue by using a new data set of neighbourhood classifications
from long-term longitudinal data [33]. This data set takes into account a larger set
of variables characterising the longitudinal socio-economic development of different
neighbourhood types over the last four decades and by that increases the robustness
of development trajectories. Other approaches use either proxy variables that are very
sensitive to the overall economic development such as real estate prices or use relative
measures such as the frequently used index of multiple deprivation, which does not allow
longitudinal analysis over time.
Another source of uncertainty regards future changes in the flood risk as a result
of climate change which is both affected by uncertainties in the link between changes in
the GMT and the resulting changes in the frequency and intensity floods (e.g. through
rising sea levels and changes in rainfall patterns). Future investments in structural flood
defences could offset some of the identified increase in risk levels but it is uncertain where
and to what degree this will be done. However, as the current spatial planning regime
works under the assumption that new homes in flood risk areas are built in a resilient
way, our analysis assumes there will be no future changes in structural flood defences
to specifically protect these homes.
However, lacking property level information on the actual flood resilience of theNew build homes, flood resilience and environmental justice 14
buildings in our study allows only for crude estimates to what degree this assumption is
met and therefore it is unclear how the expected increase in exposure will also lead to
an increase in flood risk. While assumptions on the rate and effectiveness of for example
private level adaptation have been made in previous studies they generally rely on very
limited evidence and it remains unclear to what extent they reflect reality [37].
Therefore further research and the development of data sets on the level of
adaptation of buildings are necessary as it not only supports an improved spatial
planning system to maximise flood risk reduction in the face of climate change and
newly created exposure as requested by the CCC [38] but would also allow to take
environmental justice issues around the affordability of flood resilience measures into
account. Our analysis shows how this could be done in a forward looking way
taking into account the current and future flood hazards together with socio-economic
characteristics of neighbourhoods. This can also support the already existing Long-term
investment scenarios (LTIS) for flood and coastal erosion risk management published
by the Environment Agency which currently lacks both the necessary level of detail to
guide local planning decisions.
The current blind spots regarding the actual level of adaptation of new build homes
both for current and future flood hazards additionally carries the risk that especially in
deprived and declining neighbourhoods, where the need for property development as part
of a local regeneration strategy clashes with limited financial resources and the demand
for affordable housing, an increase in flood risks (both through newly created exposure
and increasing hazard) might not only lead to not meeting expectations for economic
growth and prosperity but could even exacerbate issues of decline and deprivation in
cases where long-term flood resilience cannot be ensured. To avoid a vicious cycle of
creating new risks as a strategy for economic regeneration, the long-term flood resilience
of new properties not only needs to be considered as a requirement in the planning
process, but needs to be embraced as part of regeneration strategies that include future
changes in flood hazards and the local socio-economic context that might affect the
ability to ensure long-term flood resilience.
However, the interactions between future flood resilience, exposure and scocio-
economic development of neighbourhoods go beyond the already discussed implications
of flood protection measures and adaptation: The largest share of the homes in our
analysis is not covered through the subsidised insurance pool FloodRE, due to the
exemptions of homes built after 2009 and insurance cover may be unavailable or not
affordable. Owners of these homes might therefore face a difficult dilemma, in which
they either need to accept that flood damages to their home might increase and are
likely to negatively affect the value of their property or will have to accept increasing
insurance premiums and/or invest in retro-fitting their buildings to mitigate damages
where possible and economically viable. Our results show that already struggling
neighbourhoods will face this issue more likely than other types of neighbourhoods. This
can lead to knock-on effects where a low or lacking ability to cope with increasing flood
risks of even a small number of individual homes or properties can decrease both theNew build homes, flood resilience and environmental justice 15
attractiveness and property value of a larger area in case full recovery after flood events
is unlikely and community development is impaired. In these case larger disruptions
such as sudden out-migration [19] or an increase in mortgage defaults and foreclosures
[20] after flood events due to a combination of dropping real estate prices and lacking
financial resources for recovery become more likely.
Appendix A. Material and Methods
Appendix A.1. Data
Appendix A.1.1. New build properties 2008 - 2018 We construct a property level
data-set of newly build dwellings between 2008 and 2018 in England and Wales by
combining information on the dwelling type, location, occupancy and postcode from
the AddressBase Premium product provided by Ordenance Survey [39] with postcode
information from the publicly available postcode directory from the Office of National
Statistics (ONS) [40] through their unique post code. AddressBase Premium contains
detailed information on address and types of assets for every property in the UK. By
filtering the dataset by the property type and the introduction year of a new postcode
from the ONS postcode directory, we are able to identify new residential homes and the
year of their completion (i.e. the year the address has been activated). The resulting
data set comprises of around 1.3 mio data points representing new homes in England
and Wales built between 2008 and 2018, their year of completion, their location and
the dwelling type (flat, detached, semi-detached, terraced, other). This approach is
different from previous approaches such as by [41], which compared reversed versions of
the AddressBase data base for specific snapshots in time, to allow for a higher temporal
resolution.
The constructed data set contains both new developments on green- and brown
fields associated with land-use change as well as conversions or redevelopments in
existing urban structures. Individual homes are defined as self-contained units with
their own registered address. The data set has been validated by comparing historic
high-resolution satellite imagery from GoogleEarth from a year before and after the
stated year of construction for 50 random addresses.
Appendix A.1.2. Flood hazard maps The flood hazard maps used in this study are the
publicly available flood maps provided by the Environment Agency for England and by
Natural Resources Wales for Wales. For the flood hazard from river and sea the ”Risk of
Flooding from Rivers and Sea (RoFRS)” flood maps are used [42, 43]. For surface water
flooding the extent maps from the Risk of Flooding from Surface Water (RoFSW) are
used [44, 45]. The flood maps have nation-wide coverage, are available as GIS shapefiles
and shows the chance of flooding as one of four flood risk categories, taking into account
flood defences and their condition.
In this study we consider homes being at a high/medium risk of flooding, whenNew build homes, flood resilience and environmental justice 16 the property is in an area with a 1% or higher annual chance of flooding from river and surface water and a 0.5% or higher annual chance of flooding from sea. We consider areas with a low risk of flooding in case they have between a 1% (0.5% for sea) and 0.1% annual chance of getting flooded. Whether a home is at risk from flooding is determined by its location within or outside the respective flood risk area. Appendix A.1.3. Neighbourhood development To identify the development trajectories of neighbourhoods in combination with their flood exposure, we use a gridded, spatio- temporal consistent neighbourhood trajectory data set developed by [33]. The data is available on a 1 km2 grid for England and Wales. The approach uses neighbourhood- level information of the four decadal censuses between 1971 and 2011 to create neighbourhood typologies for each census year. The neighbourhood typologies are based on in total 21 variables on demographic (age, place of birth), socio-economic (socio-economic group, occupation, proportion of students, unemployment, mode of travel to work) and housing data (ownership, social housing, vacancy rate) (a full list and of all variables considered in the analysis is shown in [33]). Sequence analysis was used to derive seven representative trajectories of neighbourhood development from longitudinal transitions of these neighbourhood typologies over time. The names and descriptions of the seven trajectories are shown in Table A1. This approach allows for a spatially and temporally consistent and representative classification of development paths of neighbourhoods in a community, identifying neighbourhoods with stable, upward and downward socioeconomic development pathways. Compared to the widely used English and Welsh indices of multiple deprivation (IMD), which only allow to analyse changes in deprivation between two snap-shots in time relative to other neighbourhoods, sequence analysis allows to capture the evolution of neighbourhoods transitioning through phases of development, growth, stability and decline over time. More details on the methodology that was used to derive the representative trajectories can be found in [33]. For the analysis in this study, the neighbourhood a new home was built in is determined by its geographical location. In cases where new developments are not in a neighbourhood trajectory grid cell (either through small inaccuracies caused by the grid approach or through greenfield developments that have not been considered as part of the neighbourhood before) we apply a nearest neighbour approach to link the new build homes to the nearest neighbourhood. This is only done in cases where the new build home is less than 1 km (or 1 grid cell) away from the closest neighbourhood, based on the assumption that developments further away need to be considered as independent new neighbourhoods which are likely to have their own development trajectories.
New build homes, flood resilience and environmental justice                                      17

                  Table A1. Names and key features of the seven main neighbourhood trajectories as
                  described in [33]
Neighbourhood trajectory name        Description
Stable affluent                      Areas remaining persistently affluent over 1971 and 2011.
                                     Areas transitioning from being dominated by blue collar
Ageing manual
                                     families to an older striving neighborhood type.
Increasingly socio-economically      Areas transitioning from a struggling or blue collar families
diverse                              type to a mixed workers suburban type.
Increasingly struggling              Areas transitioning from a families in council rent type to a
home-owners                          struggling type.
Stable multicultural urban           Areas remaining multicultural in urban locations.
                                     Areas transitioning from an older striving type to a mixed
Rejuvenating
                                     workers suburban type.
                                     Areas transitioning from an older striving type to,
Up-warding thriving
                                     or remaining in, a thriving suburban type.

Appendix A.1.4. Climate change scenarios For this study the future flood hazard
projections for three climate change scenarios for the 2050s as defined by the UK Climate
Change Committee (CCC) are considered [31]: a lower end scenario based on a 2° change
in Global Mean Temperature (GMT) (2C), a 4°C change (4C) and a worst case scenario
(H++) which does not refer to a specific GMT, but is considered a credible high end
change scenario. All changes in GMT are expressed for the year 2100 relative to the
1961-90 baseline as by the UK Climate Change Projections (UKCP09) provided by
the Met Office. Based on these climate projections [32] developed future flood hazard
projections for the UK including relative sea level rise around the English and Welsh
coastline, changes in peak river flows for the 12 major catchment areas in England and
Wales as well as changes in storm rainfall depth and intensity influencing the surface
water flood risk. Using the same approach and assumptions as in [32] for the UK
Climate Change Risk Assessment the relative changes in sea level rise, peak river flow
and storm rainfall depth and intensity are translated into changes in the annual chance
of flooding/changes in the level of protection for different hydrological regions, land use
types (i.e. urban and not urban) and coastal regions and features (i.e. beaches, cliffs,
levees etc.). Change parameters for all flood types, different return periods and the
different scenarios used in this study can be found in [46]. Table A2 gives an overview
of the regional differences and differences in the susceptibility for the different flood
types considered in this study. To analyse the potential local effect of climate change
on the future exposure to floods of new build properties, we create local impact areas
based on a 5 by 5km grid across England and Wales for surface water flooding. For sea
and river flooding, we use the same grid to split areas potentially affected by flooding
from river or sea (based on current shapefiles of flood risk areas from the RoFRS). This
New build homes, flood resilience and environmental justice 18
allows us to define a total of 11,908 local flood impact areas across England and Wales
with sizes ranging from 3 to 23 km2 , that are spatially consistent in regard to their
flood risk. Based on the mentioned regional CC parameters we derive impact functions
for each flood type and for each of 11,908 local impact areas. The impact functions
describe the functional relationship between the current annual chance of flooding (i.e.
3%, 1% and 0.1%) and the respective number of homes built between 2008 and 2018
at risk from flooding. The impact functions are then used to translate the change in
the flood hazard for the three different CC scenarios into the change in the number of
homes that are expected to have 1% or higher annual chance of flooding by the 2050s
under the 2C, 4C and H++ scenarios.
Table A2. Regional differences and differences in susceptibility considered in the
three different climate change scenarios.
Flood type Change indicator Regional differences Susceptibility differences
5 coastal regions 3 coastal defence types
Sea Relative sea level rise
(E, SE, SW, MW, NW) (sea wall, embankment, beach)
River Peak river flow 12 hydrometric regions -
Storm rainfall depth &
Surface - 2 runoff types (rural, urban)
intensity
Appendix A.2. Methods
Appendix A.2.1. Spatial trends We calculate for each local flood impact area i across
England and Wales the share of homes in high/medium flood risk areas (HFR; >1%
annual chance of flooding for river and surface, >0.5% for sea) Pf l by taking the ratio
between the number of homes that have been built in HFR areas from 2008 to 2018
NiHF R and the total amount of homes built in the respective flood impact area Nitotal :
Ni
Pif l = HF R
Nitotal
Pif l is calculated for the current climate, as well as for the 2C, 4C and H++ climate
change scenarios. To estimate the potential change in the spatial distribution of the
share of recently built homes in flood risk areas by the 2050s, we calculate the difference
in percent points between the current share and the share for the three different CC
scenarios:
Pf l,dif f = Pf l,CC − Pf l,current
Hot spots and spatial trends are assessed by using local spatial auto-correlation.
We use the local Gi (d) statistic (local Getis Ord) to identify clusters [35]. For each
local flood impact area the local Getis Ord statistic is estimated based on the distance
between neighbouring flood impact areas and both the respective absolute number and
share of homes in HFR areas. The threshold distance for neighbouring flood impact
areas was set that each area has at least one neighbour.New build homes, flood resilience and environmental justice 19
Appendix A.2.2. Flood exposure and neighbourhood development For each of the
seven neighbourhood development trajectories across England and Wales, we calculate
the deviation between the proportion of homes built in HFR areas with the overall
proportion of homes build in each neighbourhood type:
NHF R,nbh Ntotal,nbh
Dif fper,nbh = PHF R,nbh − Ptotal,nbh = −
NHF R,total Ntotal
with Dif fper,nbh representing the difference in percent points between the share of
new build homes in HFR areas for a specific neighbourhood type PHF R,nbh and the total
share of homes for this neighbourhood type Ptotal,nbh . Dif fper,nbh provides a measure
whether the share of homes in flood risk areas for a specific neighbourhood type is
higher (positive values), on par (around 0), or lower (negative values) compared to
what would be expected based on the overall distribution of new homes between the
different neighbourhood types. We calculate Dif fper,nbh both for the current state as
well as for the 2C, 4C and H++ climate change scenarios to be able to estimate how
the distribution of recently built homes in HFR areas is expected to shift between the
different neighbourhood development trajectories with climate change.
Appendix B. Results
Appendix B.1. Summary results
Table B1. Summary statistics showing all homes build in high/medium flood risk
areas (1% or greater annual chance of flooding from rivers and surface water and 0.5%
or greater annual chance of flooding from sea) and low flood risk areas (between 0.1
and 1% annual chance of flooding from rivers and surface water and between 0.1 and
0.5% annual chance of flooding from sea) by country, dwelling type and flood type.
High/medium flood risk area England Wales Total
River Sea Surface Multiple River Sea Surface Multiple
Houses (detached, semi-detached, terrace) 9850 935 12483 2126 1120 40 513 224 27291
Flats (self-contained) 15403 1841 12459 2335 289 171 223 54 32775
Other 1035 95 1116 16 13 - 72 - 2347
Total 26288 2871 26058 4477 1422 211 808 278 62413
Low flood risk area England Wales Total
River Sea Surface Multiple River Sea Surface Multiple
Houses (detached, semi-detached, terrace) 8515 5391 31406 7175 1189 1938 1339 777 57730
Flats (self-contained) 16227 5011 30452 6732 697 3112 500 746 63477
Other 1221 198 2889 453 6 171 75 4 5017
Total 25963 10600 64747 14360 1892 5221 1914 1527 126224New build homes, flood resilience and environmental justice 20
Appendix B.2. Time trends
A B 0.050
Deviation of LA trend from National trend
Deviation of LA trend from National trend
0.02
0.025
0.00
0.000
−0.02 −0.025
Worcester
Wigan
Sedgemoor
Epping Forest
Scarborough
Malvern Hills
Carmarthenshire
Haringey
Newcastle upon Tyne
East Hampshire
Dorset
Solihull
West Lancashire
Cheshire West and Chester
Lichfield
Corby
Newcastle−under−Lyme
Central Bedfordshire
Gedling
Redcar and Cleveland
Preston
Southend−on−Sea
Castle Point
East Staffordshire
Brent
Peterborough
Chiltern
Waverley
Newport
Erewash
Boston
Maldon
Nottingham
Slough
East Riding of Yorkshire
Harborough
Great Yarmouth
Carmarthenshire
Redditch
Milton Keynes
Northumberland
Corby
Swindon
Cheshire West and Chester
Cheshire East
East Hampshire
Peterborough
Blaby
Chorley
Stafford
South Gloucestershire
South Derbyshire
South Staffordshire
Southwark
North Kesteven
Burnley
St Albans
Surrey Heath
Swale
Hart
Mendip
Aylesbury Vale
Harlow
Epping Forest
Wyre
Merton
Elmbridge
Figure B1. Local authority districts (LA) with significantly increasing or decreasing
trend in year-to-year ratios of new build homes in flood risk areas over time (2008 -
2018) based on the Mann-Kendall trend test with .05 significance level. Deviation on
y-axis shows the difference in slope between each LA and the national trend. Slope is
calculated based on the non-parametric Sen’s slope. Bars in light-blue show decreasing
trends (negative slope); bars in dark-blue show increasing trends (positive slope). A
shows results for high/medium flood risk areas (1% (0.5% for sea flooding) or higher
annual chance of flooding). B shows results for low flood risk areas (between 1% (0.5%
for sea flooding) and 0.1% annual chance of flooding).
Appendix B.3. Spatial trends and hot spots
Figure B2. Spatial clusters (hot spots) with high shares of new build homes in flood
risk areas, 2008–2018 for 2C, 4C and H++ climate change scenarios. High positive
Z-score values indicate hot-spots with a high number of neighbouring impact areas
with a high share of new build homes in flood risk areas.New build homes, flood resilience and environmental justice 21
References
[1] Andrew J Stevens, Derek Clarke, and Robert J Nicholls. Trends in reported flooding in the uk:
1884–2013. Hydrological Sciences Journal, 61(1):50–63, 2016.
[2] Hessel C Winsemius, Jeroen CJH Aerts, Ludovicus PH Van Beek, Marc FP Bierkens, Arno
Bouwman, Brenden Jongman, Jaap CJ Kwadijk, Willem Ligtvoet, Paul L Lucas, Detlef P
Van Vuuren, et al. Global drivers of future river flood risk. Nature Climate Change, 6(4):381–
385, 2016.
[3] Rob Roggema. Adaptation to climate change: a spatial challenge. Springer, 2010.
[4] Sara Mehryar and Swenja Surminski. The role of national laws in managing flood risk and
increasing future flood resilience. Grantham Research Institute on Climate Change and the
Environment Working Paper, 334, 2020.
[5] Adriana Keating, Karen Campbell, Reinhard Mechler, Piotr Magnuszewski, Junko Mochizuki,
Wei Liu, Michael Szoenyi, and Colin McQuistan. Disaster resilience: what it is and how it can
engender a meaningful change in development policy. Development Policy Review, 35(1):65–91,
2017.
[6] Paul O’Hare and Iain White. Beyond ‘just’flood risk management: the potential for—and limits
to—alleviating flood disadvantage. Regional environmental change, 18(2):385–396, 2018.
[7] Chloe Begg, Gordon Walker, and Christian Kuhlicke. Localism and flood risk management in
england: the creation of new inequalities? Environment and Planning C: Government and
Policy, 33(4):685–702, 2015.
[8] Gordon Walker, Kate Burningham, Fielding Jane, Graham Smith, Diana Thrush, and Fay
Helen. Addressing environmental inequalities: Flood risk. Technical Report SC020061/SR1,
Environment Agency, Bristol, UK, 4 2006.
[9] Alan Werritty, Donald Houston, Tom Ball, Amy Tavendale, and Andrew Black. Exploring the
social impacts of flood risk and flooding in scotland. 2007.
[10] Jane Fielding and Kate Burningham. Environmental inequality and flood hazard. Local
Environment, 10(4):379–395, 2005.
[11] Aleksandra Kazmierczak, Gina Cavan, Angela Connelly, and Sarah Lindley. Mapping flood
disadvantage in scotland 2015: Main report. Technical Report PPDAS60523, The Scottish
Government - Environment and Forestry Directorate, Edinburgh, UK, 12 2015.
[12] Gordon Walker and Kate Burningham. Flood risk, vulnerability and environmental justice:
Evidence and evaluation of inequality in a uk context. Critical social policy, 31(2):216–240,
2011.
[13] Paul Sayers, Matt Horritt, Edmund Penning-Rowsell, and Jessie Fieth. Present and future
flood vulnerability, risk and disadvantage: A UK scale assessment. Technical report,
Sayers and Partners LLP for the Joseph Rowntree Foundation, Watlington, UK, 2017.
URL: http://www.sayersandpartners.co.uk/uploads/6/2/0/9/6209349/sayers_2017_-_
present_and_future_flood_vulnerability_risk_and_disadvantage_-_final_report_-_
uploaded_05june2017_printed_-_high_quality.pdf.
[14] Paul Sayers, Edmund C Penning-Rowsell, and Matt Horritt. Flood vulnerability, risk, and social
disadvantage: current and future patterns in the uk. Regional environmental change, 18(2):339–
352, 2018.
[15] Marilyn C Montgomery and Jayajit Chakraborty. Assessing the environmental justice
consequences of flood risk: a case study in miami, florida. Environmental Research Letters,
10(9):095010, 2015.
[16] Jesse M Keenan, Thomas Hill, and Anurag Gumber. Climate gentrification: from theory to
empiricism in miami-dade county, florida. Environmental Research Letters, 13(5):054001, 2018.
[17] Helga Leitner, Emma Colven, and Eric Sheppard. Ecological security for whom? the politics
of flood alleviation and urban environmental justice in jakarta, indonesia. In The Routledge
companion to the environmental humanities, pages 210–221. Routledge, 2017.New build homes, flood resilience and environmental justice 22
[18] Daniel Young and Stephen Essex. Climate change adaptation in the planning of england’s coastal
urban areas: priorities, barriers and future prospects. Journal of Environmental Planning and
Management, 63(5):912–934, 2020.
[19] Koen de Koning, Tatiana Filatova, Ariana Need, and Okmyung Bin. Avoiding or mitigating
flooding: Bottom-up drivers of urban resilience to climate change in the usa. Global
environmental change, 59:101981, 2019.
[20] Mark Westcott, John Ward, Swenja Surminski, Paul Sayers, and David N Bresch. Physical
risk framework: Understanding the impacts of climate change on real estate lending and
investment portfolios. Technical report, Cambridge Institute for Sustainability Leadership
(CISL), Cambridge, UK, 2019.
[21] Swenja Surminski, Sara Mehryar, and Maryam Golnaraghi. Flood risk management in
england. Technical report, Geneva Association, Zurich, Switzerland, 2020. url: https://www.
genevaassociation.org/sites/default/files/flood-risk-management-england.pdf.
[22] Max Tesselaar, WJ Botzen, and Jeroen CJH Aerts. Impacts of climate change and remote natural
catastrophes on eu flood insurance markets: An analysis of soft and hard reinsurance markets
for flood coverage. Atmosphere, 11(2):146, 2020.
[23] Prudential Regulation Authority. The impact of climate change on the uk insurance sector. A
Climate Change Adaptation Report, 2015.
[24] Bruno Merz, James Hall, Markus Disse, and Andreas Schumann. Fluvial flood risk management
in a changing world. Natural Hazards and Earth System Sciences, 2010.
[25] Paul Sayers. Evolution of strategic flood risk management in support of social justice, ecosystem
health, and resilience. In Oxford Research Encyclopedia of Natural Hazard Science. 2017.
[26] EA. Managing flood and coastal erosion risks in England: 1 April 2011 to 31
March 2017. Technical report, Environment Agency, Bristol, UK, 2018. URL:
https://assets.publishing.service.gov.uk/government/uploads/system/uploads/
attachment_data/file/694808/1_April_2011_to_31_March_2017_managing_FCERM.pdf.
[27] James Porter and David Demeritt. Flood-risk management, mapping, and planning: the
institutional politics of decision support in england. Environment and Planning A, 44(10):2359–
2378, 2012.
[28] MHCLG. Planning for the future - white paper. Technical report, Ministry of Housing,
Communities and Local Government, London, UK, 2020. url: https://www.gov.uk/
government/consultations/planning-for-the-future.
[29] Samuel Hayes, Adam Barker, and Carys Jones. Flood management consideration in sustainability
appraisal and strategic environmental assessment in england and scotland. Journal of
Environmental Assessment Policy and Management, 16(03):1450025, 2014.
[30] ASC. Progress in preparing for climate change – 2019 Progress Report to Parlia-
ment. Technical report, Committee on Climate Change - Adaptation Sub-Committee,
London, UK, 2019. URL: https://www.theccc.org.uk/wp-content/uploads/2019/07/
CCC-2019-Progress-in-preparing-for-climate-change.pdf.
[31] R Kovats and D Osborn. Uk climate change risk assessment 2017: Evidence report. chapter 5:
People & the built environment. 2016.
[32] PB Sayers, MS Horritt, E Penning-Rowsell, and A McKenzie. Climate change risk assessment
2017. Projections of future flood risk in the UK. Report for the UK Adaptation sub-Committee.
Sayers Associates, 2015.
[33] Nikos Patias, Francisco Rowe, and Stefano Cavazzi. A scalable analytical framework for spatio-
temporal analysis of neighborhood change: A sequence analysis approach. In The Annual
International Conference on Geographic Information Science, pages 223–241. Springer, 2020.
[34] Richard O Gilbert. Statistical methods for environmental pollution monitoring. John Wiley &
Sons, 1987.
[35] A Getis and K Ord. The analysis of spatial association by use of distance statistics. Geographical
Analysis, 24(3):189–206, 1992.You can also read