FRONT COVER - Tyne and Wear Fire and Rescue Service
←
→
Page content transcription
If your browser does not render page correctly, please read the page content below
FRONT COVER
Contents

Introduction ........................................................................... 3     Deprivation .......................................................................... 23
About Tyne and Wear ........................................................... 6                 Indices of Deprivation ........................................................ 23
Success in Reducing Risks ................................................. 7                     Unemployment .................................................................. 24
Population ............................................................................. 8        Worklessness .................................................................... 26
   A Growing and Ageing Population....................................... 9                       Health and Wellbeing ........................................................ 28
   Ethnicity............................................................................. 12      Alcohol Use ....................................................................... 29
   Main Language ................................................................. 12             Smoking............................................................................. 31
   Religion ............................................................................. 13      Drug Use ........................................................................... 33
Housing ............................................................................... 14        Mobility .............................................................................. 34
   Dwelling Stock ................................................................... 16          Obesity .............................................................................. 35
   Short Term Residence ...................................................... 17                 Mental Health .................................................................... 36
Growth and Development .................................................. 18                      Crime and Anti-social Behaviour ....................................... 37
   Domestic Properties .......................................................... 18           Road Traffic Collisions ....................................................... 41
   Non-Domestic Properties .................................................. 18               Environmental Risks ........................................................... 43
   Newcastle and Gateshead ................................................ 19                 Industrial Risks and Resilience ......................................... 48
   North Tyneside .................................................................. 20           COMAH Sites .................................................................... 48
   South Tyneside ................................................................. 21            Premises............................................................................ 48
   Sunderland ........................................................................ 22         Building Collapse ............................................................... 48
                                                                                               References ........................................................................... 49

 Community Risk Profile 2017 – 2020                                                                                                     Tyne and Wear Fire and Rescue Authority
                                                                                                                                                       Creating the Safest Community           2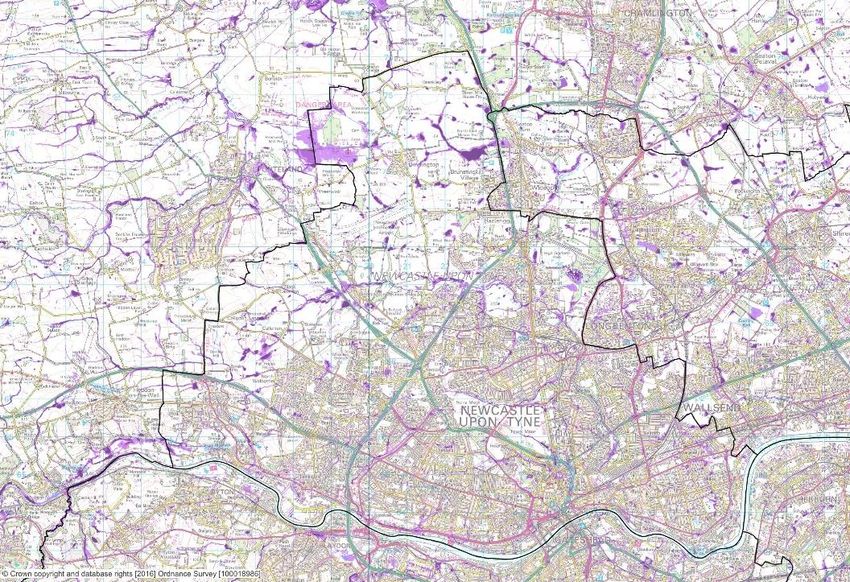
Introduction

This Community Risk Profile informs our Strategic Community            “Each Fire and Rescue Authority must produce an integrated risk
Safety Plan (SCSP) and Integrated Risk Management Plan                 management plan that identifies and assesses all foreseeable fire
(IRMP). It provides a comprehensive and forward looking                and rescue related risks that could affect its community, including
assessment of the risks in our community that will both impact         those of a cross border, multi authority or national nature. The plan
upon, and shape service delivery over the coming years.                must have regard to the community risk registers produced by
                                                                       Local Resilience Forums and any other local risk analyses as
This document is an overview assessment and analysis of                appropriate”.
community risk. It is underpinned by detailed data on incidents
and risks which are used in the targeting of our activities, both      The Community Risk Profile also takes account of information
strategically and day to day.                                          supplied by partners and external influences on our Service at the
                                                                       local and national level. It does not replicate the statutory, multi-
The Community Risk Profile and its underpinning data enable us         agency Community Risk Register managed by the Northumbria
to better understand the diverse nature of our community and           Local Resilience Forum.
identify, prioritise and plan for both current and foreseeable risk,
in accordance with the requirements of the Fire and Rescue
National Framework 2012, that states:

 Community Risk Profile 2017 – 2020                                                                 Tyne and Wear Fire and Rescue Authority
                                                                                                                 Creating the Safest Community   3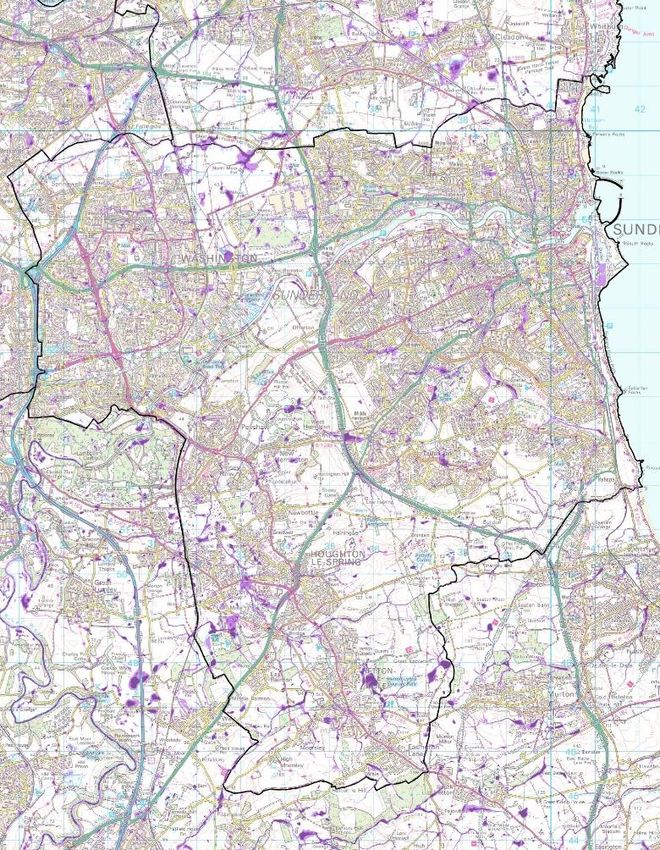
Managing Risk
We take a standard approach to understanding risk which is made referenced with incident data to enable resources to be targeted
up of the likelihood that something could happen and the impact for Prevention, Protection and Response.
it would have if it did happen. Our role as a fire and rescue service
is set out in legislation including the Fire and Rescue Services Act It is important to note that community risk and incidents are not the
2004, the Civil Contingencies Act 2004, the Regulatory Reform same thing. Community risk is inherent in the community and is
(Fire Safety) Order 2005 and the Fire and Rescue (Emergencies) connected with the social factors in the population, including
poverty / deprivation, age, health and lifestyle. Individuals at risk
(England) Order 2007.
of harm from fire and other accidents are often also at risk of other
That role is essentially to mitigate the risk by: types of harm.
reducing the likelihood that fires will happen (through the We regard a fire or other incident where risk has not been
Prevention and Protection activities that are part of our legal mitigated we know both from our routine local analysis, and
duty). national researchi that incidents are more likely to happen to some
individuals and in some areas, than others.
reducing the impact if incidents do happen. This is part of our
duty to respond and provide resilience (extinguishing fires, Our knowledge of the community includes historical and recent
rescuing people in a variety of situations, and being able to information about where incidents happen and to whom. We
help the community if a major incident or disaster occurs). It
routinely make use of data systems including Community Fire Risk
also links to the Prevention and Protection duties through the
Management Information System (CFRMIS) and demographic
promotion of measures that make sure people get out if there
profiling tools (e.g. MOSAIC), both of which provide information to
is a fire, or prevent the ignition and the spread of fire
(sprinklers, smoke alarms, fire doors, fire retardant materials household / business level. Other systems record patterns and
for vulnerable people and many others). frequency of incidents and allow us to model any proposed
changes (e.g. Workload Modelling software).
When thinking about the likelihood of fire and other incidents, the
Community Risk Profile is important because it helps us to This helps us to make the connections between the risk and the
understand the community. This understanding is cross incidents and to target the available resources at the greatest risk
- whether this means the positioning of fire stations and
Community Risk Profile 2017 – 2020 Tyne and Wear Fire and Rescue Authority
Creating the Safest Community 4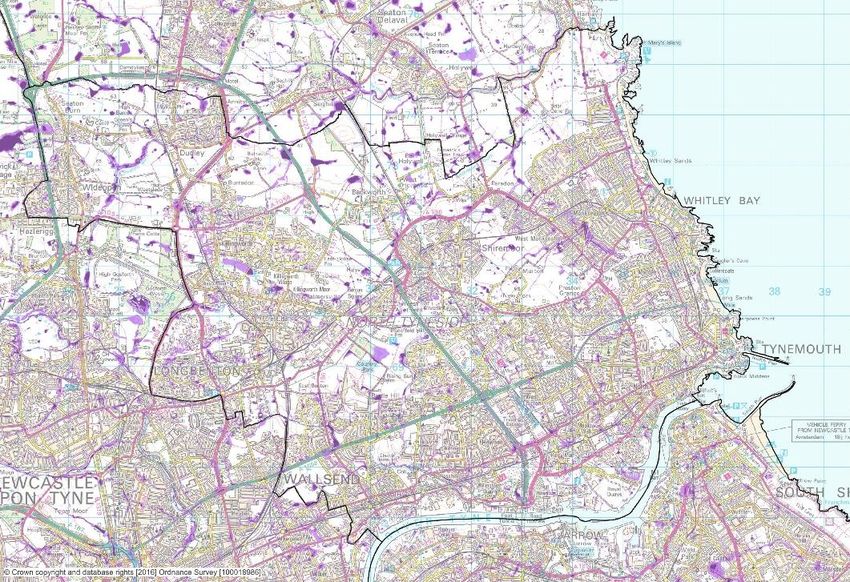
appliances, or the targeting of our programmes of Home Safety
Checks (HSCs) or Risk Based Inspections (RBIP) of business
premises. Of course there will always be some fires and other
accidents and it is not possible to totally remove all risk of these.

Throughout this document we have set out some of the key risks.
Our approach to targeting these risks is also described. Policies
and procedures are in place dealing with the specifics of targeting
risk through Prevention (e.g. Home Safety Check targeting policy),
Protection (e.g. Risk Based Inspection Programme for fire safety)
and Response (e.g. Standard Operating Procedures and Pre-
Determined Attendances).

 Community Risk Profile 2017 – 2020                                     Tyne and Wear Fire and Rescue Authority
                                                                                     Creating the Safest Community   5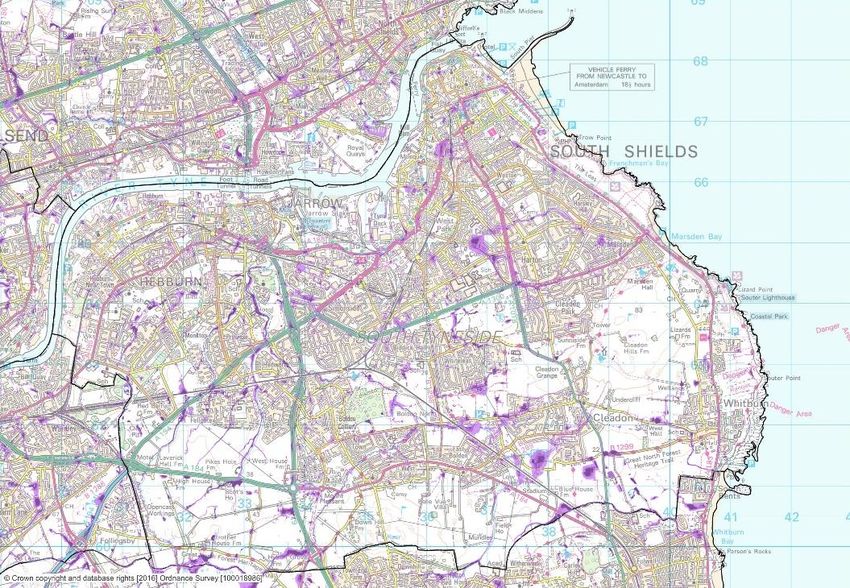
About Tyne and Wear

Tyne and Wear is a densely populated metropolitan area with        Tyne and Wear has an international airport, two major cities,
1.104 million residents located in the North East of Englandii.    nearly 1.4 million m2 of retail floor space, five indoor shopping
Covering 538km2 it represents only 6% of the North East region’s   centres, three universities and a variety of specialist sporting
land, yet it is home to 43% of the region’s population with over   facilities hosting both domestic and international competitions and
500,000 households. The population is growing, ageing and          events. Tyne and Wear also has a number of high risk sites
changing, the impact of this is covered in more detail later.      registered under the Control of Major Accident Hazards (COMAH)
                                                                   regulations 1999.
Tyne and Wear consists of five local authority areas: Gateshead,
Newcastle, North Tyneside, South Tyneside and Sunderland. It       The industrial makeup of the area has changed from largely heavy
borders Northumberland County to the north and Durham County       industry to a more diverse economy including a number of major
to the south. Along with the other urban areas of Tees Valley,     enterprises such as the Nissan plant in Sunderland. The recession
these four county areas constitute the North East region of        has hit the North East harder than many areas and recovery is
England.                                                           slower.

Community Risk Profile 2017 – 2020                                                             Tyne and Wear Fire and Rescue Authority
                                                                                                            Creating the Safest Community   6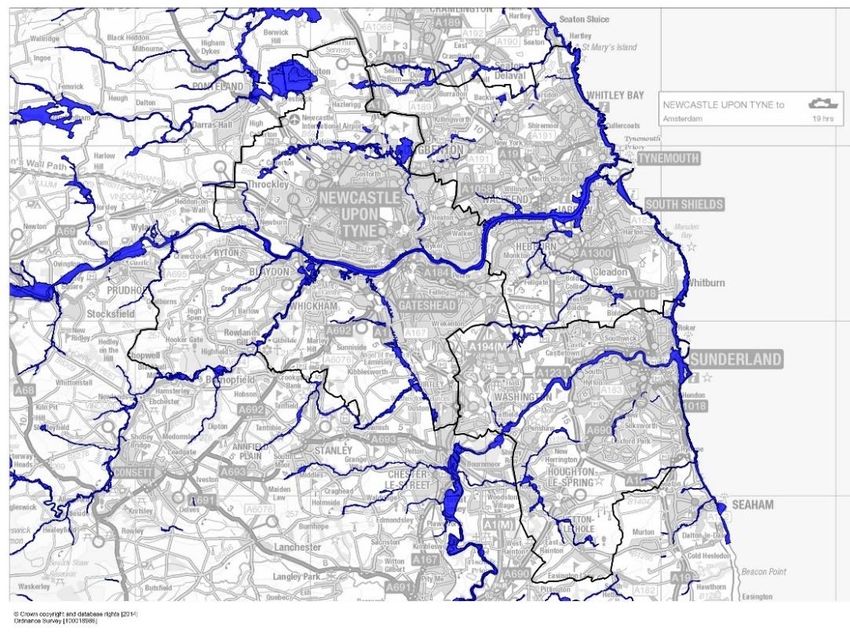
Success in Reducing Risks

Our approach to managing risk has enabled Tyne and Wear Fire                       Percentage Change in Accidental Dwelling Fires
and Rescue Service (TWFRS), working with key partners, to drive                                  2009/10 - 2016/17
                                                                        20%
down risk and therefore reduce incidents, over a period of more than
8 years.                                                                10%

When we analyse our performance, we compare ourselves to the             0%

                                                                               Warwickshire
                                                                               Avon
                                                                               Durham
                                                                               Cleveland
                                                                               Lancashire
                                                                               Humberside
                                                                               Kent
                                                                               Isle Of Wight
                                                                               Cambridgeshire
                                                                               Merseyside
                                                                               Suffolk
                                                                               West Yorkshire
                                                                               Hampshire
                                                                               Derbyshire
                                                                               Tyne & Wear
                                                                               Royal Berkshire
                                                                               South Yorkshire
                                                                               Cornwall
                                                                               Northamptonshire
                                                                               Dorset
                                                                               Nottinghamshire
                                                                               Greater Manchester
                                                                               Bedfordshire
                                                                               Oxfordshire
                                                                               Greater London
                                                                               Devon & Somerset
                                                                               North Yorkshire
                                                                               Cheshire
                                                                               West Midlands
                                                                               Shropshire
                                                                               Hereford & Worcester
                                                                               Norfolk
                                                                               Leicestershire
                                                                               Staffordshire
                                                                               Buckinghamshire
                                                                               Lincolnshire
                                                                               Northumberland
                                                                               Hertfordshire
                                                                               East Sussex
                                                                               West Sussex
                                                                               Cumbria
                                                                               Essex
                                                                               Gloucestershire
                                                                               Isles Of Scilly
                                                                               Surrey
                                                                               Wiltshire
other Fire and Rescue Services (FRS) in our ‘family group’ as          -10%
categorised by Government. The group is more commonly referred
to as ‘the Mets’ and includes: Greater Manchester FRS, London          -20%

Fire Brigade, Merseyside FRS, South Yorkshire FRS, West                -30%
Yorkshire FRS and West Midlands FRS.
                                                                       -40%
The charts on this page illustrate how our risk based approach has
                                                                       -50%
helped reduce accidental fires in peoples’ homes and how the
number of all incidents has reduced across the Tyne and Wear area                All incidents attended by TWFRS 2009/10 - 2016/17
since 2009/10.
                                                                       20000
A full range of data on how we are performing is contained in our
Annual Report / Statement of Assurance.                                15000

                                                                       10000

                                                                        5000

                                                                           0
                                                                               2009/10 2010/11 2011/12 2012/13 2013/14 2014/15 2015/16 2016/17

                                                                                     Fires     False Alarms       Special Services        All Incidents

 Community Risk Profile 2017 – 2020                                                                   Tyne and Wear Fire and Rescue Authority
                                                                                                                   Creating the Safest Community          7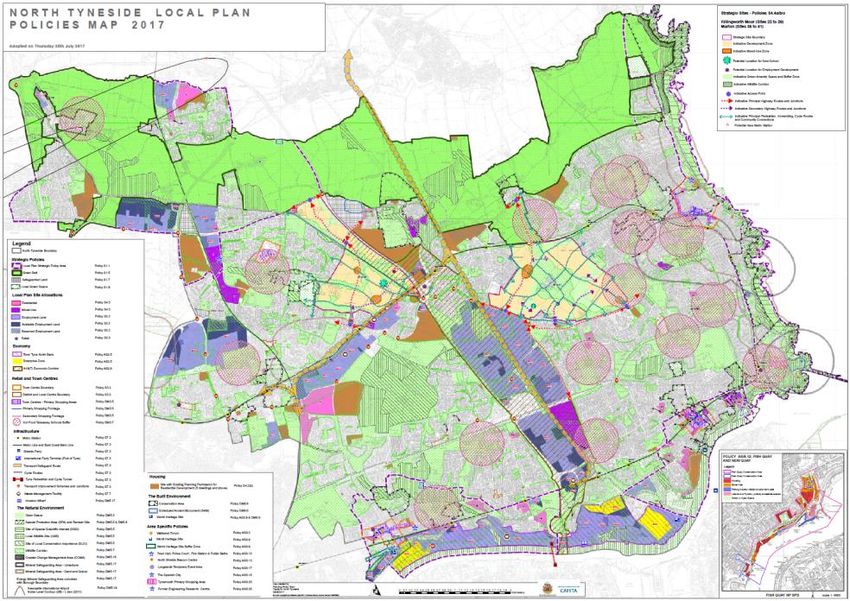
Population
Population is a key risk factor for fire and rescue as reflected in the Population Density (people per hectare)
current Government arrangements for funding fire and rescue
authorities (FRAs). Put simply, risk goes with people and the
number of people in an area is a key determinant of risk alongside
social factors in how the population is made up. As a Metropolitan
FRA covering five densely populated urban local authority areas,
population is a key consideration throughout our planning
Based on 2011 census data, the population of Tyne and Wear is
1.104 million with an average age of 40 years.
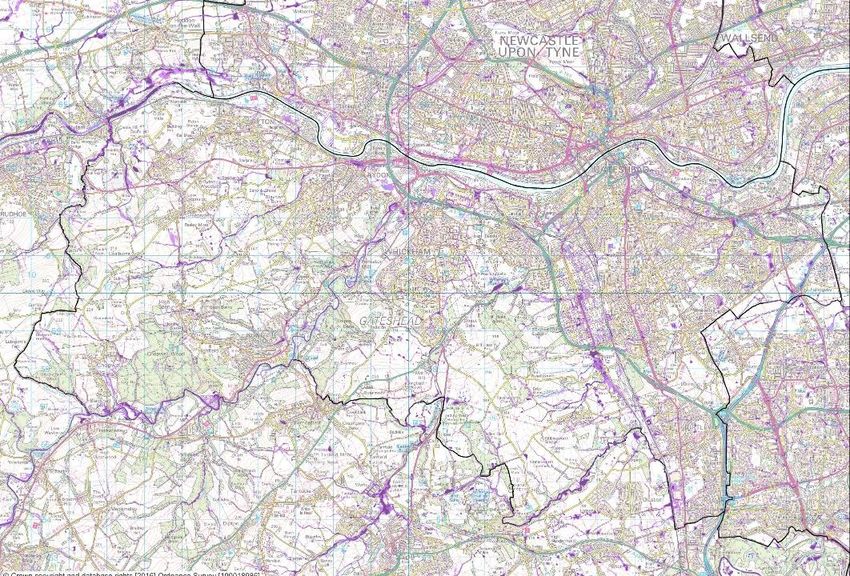
The relative density of Tyne and Wear’s population is shown in the
mapiii (circled area).
Community Risk Profile 2017 – 2020 Tyne and Wear Fire and Rescue Authority
Creating the Safest Community 8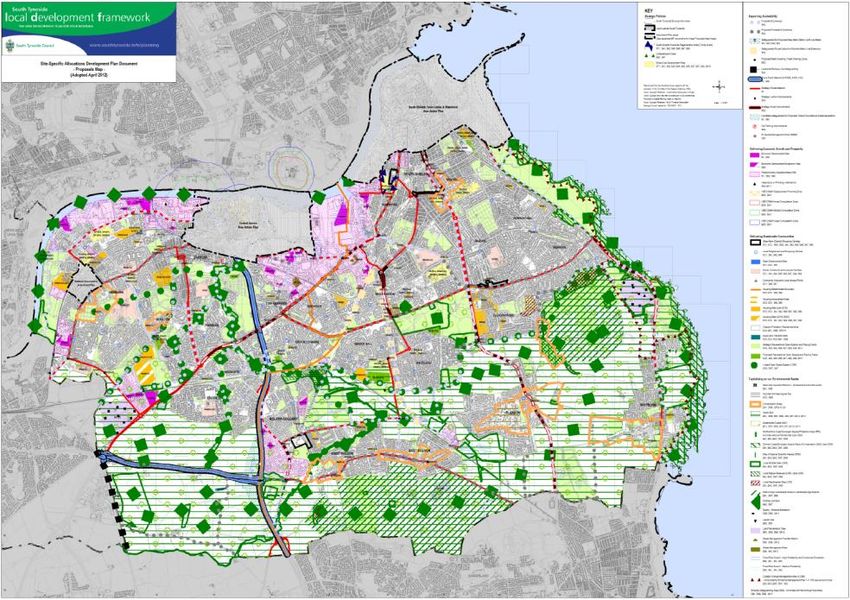
The following chart shows the population of Tyne and Wear broken In the decade between census 2001 and census 2011, the
down across the Local Authority areas: population in Tyne and Wear showed an increase of 1.6% (17,300).
Local Authority Population, Census 2011 The rate of population change in each constituent Local Authority
was as follows:
300,000 280,177 275,506
Gateshead: +9,100 (+4.8%)
250,000
Newcastle: +12,900 (+4.8%)
200,214 200,801
200,000 North Tyneside: +9,200 (+4.8%)
150,000
148,127 Sunderland: -9,300 (-3.3%)
South Tyneside: -4,600 (-3.0%)
100,000
50,000 Population by Local Authority Area and Age Group,
Census 2011
0 90,000 350,000
Gateshead Newcastle North South Sunderland
Population per age group by district
Total population per age group
Tyneside Tyneside 80,000
300,000
70,000
A Growing and Ageing Population 250,000
60,000
50,000 200,000
The age structure of the population within Tyne and Wear is set out
below: 40,000 150,000
0-14 years: 16.31% 30,000
100,000
15-24 years: 14.5% 20,000
50,000
25-44 years: 26.18% 10,000
45-64 years: 26.35% 0 0
0-14 15-24 25-44 45-64 65-84 85+
65-84 years: 14.53%
85+ years: 2.13% Gateshead Newcastle North Tyneside
Over 50% of the population are within the 25 to 64 age group and South Tyneside Sunderland Total per Age Group
those aged 65 and over make up over 16%.
Community Risk Profile 2017 – 2020 Tyne and Wear Fire and Rescue Authority
Creating the Safest Community 9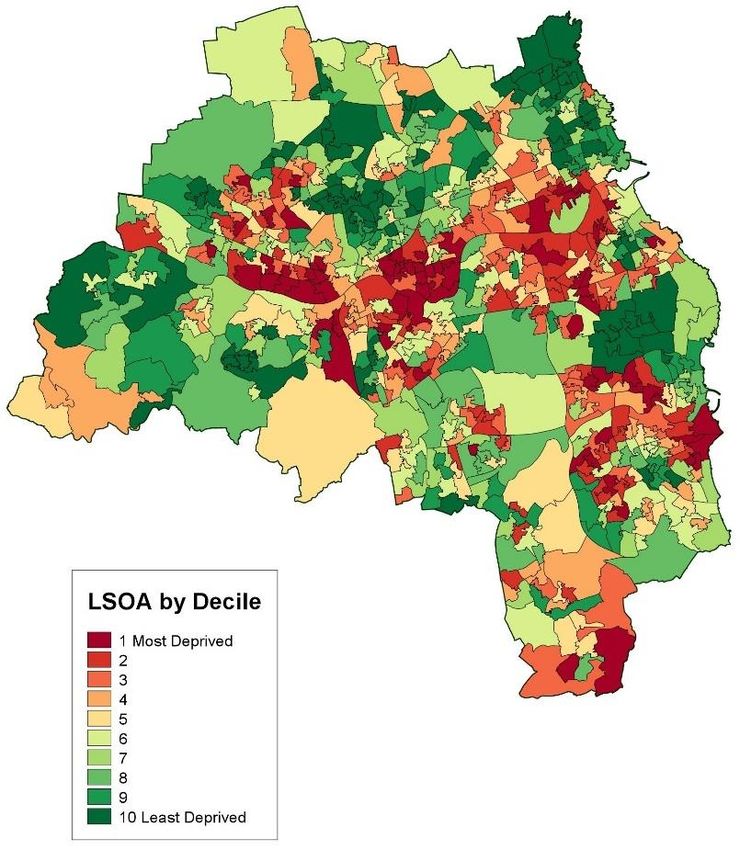
Regional projections indicate that this picture is set to change again                                 In terms of changes by age band, the projections for Tyne and Wear
by 2021 with Tyne and Wear’s total population rising to 1.160m, a                                      are as follows:
5.1% increase spread across all of the constituent local authorities.
This is lower than that in most other metropolitan areas (Greater                                      Under 25s: In 2021 the 0-14 age group is expected to remain at
Manchester 6.5%, West Midlands 7.6%, South Yorkshire 5.7%,                                             around 16% of the population total. The percentage share of the
                                                                                                       population relating to the 15-24 age group is expected to reduce
West Yorkshire 9.1%) other than Merseyside (0.8%).
                                                                                                       from 14.5% to 12.74%.
                 Total Population (000s): Tyne and Wear Authorities                                    25-44: The percentage share of the population in this group is
                        2001 - 2021 (projected), Census 2011
                                                                                                       expected to remain around 26%.
 350
                                        299

                                                                                                       45-64: The percentage share of the population in this group is

                                                                                     285

                                                                                                 284
                                  279

                                                                                           275
 300                                                                                                   expected to reduce from 26.4% to 24.8% by 2021.
                            266

 250                                                                                                   65 and over: The regional projectionsiv indicate that “the
                                                           216
                      207

                                                     201
                200

                                                                                                       percentage of the population aged 65 and over is projected to be
                                               192
          191

 200                                                                                                   one of the fastest growing among the regions”. The percentage
                                                                              154
                                                                 153
                                                                        148

                                                                                                       share of the population relating to the 65 and over age group is
 150
                                                                                                       expected to show an increase from 16.66% to 18.89% which is an
 100                                                                                                   increase of 19% from 2011 to 2021.

  50

   0
         Gateshead          Newcastle           North             South             Sunderland
                                               Tyneside          Tyneside

       2001 Population (000s)           2011 Population (000s)         2021 Population (000s)

 Community Risk Profile 2017 – 2020                                                                                                Tyne and Wear Fire and Rescue Authority
                                                                                                                                                Creating the Safest Community   10
There is a clear indication that Tyne and Wear like the country in Accidental dwelling fire related fatalities
general, is encountering an ageing population. This is illustrated in by age group 01/04/2009 - 31/03/2017
the graph below which shows the percentage change in population 10 9
based on mid-year population estimates from 2011v. 9
8
7 6
% Change in Population Estimates 2011 - 2021 6
Census 2011 5
4
45.0
3
40.0 2 1
35.0 1 0
0
30.0 0-15 16-39 40-64 65+
23.6
25.0 18.6 20.8
20.0 22.7 Accidental dwelling fire related injuries
19.1 65+
15.0 3.7 19.8 21.5
by age group 01/04/2009 - 31/03/2017
14.3 3.8 3.0 16-64
10.0
0.9 0-15 500
12.6 10.8 11.0 420
5.0 7.9 7.3 450
6.0 5.3 3.3
387
0.0 400 355
-0.7 -0.4 -1.0 350
-1.7
-5.0 300
250
200
150 94
100
50
0
Age is a risk factor for fire. The following charts show fire deaths 0-15 16-39 40-64 65+
and injuries in Tyne and Wear by age group. Our targeting and
delivery policies take account of this as described later in this Since the largest percentage increase in population is in the 65 and
document. It is worth noting that our community is among the safest over category, our policies, procedures and resource allocation will
in the country from fire deaths and injuriesvi. need to be continually adapted to protect this vulnerable group.
Community Risk Profile 2017 – 2020 Tyne and Wear Fire and Rescue Authority
Creating the Safest Community 11Ethnicity Main Language
Comparison of the last two censuses show that the population of In relation to language, the vast majority (95.9%) of residents aged
Tyne and Wear is becoming more ethnically diverse: in 2001 95.4% 3 or over use English as their main language. However, there are a
of the population declared themselves as White British whereas in number of other languages spoken within Tyne and Wear which
2011 this figure was 91.5%. largely correspond to the migration patterns experienced in each
local area.
The breakdown of the population by local authority area is as
followsvii. The most commonly spoken languages as defined in the census
2011 are shown belowviii.
Black/ Mixed
Asian/ African/ and Language Speakers %
White White
Council Asian Caribbean/ multiple Other
British other
Area British Black ethnic (%) English 1,021,903 95.9%
(%) (%)
(%) British groups Bengali 4,907 0.46%
(%) (%)
All other Chinese
Gateshead 94.1 2.2 1.9 0.5 0.8 0.5 4,783 0.45%
(exc: Mandarin, Cantonese)
Newcastle 81.9 3.6 9.7 1.8 1.5 1.5
Polish 3,715 0.35%
North
95.1 1.5 1.9 0.4 0.9 0.2 Arabic 3,203 0.30%
Tyneside
South Urdu 2,111 0.20%
95.1 0.9 2.2 0.3 0.9 0.7 Persian/Farsi 1,776 0.17%
Tyneside
Sunderland 94.8 1.1 2.7 0.5 0.6 0.3 Panjabi 1,623 0.15%
Tagalog/Filipino 1,237 0.12%
French 1,231 0.12%
All Other Languages 19,642 1.84%
Community Risk Profile 2017 – 2020 Tyne and Wear Fire and Rescue Authority
Creating the Safest Community 12Religion
Religions of Tyne and Wear Residents, Census 2011
65% of the population across Tyne and Wear identified themselves
as Christian in the 2011 census. A further 24.9% stated that they
0% 20% 40% 60% 80% 100%
followed no religion, while 5.96% did not state a religious preference
on their census return. Christian 65.00%
No religion 24.90%
The religions followed by Tyne and Wear residents are shown on
the opposite chart. Religion not stated 5.96%
Muslim 2.50%
Hindu 0.45%
Jewish 0.35%
Buddhist 0.30%
Sikh 0.29%
Other religions 0.24%
Community Risk Profile 2017 – 2020 Tyne and Wear Fire and Rescue Authority
Creating the Safest Community 13Housing
33.5% of homes within Tyne and Wear are one-person households, 21.2% of all households within Tyne and Wear are aged 65 or over;
the majority of which fall into the ‘aged 50 and over’ category. the percentage in Newcastle is somewhat lower than in other parts
of Tyne and Wear.
When looking further into the composition of these households,
most are single females. % of Households Aged 65 or over, 2011 Census
Male / Female split of one person households 25
22.8
21.9 22.0 21.6
100%
20 18.7
90%
80%
15
70%
67% 66% 70% 69% 70%
60%
10
50%
40%
5
30%
20%
33% 34% 30% 31% 30% 0
10% Gateshead Newcastle North South Sunderland
0% Tyneside Tyneside
Gateshead Newcastle North South Sunderland
Local Authority Tyne and Wear
Tyneside Tyneside
Male Female
40% of one-person households are aged 65 or over, 68% of which
are female.
Community Risk Profile 2017 – 2020 Tyne and Wear Fire and Rescue Authority
Creating the Safest Community 14It is expected that households in Tyne and Wear will increase by In terms of tenure, 41% of individuals rent their properties which is
14% by 2039ix and one-person households will continue to make up higher than the national average of 34.5%.
the greatest proportion.
Households by Tenure
Sunderland
Household Projections 2039
9.6% South Tyneside
34.6% North Tyneside
25.2%
Newcastle
6.3%
24.3% Gateshead
0 20,000 40,000 60,000 80,000 100,000 120,000
One person Couple and no other adult North South
Gateshead Newcastle Sunderland
Tyneside Tyneside
Couple and one or more other adult Households with dependent children
Owned 51,915 57,955 59,136 38,333 71,566
Other Shared Ownership 363 489 374 297 352
Social Rented 24,941 34,850 19,677 21,204 32,399
Private Rented 11,125 22,318 11,300 6,758 14,552
Living Rent Free * 810 1,541 808 575 889
* The owner is not asking for payment
Community Risk Profile 2017 – 2020 Tyne and Wear Fire and Rescue Authority
Creating the Safest Community 15Dwelling Stock Household makeup, tenure and length of residence all have an
influence on fire risk and is reflected in the incidents that occur. For
In April 2017 it was identified that Tyne and Wear is made up of example, analysis of accidental dwelling fires for TWFRS during
512,100 dwellingsx. This is an increase of 2% (10,160) since 2011 2015/16 and 2016/17 indicates that such fires are more likely to
and is distributed as follows: occur in rented accommodation (see following chart).
Local Private Other Accidental Dwelling Fires by Ownership
Private
Council Area Authority Registered Public Total 2015/16 - 2016/17
Sector
Owned Provider Sector
2%
7% Housing
Association
Tyne and Wear 78,370 59,590 1,400 372,740 512,100
Other
Gateshead 19,690 5,090 400 68,300 93,480 34%
Newcastle 25,960 9,850 1,000 87,880 124,690 Owner
36% Occupied
North
15,390 5,660 0 75,650 96,700
Tyneside Private
South Rented
17,340 4,760 0 49,020 71,120
Tyneside
21% Social
Sunderland 0 34,240 0 91,880 126,110 Rented
Community Risk Profile 2017 – 2020 Tyne and Wear Fire and Rescue Authority
Creating the Safest Community 16Short Term Residence
Population transience and short term residence are other
challenges we face in Tyne and Wear. The census only captures
short term residence where this relates to people born outside the
UK.
The census map opposite shows non-UK born residents per 10,000
usual residents for England and Wales broken down into local or
unitary authority districts. The numbers are particularly high in
Newcastle.
Another contributory factor in the transient population of the area is
the student population. Tyne and Wear has three universities – two
in Newcastle and one in Sunderland.
Student numbers for our universities were as follows in 2015/16xi.
University Postgraduate Undergraduate Total
Newcastle 6,070 17,720 23,790
Northumbria 4,750 22,415 27,165
Sunderland 2,425 10,575 13,000
It will be less likely that a Home Safety Check, along with the
accompanying fire safety in the home advice, will have taken place
in these types of premises.
Community Risk Profile 2017 – 2020 Tyne and Wear Fire and Rescue Authority
Creating the Safest Community 17Growth and Development
Along with population growth, the social and economic regeneration Non-Domestic Properties
activities led by our local authority partners influence the changing
shape of the built environment and the makeup of different New non-domestic premises are also imported automatically into
CFRMIS. Depending on the use of the premises (and associated
communities over the years.
risk) a fire safety visit will be scheduled for a point in the future in
Tyne and Wear FRS is informed of new properties (both domestic accordance with the standard re-inspection frequencies held in
and non-domestic) when we receive gazetteer updates from CFRMIS’s Inspection Frequency Officer Grade (IFOG) planner.
Ordnance Survey; however we also work with partners to identify
The Fire Safety pending workload schedule is evaluated annually
forward plans to inform our own strategic planning.
and premises audits are prioritised based on risk, premises type,
Domestic Properties previous compliance and fire trend data. Any non-domestic
premises that have been demolished or that have ceased trading,
New premises are routinely added to CFRMIS through the will not form part of the Risk Based Inspection Programme.
gazetteer update and at the same time evaluated (as part of the
import process) to determine their MOSAIC classification type code. In terms of forward planning the following pages set out some of the
Properties are then filtered into the relevant priority group for HSC changes envisaged throughout Tyne and Wear based on our
or risk based inspection targeting in line with the current strategy. planning strategy.
Similarly, any domestic premises that have been demolished will
have their building status amended accordingly in CFRMIS and will
cease to appear on any targeting reports.
Community Risk Profile 2017 – 2020 Tyne and Wear Fire and Rescue Authority
Creating the Safest Community 18Newcastle and Gateshead Some key elements from the plan specific to Newcastle include:
Newcastle and Gateshead have been working together to produce 21,000 new homes to be built.
The Core Strategy and Urban Core Planxii will guide development 14,000 additional jobs created in areas such as offshore
in Newcastle and Gateshead through to 2030. engineering and life sciences.
The map below illustrates housing developments planned for the Business expansion on sites such as: Science Central, East
two local authority areas. Pilgrim Street, the Central Station and Stephenson Quarter,
on the banks of the Tyne and at Newcastle International
Airport.
Some key elements from the plan specific to Gateshead include:
11,000 new homes to be built.
8,000 new jobs created.
Regeneration of the area close to Dunston, Metrocentre and
the River Derwent.
District and local centres to be revitalised and strengthened;
examples being Birtley, Blaydon and Felling.
Development of Gateshead Quays and Baltic Business
Quarter.
The full plan can be found at: www.newcastle.gov.uk.
Community Risk Profile 2017 – 2020 Tyne and Wear Fire and Rescue Authority
Creating the Safest Community 19North Tyneside The key elements of the plan include:
The map below is an extract from the North Tyneside Local Plan Protect the Green Belt in North Tyneside
2017xiii showing potential development sites over the next 15 years.
Provide new accessible open space – adding to the 25% of the
borough that is already open space.
Regenerate and redevelop brownfield sites and deliver
appropriate development of sustainable greenfield land
amounting to around seven per cent of the borough’s area – to
support at least 12,700 new jobs and 23,000 more residents.
Prioritise regeneration in Wallsend, North Shields, the coast
and the North West.
Ensure development considers the environmental, social and
economic conditions of the area.
The full plan can be found at: www.northtyneside.gov.uk
Community Risk Profile 2017 – 2020 Tyne and Wear Fire and Rescue Authority
Creating the Safest Community 20South Tyneside
The South Tyneside Local Development Frameworkxiv sets out a
number of proposals for the area including:
Meeting the demand for up to 12,000 new homes over the next
20 years working with a range of housing providers.
Investing £180m in new and improved homes building on the
success of 71 new affordable homes in Hebburn and UK’s
biggest solar-powered social housing project at Sinclair
Meadows in South Shields, securing economic growth by
building on the borough’s reputation in marine, offshore and
automotive industries to become a leading centre for advanced
engineering and manufacturing. This will be supported by the
ongoing partnership with Sunderland through the ‘City Deal’
agreement to drive economic growth for the borough and
region.
Major new transport schemes such as Testo’s Grade The full plan can be found at: www.southtyneside.gov.uk
Separation, the extension of the Metro line and A185
improvements.
Development plans for Hebburn Town Centre, Jarrow and
South Shields Town Centres and Waterfront.
Regeneration plans are also to be developed for Boldon,
Whitburn and Cleadon.
Community Risk Profile 2017 – 2020 Tyne and Wear Fire and Rescue Authority
Creating the Safest Community 21Sunderland
Part of Sunderland’s Local Planxv is the Core Strategy and
Development Plan which is a long-term plan for development
across the city to 2033. The full plan can be found at
www.sunderland.gov.uk.
Some key points from the plan include:
13,824 new homes to be built across the city in various
locations.
An aim to provide an additional 10,337 new jobs.
Regeneration of the city centre to provide extra retail and
leisure facilities whilst limiting the number of hot food
takeways.
Ensure that the impact of the development on the city’s
environment is limited.
Produce an ‘Infrastructure Delivery Plan’ to set out the
facilities required to deliver the proposed development .
In 2018, a new bridge crossing the River Wear will be opened which
is anticipated to provide a huge economic, social and community
impact.
Community Risk Profile 2017 – 2020 Tyne and Wear Fire and Rescue Authority
Creating the Safest Community 22Deprivation
As well as the overall makeup of the population, national researchxvi Each of these domains has its own scores and ranks, allowing users
indicates that there is a correlation between deprivation in an area to focus on specific aspects of deprivation. To allow consistency for
and fire risk. In particular, risk of accidental dwelling fires / comparisons, the whole country was divided into areas containing
casualties arising from these and risk of deliberate (anti-social a population of around 1,500 people. These areas are called Lower
behaviour) fires. Super Output Areas (LSOA).
Indices of Deprivation Based on average ranks, Tyne and Wear residents experience
levels of deprivation among the highest in the country, as illustrated
The Office of National Statistics (ONS) produce Indices of below.
Deprivation (IMD) every five years and was last updated in 2015xvii.
These provide a relative measure of deprivation at small area level Regional Average Rank Average IMD Rank
across England. Areas are ranked from least deprived to most Tyne and Wear Most Deprived 13184
deprived on seven different dimensions of deprivation and an
North East 13586
overall composite measure of multiple deprivation. The domains
are: North West 14040
London 14065
income deprivation
West Midlands 14576
employment deprivation
Yorkshire and The Humber 14661
health deprivation and disability
East Midlands 16887
education, skills and training deprivation
South West 18073
crime
East of England 18828
barriers to housing and services South East Least Deprived 20825
living environment deprivation
Community Risk Profile 2017 – 2020 Tyne and Wear Fire and Rescue Authority
Creating the Safest Community 23Deprivation varies between and within local authority areas. Based Deprivation by Lower Output Areas
on a ranking of average ranks, the Tyne and Wear local authority
areas are ranked as follows out of 326 local authority areas:
Newcastle: 30th most deprived
South Tyneside: 34th
Sunderland: 42nd
Gateshead: 78th
North Tyneside: 120th
When assessed by population weighted average of the combined
ranks for the LSOAs in a local authority district; South Tyneside,
Sunderland and Gateshead are ranked 31st, 38th and 80th
respectively. Newcastle is 92nd and North Tyneside 138th.
The following map shows Tyne and Wear and ranks the LSOA on
a decile scale of 1 to 10 (most deprived to least deprived). The areas
of greatest deprivation have a tendency to be clustered in former
areas of heavy industry (e.g. along riverbanks or former coal mining
areas) and in city or town centres.
Community Risk Profile 2017 – 2020 Tyne and Wear Fire and Rescue Authority
Creating the Safest Community 24Unemployment
Level of employment is a key element in the makeup of deprivation
rankings. The North East of England (including Tyne and Wear) is
experiencing some of the highest unemployment figures in the
country.
The map on this page shows unemployment amongst those aged
16 and over with the inset showing Tyne and Wear in detail. All parts
of Tyne and Wear have a higher than average proportion of adult
unemployment as measured through receipt of out of work benefits.
A regional labour market review in September 2017 by ONSxviii
showed that although unemployment levels are decreasing, the
North East continues to have the highest rate of unemployment in
the country (6.0%) as well as the highest claimant count rate (4.1%).
Unemployment amongst 16-24 years olds also remains particularly
high. All parts of Tyne and Wear are experiencing levels higher
than the national average.
Community Risk Profile 2017 – 2020 Tyne and Wear Fire and Rescue Authority
Creating the Safest Community 25Worklessness In 2016, out of the 201 county / unitary authorities in Great Britain,
the Tyne and Wear local authority areas are ranked as follows:
In recent years the percentage of workless households in England
has fallenxix. Although Tyne and Wear has seen a decrease, not all
Newcastle – 11th
local authority areas within Tyne and Wear have followed this trend.
South Tyneside – 26th
Sunderland – 45th
Workless Households
Gateshead – 59th
Area 2012 2013 2014 2015 2016
North Tyneside – 132nd
(%) (%) (%) (%) (%)
England 17.6 16.7 15.8 14.9 14.6
Tyne and Wear 24.8 23.5 21.3 20.2 19.3 The North East region has the highest percentage of workless
Gateshead 24.8 23.1 18.9 16.7 18.5 households in the country at 20.1%.
Newcastle 25.4 26.7 22.5 23.6 23.0
North 19.3% of households in Tyne and Wear are workless. This is higher
22.3 20.5 16.0 14.3 13.6 than England as a whole which is 14.6%.
Tyneside
South
25.9 21.9 20.8 20.1 21.2
Tyneside
Sunderland 25.6 23.5 26.0 23.6 19.1
Community Risk Profile 2017 – 2020 Tyne and Wear Fire and Rescue Authority
Creating the Safest Community 26The following table shows the economic activity of households in In 2016, the reasons given for not working both nationally and in the
England. North East, are as follows:
Working Mixed Workless
English Reasons for Not Working 2016
Households Households Households
Regions
(%) (%) (%)
100%
England 57 29 15 9.1 6.7
North East 54 26 20 90%
10.4
Tyne and Wear 54 27 19 13.3
80%
Gateshead 56 26 19 16.7
70% 16.9
Newcastle 52 25 23
North 60% 15.4
Tyneside 60 27 14
16.8
South 50%
Tyneside 53 26 21 15.4
40%
Sunderland 52 29 19 13.7
North West 54 28 18 30%
Yorkshire And
57 27 17 20%
The Humber 30.2
35.4
East Midlands 58 27 15 10%
West Midlands 53 31 16
0%
East of England North East
60 27 13
England
Sick/disabled Unemployed
London 54 33 13
Retired early Looking after family / home
South East 59 29 12
Study Other
South West 59 28 13
Community Risk Profile 2017 – 2020 Tyne and Wear Fire and Rescue Authority
Creating the Safest Community 27Health and Wellbeing
The health and wellbeing of the community at large and sections of
the population within it, are also key elements of deprivation
rankings which impact on community risk; including risk of fire and
other harm.
Overall, across a range of public health indicators included in Public
Health England health profilesxx, health in Tyne and Wear is
significantly worse than the national average. These indicators
include:
Adults smoking, smoking in pregnancy and smoking related
deaths
Obese children (Year 6)
Increasing and higher risk drinking
Hospital stays for alcohol related harm
Drug misuse
Male and female life expectancy
Early deaths from heart disease and cancer
A number of these factors are also directly related to risk of fires,
deaths and injuries.
Community Risk Profile 2017 – 2020 Tyne and Wear Fire and Rescue Authority
Creating the Safest Community 28Alcohol Use The rate of hospital admissions in Tyne and Wear for alcohol
attributable conditions per 100,000 population (2015/16) is higher
Alcohol is very much a part of the culture of the North East and has than the rest of Englandxxii.
been highlighted as a serious issue.
The chart below outlines the number of admissions per 100,000 of
The table below shows some key facts relating to alcohol and how
the Tyne and Wear population where the cause for admission is
our local authority areas compare to the national averagexxi.
primarily, wholly or partly related to alcohol misuse.
In comparison to England Better Similar Worse Alcohol Related Hospital Admissions per 100,000
population 2015/16
4,510
5,000
Sunderland
Gateshead
Newcastle
Tyneside
Tyneside
England
4,500
3,880
3,800
South
North
3,650
3,650
Indicator Period 4,000
3,270
3,500
2,830
2,760
2,720
2,670
Alcohol-specific 2013 - 3,000
11.5 17.8 15.8 17.5 18.7 21.1
2,250
mortality * 2015
1,970
1,910
1,910
Alcohol-related 2,500
1,810
2015 46.1 57.1 55.0 57.0 47.4 68.5
mortality *
2,000
Claimants of
benefits due to 2016 132.8 233.5 239.3 202.2 241.9 232.1 1,500
alcoholism *
Alcohol related 1,000
2013 -
road traffic 26.0 25.6 14.9 25.5 19.3 26.1
2015
accidents 500
Number of
premises licensed 2015 0
1.3 3.7 9.1 6.6 7.5 5.6 Gateshead Newcastle North South Sunderland
to sell alcohol per /16
Tyneside Tyneside
square kilometre
(* per 100,000 population; per 1,000 population) All Male Female
Community Risk Profile 2017 – 2020 Tyne and Wear Fire and Rescue Authority
Creating the Safest Community 29National historic statistics have shown that fire and rescue services
TWFRS Primary Fires where Drug or Alcohol
attend a large number of alcohol and drug related fires. This is borne Impairment is Suspected 2009/10 - 2016/17
out by the observations of Tyne and Wear firefighters attending 100
incidents. 89
90
It is estimated that of the 14,744 primary fire incidents attended by 80 75
TWFRS between 2009/10 and 2016/17, 4.6% were suspected of 72
68
72
70
having drug or alcohol impairment as a contributory factor. Quite
58 59
often the cause is due to people drinking alcohol and then falling 60
53
asleep whilst cooking or smoking. 50
The chart opposite shows the breakdown of these incidents. 40
30
22 22 23
20 19
20
13
9 9
10
0
2009/10 2010/11 2011/12 2012/13 2013/14 2014/15 2015/16 2016/17
Accidental Deliberate
Community Risk Profile 2017 – 2020 Tyne and Wear Fire and Rescue Authority
Creating the Safest Community 30Smoking Mortality rates attributable to smoking are shown in the following
graph with the North East experiencing a higher rate per 100,000
Smoking also remains prevalent in the North East where 17.2% of population then all other regions of England.
adults are smokersxxiii. Although smoking is on the decrease, it is
still a contributory factor in the health of the region.
Smoking attributable mortality per 100,000 population
aged 35+ (2013-15)
The table below shows the estimated prevalence of smoking by
400
local authority areaxxiv. 369.0
342.9
350
Area Estimate of current smokers (%) 323.9
England 15.5 300 283.5 285.4 280.9
260.4 254.3 249.4
Gateshead 17.9 250
246.2
Newcastle 17.6
200
North Tyneside 16.4
150
South Tyneside 18.5
Sunderland 18.0 100
50
0
England
England
North
North
London
Midlands
Midlands
Yorkshire and
South
South
West
West
East
East of
East
the Humber
West
East
Community Risk Profile 2017 – 2020 Tyne and Wear Fire and Rescue Authority
Creating the Safest Community 31Smoking prevalence is a risk factor for fire. Over the eight years Tyne and Wear has a relatively low incidence of fire deaths
between 2009/10 and 2016/17, 4.8% of primary fires were smoking compared to other metropolitan areas. However, smoking has been
related. The chart below shows the breakdown of these incidents a factor in a number of the fire deaths which have happened in
by district. recent years.
Our partnership document “If only we’d known …” contains a
Smoking Related Primary Fires in Tyne and Wear
2009/10 - 2016/17 number of case studies about fire deaths including the cases of
Elsie and Mark who were both heavy smokers. The document
300
illustrates the extra assistance and advice TWFRS can give to
vulnerable individuals who smoke.
250
96
200
150
38
100
19 176 21
16
114
50
79 79 74
0
Gateshead Newcastle North South Sunderland
Tyneside Tyneside
Smoking materials Cigarette lighter
Over the same period, 8.3% of accidental dwelling fires were
smoking related.
Community Risk Profile 2017 – 2020 Tyne and Wear Fire and Rescue Authority
Creating the Safest Community 32Drug Use National Statistics show that in 2015/16, the North East region
ranked second in the country for the number of hospital admissions
The most recent Crime Survey for England and Walesxxv indicates per 100,000 population for drug usexxvi.
that drug use has fallen in England.
In 2016/17 the statistics show that: Number of
admissions
Region Total Male Female
per 100,000
Around 1 in 12 (8.5%) adults aged 16 to 59 had taken a drug in
population
the last year. This is similar to 2015/16 but significantly lower
than a decade ago. England 15,279 26 8,116 6,956
North East 937 36 532 405
Around 1 in 25 (4.0%) adults aged 16 to 59 had taken a drug in North West 3,133 44 1,683 1,450
the last month, while one in 11 (9.0%) young adults aged 16 to Yorkshire and the
24 had done so. 1,644 31 895 749
Humber
East Midlands 1,268 27 693 574
Around 1 in 5 (19.2%) young adults aged 16 to 24 had taken a
West Midlands 1,524 27 835 689
drug in the last year.
East of England 1,319 22 673 646
Around one-third (34.2%) of adults aged 16 to 59 had taken London 1,214 14 672 541
drugs at some point during their lifetime. South East 2,049 23 1,031 1,018
South West 1,549 29 748 801
Drug use is a risk factor in fire, although it is not considered to be
as prevalent a risk factor as smoking or alcohol use.
Community Risk Profile 2017 – 2020 Tyne and Wear Fire and Rescue Authority
Creating the Safest Community 33Mobility
The physical mobility of members of the community is anecdotally
a risk factor for fire and also for ability to raise the alarm or get to
safety should a fire occur, although incident analysis does not find
a significant statistical correlation between mobility and fire injuries
in Tyne and Wear.
Whilst Tyne and Wear has the lowest population of metropolitan fire
authority areas, census data 2011 shows that the percentage of
individuals in our population who have a long term illness or
disability is one of the highest. This is broken down into those
whose day to day activities are limited a lot, those whose activities
are limited a little and the sum of both.
When looking at the percentage of the population whose day to day
activities are limited a lot, Tyne and Wear is ranked 2nd highest of
the metropolitan areas. When looking at the percentage of the
population whose day to day activities are limited a little, Tyne and
Wear is ranked 1st.
The map on this page is based on census data and shows the
percentage of the population whose day to day activities are limited
by ward. Byker and Walker in Newcastle and Hendon, Redhill and
Hetton in Sunderland are the areas with the highest proportion of
individuals who describe themselves as having limited activity.
Community Risk Profile 2017 – 2020 Tyne and Wear Fire and Rescue Authority
Creating the Safest Community 34Obesity Hospital Admissions related to Obesity
per 100,000 population 2015/16
In 2015/16 the national level of hospital admissions related to
70
obesity saw a 15% reduction on the peak in 2011/12, although this 62
is almost three times more than a decade agoxxvii. 60
50
Hospital Admissions Nationally related to Obesity
2005/06 - 2015/16 40
14,000 30 27 26
12,000 20 16
14 13 12 11
10,000 8
10
8,000 0
6,000
4,000
2,000
0
Obesity is linked to a number of health issues as well as to mobility;
although not representing a significant part of TWFRS’ operational
All persons Male Female workload, the number of bariatric rescues has increased in recent
years - this requires particular skills and training.
The North East has a higher level of obesity than any other area of
the country. This is shown in the following graph which illustrates
obesity related hospital admissions based on the patient’s region of
residence.
Community Risk Profile 2017 – 2020 Tyne and Wear Fire and Rescue Authority
Creating the Safest Community 35Mental Health
Cumbria and North
NHS Newcastle &
East NHS Region
NHS Sunderland
Gateshead CCG
Tyneside CCG
Tyneside CCG
NHS South
NHS North
Public Health England publish local profiles associated with mental
England
Period
CCG
healthxxviii. Some of the indicators relating to Tyne and Wear are
Indicator
shown opposite.
The table shows the figures for the North East Clinical
Commissioning Groups (CCGs) alongside the Cumbria and North Long-term mental health
2016/
problems (GP Patient 5.7 7.3 9.2 6.3 9.0 7.7
East NHS region and the average for England as a whole. Survey): (aged 18+) 17
Depression and anxiety
2016/
Some noticeable indicators include depression and anxiety prevalence (GP Patient
17
13.7 16.5 17.3 15.7 17.1 17.8
Survey): (aged 18+)
prevalence and the rates of hospital admissions as a result of self Depression recorded
2015/
harm; where the rate across all local CCGs is worse than the prevalence (QOF): (aged 8.3 9.2 8.1 8.2 9.9 8.9
18+) 16
national average. Depression recorded
2015/
incidence (QOF) - new 1.4 1.6 1.5 1.5 1.5 1.4
diagnosis: (aged 18+) 16
Hospital admissions as a
2014/
result of self harm (aged 10- 398.8 -- 440.2 535.5 506.3 516.6
24 years) * 15
2013-
Suicide rate * 10.1 -- 10.2 11.7 10.2 10.0
15
People on Care Programme 2016/
Approach (CPA): * (aged 17 383.0 425.0 383.0 364.0 289 256
18+) Q4
Stable and appropriate 2016/
accommodation: % of people 17 58.4 68.5 50.5 48.2 47.5 60.7
on CPA (aged 18-69) Q4
In comparison to England Better Similar Worse
(* per 100,000 population; % of respondents; % of practice register)
Community Risk Profile 2017 – 2020 Tyne and Wear Fire and Rescue Authority
Creating the Safest Community 36Wealth
Wealth is a key determinant of wellbeing.
The most recent Wealth and Assets Surveyxxix covers the period
from July 2012 to June 2014 and combines property wealth,
physical wealth, financial wealth and private pension wealth to
calculate overall household wealth.
The report shows that:
The North East has the lowest median household total wealth
with a value of £150,000, as shown in the map oppositexxx.
The North East region has one of the lowest ownership rates of
households who owned their own property and/or other property
of some kind.
Households in the North East had the lowest mean value of
physical wealth.
Households in the North East had the lowest median net
financial wealth value.
The North East have one of the lowest percentage rates of
households with wealth in private pensions.
Only 2% of households in the North East fall into the wealthiest
10% of households in Great Britain. This is the lowest of all
regions.
Community Risk Profile 2017 – 2020 Tyne and Wear Fire and Rescue Authority
Creating the Safest Community 37Crime and Anti-social Behaviour In terms of anti-social behaviour (ASB) the national trend is
downwardxxxiii, which is shown in the graph below. The graph also
The level of crime and anti-social behaviour in an area also features illustrates that the North East and the Northumbria police area,
in the makeup of deprivation profiles and community risk. which includes Tyne and Wear, lags behind England as a whole.
Northumbria Police have produced a Police and Crime Plan for
2017 – 2021xxxi which sets out how they will work with local
Anti-social Behaviour Incidents per 1,000 population
authorities and community safety partnerships to improve crime in 2009/10 - 2016/17
the Northumbria area. The chart below shows the total of all 120
recorded crime between 2009/10 and 2014/15 in our local authority
areasxxxii. 100
Total Recorded Crime 2009/10 - 2016/17 80
40000
33,517
60
35000
40
26,860
26,115
25,018
30000
24,340
22,890
22,113
20
21,124
21,013
20,568
25000
19,394
18,921
17,804
17,619
0
16,133
15,090
14,673
20000
14,247
2009/10 2010/11 2011/12 2012/13 2013/14 2014/15 2015/16 2016/17
12,769
12,543
11,713
10,638
10,454
15000 Cleveland Durham Northumbria
9,662
9,398
9,276
9,237
9,192
8,851
8,367
8,364
8,254
7,878
7,791
7,634
7,291
7,214
7,088
6,938
6,569
North East ENGLAND
10000
5000
0
Gateshead Newcastle North South Sunderland
Tyneside Tyneside
2009/10 2010/11 2011/12 2012/13
2013/14 2014/15 2015/16 2016/17
Community Risk Profile 2017 – 2020 Tyne and Wear Fire and Rescue Authority
Creating the Safest Community 38The map opposite gives further illustration to the issue of crime and
anti-social behaviour across England. It should be noted that these
are anti-social behaviour incidents reported to the police for each
Police Force area. There is no accurate overall measure of anti-
social behaviour across different organisations.
The table below shows the highest ranked Police Force areas and
Met FRSs.
Police Force ASB per 1,000 pop
Cleveland 76
South Yorkshire * 56
Lancashire 51
Northamptonshire 45
Greater Manchester * 44
Northumbria * 42
Gloucestershire 41
Derbyshire 40
Merseyside * 39
North Yorkshire 37
West Mercia 36
Bedfordshire 36
Durham 35
Metropolitan Police (London) * 32
West Yorkshire * 25
West Midlands * 21
* Met FRS area
Community Risk Profile 2017 – 2020 Tyne and Wear Fire and Rescue Authority
Creating the Safest Community 39This picture is also reflected in incidence of deliberate secondary Deliberate fires represent 73% of all fires in Tyne and Wear in
fires in Tyne and Wear. Despite reducing by 29% since 2009/10, 2016/17 against a national average of 47% in the same yearxxxiv.
Tyne and Wear’s level of deliberate secondary fires per 10,000 Although these fires tend to have a lower impact than other fire
population remains proportionately very high. The chart below types, the likelihood of them occurring is clearly a major element in
shows TWFRS in comparison with the other Mets. the fire risk facing Tyne and Wear.
Deliberate Secondary Fires in Met FRSs per 10,000 population
60.00 2009/10 - 2016/17
50.00
40.00
30.00
20.00
10.00
0.00
2009/10 2010/11 2011/12 2012/13 2013/14 2014/15 2015/16 2016/17
Greater London Greater Manchester Merseyside South Yorkshire Tyne & Wear West Midlands West Yorkshire
Community Risk Profile 2017 – 2020 Tyne and Wear Fire and Rescue Authority
Creating the Safest Community 40Road Traffic Collisions
Road traffic collisions (RTCs) account for the majority of the “special Of the 11,578 special service incidents during this five year period,
service” rescues undertaken by TWFRS, as indicated below. the top three incidents are:
TWFRS Special Service Incidents 1,750 (15%) RTCs
2012/13 - 2016/17 1,573 (14%) no action (not false alarm)
1750
2000 1,067 (9%) flooding
1573
1800
1600
In 2016, the number of reported road deaths from road traffic
1400
collisions in Great Britain increased by 4% in comparison to 2015
1067
and is the highest annual total since 2011xxxv. In Tyne and Wear
1019
1200
984
there has been no change in the number of road deaths and is the
842
1000
800
lowest figure over the last five years.
510
502
502
476
444
413
600 The number of reported casualties in Great Britain in 2016
268
266
221
400 189
continues to see reductions. Tyne and Wear saw a 16% decrease
174
127
93
93
61
200 when compared to 2015 and is the lowest figure for the county over
4
0 the last five years.
Water provision
Flooding
RTC
Medical Incident - Co-responder
Suicide/attempts
Making Safe (not RTC)
Lift Release
Animal assistance incidents
Removal of objects from people
Stand By
Evacuation (no fire)
No action (not false alarm)
Advice Only
Medical Incident - First responder
Hazardous Materials incident
Other rescue/release of persons
Assist other agencies
Removal of people from objects
Rescue or evacuation from water
Spills and Leaks (not RTC)
Other Transport incident
Effecting entry/exit
In 2016, England experienced a decrease of 2% in the number of
reported road traffic collisions. This downward trend is mirrored in
Tyne and Wear where there has been a decrease of 14%xxxvi.
Community Risk Profile 2017 – 2020 Tyne and Wear Fire and Rescue Authority
Creating the Safest Community 41This chart shows the comparative number of reported collisions When comparing the total reported collisions and the number of
across the North East region. TWFRS incidents it is clear that TWFRS are not called upon to
assist at all road traffic collisions. The following chart shows RTC
Reported RTCs by Road Class and attendance by our Service over the last five years.
Local Authority Area 2016
900
19
800 TWFRS Road Traffic Collisions Attended
37
2012/13 - 2016/17
700
450
261 14 387
600 78 400
41 358
332 331 342
2 350
500 29
243 224 300
6
400 189 37 250
34
300 119 200
1
488 158
28 26 17 1 150
200 78 14
338 105 83 4
325 73 100
293 9
253 66
100 177 43
149 141 50
121 120
80 68
0 0
2012/13 2013/14 2014/15 2015/16 2016/17
Minor Principal Trunk Motorway
Community Risk Profile 2017 – 2020 Tyne and Wear Fire and Rescue Authority
Creating the Safest Community 42Environmental Risks
Environmental challenges will continue to influence our operational Along with partners in the Local Resilience Forum, the Service
response. Floods in particular are listed among the highest risk makes extensive use of risk data from the Environment Agency in
incidents in the Local Resilience Forum’s Community Risk developing plans and procedures. This data includes:
Registerxxxvii. TWFRS’s High Volume Pumping and Swift Water
Rescue assets are part of the regional mitigation for such incidents. Detailed river network
Flood alert areas
2012 being the wettest ever recorded in England, led to an increase Surface water flooding
of 75% in flood related incidents attended by TWFRS between April Surface water flooding from a 1 in 30 year event (similar to that
and September 2012 compared to the same period in 2011. experienced in 2012)
Surface water flooding from a 1 in 200 year event
The chart below shows the pattern of flood and other water related
incidents in recent years. Flood map (flooding from rivers and the sea)
Flood warning areas
TWFRS Flooding / Rescue from Water Incidents Groundwater vulnerability
2012/13 - 2016/17
Reservoir flooding
350 319
300
250 227
200 189
200
150 132
100
37 29
50 16 25 20
0
2012/13 2013/14 2014/15 2015/16 2016/17
Flooding Rescue or evacuation from water
Community Risk Profile 2017 – 2020 Tyne and Wear Fire and Rescue Authority
Creating the Safest Community 43The Environment Agencyxxxviii considers that there is no coastal The following maps show the surface water flooding scenarios
flood risk in Tyne and Wear and limited river flood risk is confined within our local authority areas.
to particular areas as shown in the map below.
Gateshead
Community Risk Profile 2017 – 2020 Tyne and Wear Fire and Rescue Authority
Creating the Safest Community 44Newcastle North Tyneside
Community Risk Profile 2017 – 2020 Tyne and Wear Fire and Rescue Authority
Creating the Safest Community 45South Tyneside Sunderland
Community Risk Profile 2017 – 2020 Tyne and Wear Fire and Rescue Authority
Creating the Safest Community 46UK climate projectionsxxxix estimate the impact of different carbon
emissions scenarios on temperature and precipitation over different
time periods. The levels of uncertainty in these projections are very
high however, it is estimated that for the North East in terms of
precipitation, the impact of a medium increase in carbon emissions
compared with the 1961-1990 baseline could be as shown in the
table below.
Winter mean Summer mean
Decade precipitation precipitation
(central estimate) (central estimate)
2020s +4% -6%
2050s +11% -15%
2080s +14% -18%
Community Risk Profile 2017 – 2020 Tyne and Wear Fire and Rescue Authority
Creating the Safest Community 47You can also read