Investor Information SUPPLEMENTAL - Published May 3, 2021 - Suncor

 
CONTINUE READING
Investor Information SUPPLEMENTAL - Published May 3, 2021 - Suncor
SUNCOR ENERGY

Investor
Information
SUPPLEMENTAL
Published May 3, 2021

 SUNCOR ENERGY
Investor Information SUPPLEMENTAL - Published May 3, 2021 - Suncor
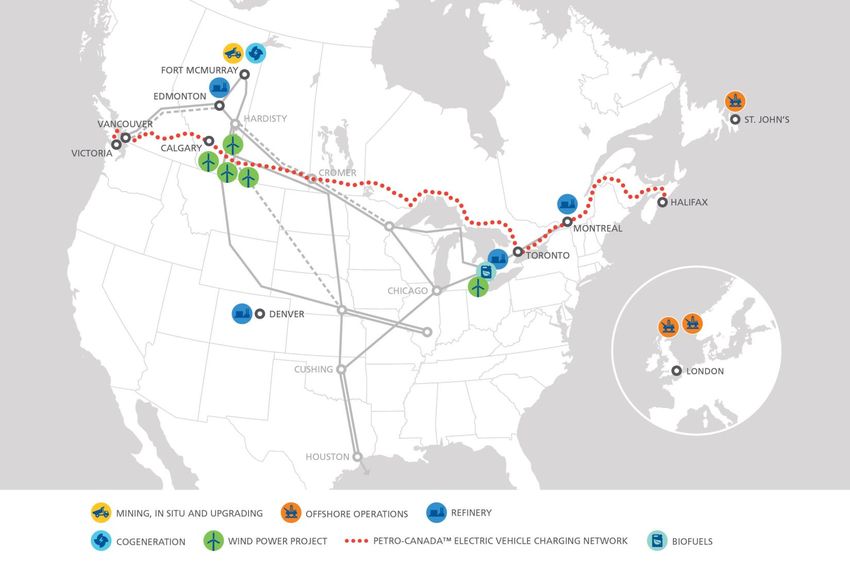
Table of Contents

1.   Energy Sources
2.   Processing, Infrastructure & Logistics
3.   Consumer Channels
4.   Sustainability
5.   Technology Development
6.   Integrated Model Calculation
7.   Glossary

SUNCOR ENERGY                                 2
Investor Information SUPPLEMENTAL - Published May 3, 2021 - Suncor
SUNCOR ENERGY

             Appendix
             Energy
             Sources

                             3
202003-038
Investor Information SUPPLEMENTAL - Published May 3, 2021 - Suncor
Oil Sands Energy Sources
 *All values net to Suncor

                             In Situ                                                 Mining
                                Firebag                                                 Base Plant
                                215,000 bpd capacity                                    350,000 bpd capacity
                                Suncor WI 100%                                          Suncor WI 100%
                                2,743 mmbbls 2P reserves1                               1,246 mmbbls 2P reserves1

                                                                                        Note: Millennium and North Steepank Mines
                                                                                        do not supply full 350,000 bpd of capacity
                                                                                        as significant in-situ volumes are sent
                                                                                        through Base Plant

                                MacKay River                                            Syncrude
                                38,000 bpd capacity                                     Syncrude operated
                                Suncor WI 100%                                          205,600 bpd net coking capacity
                                497 mmbbls 2P reserves1                                 Suncor WI 58.74%
                                                                                        1,160 mmbbls 2P reserves1

                                 Future opportunities                                   Fort Hills
                                 ES-SAGD Firebag Expansion                              Suncor operated
                                 Lewis (SU WI 100%)                                     105,000 bpd net capacity
                                 Meadow Creek (SU WI 75%)                               Suncor WI 54.11%
                                                                                        1,418 mmbbls 2P reserves1
                                                                                        First oil achieved in January 2018

SUNCOR ENERGY                                    1 See Slide Notes and Advisories.                                                   4
Investor Information SUPPLEMENTAL - Published May 3, 2021 - Suncor
Regional synergy opportunities1 for existing assets

Crude logistics
Upgrader feedstock optionality from multiple oil sands assets
Crude feedstock optionality for Edmonton refinery

Supply chain
Sparing, warehousing & supply chain management
Consolidation of regional contracts
(lodging, busing, flights, etc.)

Operational optimizations
Unplanned outage impact mitigations                                                 Situ
                                                                                 In Situ
Turnaround planning optimization
Process and technology sharing
                                                                                 100% WI
                                                                                 Joint ownership
                                                                                  Base mine upgrader and terminal
                                                                             U    Syncrude upgrader
Assets and resource developments                                             C    In situ central processing facility

Lease development and asset utilization optimization                         P    Fort Hills primary/secondary extraction
                                                                                  Pipelines

SUNCOR ENERGY                             1 See Slide Notes and Advisories                                              5
Investor Information SUPPLEMENTAL - Published May 3, 2021 - Suncor
Long life, low decline reserves base
                                                                  Typical attributes1 of North American oil plays
                                                            Initial         Decline       Sustaining            Operating       Reservoir   Recovery
    Illustrative annual   FFO2   profiles3                 capital           rate           costs                 cost            risk       factor

  Mining                                                    High           Very low              Low              Medium        Very low    Very high

~90% of Suncor’s 2021
 production guidance

  In Situ                                                 Medium              Low                Low                Low           Low         High

  Offshore
 ~10% of Suncor’s 2021                                      High           Medium           Medium               Very low       Medium      Medium
  production guidance

  Tight Oil                                                 Low            Very high             High             Medium          High        Low
                                             50 Years

                                                                   Beneficial attribute                 Challenging attribute

    SUNCOR ENERGY                                       1, 2, 3 See Slide Notes and Advisories                                                          6
Investor Information SUPPLEMENTAL - Published May 3, 2021 - Suncor
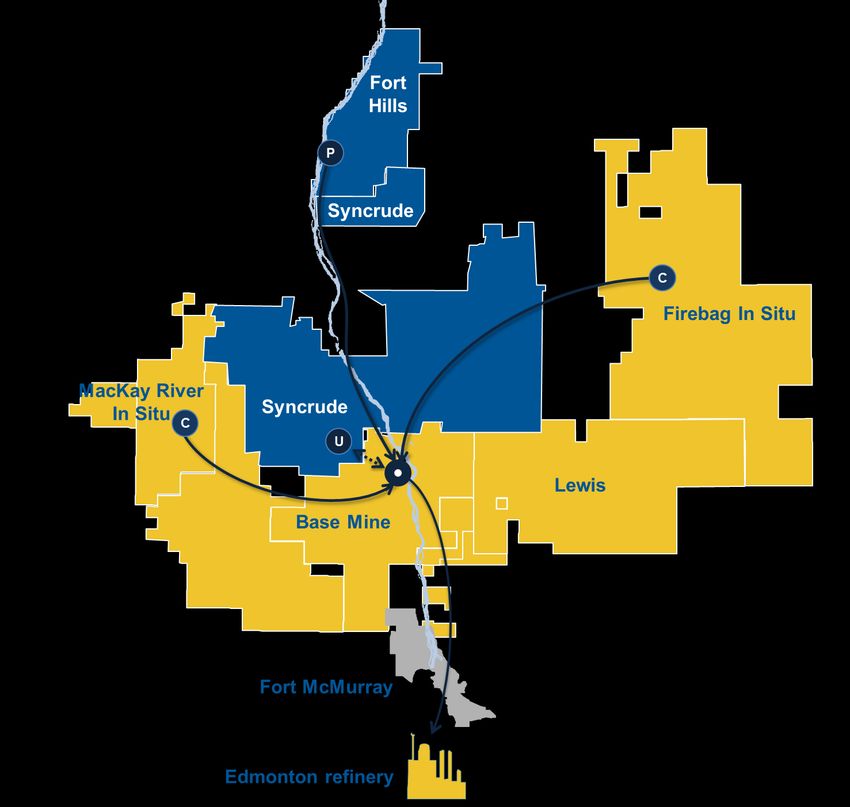
Offshore with ~300 million barrels of 2P reserves1
           East Coast Canada                                                       North Sea

                Hibernia
                ExxonMobil operated                                                 Buzzard (UK)
                Suncor working interest 20%                                         CNOOC Petroleum Europe Limited operated
                73 mmboe 2P   reserves1 (Suncor WI)                                 Suncor working interest 29.9%
                2020 avg net production: 23.2 mbbls/d                               60 mmboe 2P reserves1 (Suncor WI)
                                                                                    2020 avg net production: 25.9 mboe/d

                Hebron
                ExxonMobil operated
                Suncor working interest 21.0%                                       Golden Eagle (UK)
                113 mmboe 2P reserves1 (Suncor WI)
                                                                                    CNOOC Petroleum Europe Limited operated
                2020 avg net production: 29.7 mbbls/d
                                                                                    Suncor working interest 26.7%
                                                                                    12 mmboe 2P reserves1 (Suncor WI)
                                                                                    2020 avg net production: 7.8 mboe/d
                Terra Nova                                                          Divestiture announced - effective Jan 1, 2021
                Suncor Energy operated
                Suncor working interest 37.7%
                19 mmboe 2P reserves1 (Suncor WI)
                                                                                    Oda (Norway)
                2020 avg net production: 0 mbbls/d
                                                                                    Spirit Energy operated3
                                                                                    Suncor working interest 30%
                                                                                    3 mmboe 2P reserves1 (Suncor WI)
                White Rose                                                          First oil achieved March 2019
                Cenovus operated                                                    2020 avg net production: 7.5 mboe/d
                Suncor working interest 27.5%2
                4 mmboe 2P reserves1 (Suncor WI)
                2020 avg net production: 6.7 mbbls/d

SUNCOR ENERGY                             1, 2, 3 See Slide Notes and Advisories                                                    7
Investor Information SUPPLEMENTAL - Published May 3, 2021 - Suncor
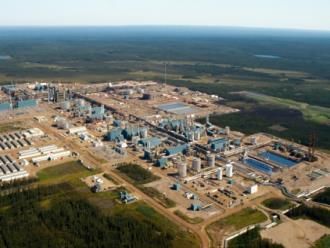
E&P – Investing in high value, low risk projects
                      Recent performance                                                                              Sanctioned projects1
mboe/d                                                                                                       Fenja (Norway)
 120                                                                                                         • 17.5% working interest
                                                                                        Oda                  • 6 mbbls/d anticipated net peak production
 100                                                                                     Hebron
                                                                                         White Rose
  80
                                                                                         Hibernia
                                                                                                             Buzzard Phase 2 (UK)
  60                                                                                     Terra Nova          • 29.9% working interest
                                                                                         Golden Eagle        • Production anticipated to offset natural declines
  40                                                                                     Buzzard

  20                                                                                                         West White Rose Project4 (ECC5)
                                                                                                             • ~26% working interest
    0
            2012    2013    2014   2015   2016    2017    2018       2019    2020
                                                                                                             • 20 mbbls/d anticipated net peak production

$billions                                                                                                    Terra Nova Asset Life Extension4 (ECC5)
  2.5         112     109
                              99                                                                             • 37.7% working interest
                                                                                                             • Extend asset life by approximately a decade
  2.0
                                                                                                             • Expect to produce additional 30 million barrels
                                                                       64                                      (Suncor WI)
  1.5                                                          71                       FFO2
                                                                                        Free funds flow3
                                                         54                             Capital spend
                                     52
  1.0                                        44                                 42 Brent ($US/bbl)                    Future opportunities
  0.5
                                                                                                                 • Rosebank – UK (40% Suncor WI)
                                                                                                                 • Near field developments including subsea
    -
                                                                                                                   tie-backs, field extensions and infill drilling
            2012    2013    2014   2015   2016     2017       2018    2019    2020

    SUNCOR ENERGY                                                    1, 2, 3, 4 See Slide Notes and Advisories                                                       8
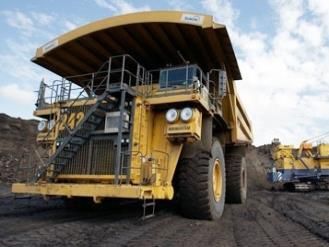
Investor Information SUPPLEMENTAL - Published May 3, 2021 - Suncor
Power Generation
Generating power for internal use & sale to the grid, including EV
applications; currently 5th largest power producer in Alberta.

                                                                                    2,400
                                                                                      MW
                      1,400
                         MW

                    CURRENT                        CURRENT + SANCTIONED PROJECTS1
              Cogen: 96%; Renewables: 4%                                       (online by YE 2025)
                                                                         Cogen: 89%; Renewables: 11%

MW Working interest nameplate capacity
   Net capacity for grid export
   Net internal consumption

SUNCOR ENERGY                              1 See Slide Notes and Advisories.                           9
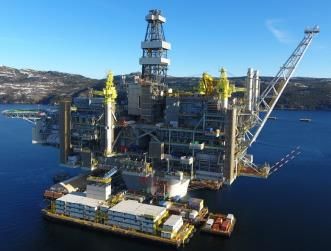
Investor Information SUPPLEMENTAL - Published May 3, 2021 - Suncor
SUNCOR ENERGY

             Appendix
             Processing,
             Infrastructure &
             Logistics

                                10
202003-038
Operations & Consumer Network
                    29 year
                   Oil Sands
                  Reserve Life
                    Index1
                                    ~25 mmbbl
                                     storage
                                     Western
                                     Canada
                                                    ~1,875
                                                 PetroCanada
                                                     sites2         ~15 mmbbl
                                                                     storage
                                                                     Eastern
                                                                     Canada

                         Only
                      refinery in
                      Colorado

                                                    ~10 mmbbl
                                                     storage
                                                   Central US &
                                                    Gulf Coast

                                                                               OIL & REFINED PRODUCT STORAGE (SUNCOR OPERATED)

                CURRENT PIPELINES     PROPOSED PIPELINES3

SUNCOR ENERGY                                1, 2, 3 See Slide Notes & Advisories                                                11
Upgrading
Upgrading processes heavy bitumen into a
lighter, higher value product with a density                   Upgrading Process
similar to that of WTI.
                                                                  LOW
Once upgraded, the product can flow on a                         VALUE
                                                                                 Mined & In-Situ Bitumen
                                                                 HEAVY
pipeline without the addition of diluent.                          OIL                  (10° API)
Total Suncor Net
Upgrading Capacity: ~555 kbpd1

                                                                                 Coking, hydroconversion,
• Base Plant                                                                      thermal cracking &/or
                                                                                                            ~15 – 20% yield loss
  – 2 Upgrading Units                                                                 hydrocracking
                                                                                                            through upgrading process
       •   U1: 110 kbpd
       •   U2: 240 kbpd
    – Produces sour & sweet SCO & diesel
                                                                  HIGH       Sour Synthetic Crude Oil         Optional: Hydrotreating
• Syncrude (Gross values below – Suncor WI 58.74%)               VALUE            (30 - 35° API)                  (remove sulfur)
                                                                 LIGHT
  – 3 Upgrading Units                                              OIL
       •   U1: 100 kbpd
       •   U2: 100 kbpd
       •   U3: 150 kbpd                                                                                      Sweet Synthetic Crude Oil
                                                                                        Refinery
    – Produces sweet SCO                                                                                          (30 - 35° API)

• Edmonton Refinery
  – 30 kbpd coking capacity

SUNCOR ENERGY                                   1 See Slide Notes & Advisories                                                          12
Suncor’s proven oil sands reliability journey
Suncor Base Plant upgrader reliability
Multi-year journey to reach >90% reliability
                                                                       91%               90%
                                                                                               1            91%              90%
                                                                                                                                   2
                                                                                                                                              90%
                                                                                                                                                                86%
                                                83%                   Firebag to
                           81%                                        Base Mine
      79%                                                            interconnect
                                                                     pipeline fully
                                                                      operational
 Suncor began focusing on upgrader reliability initiatives in 2011
 Culture – Operational excellence mindset
 Process – Integrated maintenance strategy/approach
 Infrastructure – Asset integration between Firebag and Base Plant

     2012                 2013                  2014                   2015              2016               2017             2018             2019              2020

Syncrude plant reliability                                                                           In 2019, Syncrude achieved 2nd best
                                                                                                     annual production in asset’s history
A similar multi year journey targeting >90% reliability 3
                                                                                                             with 85% utilization4
          2016/17                                             2018/19                                >2021 (Target >90% reliability)
 Collaboration                                     Culture                                         Infrastructure
 Suncor’s active involvement in                    31 technical/management                         Two bi-directional pipelines connecting Syncrude & Suncor’s Base Plant
 Syncrude’s reliability                            secondees from Suncor sharing
 improvement plan                                  operational discipline learnings                Better utilization of existing assets:
                                                                                                     • Normal operations - Transfer of sour synthetic and bitumen between assets
                                                                                                     • Planned and unplanned outages - Asset and production optimizations
 Sharing technical & reliability                   Process synergies
 best practices and support to                     Leveraging service & materials                  Construction completed and in-service in Q4 2020
 improve productivity, reliability                 economies of scale
 and reduce costs                                  Maintenance planning & execution
                                                   coordination
    SUNCOR ENERGY                                                         1, 2, 3, 4 See Slide Notes & Advisories                                                           13
Market Access
Suncor has made strategic investments in refineries and current/proposed
logistics infrastructure to mitigate Alberta egress limitations & market disconnects

                                     Fort McMurray    ~750            Alberta
                                                                egress bottleneck
                                                                 does not impact
                                                                the ability to move
                                                                  Suncor barrels1
                           146       Edmonton

                                                     Hardisty                               Enbridge Line 3
                                                                                           Potential Markets
                                                                 Regina                    Central & Eastern
               Vancouver                                                  Cromer          Canada, US Midwest
                                                                                             & Gulf Coast

                                                                                                                                   137
                                                                                                                                   Montreal
                       TMEP Potential                                               Superior
                         Markets
                        Asia & California                                                                        85

                                                                                                                 Sarnia
                                                                                    Steele City        Chicago
                                                      98
                                                     Commerce
                                                                                                    Patoka
                                                       City
                            San Francisco
                                                                          Cushing

                                      Los Angeles
                                                                                                                          Pipelines
                                                                                                                          (current and forecasted gross capacity2)
                                                                                                                                      Feeder lines
                                                                 Houston/Texas City                                                   Trans Mountain Pipeline, TMPL (300 mbpd)2
         Suncor refinery capacity
  mbpd                                                                                                                                Trans Mountain Expansion , TMEP – Proposed3 (+590 mbpd)2
         Industry approximate rail                                                                                                    Express, Platte and Rocky Mountain (280 mbpd)2
  mbpd   loading capacity in                                                                                                          TransCanada Keystone (590 mbpd)2
         AB/SK
                                                                                                                                     Enbridge Mainline (2,600 mbpd)2
                                                                                                                                     Enbridge Line 3 – Proposed3 (+370 mbpd) 2
                                                                                                                                     Enbridge Line 9 (300 mbpd)2
                                                                                                                                     Flanagan South Pipeline (585 mbpd)2
                                                                                                                                     Marine opportunities
  SUNCOR ENERGY                                                     1, 2, 3 See Slide Notes & Advisories                                                                                   14
SUNCOR ENERGY

             Appendix
             Consumer
             Channels

                             15
202003-038
Refined Product Markets

  ~500 mbpd
 Product sales in
     20201                                           Edmonton
                                                 refinery services
                                                  region from BC
                                                     to Ontario
     20%                                                                             Montreal and
                                                                                     Sarnia have a
                                                                                      local market
    Canadian                                                                       reach over 22mm
                        Export
  consumer fuel       capability
                                                                                        people5
     market2            to US
                      Pacific NW

     ~315
Wholesale Cardlock
   Locations3               Commerce
                          City’s asphalt                 Commerce City is
                              market                      only refinery in
                          stretches into                 Colorado & largest
                          Utah & Nevada     44 owned
                                                         refinery in the US
   ~1,560                                     retail
                                           stations in        Rockies
   PetroCanada                                 CO

    retail sites4

    ~50%
 North American
retail sites Suncor
       owned

SUNCOR ENERGY                         1, 2, 3, 4, 5 See Slide Notes & Advisories                     16
Refinery Feedstock & Products1

           2020 refinery feedstock                                                            2020 refined products
        (~40% equity feedstock & ~100% inland crude)

                                             1%
  4%                                                        6%
                   8%            10%                                                                 5%            5%                     6%
                                                                                      8%
                                                                                                                                 14%
                                                                                                    10%                                  10%
                                                                                     20%                                         6%
               37%               30%
                                             59%            50%
                                                                                                                   52%
                                                                                                    37%
                                                                                                                                 34%     42%
  76%
                                                                                     37%
               21%
                                 36%

                                                            22%
                                             28%
                                                                                                    48%                          46%
                                                                                                                   42%                   42%
  4%           34%                                                                   35%
                                 24%                        22%
  16%
                                             12%

Montreal      Sarnia           Edmonton     Denver          Total                  Montreal        Sarnia      Edmonton         Denver   Total

           Heavy        Sour     Sweet    Other Feedstock                                     Asphalt
                                                                                              Other (Bunker, Chemicals, LPGs, etc.)
                                                                                              Distillates (Diesel & Jet Fuel)
                                                                                              Gasoline

 SUNCOR ENERGY                                               1 See Slide Notes & Advisories                                                      17
Refinery Characteristics
             Throughput    Nelson      %OS Crude
  Refinery    Capacity   Complexity    Processing   Key Markets      Feedstock Advantages                                  Product Advantages
               (mbpd) 1 Index Rating     Ability

                                                    Western          Directly connected to oil sands production; ability   Large market reach with international export capability via
 Edmonton       146          9.8         100%
                                                    Canada           to process multiple crude types.                      tidewater; in-line product blending minimizes inventory.

                                                                                                                         Integrated with Montreal refinery to supply large local market
                                                                     Tied into western market for oil sands crude; crude
                                                    GTA &                                                                in the surrounding area; Sarnia refinery has a partial
   Sarnia        85          10.8         80%                        source flexibility between mid-west and oil sands
                                                    Midwest USA                                                          ownership in refined products pipeline to the Greater Toronto
                                                                     crude.
                                                                                                                         Area; direct access to international waters.

                                                                                                                           Large tanks storage capacities for crude and finished products;
                                                                                                                           access to large domestic markets through pipelines, rail and
                                                                     Strong feedstock optionality with access to Western
                                                    Montreal &                                                             trucking; ability to optimize feedstock to Montreal and Sarnia
  Montreal      137           9           30%                        Canadian, US, and tidewater crudes via pipeline, rail
                                                    GTA                                                                    refineries as well as products to Ontario and Quebec; synergy
                                                                     and marine.
                                                                                                                           with Parachem (chemicals market) and access to international
                                                                                                                           waters.

                                                                     Bulk of crude from Colorado and local basins
 Commerce                                                                                                                Supplies 1/3 of jet fuel used at Denver International Airport via
                                                                     resulting in transportation and pricing advantages;
    City         98           7           20%       Colorado                                                             direct pipeline; Colorado's largest producer & supplier of
                                                                     optionality for North Dakota, Wyoming, Montana &
  (Denver)                                                                                                               paving-grade asphalt.
                                                                     Western Canadian crude.

OS = Oil Sands
GTA = Greater Toronto Area

SUNCOR ENERGY                                                     1 See Slide Notes & Advisories                                                                                             18
Refining & Marketing
R&M funds from operations1                                                               Refinery utilization vs. US average
Capturing the value at all differentials                                                 Percent of refining capacity

         FFO1 ($C billions)                WTI – WCS ($US/bbl)                                     Suncor          US Average2

                                                                                                                                  Full turnaround at
$4                                                                         $28   100%                                              the Edmonton
                                                                                                                                  refinery Q2 2018

$3                                                                         $21

                                                                                  90%

$2                                                                         $14

                                                                                  80%

$1                                                                         $7

         US$/Cdn$
         FX > $0.90
        (2012 – 2014)

$0                                                                         $0     70%
      2012   2013       2014   2015    2016   2017   2018   2019   2020                   2012      2013    2014   2015   2016   2017   2018   2019    2020

     SUNCOR ENERGY                                             1, 2 See Slide Notes & Advisories                                                              19
Suncor 5-2-2-1 Index
 To help investors and analysts model Suncor’s Refining and Marketing (R&M) business, we have designed an indicative
 5-2-2-1 gross margin based on publicly available pricing data. This is a single value that incorporates refining, product
 supply and rack forward businesses, but excludes the impact of first-in, first-out (FIFO) accounting.

                                                                                    Q1 2019 Example
 Gross Margin                                                                        WTI + NYH 2-1-1                         73.15   40%    29.26
 = Product Value – Crude Value                                                       WTI + Chicago 2-1-1                     70.25   40%    28.10
                                                                                     WTI                                      54.9   20%    10.98
 Product Value                                                                       Seasonal Factor                                         6.50
                                                                                    Product Value ($US/bbl)                                 74.85
 = NYH 2-1-1 (40%) + Chicago 2-1-1 (40%) + WTI (20%) + Seasonal Factor
                                                                                     SYN                                     52.6    40%    21.04
                                                                                     WCS                                     42.5    40%    17.00
 Crude Value                                                                         WTI                                     54.9    20%    10.98
 = SYN (40%) + WCS (40%) + WTI (20%)                                                Crude Value ($US/bbl)                                   49.00
                                                                                    Gross Margin ($US/bbl)                                  25.85
                                                                                     FX ($US/$C)                                             0.75
New York Harbor (NYH) 2-1-1 & Chicago 2-1-1                                          Average Refinery Production (mbbls)                   44,000
                                                                                                                         1
These regional benchmark cracking margins are indicative of                         Gross Margin excl-FIFO ($C millions)                    1,515
Suncor’s western and eastern refining margins. Each 2-1-1 formula
represents the spread between 2 barrels of WTI crude oil and 1                 Edmonton
barrel each of gasoline and ULSD. WTI is added to cracking                     Turnaround
margins to represent full product value.

Seasonal Factor
An estimate of USD $6.50/bbl in Q1/Q4 and USD $5.00/bbl in
Q2/Q3 reflect the grade quality and location spreads for refined
products sold in the company’s core markets during the winter and
summer months, respectively.

WTI = West Texas Intermediate crude oil at Cushing
SYN = Sweet Synthetic crude at Edmonton
WCS = Western Canadian Select at Hardisty

                                                                                                        (CAD millions)

   SUNCOR ENERGY                                           1 See Slide Notes & Advisories                                                           20
R&M gross margin calculation example – Q1 2019
 FIFO1 impact calculation example – Q1 2019
                                     Q4 2018                                          Q1 2019
                    Dec-18   49.00   70% 34.30                  Dec-19        58.15   70% 40.71
    WTI ($US/bbl)                               60%       30.79                                 60% 34.32
                    Nov-18   56.70   30% 17.01                  Nov-19        55.00   30% 16.50
                    Dec-18    6.00   70%   4.20                 Dec-19        48.20   70% 33.74
   WCS ($US/bbl)                                20%        1.50                                 20% 9.47      Q1 2019 vs. Q4 2018
                    Nov-18   11.05   30%   3.32                 Nov-19        45.35   30% 13.61
    SYN ($US/bbl)
                    Dec-18   17.70   70% 12.39
                                                20%        4.52
                                                                Dec-19        58.30   70% 40.81
                                                                                                20% 11.45
                                                                                                                  FIFO gain of
                    Nov-18   34.10   30% 10.23                  Nov-19        54.80   30% 16.44                US$460M/C$615M
Average inventory cost/bbl                                36.81                                     55.24
Inventory barrels1(mmbbls)                                   25                                        25
Inventory Value ($US)                                       920                                     1,381

Realized GM/bbl vs. NYH 2-1-1 benchmark – Q1 2019                                                                      49.65
All Suncor refineries

                                                                                           35.25

                          25.39
     19.10
                         NYH
     NYH                 2-1-1
     2-1-1                C$
     US$
   Benchmark            Benchmark            Crude           Product mix, location         Realized   FIFO impact     Realized
     crack                crack           differential        differential & other        GM (LIFO)                  GM (FIFO)

  SUNCOR ENERGY                                          1 See Slide Notes & Advisories                                          21
First-in, first-out (FIFO) inventory gains and losses
  Crude & products inventory & timing
  The amount of time between purchase of feedstock to sale of refined product has direct correlation to FIFO impact

    Edmonton
    Commerce City
    Montreal / Sarnia
                                                                                                                                          45
    Average (~ 1.5 months)
                                                                                                                                Average number of days
   Crude logistics time1 – Time between purchase of feedstock to receipt at refinery gate                                         in inventory across
   Products storage time1 – Time between product processed and shipment beyond refinery            gate                                refineries1
   *Transit & storage time will vary depending on market & operating conditions

              Composition of average inventory barrel                                                                       FIFO impact
             Illustration of how to calculate prices used for FIFO impact                                                   Key rules of thumb

                             Commodity mix in inventory1                                                    The change in inventory value each quarter
                                                                                                            indicates the magnitude of the FIFO impact
 Prior reporting                                                            Current reporting
  quarter price                                                               quarter price
                                                                                                            A decrease in inventory value reflects a loss
                                     WTI (~60%)
70%                                                                                  70%                    Associated with a decreasing business environment
last month of the                                                         last month of the
quarter price                                                                  quarter price
                                                                                                            An increase in inventory value reflects a gain
                                     WCS (~20%)                                                             Associated with an increasing business environment
30%                                                                                 30%
Middle month of the                  SYN (~20%)                      Middle month of the
quarter price                                                               quarter price

     SUNCOR ENERGY                                                         1 See Slide Notes & Advisories                                                   22
SUNCOR ENERGY

             Appendix
             Sustainability

                              23
202003-038
Water Stewardship

                           Our water use is guided by three principles
                          Conserve        Reuse & recycle            Return clean water to watershed

                                                                    Corporate fresh water consumption intensity (m3/m3 production)2

                                                                                                                                                   0.90
                                                                                       0.82                                    0.86
                                      1                              0.74

                                                                                   Impact of 2016                                     Fort Hills
                                                                                      wildfires                                       ramp-up
                                                                                                          0.46
Oil Sands                                 MacKay
                      Firebag
Base Plant                                 River                                                Base Plant optimization
                                                                                              & sale of lubricants business
    92%                96%                100%
                                                                    2015               2016              2017                 2018                 2019

                                          Water technology highlights3
 Water Technology Development Centre              High Temperature Reverse Osmosis                           Non-aqueous extraction
$145M collaboration at Firebag to accelerate   Project to develop treatment membranes that           New solvent technologies in mining could
    wastewater treatment technologies.           could reduce the infrastructure & energy           reduce or eliminate the need for water and
      2019 JWN Energy Excellence                   required for SAGD4 water treatment                tailings ponds and reduce GHG intensity
             Awards winner.

SUNCOR ENERGY                                     1, 2, 3, 4 See Slide Notes & Advisories                                                                 24
Tailings Management                                                                                    Tailings Composition
 With the growth of Oil Sands Base operations, the volume of fluid
 tailings has increased over time                                                                                                   fines/clay 3%

 Previous fluid tailings treatment methods kept volumes stable &                                              water
 allowed us to reclaim a tailings pond & make another one trafficable                                         76%            sand
                                                                                                                             20%
 PASS1 is a step-change to treat all fluid tailings by 2043

              Base Plant Tailings Treatment Profile2                                                                            bitumen 50%2
                                                                                                            Oil sands reclaimed
 400
                                           Stability
                                     (treatment = production)                                       1st     tailings pond –
                                                                                                            Wapisiw Lookout (2010)
 200                                                                                                         2019 volume of tailings
                                                                                                   2.3x      treated vs. tailings
   0
                                                                                                             produced4

    Commercially implemented in 2018, PASS technology is expected to treat >50% of tailings volumes,
        fast-tracking reclamation, reducing our environmental footprint & lowering costs2

   SUNCOR ENERGY                                       1, 2, 3, 4 See Slide Notes and Advisories                                                    24
Personal & Process Safety
Positive trends in process safety, continued focus on personal safety
              Loss of Primary Containment (LOPC)                                                   Recordable Injury Frequency (RIF1)
                  Tier 1 and Tier 2 process safety events                                               Injuries per 200,000 hours worked

200                                                                             0.6

150
                                                                                0.4

100
                                                                                0.2
50

 0                                                                                0
          2015        2016           2017           2018    2019                         2015            2016           2017            2018           2019

                                                                                                Suncor and contractor RIF                      5-year trend
      LOPC 80% decline in process safety events over the last 5
      years (180 to 38)

                                                                                                    Lost Time Injury Frequency (LTIF2)
                                                                                                         Injuries per 200,000 hours worked
      RIF1, LTIF2 improving over time, but
                                                                               0.06
      2019 performance above trend
      RIF   performance decline led by hand injuries; mitigation               0.04
      measures focused on root causes, corrective/preventive
      action and communication of incident learnings
                                                                               0.02
      LTIF performance decline led by slips, trips and falls and
      line of fire incidents; mitigation measures focused on safety
      processes, PPE, mandatory traction aids, and hazard                         0
      assessment                                                                          2015           2016           2017            2018          2019

                                                                                                 Suncor and contractor LTIF                    5-year trend

SUNCOR ENERGY                                               1, 2 See Slide Notes & Advisories                                                                 26
Indigenous & Community Relationships
     We aim to increase Indigenous participation in energy development
           Partner with businesses               Improve workforce development               Partner with youth

                                                                                 Spent with indigenous
                                                               $3.4B             businesses since 2016            3.4
                                                                                 (cumulative spend)

 East Tank Farm Deal                                                                                     2.5

           Partnership                                                                            1.6
    $1B    Canada’s largest Indigenous energy partnership
                                                                                  0.9
           First Nations ownership
   49%     Fort McKay & Mikisew Cree First Nations
                                                                  0.4

25 year    Revenue stream
           Supports community investment                         2016           2017            2018    2019      2020

Suncor’s Adelaide Wind Farm                                     42
                                                                        Petro-Canada Retail Stations
25% interest by Aamjiwnaang First Nation                                owned or leased by First Nations
                                                                        (cumulative)
                                                                                                                  42
                                                                                                        38
PetroNor
                                                                                  26             27
Suncor has 41% interest in James Bay Cree company                 23

                                                               2001-2016        2017            2018    2019      2020
 SUNCOR ENERGY                                                                                                           27
SUNCOR ENERGY

             Appendix
             Technology
             Development

                             28
202003-038
New Technologies Realize Multiple Benefits1
    Examples of potential current technologies to meet multiple objectives
                            across our business

     Lower costs         Lower GHGs                              Reduce water, tailings & land footprint

                                         Next Generation SAGD2
                        Thermal solvent processes (Solvent Plus, EASE3/ESEIEH®4)
                                 Steam-solvent technologies (ES-SAGD5)
         IN SITU                     Steam & gas co-injection (NCG6)
                                         Wellbore enhancements
                                             Late Life SAGD2

                                    Waterless extraction processes (NAE7)
        MINING &                      Froth treatment technologies (PFT8)
       EXTRACTION       Tailings processes & wetland reclamation (PASS 9, DPL/EPL10)
                                      Autonomous haul systems (AHS11)

       REFINING &         Partial upgrading (PURE12) / Integrated Bitumen to Diesel
       UPGRADING                          Renewable fuels & diluent

       CORPORATE                        Data analytics/artificial intelligence

SUNCOR ENERGY            1, 2, 3, 4, 5, 6, 7, 8, 9, 10, 11, 12 See Slide Notes and Advisories              29
Leading Deployment of Mining Technologies
 Fort Hills - Higher quality, fungible product                                           Autonomous Haul Systems (AHS)
 Paraffinic Froth Treatment in secondary extraction                                    ✓ Greater reliability, efficiency & productivity
 Bitumen froth mixed with solvents to remove water and minerals                              Designed to run 24/7 with no ‘breaks’
                                                                                       ✓ Lower costs
                                                                                             ~$1/bbl opex savings1
                                                                                       ✓ Safer operations
                                                       Shipped
                                                                                             Minimizes human interface in the mine, obstacle detection
                       >75% bitumen                    directly to
                                                       market
                       ~10% asphaltenes
                       2% water & sediment
                                                       mine pit                        Fort Hills Mine
                                                                                       Status: deployed Q4 2020
                                                                                       Number of Trucks: ~50
✓ Partially upgraded
  Higher value due to reduced asphaltenes content                                      Millennium Mine
                                                                                       Status: deployment schedule ~2023 - 2025
✓ Lower GHG emissions                                                                  Number of Trucks: ~100
  In line with the average crude refined in the U.S.
✓ Less diluent required
  ~20% diluent mix vs. ~30% for in situ barrel transportation
✓ Fungible product
  Meets pipeline, refinery specifications, no further upgrading

SUNCOR ENERGY                                            1, 2 See Slide Notes & Advisories                                                               30
New Cogeneration Facility Sanctioning1
              Heat required for
              mining operations
                                                   Economically Robust
                                                      HIGH
                                                      %
                                                      TEEN
                                                                       IRR2 independent of oil price & pipeline egress

Natural gas
                   INPUTS
                                    Water
                                                  $1.4B                Capital investment over 4 years

                                                                       Increase revenue from power sales
                                                              0
                                                                       Lower sustaining capital by replacing aging asset

                                                   Sustainably Minded
                                                                            Annual emission reductions3
                                                    2.5MT                   ~25% progress toward GHG goal
Electricity                             Steam
                                                                            Vehicle emissions equivalent4
                 OUTPUTS
                                                     550K                   ~15% of Alberta’s vehicles5

       Low-carbon power sold to grid,
         displacing coal fired power               Technologically Progressive
                                     Power                                    Low-carbon power added to Alberta grid
                                  consumed
                                    by retail      800MW                      Displacing higher intensity coal power
                                  & wholesale
                                  customers

 SUNCOR ENERGY                                  1, 2, 3, 4, 5 See Slide Notes & Advisories                               31
SUNCOR ENERGY

             Appendix Model
             Integrated
             Calculation

                              32
202003-038
Integrated Model
  2019 / 2020 AVERAGES OF PRODUCTS SOLD TO MARKET

                                                                                                         REFINED PRODUCTS
                                                                                                                ~50% FFO1
                                                                                                                 456 kbpd2
                                                           SYNTHETIC CRUDE OIL
 OFFSHORE                                                            ~25% FFO1                               GASOLINE (45%)
  ~15%    FFO1
                        BITUMEN                                       315 kbpd2                             DISTILLATES (45%)
                        ~10%  FFO1                                                                       ASPHALT (5%) OTHER (5%)
   104 kbpd2
                         138 kbpd2

   HIGH
                        BASE                                  PROCESSING,
  VALUE
                       ENERGY                               INFRASTRUCTURE                                   CONSUMER
 ENERGY
                      SOURCES4                                & LOGISTICS5                                   CHANNELS6
SOURCES3
                           Sale of                                                                        Refining hydrocarbons into
     Sale of            unprocessed                         Processing & using extensive
                                                           infrastructure, logistics & trading          consumer products & marketing
  unprocessed         energy products,
                                                            to optimize product movement                to wholesale & retail consumers
energy products         majority at US
at Brent pricing to                                                across value chain
                         Gulf Coast
 global markets         heavy pricing

                                     P H Y S I C A L       I N T E G R A T I O N                 S T R A T E G Y

       Agile & informed model to capture margin by processing & moving energy across the value chain

  SUNCOR ENERGY                                 1, 2, 3, 4, 5, 6 See Slide Notes & Advisories                                             33
500
      Asset Value Maximization                                                                                                                             Converting
                                                                                                                                                        hydrocarbons into
                                                                                                                                                                                                  $150.00

      2019 / 2020 AVERAGES1 ($CAD)                                                                                                                     consumer products
      (Refer to pages 34 - 37 in Supplemental IR Deck for full reconciliation)

          Product Value               Transportation Cost                                                                                               456
          Product Margin              Processing Cost                                                                                                   kbpd2
400       Royalty Cost                                                                                                                                                                            $120.00
                                      Feedstock Cost

                                                                                                          Upgrading bitumen to                                          ~1/3 margin from
                                                                                                          higher value product                                        physical integration,
                                                                                                                                                                      marketing & logistics
300                                                                                                         315                                                                                   $90.00
                                                                                                            kbpd                                                   $89
            Globally priced                                                                                                                                       per bbl
                                                                                                                                                                               $36
         offshore production                                                                                                                                                  per bbl

200
                   $69         $53                                                                                                                                                                $60.00
                  per bbl per bbl                           Minimizing                                                 $62        $25
                                                          exposure to low                                            per bbl per bbl
                                                           value bitumen

                                                       138          $43          $18

                                                                                                                                                                                        $53/bbl
100                                                                per bbl per bbl                                                                                                                $30.00
                                                       kbpd
        104

                                                                                                                                         $37/bbl
        kbpd                                           Majority
                                                                                        $25/bbl

                                                        sold at
                                                       US Gulf
                                          $16/bbl

                                                       Coast at
                                                        global
                                                        heavy
                                                        pricing
  0                                                                                                                                                                                               $-
      OFFSHORE SALES                                 BITUMEN SALES                                  SYNTHETIC CRUDE OIL                              REFINED PRODUCT
                to market                                         to market                               SALES                                           SALES
                                                                                                                    to market                                     to market

                                                                         MA J O R IT Y            O F   P H Y S IC A L L Y   IN T E G R A T E D    V O L U ME S

      SUNCOR ENERGY                                                           1, 2 See Slide Notes & Advisories                                                                                        34
Corporate Summary Calculation1
2019 / 2020 Average Funds from Operations (FFO)2 Breakdown ($CAD)

                                           Volume            Margin         FFO
                                            (kbpd)           ($/bbl)        ($M)
                          Offshore E&P           104.3            52.61        1,998
                                Bitumen          137.7            17.61          857
                                    SCO          315.4            24.86        2,867
                      Refined products           455.7            35.95        6,034
                                          Total operating gross margin        11,770
                                                         Income Taxes           (447)
                                            Corporate adjusted items:
                                                   FIFO gain (loss)               52
                           Intersegment profit (eliminated) realized             (75)
                          Corp segment FFO (adjusted to pre-tax)              (1,343)
                                        Other revenue (costs) - net           (2,096)
                         Exploration, reclamation & financing expense           (655)
                                           Other (non-cash addbacks)             154
                Consolidated Suncor Funds Flow from Operations                 7,347
                Reported Funds Flow from Operations (avg of 2019-20)           7,347

SUNCOR ENERGY                           1, 2 See Slide Notes & Advisories               35
Integrated Model – Volumes Calculation1

                                  FY2020    FY2019    20/19 AVG SOURCE
VOLUMES (Sales) (mbbls/d)
 a E&P                              102.6     106.0       104.3 Q4 2020 Report P65
Bitumen
 b OSO                               67.5     102.2        84.9 Q4 2020 Report P63
 c FH                                58.1      85.3        71.7 Q4 2020 Report P63
SCO
 d OSO                              304.8     311.3       308.1 Q4 2020 Report P63
 e Syncrude                         163.1     172.3       167.7 Q4 2020 Report P63
Equity Volumes Sent to Refiners
  f Equity crude                    168.4     190.0       179.2 2019 AIF P21; 2020 Actuals.
 g Bitumen %                           5%       15%         10%
 h SCO                              159.2     161.5       160.4
  i Bitumen                           9.2      28.5        18.9

VOLUMES (Sales to Market - excluding internal transfers)
 j   E&P                            102.6     106.0       104.3
 k   Bitumen                        116.4     159.0       137.7
 l   SCO                            308.7     322.1       315.4
 m   Refining                       435.6     475.9       455.7 Q4 2020 Report P72

SUNCOR ENERGY                                    1 See Slide Notes & Advisories               36
Integrated Model – Margin Calculation1

MARGIN / BBL ($CAD)                                                      FY2020      FY2019      20/19 AVG SOURCE
E&P (Brent pricing)
 n     Average price realized                                              52.57        85.54       69.46
 o     Royalties                                                           (2.52)       (7.64)      (5.14)
                                                                                                           Q4 2020 Report P65
 p     Transportation costs                                                (2.64)       (1.94)      (2.28)
 q     Operating costs                                                     (8.45)      (10.37)      (9.43)
  r    Margin                                                              38.96        65.60       52.61 = Average price realized + royalties + transportation + operating costs (n + o + p + q)
Bitumen (majority Maya pricing)
  s    Average price realized                                               28.44       52.05        42.58
  t    Royalties                                                            (0.32)      (1.70)       (1.15)
                                                                                                            Q4 2020 Report P64
 u     Transportation costs                                                 (6.07)      (6.34)       (6.23)
  v    Operating costs                                                     (20.14)     (15.88)      (17.59)
 w     Margin                                                                1.91       28.13        17.61 = Average price realized + royalties + transportation + operating costs (s + t + u + v)
SCO
  x    Average price realized                                               48.19       75.43        62.03
  y    Royalties                                                            (0.45)      (4.49)       (2.50)
                                                                                                            Q4 2020 Report P64
  z    Transportation costs                                                 (4.36)      (4.75)       (4.56)
 aa    Operating costs                                                     (29.45)     (30.76)      (30.12)
 ab    Margin                                                               13.93       35.43        24.86 = Average price realized + royalties + transportation + operating costs (x + y + z + aa)
Refined Product Sales
 ac    Average price realized                                               72.76      105.68        89.22
 ad    Feedstock cost (net of FIFO)                                        (44.16)     (68.92)      (56.54)   5-2-2-1 Calculation
 ae                                                    FX (US:CAD)           0.75        0.75         0.75
 af                                                   WTI (US$/bbl)         39.40       57.05        48.23
                                                                                                              Q4 2020 Report P15
 ag                                                  WCS (US$/bbl)          26.85       44.25        35.55
 ah                                                  SYN (US$/bbl)          36.25       56.45        46.35
 ai   R&M gross margin (inclusive of marketing & logistics activities)      4,029       7,008        5,519    Q4 2020 Report P72
 aj                                           Adj - FIFO gain (loss)         (519)        623           52    2019 Annual Report P41; 2020 cumulative per quarterly report
 ak   R&M gross margin (LIFO)                                               4,548       6,385        5,466
 al   R&M gross margin/bbl (LIFO)                                           28.60       36.76        32.68
am    Transportation costs                                                  (0.87)      (0.69)       (0.78)
 an   Operating costs                                                       (5.50)      (5.35)       (5.43)   Q4 2020 Report P72
 ao   Value chain margin/bbl                                                 5.13       13.71         9.47
 ap R&M margin/bbl (incl. value chain margin)                               27.37       44.42        35.95

   SUNCOR ENERGY                                                               1 See Slide Notes & Advisories                                                                                         37
Integrated Model – Funds from Operations Calculation1,2

Funds flow from operations model                              FY2020        FY2019      20/19 AVG SOURCE
 aq    Brent sales                                                1,459        2,538        1,998
 ar    Bitumen (majority Maya) sales                                 81        1,633          857
 as    SCO sales                                                  1,570        4,165        2,867
 at    Refined product sales                                      4,351        7,717        6,034
 au Total operating gross margin                                  7,487       16,053       11,770
 av Current income taxes                                            659       (1,552)        (447) Q4 2020 Report P47
 aw Add: Corporate adjusted items
 ax    FIFO gain (loss)                                             (519)        623           52
 ay    Intersegment profit (eliminated) realized                     126        (276)         (75)   Q4 2020 Report P28
 az    Corp segment FFO (adjusted to pre-tax)                     (1 402)     (1 285)      (1,343)   Q4 2020 Report P54 (FS) & P41 (FFO)
 ba    Other revenue (costs) - net                                (2,077)     (2,116)      (2,096)
 bb Exploration, reclamation & financing expense                   ( 479)      ( 830)        (655)   Q4 2020 Report P54 (FS) & P41 (FFO)
 bc Other (non-cash addbacks)                                        106         201          154    Q4 2020 Report P41
 bd Consolidated Suncor funds from operations                      3,875      10,818        7,347
 be Reported funds from operations                                 3,875      10,818        7,347
-2.3
Other revenues and costs
 bh Reported OS + EP + RM segment revenues                       12,072       21,292       12,072 Q4 2020 Report P54
 bi    Calculated revenues                                       11,503       20,186       15,845
 bj Total Other revenues                                            569        1,106          837

bk Reported OS + EP + RM segment costs                            11236        13740       13,740 Q4 2020 Report P54
 bl Calculated costs                                              8,590       10,519        9,554
bm Total Other costs                                              2,646        3,221        2,934

Acronyms
FS          Financial Statements
FFO         Funds from (used in) Operations
OS          Oil Sands
EP          Exploration & Production
RM          Refining & Marketing
Corporate   Corporate & Eliminations

SUNCOR ENERGY                                      1, 2 See Slide Notes & Advisories                                                       38
SUNCOR ENERGY

             Appendix
             Glossary

                             39
202003-038
Glossary1
Alkylate (Alkylation): A refining operation that takes low value derivatives from the catalytic cracking and other processes and unites them in the
presence of an acid catalyst to produce a very high octane, low vapor pressure gasoline blending component.

Aromatics: Hydrocarbons characterized by their uniform carbon ring structure and their often pleasant aroma. Commercial petroleum aromatics
are benzene, toluene, and xylene. These three are often referred to by the acronym BTX. These chemicals are used as high octane components in
gasoline. Aromatics have been judged to be undesirable in some finished motor fuels with various state and federal regulations geared toward
reducing their levels. CARB diesel fuel in the state of California mandates a low aromatics composition.

Asphalt: A dark-brown-to-black cement-like material containing bitumen as the predominant constituent obtained by petroleum processing, used
primarily for road construction. It includes crude asphalt as well as the following finished products:
cements, fluxes, the asphalt content of emulsions (exclusive of water), and petroleum distillates blended with asphalt to make cutback asphalts.
Note: The conversion factor for asphalt is 5.5 barrels per short ton.

Barrel: Term used as the standard measurement of volume for crude oil and large quantities of refined products in the petroleum industry. A unit
of volume equal to 42 U.S. gallons – often abbreviated as bbl.

Benchmark Crude: A widely accepted grade of crude oil used as a standard in trading. Other grades would be traded at a price differential
according to the quality differences. Examples would be WTI, Brent, Dubai and Arab Light.

Brent: Blend of crude oil from a critical group of North Sea fields, Brent is the standard contract for ICE crude oil futures trading, and the most
commonly referenced crude in Europe. It’s described as the European counterpart of WTI, and its morning performance is often a harbinger for the
NYMEX opening. London’s ICE Brent contract is the benchmark crude for international oil physical and futures trading.

Catalytic Cracking: The refining process of breaking down, via heat and pressure, the larger, heavier, and more complex hydrocarbon molecules
into simpler and lighter molecules, primarily gasoline. Catalytic cracking is accomplished by the use of a catalytic agent and is an effective process
for increasing the yield of gasoline from crude oil.

Coker: An oil refining unit in which heavy feed such as flasher bottoms, cycle oil from a fluid catalytic cracker, or thermal cracked gas oil is
subjected to high temperatures. This causes the feed to crack, creating lights oils. Coke – solid, densely packed carbons – builds up in the
reactors of the unit and periodically needs to be removed.

Crack Spread: Term applied to the differential between what a typical refined products mix would yield, and the value of crude. The common
crack spread features a per bbl reference derived of 66.6% unleaded gasoline and 33.4% No. 2 oil. The resulting average is compared to the WTI
number for the resulting “crack spread.” Crack spreads of 3:2:1 use three parts gasoline, two parts of distillate to one part of crude.

SUNCOR ENERGY                                                  1 See Slide Notes.                                                                   40
Glossary1 (continued)
Crude Distillation: An oil refinery unit that separates crude oil into different products according to their individual boiling point ranges.
Distillation allows for the materials to be separated without being subjected to conditions that would cause cracking or decomposition.

Delayed Coking: A process by which heavier crude oil fractions can be thermally decomposed under conditions of elevated temperatures
and pressure to produce a mixture of lighter oils and petroleum coke. The light oils can be processed further in other refinery units to meet
product specifications. The coke can be used either as a fuel or in other applications such as the manufacturing of steel or aluminum.

Distillation: The most basic refining operation that heats the crude oil and condenses the cuts in a fractionating column in order to
separate the various petroleum products for further processing.

Feedstock: Any of the raw or semi-finished materials which move to the various units of a refinery or petrochemical plant. Crude is a
feedstock, but the term is mainly used to describe raw materials after the distillation process which in turn go on to more sophisticated
units at the refinery. VGO, naphtha, condensate and straight run residual fuel are commonly referred to as feedstocks.

Gasoil (VGO): Commonly, the European term used for diesel fuel and heating oil.

Hydrotreating: A refining unit whereby processed material from the crude units are treated in the presence of catalysts and hydrogen,
often to remove sulfur and other unwanted substances. The hydrotreater is often the critical unit for producing jet fuel and low-sulfur diesel.

Liquefied Petroleum Gases (LPG): A group of hydrocarbon-based gases derived from crude oil refining or natural gas stream
fractionation that are often liquefied, through pressurization, for ease of transport. They include: ethane, propane, normal butane, and
isobutane. Uses of these fuels include: home heating, industrial, automotive fuel, petrochemical feedstocks and for drying purposes in
farming.

Natural Gas (NG): A naturally-occurring raw material often produced in conjunction with crude oil that is processed through a variety of
facilities to yield natural gas liquids. It is a commercially acceptable product for industrial and residential consumption and is shipped via
pipeline.

Petrochemical: An intermediate product derived from crude and natural gas processing that is used in production of a wide range of
products, including plastics. Also the facility that processes these intermediate products. Petrochemical plants are often integrated with
major refineries.

Rack Market: Petroleum products sold at the wholesale level from primary storage. Refers to loading racks where tanker trucks fill up.

SUNCOR ENERGY                                               1 See Slide Notes.                                                                   41
Glossary1 (continued)
Reforming: An oil refining unit in which naphthas are changed chemically to increase their octane level. Paraffins convert to iso-paraffins
and naphthenes, and naphthenes change to aromatics. The catalyst used is usually platinum, though sometimes palladium.

Sour Crude Oil: Crude oil is considered ‘sour’ if it contains ≥ 0.5% sulfur.

Spot Price: The current value of any product on a volume basis.

Sulfur: A yellowish nonmetallic element, sometimes known as “brimstone.” It is naturally occurring at various levels of concentration in
many fossil fuels whose combustion releases sulfur compounds that are considered harmful to the environment. Some of the most
commonly used fossil fuels are categorized according to their sulfur content, with lower sulfur fuels usually selling at a higher price. Note:
No. 2 Distillate fuel is currently reported as having either a 0.05% or lower sulfur level for on-highway vehicle use or a greater than 0.05%
sulfur level for off-highway use, home heating oil, and commercial and industrial uses. This also includes Ultra Low Sulfur Diesel (
Advisories
Forward-Looking Statements – This presentation contains certain            expected synergies and the ability to sustain reductions in costs; the        measures are included because management uses the information to
“forward-looking statements” within the meaning of the United States       ability to access external sources of debt and equity capital; the timing     analyze business performance, leverage and liquidity and therefore
Private Securities Litigation Reform Act of 1995 and “forward-looking      and the costs of well and pipeline construction; Suncor’s dependence          may be considered useful information by investors. See the “Non-
information” within the meaning of applicable Canadian securities          on pipeline capacity and other logistical constraints, which may affect       GAAP Financial Measures Advisory” section of the Q1 MD&A.
legislation (collectively, “forward-looking statements”), including        the company’s ability to distribute products to market; mandatory
statements about: Suncor’s strategy and business plans; expected           production curtailments being greater or imposed for longer than              Funds from operations (previously referred to as cash flow from
operating and financial results; reserves estimates and reserve life       anticipated; the timely receipt of regulatory and other approvals; the        operations) is defined in the Q1 MD&A, for the three months ended
indices; future opportunities in Oil Sands and regional synergy            timing of sanction decisions and Board of Directors’ approval; the            March 31, 2021 is reconciled to the GAAP measure in the Q1 MD&A,
opportunities for existing assets; expectations for sanctioned E&P         availability and cost of labour, services, and infrastructure; the            for 2012 to 2020 is reconciled to GAAP measures in Suncor’s annual
projects, including anticipated peak production; expected benefits         satisfaction by third parties of their obligations to Suncor; the impact of   management’s discussion and analysis (MD&A) for the respective
from sanctioned and identified power generation projects; nameplate        royalty, tax, environmental and other laws or regulations or the              year. Free funds flow (previously referred to as free cash flow) is
capacities; expected utilization of assets; expectations on refinery       interpretations of such laws or regulations; applicable political and         defined in the Q1 MD&A, and is reconciled, as applicable for 2019 to
feedstocks and refined products; potential future pipelines and market     economic conditions; risks associated with existing and potential             2020 in the 2020 MD&A, for 2015 to 2018 to the GAAP measure in
access expectations; the assumption that Suncor's 5-2-2-1 index will       future lawsuits and regulatory actions; improvements in performance           Suncor’s 2018 annual MD&A, and for 2014 to the GAAP measure in
continue to be an appropriate measure against Suncor's actual              of assets; and the timing and impact of technology development.               Suncor’s 2016 annual MD&A; and the estimated impact of the LIFO
results; expectations for and potential benefits of the cogeneration                                                                                     method for the three months ended March 31, 2021 is defined and
facility, Suncor/Syncrude interconnecting pipelines, autonomous haul       Although Suncor believes that the expectations represented by such            reconciled in the Q1 MD&A.
trucks, PASS, paraffinic froth treatment, high temperature reverse         forward-looking statements are reasonable, there can be no
osmosis and non-aqueous extractions; tailings treatment capacity;          assurance that such expectations will prove to be correct. Suncor’s           Reserves– Unless noted otherwise, reserves information presented
that the East Tank Farm deal will provide a twenty five year revenue       Management’s Discussion & Analysis (MD&A) ended March 31, 2021                herein for Suncor is presented as Suncor’s working interest (operating
stream to the two Alberta First Nations; statements about Suncor’s         and dated May 3, 2021 (the Q1 MD&A), Annual Report for the year               and non-operating) before deduction of royalties, and without
investments in its lower-carbon technology portfolio and in                ended December 31, 2020 (the 2020 Annual Report) and its most                 including any royalty interests of Suncor, and is at December 31,
technologies, including the expected benefits therefrom; potential         recently filed Annual Information Form/Form 40-F and other                    2020. For more information on Suncor’s reserves, including definitions
future free funds flow growth projects, including the timing and impact    documents it files from time to time with securities regulatory               of proved and probable reserves, Suncor’s interest, location of the
thereof, and free funds flow improvement and cash flow upside              authorities describe the risks, uncertainties, material assumptions and       reserves and the product types reasonably expected please see
potential; statements about Suncor’s GHG intensity reduction goal          other factors that could influence actual results and such factors are        Suncor’s most recent Annual Information Form dated February 24,
including the expected impact of sanctioned projects; expectations,        incorporated herein by reference. Copies of these documents are               2021 available at www.sedar.com and Form 40-F dated February 25,
targets and potential opportunities with respect to Syncrude; capital      available without charge from Suncor at 150 6th Avenue S.W.,                  2021 available at www.sec.gov. Reserves data is based upon
and production guidance; planned maintenance and the timing                Calgary, Alberta T2P 3E3, by calling 1-800-558-9071, or by email              evaluations conducted by independent qualified reserves evaluators
thereof; and goals with respect to reliability, safety, cost management    request to invest@suncor.com or by referring to the company’s profile         as defined in NI 51-101.
and sustainability, that are based on Suncor’s current expectations,       on SEDAR at www.sedar.com or EDGAR at www.sec.gov. Except as
estimates, projections and assumptions that were made by Suncor in         required by applicable securities laws, Suncor disclaims any intention        BOE (Barrels of oil equivalent) – Certain natural gas volumes have
light of its experience and its perception of historical trends. Some of   or obligation to publicly update or revise any forward-looking                been converted to barrels of oil on the basis of six thousand cubic feet
the forward-looking statements may be identified by words such as          statements, whether as a result of new information, future events or          to one boe. This industry convention is not indicative of relative market
“planned”, “estimated”, “target”, “goal”, “illustrative”, “strategy”,      otherwise. Suncor’s actual results may differ materially from those           values, and thus may be misleading.
“expected”, “focused”, “opportunities”, “may”, “will”, “outlook”,          expressed or implied by its forward-looking statements, so readers are
“anticipated”, “potential”, “guidance”, “predicts”, “aims”, “proposed”,    cautioned not to place undue reliance on them.                                Impact of the COVID-19 Pandemic: The COVID-19 pandemic is an
“seeking” and similar expressions. Forward-looking statements are not                                                                                    evolving situation that will continue to have widespread implications
guarantees of future performance and involve a number of risks and         Suncor’s corporate guidance includes a planned production range,              for our business environment, operations and financial condition.
uncertainties, some that are similar to other oil and gas companies        planned maintenance, capital expenditures and other information,              Actions taken around the world to help mitigate the spread of COVID-
and some that are unique to Suncor. Users of this information are          based on our current expectations, estimates, projections and                 19 have and will continue to have significant disruption to business
cautioned that actual results may differ materially as a result of,        assumptions (collectively, the Factors), including those outlined in our      operations and a significant increase in economic uncertainty. Our
among other things, assumptions regarding: the current and potential       2021 Corporate Guidance available on www.suncor.com/guidance,                 operations and business are particularly sensitive to a reduction in the
adverse impacts of the COVID-19 pandemic; commodity prices and             which Factors are incorporated herein by reference. Suncor includes           demand for, and prices of, commodities that are closely linked to
interest and foreign exchange rates; the performance of assets and         forward-looking statements to assist readers in understanding the             Suncor’s financial performance, including crude oil, refined petroleum
equipment; capital efficiencies and cost savings; applicable las and       company’s future plans and expectations and the use of such                   products (such as jet fuel and gasoline), natural gas and electricity.
government policies; future production rates; the development and          information for other purposes may not be appropriate.                        The timing of an economic recovery is currently uncertain. This could
execution of projects; assumptions contained in or relevant to                                                                                           result in reduced utilization and/or the suspension of operations at
Suncor’s 2021 Corporate Guidance; product supply and demand;                                                                                             certain of our facilities, buyers of our products declaring force majeure
market competition; future production rates; assets and facilities not     Non-GAAP Measures – Certain financial measures in this                        or bankruptcy, the unavailability of storage, and disruptions of pipeline
performing as anticipated; expected debottlenecks, cost reductions         presentation – namely funds from operations, free funds flow, and last        and other transportation systems for our products, which would further
and margin improvements not being achieved to the extent                   in, first out (LIFO) – are not prescribed by GAAP. All non-GAAP               negatively impact Suncor’s production or refined product volumes,
anticipated; dividends declared and share repurchases; the sufficiency     measures presented herein do not have any standardized meaning                and could adversely impact our business, financial condition and
of budgeted capital expenditures in carrying out planned activities;       and therefore are unlikely to be comparable to similar measures               results of operations.
risks inherent in marketing operations (including credit risks);           presented by other companies. Therefore, these non-GAAP measures
imprecision of reserves estimates and estimates of recoverable             should not be considered in isolation or as a substitute for measures
quantities of oil, natural gas and liquids from Suncor’s properties;       of performance prepared in accordance with GAAP. All non-GAAP

    SUNCOR ENERGY                                                                                                                                                                                                               43
Slide Notes
Slide 4-------------------------------------------------------------                determined. The ALE project is currently being evaluated with all                  may not be reflective of actual utilization rates. See Forward-
(1)   Reserves are working interest before royalties. See Reserves in the           stakeholders to determine the best option to integrate and optimize                Looking Statements and Impact of the COVID-19 Pandemic in the
      Advisories. The estimates of reserves for individual properties               potential funding to recover the remaining resources from the Terra                Advisories.
      provided herein may not reflect the same confidence level as                  Nova project.                                                               Slide 19-------------------------------------------------------------
      estimates of reserves for all properties due to the effects of          (5)   Refers to East Coast Canada (ECC).                                          (1)    Funds from operations (FFO) is a non-GAAP financial measure and
      aggregation. Suncor’s total 2P Reserves (gross) for Canada are                                                                                                   is calculated as cash flow provided by operating activities excluding
      7,064 mmboes at December 31, 2020.                                      Slide 9-------------------------------------------------------------                     changes in non-cash working capital. See Non-GAAP Measures in
Slide 5-------------------------------------------------------------          (1)   Represents possible future opportunities currently being evaluated.                the Advisories.
(1)    Represents possible future opportunities currently being evaluated.          There can be no assurance these opportunities will be pursued. See          (2)    Source: US Energy Information Administration
       There can be no assurance these opportunities will be pursued. See           Forward-Looking Statements in the Advisories.                               Slide 20------------------------------------------------------------
       Forward-Looking Statements in the Advisories.                          Slide 11 --------------------------------------------------------------           (1)    Average refinery production is based on the twelve months ended
Slide 6-------------------------------------------------------------          (1)    As at December 31, 2020 and assumes that approximately 7.04 billion               March 31, 2019.
(1)   Attributes are generalizations based on Suncor’s analysis of its own           barrels of oil equivalent (boe) of proved and probable reserves (2P) are   Slide 21-------------------------------------------------------------
      projects and industry data.                                                    produced at a rate of 593.4 mboe/d, Suncor’s average daily production      (1)    Inventory barrels are an illustrative approximation and actual results
(2)   Funds from operations (FFO) is a non-GAAP financial measure. See               rate in 2020. Reserves are working interest before royalties. See                 will vary depending on market and operating conditions. See
      Non-GAAP Measures in the Advisories. FFO is calculated as cash                 Reserves in the Advisories.                                                       Forward-Looking Statements in the Advisories.
      flow provided by operating activities excluding changes in non-cash     (2)    1,877 retail and wholesale sites are operated under the Petro-Canada       Slide 22-------------------------------------------------------------
      working capital.                                                               brand as of December 31, 2020.                                             (1)    Crude logistics time, products storage time, commodity mix in
(3)   Annual FFO profiles are based on representative project economics       (3)    Proposed future pipelines. There can be no assurance this pipeline will           inventory and average number of days in inventory are an illustrative
                                                                                     be built with the capacity indicated or at all. See Forward-looking
      (development capital, operating and sustaining costs) using                                                                                                      approximation and actual results will vary depending on market and
                                                                                     Statements in the Advisories.
      consistent assumptions for future oil prices (including adjustments                                                                                              operating conditions. See Forward-Looking Statements and Impact
                                                                              Slide 12-------------------------------------------------------------
      for quality, transportation and marketing costs), tax and royalty                                                                                                of the COVID-19 Pandemic in the Advisories.
                                                                              (1)   Nameplate capacities as at December 31, 2020. Nameplate
      rates. Actual FFO may differ materially. See Forward-Looking                                                                                              Slide 24------------------------------------------------------------
                                                                                    capacities may not be reflective of actual utilization rates. See
      Statements in the Advisories.                                                                                                                             (1)    Approximately 92% of the water used by our mining and extraction
                                                                                    Forward-Looking Statements and Impact of the COVID-19 Pandemic in
Slide 7-----------------------------------------------------------                                                                                                     operations in 2019 was recycled tailings water. At our Firebag in situ
                                                                                    the Advisories.
(1)   Reserves are working interest before royalties. See Reserves in the                                                                                              site, approximately 96% of the water used is recycled. The make-up
                                                                              Slide 13----------------------------------------------------------
      Advisories. The estimates of reserves for individual properties                                                                                                  is drawn from recycled wastewater from our oil sands upgrading and
                                                                              (1)   Excludes the impact of operations being shut-in due to forest fires in
      provided herein may not reflect the same confidence level as                                                                                                     utilities operations, surface run-off water collected within the facility
                                                                                    the Fort McMurray region during the second quarter of 2016.
      estimates of reserves for all properties due to the effects of          (2)   Excludes the impact of the planned major turnaround impact in                      boundary and from groundwater wells. At our MacKay River in situ
      aggregation. Suncor’s 2P Reserves (gross) for total Canada, North                                                                                                facility, close to 100% of the water is recycled and MacKay River
                                                                                    2018.
      Sea UK and Norway North Sea, respectively, are 7,273 mmboe and                                                                                                   has zero liquid discharge. The majority of make-up water comes
                                                                              (3)   Targets based on current business plans and business environment
      86 mmboe as at December 31, 2020. Sum of displayed 2P reserves                                                                                                   from groundwater, most of which is too high in salt and mineral
                                                                                    expectations. Actual results may differ materially from these targets.
      is 284 mmboe; remaining 2P reserves is displayed on slide 8 are               See Forward-Looking Statements in the Advisories.                                  content to be used for potable water or agriculture.​
      made of sanctioned projects.                                                                                                                              (2)    Fresh water consumption intensity in 2016 was adversely impacted
                                                                              (4)   Syncrude utilization rates are calculated using intermediate sour
(2)   Suncor’s 27.5% working interest is for the White Rose base project.                                                                                              by wildfires, which reduced the industrial water recycle rates and
                                                                                    production.
      Suncor’s working interest in the White Rose growth lands is                                                                                                      extended the Upgrader 2 unplanned turnaround by more than one
                                                                              Slide 14-------------------------------------------------------------
      26.125%.                                                                                                                                                         month. Fresh water consumption intensity in 2017 decreased due to
                                                                              (1)    Based on Suncor’s forecast of market access capacity available to
(3)   Photo source: Norwegian Petroleum Directorate.                                                                                                                   the sale of our Lubricants business in Mississauga, Ontario on
                                                                                     industry and Suncor’s planned production profile. See Forward
Slide 8----------------------------------------------------------                                                                                                      February 1, 2017 and further optimization of the wastewater recycle
                                                                                     Looking Statements in the Advisories.
(1)   Represents possible future opportunities currently being evaluated.                                                                                              rates at Oil Sands Base operations, including modifications and
                                                                              (2)    Approximate total pipeline capacities based on publicly sourced
      There can be no assurance these opportunities will be pursued.                                                                                                   improvements to the industrial wastewater system. Intensity
                                                                                     information available at www.capp.ca and www.enbridge.com
      Actual peak production and anticipated recoveries may vary from                                                                                                  increased in 2018 and 2019 due to the ramp up of the Fort Hills
                                                                              (3)    Proposed future pipeline. There can be no assurance this pipeline
      those expected. See Forward-Looking Statements in the Advisories.                                                                                                project, which is building up water inventory for recycling.​
                                                                                     will be built with the capacity indicated or at all. See Forward
(2)   Funds from operations (FFO) is a non-GAAP financial measure. See                                                                                          (3)    Actual results may differ materially. See Forward-Looking
                                                                                     Looking Statements in the Advisories.
      Non-GAAP Measures in the Advisories. FFO is calculated as cash                                                                                                   Statements in the Advisories.
                                                                              Slide 16-------------------------------------------------------------
      flow provided by operating activities excluding changes in non-cash                                                                                       (4)    SAGD refers to steam assisted gravity drainage.
                                                                              (1)    503.4mbbl/d refined products sales average for 2020.
      working capital.                                                                                                                                          Slide 25 --------------------------------------------------------------
                                                                              (2)    Based on Kent (a Kalibrate company) survey data for year-end
(3)   Free funds flow is calculated by taking funds from operations                                                                                             (1)    Refers to Permanent Aquatic Storage Structure (PASS).
                                                                                     2019.
      (previously referred to as cash flow from operations) for E&P and                                                                                         (2)    Based on current business plans, which are subject to change.
                                                                              (3)    316 PETRO-PASS wholesale sites, as of December 31, 2020.                          Expected benefits of PASS may not be achieved. See Forward-
      subtracting E&P capital and exploration expenditures, excluding
                                                                              (4)    1561 retail sites are operated under the Petro-Canada brand.                      Looking Statements in the Advisories.
      capitalized interest, all as indicated for the applicable year in       (5)    The Montreal and Sarnia refineries have a local reach of over 20
      Suncor’s respective Annual Reports. Management uses free funds                                                                                            (3)    Fluid tailings inventory represents fluid tailings production net of fluid
                                                                                     million people in accordance to population numbers retrieved from                 tailings treated.
      flow to measure financial performance and liquidity. Free funds flow
                                                                                     Statistics Canada 2016 census.                                             (4)    Statistic applies to Oil Sands Base. PASS accounts for ~75% of the
      is a non-GAAP measure. See Non-GAAP Measures in the
                                                                              Slide 17-------------------------------------------------------------                    2019 treatment volumes.
      Advisories.                                                             (1)    Upgrading volume percentages are based on historical averages              Slide 26-------------------------------------------------------------
(4)   At West White Rose Project discussions are ongoing with the
                                                                                     and subject to change with operating and market conditions. See            (1)    RIF refers to recordable injury frequency.​
      operator and various levels of government to determine the future of
                                                                                     Forward-Looking Statements and Impact of the COVID-19                      (2)    LTIF refers to lost time injury frequency.
      the project. At Terra Nova, the company is preserving the floating
                                                                                     Pandemic in the Advisories.
      production storage and offloading unit quayside and deferring the
                                                                              Slide 18-------------------------------------------------------------                 continued …
      asset life extension until an economically viable path forward can be
                                                                              (1)    Nameplate capacities as at January 1, 2021. Nameplate capacities

   SUNCOR ENERGY                                                                                                                                                                                                                              44
You can also read