Fuel-Cell Electric Vehicles: Plotting a Scientific and Technological Knowledge Map - MDPI
←
→
Page content transcription
If your browser does not render page correctly, please read the page content below
sustainability

Article
Fuel-Cell Electric Vehicles: Plotting a Scientific and
Technological Knowledge Map
Izaskun Alvarez-Meaza * , Enara Zarrabeitia-Bilbao , Rosa Maria Rio-Belver               and
Gaizka Garechana-Anacabe
 Foresight, Technology and Management (FTM) Group, Department of Industrial Organization and Management
 Engineering, University of the Basque Country, Pl. Ingeniero Torres Quevedo, 48013 Bilbao, Spain;
 enara.zarrabeitia@ehu.eus (E.Z.-B.); rosamaria.rio@ehu.eus (R.M.R.-B.); gaizka.garechana@ehu.eus (G.G.-A.)
 * Correspondence: izaskun.alvarez@ehu.es; Tel.: +34-946-014-245

 Received: 23 February 2020; Accepted: 13 March 2020; Published: 17 March 2020

 Abstract: The fuel-cell electric vehicle (FCEV) has been defined as a promising way to avoid road
 transport greenhouse emissions, but nowadays, they are not commercially available. However, few
 studies have attempted to monitor the global scientific research and technological profile of FCEVs.
 For this reason, scientific research and technological development in the field of FCEV from 1999 to
 2019 have been researched using bibliometric and patent data analysis, including network analysis.
 Based on reports, the current status indicates that FCEV research topics have reached maturity. In
 addition, the analysis reveals other important findings: (1) The USA is the most productive in science
 and patent jurisdiction; (2) both Chinese universities and their authors are the most productive in
 science; however, technological development is led by Japanese car manufacturers; (3) in scientific
 research, collaboration is located within the tri-polar world (North America–Europe–Asia-Pacific);
 nonetheless, technological development is isolated to collaborations between companies of the same
 automotive group; (4) science is currently directing its efforts towards hydrogen production and
 storage, energy management systems related to battery and hydrogen energy, Life Cycle Assessment,
 and greenhouse gas (GHG) emissions. The technological development focuses on technologies related
 to electrically propelled vehicles; (5) the International Journal of Hydrogen Energy and SAE Technical
 Papers are the two most important sources of knowledge diffusion. This study concludes by outlining
 the knowledge map and directions for further research.

 Keywords: fuel cell electric vehicle; bibliometric analysis; patent analysis

1. Introduction
     The increase in energy use and related emissions was generated by a higher demand for heat
from the residential and commercial sectors and road transport demand; consequently, road transport
greenhouse gas (GHG) emissions increased for the second subsequent year, continuing the upward
trend in emissions that started in 2014 [1]. The electrification of mobility is an essential element in a
wider strategy for achieving reduced greenhouse gas emissions [2]. During the previous century, the
automotive industry transformed society, bringing new technologies to the market that enhanced their
internal combustion engine vehicles, such as global electric vehicles, which are known as one of the
most hopeful alternatives for lowering transport-sector carbon dioxide emissions [3,4]. An Electric
Vehicle (EV) is a road vehicle that includes electric propulsion. With this definition in mind, EVs may
include battery electric vehicles (BEV), hybrid electric vehicles (HEV), and fuel-cell electric vehicles
(FCEV) [5]. As sustainable products, FCEVs bring hope for solving several mobility-related problems,
as they have no local emissions [6]. One of the most promising ways to achieve an ideal zero-emissions
replacement is to use cleanly produced electricity from non-fossil fuels, such as hydrogen, using

Sustainability 2020, 12, 2334; doi:10.3390/su12062334                     www.mdpi.com/journal/sustainability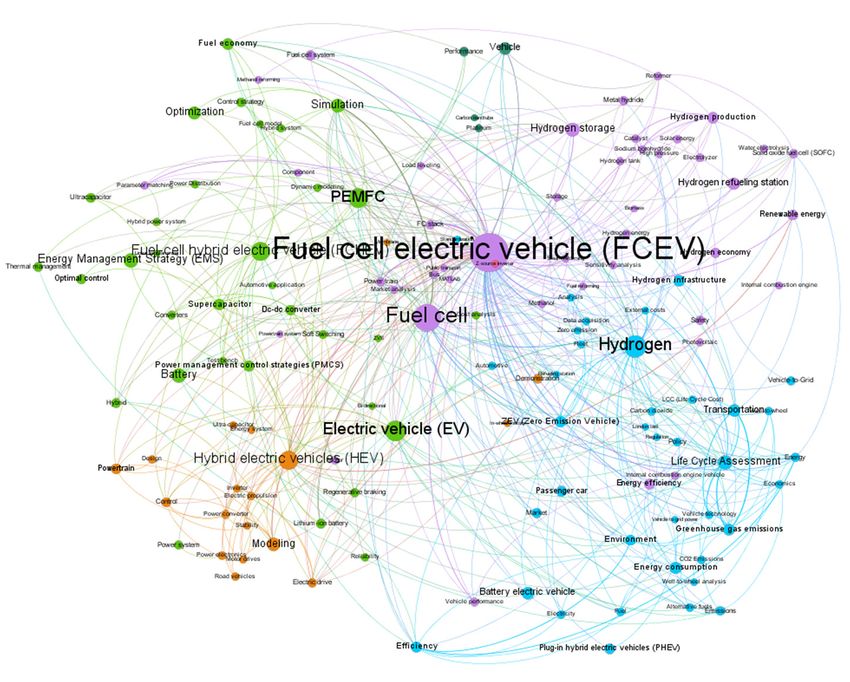
Sustainability 2020, 12, 2334                                                                         2 of 25

fuel-cell technology [7]. Although FCEVs are promising ways to avoid emissions, both technologies
are far from being profitable for car manufacturers [6]. In addition, the European Commission [8] set a
target for 40% of new cars and vans to be zero- or low-emission vehicles by 2030. Furthermore, in
the European Strategic Energy Technology Plan, hydrogen and fuel-cell technologies are identified
as the key technologies for achieving GHG reduction targets by 2050 [9,10], and in the European
Community Research Program, electromobility is a priority. Here, electric vehicle policy focuses
mainly on technology optimization and market development, setting future challenges concerning
battery and supercapacitor durability, and charging infrastructure, among others [11]. In turn, the
collaborative research and development (R&D) technological projects in Europe are funded by the
European Commission [12], and one of the main priorities for transport research and innovation
in Horizon 2020 (H2020) is making transport more sustainable [13]; for this reason, the European
Commission is promoting clean transport, both for electric vehicles by investing in electromobility
initiatives and for FCEVs or hydrogen FCEVs, enabling their commercial development by 2020 [11]. In
addition, Edwards et al. [14] performed a roadmap review of deployment status and targets for fuel-cell
applications, such as fuel-cell vehicles, and the annual sales forecast was between 0.4–1.87 million
during 2020–2025. In order to help all actors involved in clean transport, it is useful to understand how
scientific research is evolving and whether it is having an impact on its technological development.
      Bibliometric techniques open the door to a fuller understanding of the scientific research carried
out on FCEVs, differing from a conventional literature review: The bibliometric method supplies
an innovative, objective perspective through reliable, quantitative processes, and has been broadly
used in scientific research as an analytical tool to provide assistance to scholars with a general
comprehension of typical research topics [15]. According to Garousi [16], bibliometric analysis is
a well-established method used to measure publications in a scientific research area, and assessing
trends and the value of research is becoming increasingly important [17,18]. According to different
authors, bibliometrics is approached in various ways and is defined as a research method, or research
technique, that allows scientific literature representing extensive global data sets and reliable data to
be analyzed and quantitatively measured [19–21]. We can take this a little further and introduce the
term “scientometrics”, defined by Nowak [19]: “Scientometrics focuses on the processes occurring
in science” [21]. Scientometrics is the quantitative study of research transfer, and its analysis makes
it possible to capture and map scientific knowledge [21–23]. Hence, its main objective is to aid the
analysis of emerging trends in the knowledge domain [24]; in addition, knowledge mapping and
visualization are meaningful fields of scientometrics [25].
      In the main databases, such as Web of Science and Scopus, there is no bibliometric analysis of the
“FCEV” research field. However, other bibliometric analyses have been carried out in research fields
related to fuel-cell technology. Kang et al. [26] define a diffusion model based on bibliometric analysis
applied to fuel-cell technologies. Cindrella et al. [27] present a bibliometric analysis about the field of
fuel cells in general from 1992 to 2011, offering a comprehensive overview of trending publications,
journals, and countries, and identifying research hotspots through keywords. A similar overview was
conducted by Yonoff et al. [28], identifying research trends in Proton Exchange Membrane Fuel Cells
(PEMFCs). Related to energy and fuel research in China, Chen et al. [29] conducted a bibliometric
analysis and, as a result, hydrogen and fuel cells are among the energy research priorities. Bibliometric
studies on energy materials related to hydrogen are also relevant, such as the analysis of sodium
borohydride (NaBH4) done by Santos and Sequeira [30], as well as on a lithium mineral developed by
Agusdinata et al. [31]. Considering that FCEVs are a particular field of EV application, Egbue and
Long [32] and Ramirez et al. [33] carried out bibliometric analyses in order to detect the most relevant
research points. In turn, Zhao et al. [34] depict a bibliometric analysis for EV charging system reliability
to analyze the emerging trends of this active research point, such as in EV batteries.
      Patents provide an exclusively detailed source of information of inventive activity [35] and
increase the use and commercialization of technologies though market transactions [36], promoting
the diffusion of knowledge and innovation. According to Griliches [37], patents are one of the most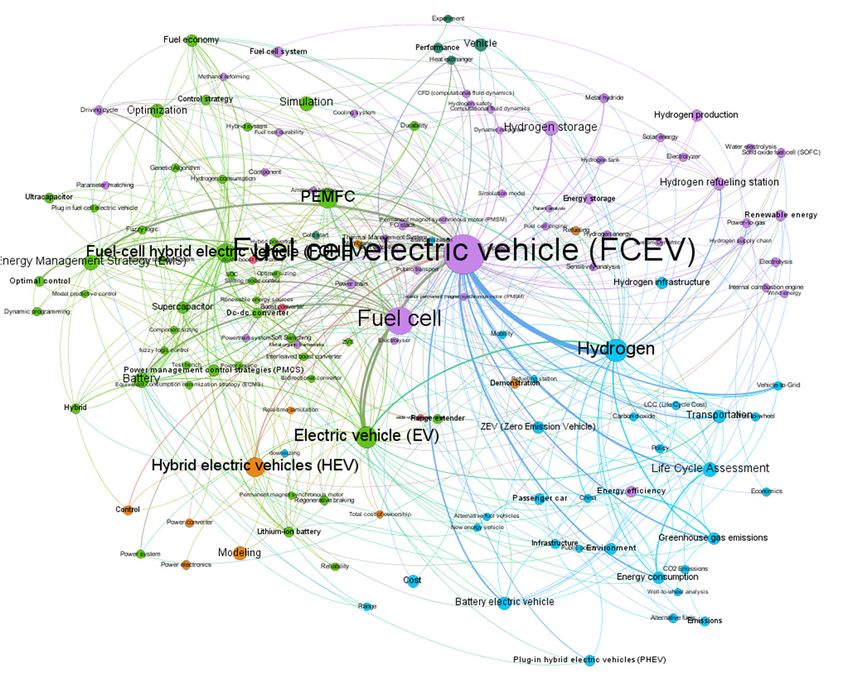
Sustainability 2020, 12, x FOR PEER REVIEW 3 of 27
Sustainability 2020, 12, 2334 3 of 25
the diffusion of knowledge and innovation. According to Griliches [37], patents are one of the most
influential proxies for assessing the performance of industry research and development (R&D). For
influential proxies
these reasons, for assessing
the patent the performance
is an important of industry research
tool for investigating and development
a technological development (R&D).
fromForan
these reasons, the patent is an important tool for investigating a technological
economic perspective [38]. According to Borgstedt et al. [6], in the automotive industry, patents are development from an
economic perspective
the most common way[38]. According
to protect to Borgstedt
intellectual property, et al.
so[6], in the
it can automotive
be used industry,
as innovative patents
output. are
Patent
the most common way to protect intellectual property, so it can be used as
data analysis allows us to ascertain the technological state of the studied technology, defining who, innovative output. Patent
data
when, analysis
where,allows
and what us to ascertain
is being the technological
developed by mining staterelevantof the
datastudied technology,
from patent defining
documents who,
in terms
when, where, and
of technology what is being
development developed
[39]. by mining
In addition, in thisrelevant
case, indatathefrom
mainpatent documents
databases, such in
as terms
Web of of
technology development [39]. In addition, in this case, in the main databases,
Science and Scopus, there is no patent data analysis of “FCEV” research articles; nevertheless, other such as Web of Science
and Scopus,
research there related
papers is no patent data analysis
to patents of “FCEV”
in fuel-cell research articles;
technologies have beennevertheless,
developed. other research
Related to
papers related to patents in fuel-cell technologies have been developed. Related
biohydrogen, Leu et al. [38] carried out a patent data and citation analysis. With regard to fuel cells, to biohydrogen, Leu
et al. [38]
Chang et carried out a patent
al. [40] studied data and between
the coactivity citation analysis.
science and With regard to by
technology fuelanalyzing
cells, Chang et al. [40]
patent–paper
studied the coactivity
pairs. Related between
to technology science and
forecasting, Chen technology by analyzing
et al. [41] defined a modelpatent–paper
for a patentpairs. Related
strategy to
for fuel-
technology forecasting, Chen et
cell technologies using the S-curve method.al. [41] defined a model for a patent strategy for fuel-cell technologies
usingInthe S-curve method.
demonstrating the evolution of the scientific–technological research of the FCEV domain, this
paper Inoffers
demonstrating the evolution
a comprehensive assessment of theofscientific–technological
the FCEV research practices research of the
which wereFCEV domain,
published in
this paper offers a comprehensive assessment of the FCEV research
the Scopus database from 1999–2019, in order to identify the key actors in the generation and practices which were published
in the Scopusofdatabase
transmission knowledge from 1999–2019,
related in order
to FCEVs. As fartoasidentify the keydevelopment
technological actors in theisgeneration
concerned, andthis
transmission
paper presents the technological trends of industrial developments, mainly led in this case bythis
of knowledge related to FCEVs. As far as technological development is concerned, the
paper presents
automotive the technological
industry, trends of among
in order to establish, industrial developments,
others, who leads the mainly led in
research andthis case by the
development.
automotive industry,
All this is done in order
in order to draw to establish,
the FCEV among others,knowledge
technology who leads the map,research and it
to discuss development. All
with the results
this is done in order to draw the FCEV technology knowledge map, to discuss
of other scientific–technological research studies, and, therefore, to be able to predict the future paths it with the results of
other scientific–technological
of research trends and foreseeable research studies, and, therefore, to be able to predict the future paths of
scenarios.
research trends and foreseeable scenarios.
2. Materials and Methods
2. Materials and Methods
The research process, adapted from Bildosola et al. [42] with some changes, is based on three
The research process, adapted from Bildosola et al. [42] with some changes, is based on three steps
steps that are intended to define the scientific research activity profile and the technological profile
that are intended to define the scientific research activity profile and the technological profile of FCEVs.
of FCEVs. These steps are developed to answer the questions related to who, where, and what is
These steps are developed to answer the questions related to who, where, and what is being or has
being or has been researched or developed related to scientific literature and patents. Figure 1 shows
been researched or developed related to scientific literature and patents. Figure 1 shows the research
the research approach, revealing that each step has its input and output, creating a flow of
approach, revealing that each step has its input and output, creating a flow of information that allows
information that allows the set objectives to be achieved. In each step, the specific technique used is
the set objectives to be achieved. In each step, the specific technique used is identified. The stages are
identified. The stages are developed consecutively, until the scientific and technological profiles are
developed consecutively, until the scientific and technological profiles are determined. However, the
determined. However, the objective of this research process is to be able to cover any type of emerging
objective of this research process is to be able to cover any type of emerging technology or application.
technology or application.
Figure 1.
Figure 1. Research
Research process
process step
step by
by step.
step.
Profile generation
Profile generationisiscarried
carriedout
outthrough
throughthe
the first
first three
three steps,
steps, andand
thethe main
main tasks
tasks tocarried
to be be carried
out
out explained
are are explained below.
below.
Step 1. Retrieving data and refining the search. The first assignment is to generate two specific
databases concerning
databases concerningscientific
scientific publications
publications and and
patentspatents
relatedrelated to the emerging
to the emerging technology technology
analyzed.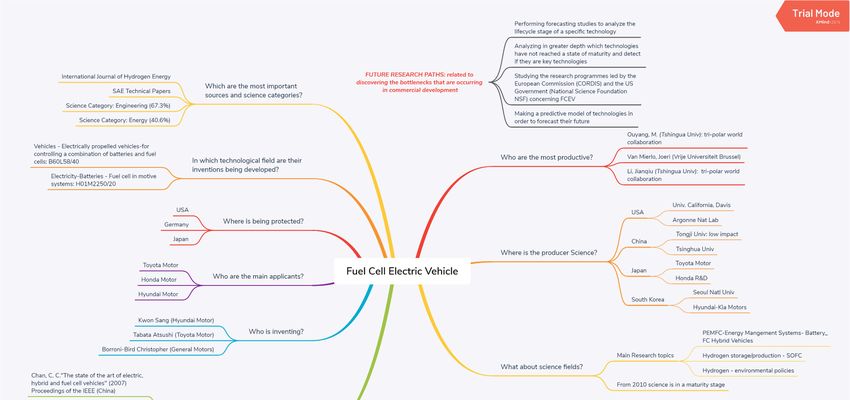
Sustainability 2020, 12, 2334                                                                            4 of 25

Regarding the selection of the scientific database, different studies show that better results are
obtained [43,44] by using all of the databases (Scopus, Web of Science (WoS), and Google Scholar
(GS)). Nevertheless, a very high percentage of WoS and Scopus citations are normally found in GS;
those that are not, called unique citations, present a lower scientific impact than WoS and Scopus
citations [45]. Furthermore, the two databases complement each other [43]; however, in this case,
Scopus returns more citations than WoS. For this reason, in the case of FCEVs, the specific databases
were generated from Scopus as the scientific database and Lens as the patent database. Scopus is one of
largest abstract and citation databases of peer-reviewed literature (75 million documents indexed) [46],
and it was selected to provide scientific publications. Because blooming technologies meet different
approaches, the definition of the search query is very important. In bibliometric search strategies,
the balance between recall and precision is very important [47]. However, information scientists
usually detect an inverse association between recall and precision [48]. Therefore, the query was built
using “fuel-cell vehicle/car/automobile” as author keywords, obtaining a highly precise query. In
addition, to achieve greater recall, the search for the same terms based on the index terms is added
to the query (see Table 1). Index terms are derived from thesauri that Elsevier owns and are added
to improve search recall [46]. The data collection time span was established between 1999 and 2019.
In addition, according to Hawkins [49], gatekeeping publications, such as Abstracting and Indexing
(A&I) publications, are the main way to identify advances of a technology. Therefore, the query is in
line with the document type: Journal Article and Conference Proceeding. The main query used in
the Scopus database retrieved a total of 2514 articles and conference papers for the defined time span.
The patent analysis was carried out using Lens, a complete open-source global patent database and
research platform containing the world’s most comprehensive full-text patent collection. The search
for patents relating to FCEVs was carried out on the basis of Cooperative Patent Classification (CPC),
also explained as the patent’s field of technological application. Specifically, the search is directed by
the classification Y02T90/34—fuel-cell-powered electric vehicles—which makes the results of localized
patents far more accurate. The Y CPC was created in order to give a technological application coverage
to new technologies that are not included in the International Patent Classification (IPC); Y: General
tagging of new technological developments. Y02T90: Technologies for climate-change mitigation or
adaptation related to transportation—enabling technologies with a potential or indirect contribution to
GHG emission mitigation. In addition, the search was limited to the patent priority year (or the year in
which the patent was invented) in the period from 1999 to 2019.

                 Table 1. Search query for fuel-cell electric vehicles adapted to the Scopus database.

                                                        Query
 AUTHKEY(“fuel cell*” W/2 vehicle*) OR AUTHKEY(“fuel cell*” W/2 car) OR AUTHKEY(“fuel cell*” W/2 cars) OR
 AUTHKEY (“fuel cell*” W/2 automobile*) OR INDEXTERMS (“fuel cell*” W/2 vehicle*) OR INDEXTERMS (“fuel
 cell*” W/2 car) OR INDEXTERMS(“fuel cell*” W/2 cars) OR INDEXTERMS (“fuel cell*” W/2 automobile*) AND
                       (LIMIT-TO (DOCTYPE, “cp”) OR LIMIT-TO (DOCTYPE, ”ar”))
                                                  Source: Own work.

     Step 2: Cleaning up the refined database. This second task includes the use of text mining tools.
The scientific database and the patent database were imported into the Vantage Point (VP) software [50].
VP works with search results from text databases. VP’s capabilities can be broad after importing raw
data from scientific databases. VP includes powerful data cleaning tools based on a thesaurus or fuzzy
matching techniques. Furthermore, VP integrates powerful techniques for analyzed data, such as
natural language programming, a co-occurrence matrix, Principal Component Analysis (PCA), Social
Network Analysis (SNA), clusters, and other capabilities for visualizing data. Scientific publications
obtained from the previous step were integrated into the database, and in specific fields, such as
authors, affiliations, journals, and authors’ keywords, a fuzzy matching was applied in order to group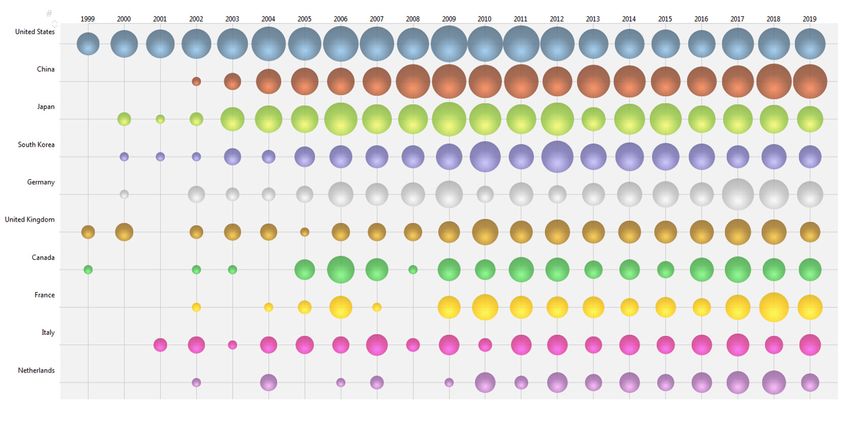
Sustainability 2020, 12, 2334 5 of 25
the variations of a word (plurals, acronyms, and similar expressions, among others) that convey the
same meaning.
Step 3: Generating the profile. The profile is divided into two parts: The scientific research profile
Sustainability
and the 2020, 12, x FOR
technological PEER REVIEW
profile. The scientific profile is based on the literature profile and5 of 27
research
community profile, and these describe the research activity in terms of publication trends, academic
Step 3: Generating the profile. The profile is divided into two parts: The scientific research profile
performance, research topics, and sources of knowledge. The technological profile deals with issues
and the technological profile. The scientific profile is based on the literature profile and research
related to patentprofile,
community trends, the
and main
these countries
describe of jurisdiction,
the research activity ininventors and applicants,
terms of publication and the main
trends, academic
technological
performance, fields. To facilitate
research the analysis
topics, and sources ofofknowledge.
scientific–technological
The technologicaltrends, an deals
profile analysis
withofissues
networks
was carried
related to out, visualizing
patent trends, thethemain
collaborative
countries ofnetworks between
jurisdiction, inventorscountries, co-authorship
and applicants, and the networks,
main
keyword co-occurrences,
technological fields. To and collaboration
facilitate networks
the analysis of applicants and inventors.
of scientific–technological trends, anFor this, starting
analysis of
networks was carried out, visualizing the collaborative networks between
from the matrices of co-occurrences, created both statically and dynamically in the VP software countries, co-authorship
networks,
(Search Technololy keyword
Inc. co-occurrences,
Atlanta, USA),and thecollaboration
networks were networks of applicants
generated and inventors.
and visualized through Forthe
this,Gephi
starting
software [51]. from the matrices of co-occurrences, created both statically and dynamically in the VP
software (Search Technololy Inc. Atlanta, USA), the networks were generated and visualized through
the Gephi software [51].
3. Results
3. ResultsResearch Profile in FCEVs
3.1. Scientific
3.1.1.3.1. Scientific
General Research
Trends Profile in FCEVs
of Publications and Citations
The
3.1.1.evolution of publications
General Trends andand
of Publications citations
Citationsin the last 20 years is represented in Figure 2 (on a
logarithmic basis). Both of them increased sharply,
The evolution of publications and citations in the indicating growing
last 20 years academic
is represented in interest
Figure 2 in
(onFCEVs.
a
Whereas in 1999,
logarithmic thereBoth
basis). were of only
them 13 scientific
increased articles,
sharply, this number
indicating growinggrew to 171
academic in 2018,
interest an increase
in FCEVs.
of 1215%.
WhereasBetween
in 1999,the years
there were 2005
onlyand 2006, thearticles,
13 scientific number thisofnumber
publications
grew tojumped markedly
171 in 2018, and then
an increase
of 1215%.
stabilized withBetween the years
a constant 2005 and 2009
production, 2006, being
the number of publications
the most productive jumped
year markedly
with 203 and then
publications.
stabilized
However, the with
number a constant production,
of citations 2009rapidly
per year being the most productive
increased yearand
from 2005, withwas
203 over
publications.
twenty-two
However, the number of citations per year rapidly increased from 2005,
times higher in 2018 (5081) than in 2005 (227). Hence, the scientific research community and was over twenty-two
is paying
moretimes higher in 2018 (5081) than in 2005 (227). Hence, the scientific research community is paying
attention to topics related to cleaner transport. In addition, Figure 2 shows the results of a less
more attention to topics related to cleaner transport. In addition, Figure 2 shows the results of a less
precise search of the two terms, displayed independently (query: Fuel cell* and query: Vehicle*/car
precise search of the two terms, displayed independently (query: Fuel cell* and query: Vehicle*/car
or cars/automobile*), resulting in a very high number of publications, with a similar growth and
or cars/automobile*), resulting in a very high number of publications, with a similar growth and
continuous increase
continuous of both
increase searches.
of both searches.
100000
14974 16834
12201
10000 9134 10056 9725 10880 7728 7911 8510
6318 6605
6437 7041 8499
7292 6333 6677 6489 7401 7117
5062 5663
4643 4504 4443 5081 4454
3964 4386 3968 3517 3592 3823
2912 2795 3437 2779 2763
1776
1749 1959 2081
1293 1393
1265 1562
1000 1209
786 904
698
669 608
566
555 484
311
227 203 193 179 174
154 123 133 171 171 145
100 108 131 143 129 120
74 79 91
54 46 51
35 30
18
10 13
2
1
nº of publications citations per year
publications related to fuel cell publications related to vehicle/car/automobile
Figure 2. General trends of publications and citations from 1999 to 2019.
Figure 2. General trends of publications and citations from 1999 to 2019.
3.1.2. Academic Performance: Countries, Organizations, and Authors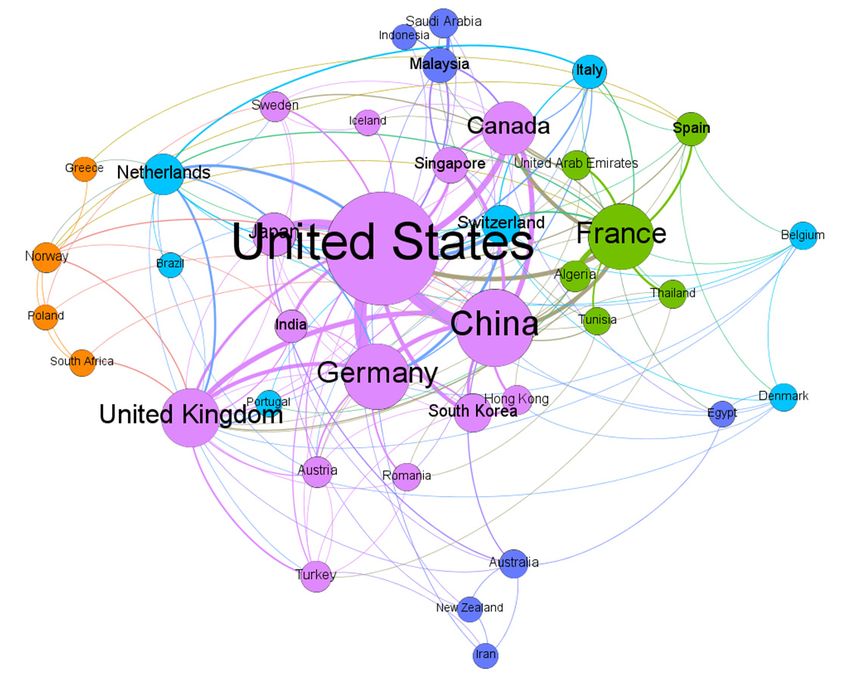
Sustainability 2020, 12, 2334 6 of 25
Sustainability 2020, 12, x FOR PEER REVIEW 6 of 27
3.1.2. Academic Performance: Countries, Organizations, and Authors
In total, authors
In total, from
authors 61 61
from countries published
countries publishedpapers
paperson onFCEVs.
FCEVs.The Theaffiliations
affiliationsofofauthors
authors are a
goodareindicator of the specific
a good indicator patterns
of the specific of research
patterns concentration
of research concentrationandand
excellence
excellence followed
followedbybythese
countries and organizations.
these countries The most
and organizations. Theadvantageous countries
most advantageous in terms
countries of publishing
in terms of publishing about FCEVs
about
(seeFCEVs
Figure(see Figure
3) are not 3) are not geographically
geographically concentrated,
concentrated, but arebut are rather
rather located
located in tri-polar
in the the tri-polar world
world (North
(North Asia-Pacific,
America, America, Asia-Pacific, and Europe).
and Europe). The The
two two principalcountries
principal countries with
withthethehighest
highestnumber of
number of
publications are the USA (618) and China (451). Almost half of the publications are from
publications are the USA (618) and China (451). Almost half of the publications are from USA, China USA, China
and Japan (364).
and Japan (364).
Figure 3. Evolution of the number of articles by country according to publication year, from 1999
to 2019.
Figure 3. Evolution of the number of articles by country according to publication year, from 1999 to
2019.
In addition, the USA, UK, and Canada stand out as pioneers in scientific research (with regards to
the 1999 start date), and they also grew progressively over time. Production in China, despite being
In addition, the USA, UK, and Canada stand out as pioneers in scientific research (with regards
the country with the second-most publications, began to be relevant in 2002–2003.
to the 1999 start date),
In order and they
to identify also grew
collaboration progressively
activities betweenover time.countries,
different Production an in China,method
effective despiteisbeing
the country
a network with the second-most
analysis. Using Gephipublications, began tothe
for network analysis, be main
relevant in 2002–2003.
countries (countries that have at
In order
least three to identify collaboration
collaborative publications)activities betweencollaborations
with international different countries, an effective
were identified method is a
and plotted
network analysis.
(see Figure Using
4). The Gephi
size of forrepresents
the node network the analysis,
numberthe main countries
of connections; (countries
consequently, that have
a country withata least
threelarger node, such as
collaborative the USA, is more
publications) withactive in academiccollaborations
international collaborations inwere
the field of FCEVs.
identified Theplotted
and width (see
of the connecting line represents the cooperative frequency. Academic collaborations
Figure 4). The size of the node represents the number of connections; consequently, a country with a between China,
Germany,
larger Japan,as
node, such and theUSA,
the USA are the most
is more frequent.
active In the main
in academic cluster led by the
collaborations USA,
in the bothof
field European
FCEVs. The
and North American countries, as well as Asian-Pacific countries, are collaborating. The identified
width of the connecting line represents the cooperative frequency. Academic collaborations between
collaborations between countries follow the same pattern of collaboration convergence clubs as those
China, Germany, Japan, and the USA are the most frequent. In the main cluster led by the USA, both
related to applied science, as defined by Barrios et al. [52]. In addition, international collaborations are
European and North American countries, as well as Asian-Pacific countries, are collaborating. The
located in a tri-polar world (Europe, North America, and Asia-Pacific); the science powerhouses are
identified
countriescollaborations between
placed in the central countries
positions of thefollow thesurrounded
networks, same pattern of collaboration
by emerging convergence
scientific countries.
clubs as those
Possible related
reasons for to applied science,
collaborations as defined
may include by language
English Barrios et al. [52].
skills, In addition,
post-colonial links,international
science
collaborations are economic
skill proximity, located inproximity,
a tri-polar world
and (Europe,
international North America,
students, among othersand[53].
Asia-Pacific); the science
powerhouses are countries placed in the central positions of the networks, surrounded by emerging
scientific countries. Possible reasons for collaborations may include English language skills, post-
colonial links, science skill proximity, economic proximity, and international students, among others
[53].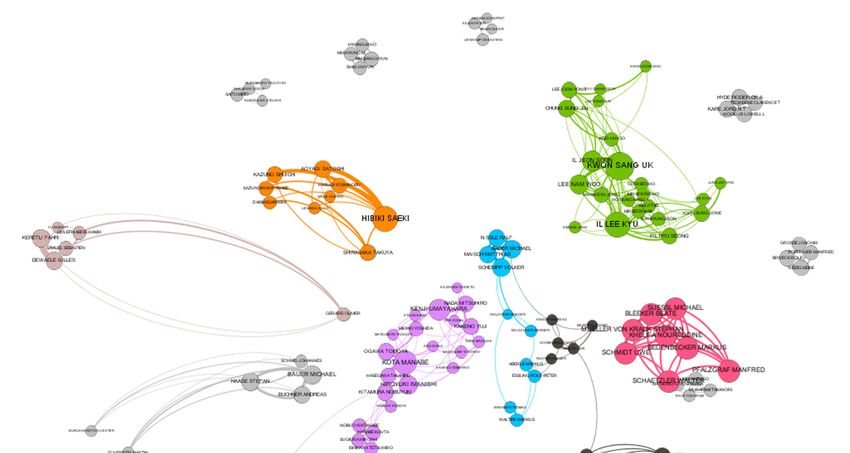
Sustainability 2020, 12, 2334 7 of 25
Sustainability 2020, 12, x FOR PEER REVIEW 7 of 27
Figure 4. Academic collaborations among the main countries.
Figure 4. Academic collaborations among the main countries.
According to organizations, Table 2 describes the 10 most active organizations, including the
numberAccording to organizations,
of publications, Table 2countries,
their affiliated describesand the their
10 most activecitations
average organizations, includingThe
per publication. the
number
most of publications,
productive organization theirby
affiliated countries,
far is Tongji and their
University average
with 134 citationsHowever,
publications. per publication. The
the average
most productive organization by far is Tongji University with 134 publications. However,
citations per publication for the Tsinghua University (ranked #2) is four times greater, and for General the average
citations(ranked
Motors per publication
#9), it is for
seventhetimes
Tsinghua University
greater than for(ranked #2) is four times
Tongji University. greater,
Therefore, and
this for General
organization
Motors Univ.)
(Tongji (ranked #9), ittoisimprove
needs seven times greaterofthan
the quality for Tongji University.
its publications Therefore,
to ensure that this organization
its publications become
(Tongji Univ.) needs to improve the quality of its publications to ensure that
sources of knowledge for other scientific publications. In general, Chinese organizations have its publications become
fewer
sources of knowledge for other scientific publications. In general, Chinese organizations
average citations per publication, and their publications are concentrated within a few organizations. have fewer
average
With thecitations perofpublication,
exception and theirthe
Tongji University, publications are concentrated
National Renewable Energywithin a few organizations.
Laboratory, and the US
With the exception of Tongji University, the National Renewable
Department of Energy, the publications from the most active organizations do impact Energy Laboratory, and the US
academic
Department
research. of Energy,the
Highlighting thepresence
publications from the most
of non-academic active organizations
organizations among the do topimpact academic
10 organizations
research. Highlighting the presence of non-academic organizations among the
(General Motors, Ford Motors, and Toyota Motors), the research results have an important impact on top 10 organizations
(General
the Motors, Ford
science-driven Motors, and Toyota Motors), the research results have an important impact on
domain.
the science-driven domain.
Table 2. The most active organizations.
Table 2. The most active organizations.
Organization Publications Country Average Citations Per Publication
Organization
Tongji University Publications
134 Country
China Average Citations
3.98per Publication
Tsinghua
TongjiUniversity
University 76 134 China
China 16.72
3.98
Toyota Motor Corporation
Tsinghua University 56 76 Japan
China 23.34
16.72
University of California, Davis 50 USA 15.00
Toyota Motor Corporation
Argonne National Laboratory 44
56 Japan
USA
23.34
17.95
University of California, Davis
National Renewable Energy Laboratory 44 50 USA
USA 15.00
5.48
Argonne National
Seoul National Laboratory
University 43 44 USA
South Korea 17.95
22.42
NationalFord Motor Company
Renewable Energy Laboratory 41 44 USA
USA 11.02
5.48
General
Seoul Motors
National University 35 43 USA
South Korea 28.91
22.42
US Department of Energy 35 USA 9.09
Ford Motor Company 41 USA 11.02
General Motors 35 USA 28.91
The US Department
analysis of theofmost
Energy 35
productive authors USA3) reveals Minggao9.09
(see Table Ouyang (Tsinghua
University, China), Joeri Van Mierlo (Vrije Universiteit, Brussel), and Jianqiu Li (Tsinghua, China)
as theThe analysis
three of the publishing
researchers most productive
the mostauthors
in the(see Table
field. All 3)
of reveals
the top Minggao Ouyang
authors have (Tsinghua
at least fifteen
University, China), Joeri Van Mierlo (Vrije Universiteit, Brussel), and Jianqiu Li (Tsinghua,
publications; however, if we evaluate their citation average per publication, important differences China) as
the threeauthors
between researchers publishing
appear. the the
For instance, most in the
sixth field.
author, AllS.ofwith
Zuo, the 16
top authors have
publications, hasata low
leastaverage
fifteen
publications;
number however,
of citations per ifpublication
we evaluate theirmeaning
(2.19), citation that
average
theirper publication,
academic work important differences
has little influence on
between authors appear. For instance, the sixth author, Zuo, S. with 16 publications,
other scientific research. In general, the top 10 most productive authors have a high average number of has a low
average number of citations per publication (2.19), meaning that their academic work has little
influence on other scientific research. In general, the top 10 most productive authors have a high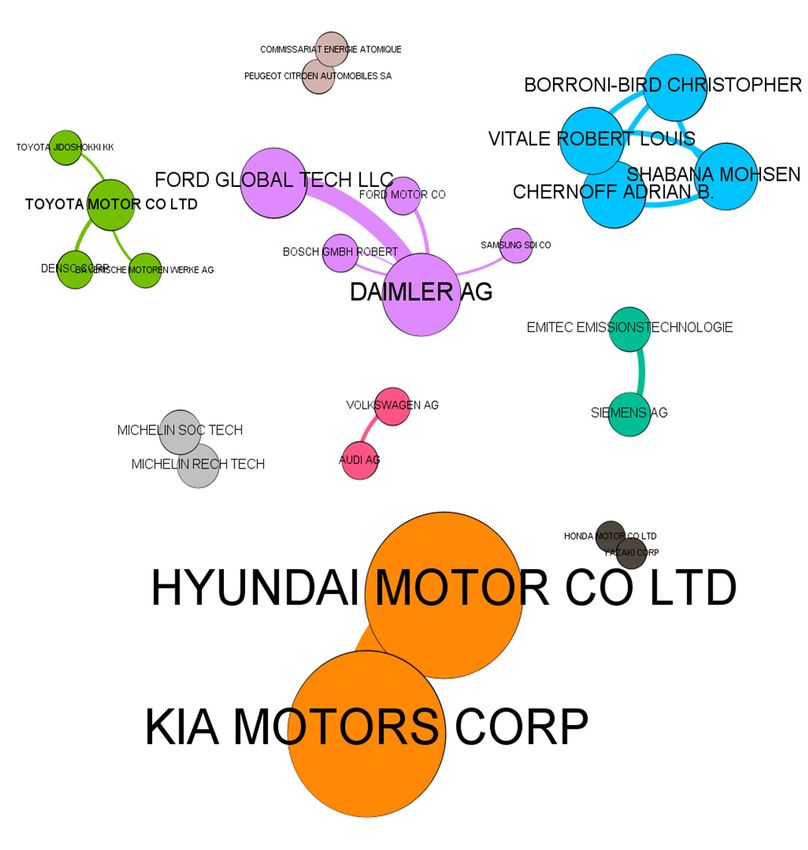
Sustainability 2020, 12, 2334                                                                                      8 of 25

citations per publication, highlighting the authors from Tsinghua University, whose research work has
an important influence on other scientific developments.

                                       Table 3. Top 10 most productive authors.

                                                                                     Average
       Authors                  Institution           Country        Counts        Citations per      Subject Area a
                                                                                   Publication
      Ouyang,                                                                                           Energy and
                            Tsinghua University        China           25              33,20
      Minggao                                                                                           Engineering
     Van Mierlo,                                                                                        Energy and
                         Vrije Universiteit Brussel   Belgium          23              25,91
        Joeri                                                                                           Engineering
                                                                                                        Energy and
      Li, Jianqiu           Tsinghua University        China           21              36,90
                                                                                                        Engineering
                                                                                                        Energy and
     Xu, Liangfei           Tsinghua University        China           18              42,28
                                                                                                        Engineering
                               Université de
        Ravey,                                                                                          Energy and
                                Technologie            France          16              15,44
      Alexandre                                                                                         Engineering
                            Belfort-Montbéliard
   Zuo, Shuguang             Tongji University         China           16               2,19            Engineering
                              Seoul National           South
    Cha, Sukwon                                                        15              17,60            Engineering
                                 University            Korea
      Djerdir,             Université Bourgogne                                                         Energy and
                                                       France          15               6,67
    Abdesslem                 Franche-Comté                                                             Engineering
      Rathore,
                           Concordia University       Canada           15              26,93            Engineering
   Akshay Kumar
                            National Renewable
  Wipke, Keith B.                                       USA            15               8,53            Engineering
                            Energy Laboratory
      a Subject areas are summarized from the selected publications in the established dataset (Scopus), taking into
      account the most frequent subject areas.

     A co-authorship network was generated and plotted by using Gephi, as shown in Figure 5,
identifying a collaboration network of the top authors (authors with over three publications as
co-authorships). The layout of the networks was developed using Force Atlas 2. Each node represents
each author, while each link represents the pattern of collaboration. Among the top 10 authors, only
the authors affiliated with Tsinghua University (Minggao Ouyang, Jianqiu Li, and Liangfei Xu) have a
strong co-authorship between them; the rest of the authors have less intense relationships with other
authors who are not in the top 10. The main academic groups can be identified, highlighting that there
is no collaboration between them. Five research groups can be identified, whose main authors work in
the research field (subject area) of energy and engineering related to FCEVs. Therefore, as far as the
research field is concerned, they present few differences, but their locations do: Each group is from a
different country or continent (USA, Japan, and Belgium), except for research group 1, in which the
authors located in the tri-polar world (France, Canada, USA, China, and South Korea) collaborate, and
research group 4, in which authors from China and South Korea collaborate.

3.1.3. Sources and Subject Area Classification
     Sources with more documents published about FCEVs were identified. The search was limited to
journals and conference proceedings, with 60% of the publications published in journals and 40% as
conference proceedings. The most productive journal is closely related to hydrogen; however, most of
the top journals are related to the automobile industry, electrochemical science, and energy applications.
The most notable of the 10 most productive sources was the International Battery, Hybrid, and Fuel-Cell
Electric Vehicle Symposium (EVS) organized by the World Electric Vehicle Association (WEVA). The
2514 publications were published in 721 different sources; therefore, the works are not centered around
a few journals, but more than 20% were published in two sources. Specially, the International Journal
of Hydrogen Energy (271 articles, 10.7%), SAE Technical Papers (257 articles, 10.15%), and Journal of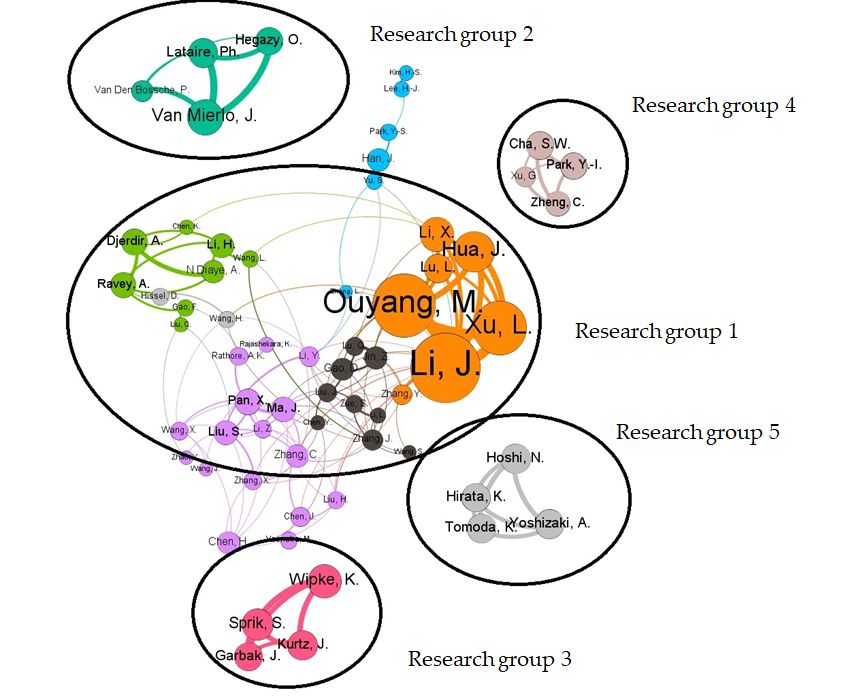
Sustainability 2020, 12, 2334                                                                                                         9 of 25

 Power Sources (104 articles, 4.1%) are the top journals (see Figure 6). Moreover, the top journals are
 indexed in2020,
Sustainability the 12,
                   Clarivate   Analytics
                       x FOR PEER REVIEWJournal Citation Report with upper quartile rankings.    9 of 27

                                                              Figure 5. Co-authorship network.

  3.1.3. Sources and Subject Area Classification
       Sources with more documents published about FCEVs were identified. The search was limited
  to journals and conference proceedings, with 60% of the publications published in journals and 40%
  as conference proceedings. The most productive journal is closely related to hydrogen; however, most
  of the top journals are related to the automobile industry, electrochemical science, and energy
  applications. The most notable of the 10 most productive sources was the International Battery,
  Hybrid, and Fuel-Cell Electric Vehicle Symposium (EVS) organized by the World Electric Vehicle
  Association (WEVA). The 2514 publications were published in 721 different sources; therefore, the
  works are not centered around a few journals, but more than 20% were published in two sources.
  Specially, the International Journal of Hydrogen Energy (271 articles, 10.7%), SAE Technical Papers
  (257 articles, 10.15%), and Journal of Power Sources (104 articles, 4.1%) are the top journals (see Figure
  6). Moreover, the top journals are indexed in the Clarivate Analytics Journal Citation Report with
  upper quartile rankings.                        Co-authorshipnetwork.
                                       Figure5.5.Co-authorship
                                      Figure                    network.

3.1.3. 25th International Battery, Hybrid and Fuel Cell Electric Vehicle Symposium…
       Sources         and Subject Area Classification                                  25
         24th International Battery, Hybrid and Fuel Cell Electric Vehicle Symposium…   25
     Sources with more documents published                                       about FCEVs
                                                                     Energy Policy      26      were identified. The search was limited
                                                                   Applied Energy       27
to journals and conference proceedings, with 60% of the publications published in journals and 40%
     22nd International Battery, Hybrid and Fuel Cell Electric Vehicle Symposium…
as conference        proceedings. The most productive journal is                          35 closely related to hydrogen; however, most
                                                                  ECS Transactions         42
of the top journals are related to the automobile industry, electrochemical science, and energy
                                                    World Electric Vehicle Journal           50
applications. The most notable of                            the 10 most productive sources
                                                         Journal of Power Sources                      104
                                                                                                           was the International Battery,
Hybrid, and Fuel-Cell Electric Vehicle                              Symposium
                                                            SAE Technical Papers      (EVS)    organized   by the World Electric257Vehicle
Association (WEVA). The                      2514 Journal
                                         International publications           were published in 721 different sources; therefore,
                                                               of Hydrogen Energy                                                  271 the
works are not centered around a few journals, but more than 20% were published in two sources.
Specially, the International       Figure 6.    Journal
                                                   A summary    of Hydrogen         Energy
                                                                        of publications      (271 articles,
                                                                                          according          10.7%),
                                                                                                    to the top        SAE Technical Papers
                                                                                                                journals.
                                    Figure 6. A summary of publications according to the top journals.
(257 articles, 10.15%), and Journal of Power Sources (104 articles, 4.1%) are the top journals (see Figure
       According
6). Moreover,           thetotop  Scopus,
                                       journals  theare  publications
                                                               indexed incan     thebe  categorized
                                                                                     Clarivate         into four
                                                                                                Analytics          general
                                                                                                              Journal        areas,
                                                                                                                       Citation     which
                                                                                                                                 Report    are
                                                                                                                                         with
 furtherAccording
             divided          to   Scopus,        the     publications          can  be  categorized    into  four
                             into 27 major subject areas [43]. With regard to the research fields for the identifiedgeneral  areas,  which  are
upper    quartile        rankings.
  further     divided         into    27   major       subject       areas    [43]. With   regard  to the
 publications, they are categorized into a total of 21 specific areas, and these are primarily the areas ofresearch   fields for the identified
 Engineering
     25th International(67.3%),      Energy
                        Battery, Hybrid            (40.6%),
                                        and Fuel Cell             Environmental
                                                      Electric Vehicle Symposium…       Science (16.3%), Physics and Astronomy (14.7%),
                                                                                       25
 and24th
      Computer            Science
          International Battery,         (7.8%).
                                 Hybrid and Fuel Cell Electric Vehicle Symposium…      25
                                                                   Energy Policy         26
 3.1.4. Research Topic                                           Applied Energy          27
    22nd International Battery, Hybrid and Fuel Cell Electric Vehicle Symposium…           35
      Keywords represent the knowledge                                  hubs of academic studies; therefore, the analysis of keywords
                                                                 ECS Transactions           42
 can help to identify the leading                  Worldand
                                                          Electricdeveloping
                                                                   Vehicle Journal   topics in50the research field of FCEVs. A total of 3263
 keywords (author keywords) were                                  extracted
                                                         Journal of Power Sources from 2514 publications104   by using Vantage Point. The
 maturity level of those data can be SAE                    determined
                                                                  Technical Papersby analyzing the first year in which a term in the
                                                                                                                                  257 analysis
                                        International Journal of Hydrogen  Energy
 data set appears. In the case of the analysis of the authors’ keywords, two growth phases are identified                           271

                                  Figure 6. A summary of publications according to the top journals.

     According to Scopus, the publications can be categorized into four general areas, which are
further divided into 27 major subject areas [43]. With regard to the research fields for the identified
(14.7%), and Computer Science (7.8%).
3.1.4. Research Topic
Keywords represent the knowledge hubs of academic studies; therefore, the analysis of
keywords can help to identify the leading and developing topics in the research field of FCEVs. A
Sustainability 2020, 12, 2334 10 of 25
total of 3263 keywords (author keywords) were extracted from 2514 publications by using Vantage
Point. The maturity level of those data can be determined by analyzing the first year in which a term
in the analysis
(See Figure 7). The data
first set appears.
phase can be In called
the casetheofgrowth
the analysis
phase of between
the authors’
thekeywords, two growth
years 1999–2010, and the
second phase, maturity, between the years 2011–2019, can be considered as a stage ofthe
phases are identified (See Figure 7). The first phase can be called the growth phase between years
continuous
1999–2010, and the second phase, maturity, between the years 2011–2019, can be considered as a stage
downturn and growth, in which the appearance of new study terms is very important.
of continuous downturn and growth, in which the appearance of new study terms is very important.
Records Terms
284 Maturity 2007-2019
254 249
236
222 223
212 205
191 200
Growth 1999-2006 155 203 180
160 193 165
179 174 171 171
154 145
143
100 133 131 129 120
123
76
63 91
41 79
31
46 51
5 11 35 30
13
1999
2000
2001
2002
2003
2004
2005
2006
2007
2008
2009
2010
2011
2012
2013
2014
2015
2016
2017
2018
2019
Figure
Figure 7. Number
7. Number of new
of new author’skeywords
author’s keywords in
in any
any year
yearvs.
vs.the number
the of records
number of that
of records year.year.
of that
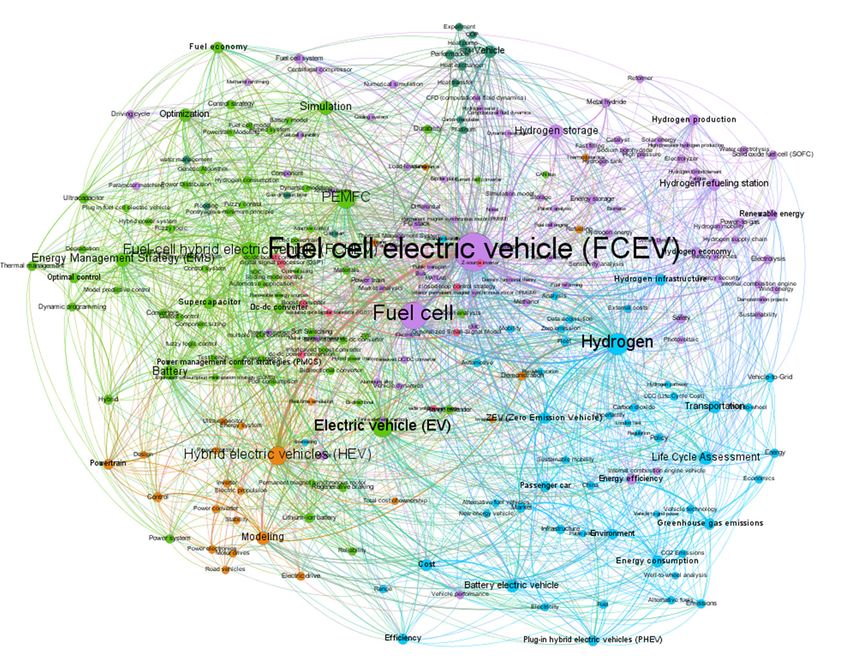
In addition,
In addition, the the co-occurrence
co-occurrence networkof
network ofauthors’
authors’ keywords
keywordsthat
thatco-occur at least
co-occur five five
at least timestimes
was was
plotted by using Gephi. The analysis was carried out using a dynamic matrix of co-occurrences,
plotted by using Gephi. The analysis was carried out using a dynamic matrix of co-occurrences, which
which made it possible to analyze the evolution of keywords in the period 1999–2019. In order to
made it possible to analyze the evolution of keywords in the period 1999–2019. In order to analyze the
analyze the current situation and to be able to deduce a future trend of the research topics, Figure 8
current situation and to be able to deduce a future trend of the research topics, Figure 8 shows the
shows the keyword networks for the 2018–2019 period. In this network, the three most important
keyword networks
clusters for three
define the the 2018–2019 period.
areas of action In thisresearch
in which network, the three
science most important
is currently clusters
working: FCEVs as define
a
the three areas of development
technological action in which research
to improve thescience is currently
environment working:
or reduce FCEVs asbatteries
GHG emissions, a technological
and
development to improve the
energy management environment
systems, or reduce
and hydrogen GHG emissions,
production batteries
and storage, with and energy
a loss management
of interest in
research related to the topic of powertrains.
systems, and hydrogen production and storage, with a loss of interest in research related to the topic
ofSustainability
powertrains. 2020, 12, x FOR PEER REVIEW 11 of 27
Figure 8. Authors’ keyword co-occurrence networks: 2018–2019 period.
Figure 8. Authors’ keyword co-occurrence networks: 2018–2019 period.
The analysis of these dynamic networks based on the author keywords with the greatest number
of co-occurrences allows us to focus on the path followed by research, and also to predict future
trends. These research topics have been ongoing for the past twenty years. However, they have
evolved until reaching their technological maturity, generating new fields of research related to theSustainability 2020, 12, 2334 11 of 25
The analysis of these dynamic networks based on the author keywords with the greatest number
of co-occurrences allows us to focus on the path followed by research, and also to predict future trends.
These research topics have been ongoing for the past twenty years. However, they have evolved until
reaching their technological maturity, generating new fields of research related to the main topics.
Mainly related to the cluster led by PEMFCs are FC hybrid vehicles, batteries, and energy management
systems (EMSs), and to the cluster led by FCEVs: Hydrogen storage/production and Solid Oxide Fuel
Cell (SOFC.) As a summary of the analysis in Figure 9, the keyword networks of the periods 1999–2010
(growth period) and 2011–2019 (maturity period) are shown.
3.1.5. Source of Knowledge
In addition, analysis was carried out to identify the five most cited articles in order to be able to
detect the origin of the knowledge (See Table 4). These articles were published between 2004–2011; these
were years of growth of the scientific development of FCEV technology. However, the results show that
China and the USA are the reference countries, and the authors of the most cited articles are affiliated
with universities and research entities, such as Harbin Institute of Technology (Wuhan University),
Institut National de la Recherche Scientifique, Énergie, Matériaux, and Télécommunications, and
Los Alamos National Laboratory. Nevertheless, only one of the most cited articles was made in
collaboration between different organizations from different countries (USA and Canada). As far
as sources are concerned, the most cited articles were published in IEEE Proceedings, which covers
technical developments in electronics, electrical and computer engineering, and computer science, and
in Energy and Environmental Science, which is related to energy conversion and storage, alternative
fuel technologies, and environmental science.Sustainability 2020, 12, 2334 12 of 25
Sustainability 2020, 12, x FOR PEER REVIEW 12 of 27
Figure 9. Authors’ keyword co-occurrence networks: Growth period (1999–2006) and Maturity period (2007–2019).
Figure 9. Authors’ keyword co-occurrence networks: Growth period (1999–2006) and Maturity period (2007–2019).
0Sustainability 2020, 12, 2334 13 of 25
Table 4. Most cited articles: Where knowledge comes from.
Times Cited Title Publication Year Authors Organizations Country Source Author Keywords
Fuel-cell electric vehicle (FCEV)
International Research
Electric machines
The state of the art of electric, Centre for Electric Vehicles, Proceedings of the
1107 2007 Chan, C.C. China Electric vehicle (EV)
hybrid, and fuel cell vehicles [5] University of Hong IEEE
Modeling
Kong/Wuhan University
Hybrid electric vehicles (HEV)
Jaouen, F. Fuel-cell performance *
Proietti, E. Institut National de la Fuel-cell vehicles *
Lefèvre, M. Recherche Scientifique, United States metal catalysis *
Recent advances in non-precious
Chenitz, R. Énergie, Matériaux and Energy and
metal catalysis for
1021 2011 Dodelet, J.-P. Télécommunications/Materials Environmental
oxygen-reduction reaction in
Wu, G. Physics and Applications Science
polymer electrolyte fuel cells [54] Cathodes *
Chung, H.T. Division, Los Alamos
National Laboratory Canada
Johnston, C.M.
Zelenay, P.
Atmospheric science: Cleaning Jacobson, M.Z. Electrolysis *
591 the air and improving health with 2005 Colella, W.G. Stanford University United States Science Hydrogen Fuel-cell vehicles*
hydrogen fuel-cell vehicles [55] Golden, D.M. Air quality *
Peng, F.Z. University of Michigan Fuel-cell electric vehicle
A new ZVS bidirectional DC–DC Li, H. Florida State University IEEE Transactions DC–DC converter
557 converter for fuel cell and battery 2004 Oak Ridge National United States on Power
Su, G.-J. Power generation
application [56] Laboratory Electronics
ZVS
Lawer, J.S. University of Tennessee
Auxiliary power supply
Wagner, F.T. Automotive applications *
Electrochemistry and the future General Motors Research Journal of Physical
532 2010 Lakshmanan, B. United States Li-ion batteries *
of the automobile [57] and Development Chemistry Letters
Mathias, M.F. Hydrogen infrastructure *
* These articles only have the Indexed Keywords registered. Times cited: Data according to the Scopus database.Sustainability 2020, 12, x FOR PEER REVIEW 16 of 27
Sustainability 2020, 12, 2334 14 of 25
19 3.2. Technological Profile in FCEVs
3.2. Technological Profile in FCEVs
20 3.2.1. General Trends
3.2.1. General Trends
21 Technological trends were analyzed by using the patent data. For this, Lens.org was used, as it
Technological trends were analyzed by using the patent data. For this, Lens.org was used, as
22 is a global patent database that includes European Patent Office (EPO), United States Patent and
it is a global patent database that includes European Patent Office (EPO), United States Patent and
23 Trademark Office (USPTO), World Intellectual Property Organization (WIPO), and Australian patent
Trademark Office (USPTO), World Intellectual Property Organization (WIPO), and Australian patent
24 data collections. The search was carried out based on patent families. A patent family (PF) is a
data collections. The search was carried out based on patent families. A patent family (PF) is a
25 collection of patent applications covering the same or similar technical content. For the period from
collection of patent applications covering the same or similar technical content. For the period from
26 1999 to 2019, a total of 1909 PFs were detected.
1999 to 2019, a total of 1909 PFs were detected.
27 First, it is interesting to answer the questions: When did the invention publication take place?
First, it is interesting to answer the questions: When did the invention publication take place?
28 Who is inventing it? Who is its beneficiary? What is the framework for commercial foresight? What
Who is inventing it? Who is its beneficiary? What is the framework for commercial foresight? What
29 other fields of technological application do these patents cover? The production of patents is low up
other fields of technological application do these patents cover? The production of patents is low up
30 until 2000, but in the period from 2001 to 2016, technological development is in constant growth (see
until 2000, but in the period from 2001 to 2016, technological development is in constant growth (see
31 Figure 10). It is to be expected that there are not many patents in the years 2018 and 2019 because the
Figure 10). It is to be expected that there are not many patents in the years 2018 and 2019 because the
32 search was made by the earliest priority year, and the patent applications are normally published 18
search was made by the earliest priority year, and the patent applications are normally published 18
33 months after the date of filing or the earliest priority date, so patents filed in 2018 and 2019 may not
months after the date of filing or the earliest priority date, so patents filed in 2018 and 2019 may not
34 have been published yet.
have been published yet.
212 211
178
167
154 155 156
139 140
121 118 112
99 95 95 90
85
66
13 9
1
1999
2000
2001
2002
2003
2004
2005
2006
2007
2008
2009
2010
2011
2012
2013
2014
2015
2016
2017
2018
2019
35
36 Figure
Figure10.
10.The
Thenumber
numberofoffuel-cell
fuel-cellelectric
electricvehicle
vehicle(FCEV)
(FCEV)patent
patentfamilies
familiesby
bypublication
publicationyear.
year.
37 3.2.2.Inventive
3.2.2. InventivePerformance:
Performance:Inventors,
Inventors,Applicants,
Applicants,and
andCountries
Countries
38 InInorder
ordertotoreflect
reflectinventive
inventiveperformance,
performance,the
thetop
topinventors
inventorsare
arefrom
fromSouth
SouthKorea,
Korea,Japan,
Japan,and
andthe
the
39 USA,and
USA, andtheir
theirmain
mainapplicants
applicantsare
areautomotive
automotivecompanies
companies(See
(SeeTable
Table5).
5).
Table 5. Who is inventing?
40 Table 5. Who is inventing?
Number
Number of of Patent
Patent Family
Family (PFs)
(PFs) Inventors
Inventors Main
MainApplicants
Applicants
3737 KWONSANG
KWON SANGUKUK Hyundai
Hyundai Motor
Motor CoCo
LTDLTD
3535 TABATA
TABATAATSUSHI
ATSUSHI Toyota Motor
Toyota Corp.
Motor Corp.
3333 BORRONI-BIRD
BORRONI-BIRDCHRISTOPHER
CHRISTOPHEREE General Motors
General Corp.
Motors Corp.
3333 VITALE
VITALEROBERT
ROBERTLOUIS
LOUIS General Motors
General Corp.
Motors Corp.
3333 HIBIKI
HIBIKISAEKI
SAEKI Honda
HondaMotor CoCo
Motor LTDLTD
3232 CHERNOFF
CHERNOFFADRIAN
ADRIANBB General Motors
General Corp.
Motors Corp.
32 SHABANA MOHSEN D General Motors Corp.
32 SHABANA MOHSEN D General Motors Corp.
27 KENJI UMAYAHARA Toyota Motor Corp.
27 KENJI UMAYAHARA Toyota Motor Corp.
25 KOTA MANABE Toyota Motor Corp.
2519 KOTA MANABE
WALTER MARKUS Toyota Motor
Daimler AG Corp.
1918 WALTER
KERETLI MARKUS
FAHRI Daimler
Renault SAAG
18 KERETLI FAHRI Renault SAYou can also read