Driving the clean energy transition - February 2021 - MBB SE

Page created by Edith Perez
 
CONTINUE READING
Driving the clean energy transition - February 2021 - MBB SE
Driving the clean energy transition.

February 2021
Driving the clean energy transition - February 2021 - MBB SE
Disclaimer

The following presentation, including any printed or electronic copy of these slides, the talks given by the presenters, the information communicated during any delivery of the presentation and any question
and answer session and any document or material distributed at or in connection with the presentation (together, the “Presentation”), has been prepared by Friedrich Vorwerk Group SE (the “Company”) is
not an offer to sell any securities or an invitation to purchase securities or the solicitation of an offer to buy securities. This Presentation is not an advertisement and not a prospectus for the purposes of
Regulation (EU) 2017/1129 of the European Parliament and of the Council of June 14, 2017, as amended.

The Presentation is provided for general information only and does not purport to contain all the information that may be required to evaluate the Company or the Company's shareholder, MBB SE. The
information in the Presentation is subject to updating, completion, revision and verification.

No reliance may be placed for any purpose whatsoever on the information or opinions contained or expressed in the Presentation or on the accuracy, completeness or fairness of such information and
opinions. To the extent permitted by law and regulation, no undertaking, representation or warranty or other assurance, express or implied, is made or given by or on behalf of the Company, MBB SE, or any
of their respective parent or subsidiary undertakings or the subsidiary undertakings of any such parent undertakings or any of their respective directors, officers, partners, employees, agents, affiliates,
representatives or advisers, or any other person, as to the accuracy, completeness or fairness of the information or opinions contained in the Presentation.

None of the Company or MBB SE, their respective affiliates and advisers, agents and/or any other party undertakes or is under any duty to update the Presentation or to correct any inaccuracies in any such
information which may become apparent or to provide you with any additional information. Save in the case of fraud, no responsibility or liability is accepted by any such person for any errors, omissions or
inaccuracies in such information or opinions or for any loss, cost or damage suffered or incurred, however arising, directly or indirectly, from any use of, as a result of the reliance on, or otherwise in
connection with, the Presentation. In addition, no duty of care or otherwise is owed by any such person to recipients of the Presentation or any other person in relation to the Presentation.

The Information contains financial information of the Company, including its consolidated subsidiaries, for the fiscal years 2018, 2019 and 2020 based on IFRS, unless noted otherwise. The financial information
of the Company for the fiscal year 2018 was audited in connection with the audit of the financial information of the Company for the fiscal year 2019 and is included therein as comparative financial
information.

The Information contains certain financial measures (including forward-looking measures) that are not calculated in accordance with IFRS and are therefore considered “non-IFRS financial measures”. Such
non-IFRS financial measures used by the Company are presented to enhance an understanding of the Company’s results of operations, financial position or cash flows calculated in accordance with IFRS, but
not to replace such financial information. A number of these non-IFRS financial measures are also commonly used by securities analysts, credit rating agencies and investors to evaluate and compare the
periodic and future operating performance and value of other companies with which the Company competes. These non-IFRS financial measures should not be considered in isolation as a measure of
assessment of the Company’s profitability or liquidity, and should be considered in addition to, rather than as a substitute for, net income and the other income or cash flow data prepared in accordance with
IFRS. In particular, there are material limitations associated with the use of non-IFRS financial measures, including the limitations inherent in determination of each of the relevant adjustments. The non-IFRS
financial measures used by the Company may differ from, and not be comparable to, similarly-titled measures used by other companies. Certain numerical data, financial information and market data
(including percentages) in the Information have been rounded according to established commercial standards. Furthermore, in tables and charts, these rounded figures may not add up exactly to the totals
contained in the respective tables and charts. In light of these risks, uncertainties and assumptions, the events in the forward-looking measures may not occur or the Company’s actual results, performance or
achievements might be materially different from the expected results, performance or achievements expressed or implied by such forward-looking measures. None of the Company or any of their respective
directors, officers, employees, agents, affiliates or advisers or any other party undertakes or is under any duty to review, update or confirm expectations or estimates or to publicly update or revise any such
forward-looking statements, except to the extent required by applicable law.

                                                                                                                                                                                                                    1
Driving the clean energy transition - February 2021 - MBB SE
Disclaimer

The Presentation includes statements that are, or may be deemed to be, forward-looking statements. The words “believes”, “expects”, “may”, “will”, “could”, “should”, “shall”, “risk”, “intends”, “estimates”,
“aims”, “plans”, “predicts”, “continues”, “assumes”, “positioned” or “anticipates” and similar expressions (or their negative) identify certain of these forward-looking statements. These statements are based on
the current views, expectations and assumptions of the management of the Company and involve known and unknown risks and uncertainties that could cause actual results, performance or events to differ
materially from those expressed or implied in such statements. Actual results, performance or events may differ materially from those described in such statements due to, among other things, changes in the
general economic and competitive environment, risks associated with capital markets, currency exchange rate fluctuations and competition from other companies, changes in international and national laws
and regulations, in particular with respect to tax laws and regulations, affecting the Company and other factors. The Company does not assume any obligations to update any forward- looking statements.
The Presentation includes statistics, data and other information relating to markets, market sizes, market shares, market positions and other industry data pertaining to the Company's business and markets.
Unless otherwise indicated, such information is based on analysis by the Company of multiple sources, including certain studies commissioned from third parties (the “Market Reports”). The Market Reports
may include and be based on, amongst other things, information obtained from primary interviews and field visits conducted by third parties with industry experts and participants, third parties’ secondary
market research and internal financial and operational information supplied by, or on behalf of, the Company, as well as information obtained from (i) data providers; (ii) industry associations and country
organisations; and (iii) publicly available information from other sources, such as information publicly released by the Company’s competitors. To the extent available, the industry, market and competitive
position data contained in the Presentation has come from official or third-party sources. Third-party industry publications, studies and surveys generally state that the data contained in them have been
obtained from sources believed to be reliable, but that there is no guarantee of the accuracy or completeness of such data. While the Company believes that each of these publications, studies and surveys
has been prepared by a reputable source, the Company has not independently verified the data contained therein. In addition, certain of the industry, market and competitive position data contained in the
Presentation come from the Company’s own internal research and estimates based on the knowledge and experience of the Company’s management in the markets in which the Company operates. While
the Company believes that such research and estimates are reasonable and reliable, they, and their underlying methodology and assumptions, have not been verified by any independent source for accuracy
or completeness and are subject to change without notice. Accordingly, undue reliance should not be placed on any of the industry, market or competitive position data contained in the Presentation. All
projections, valuations and statistical analyses are provided to assist the recipient in the evaluation of the matters described in the Presentation. They may be based on subjective assessments and
assumptions and may use one among alternative methodologies that produce different results and, to the extent that they are based on historical information, they should not be relied upon as an accurate
prediction of future performance.

The distribution of this Presentation in certain jurisdictions is restricted by law. Therefore, it must not be distributed, published or reproduced (in whole or in part) or disclosed by its recipients to any other
person for any purpose, other than with the consent of the Company. All trademarks remain the property of their respective owners. By accepting receipt of, attending any delivery of, or electronically
accessing, the Presentation, you agree to be bound by the above limitations and conditions and, in particular, you represent, warrant and undertake to the Company that: (i) you will not forward the
Presentation to any other person or reproduce or publish this document, in whole or in part, for any purpose; and (ii) you have read and agree to comply with the contents of this notice.

                                                                                                                                                                                                                        2
Driving the clean energy transition - February 2021 - MBB SE
Introduction

               3
Driving the clean energy transition - February 2021 - MBB SE
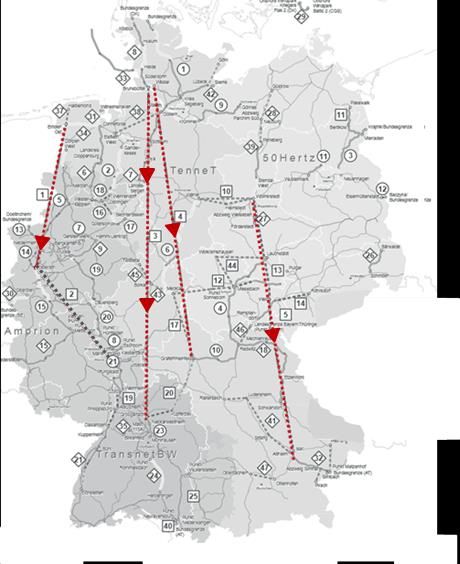
VORWERK is driving the clean energy transition

                                                 4
Driving the clean energy transition - February 2021 - MBB SE
Clean energy transition requires significant energy infrastructure investments

       Planned energy infrastructure investments1                                                                Key catalysts

                                                                                                                 Natural gas grid expansion
                                                                                                                 Expansion of natural gas infrastructure
                                                                                                                 to compensate for coal and nuclear phase-out

                                                                                                                 Electricity highways
                                                                                                                 Realization of electricity highways to enable
                                                                                                                 distribution of renewable wind and solar energy
                                                                            Hydrogen                             from the point of production to consumers

                                                                              Electricity                        Green hydrogen ramp-up
                                                                                                                 The only long-term clean molecule that can
                                                                           Natural gas                           replace the fossil molecule fuels needed in
                                                                                                                 industry, mobility and heating

         2015                            2030                                          2050

1) Schematic representation                                                                                                                                        5
Source: Management estimate based on Network Development Plan (NDP) Gas and electricity, Fraunhofer Institute;
Driving the clean energy transition - February 2021 - MBB SE
VORWERK plans, realizes and operates the energy infrastructure of the future

                              In highly attractive markets                        With success

                                                 Hydrogen              €291m                >1,300
                                                               H2     revenue              employees

                                 Electricity

                            Gas
                                                                        16%                   >15%
                since 1962
                                                                    EBIT margin           organic CAGR

                                                                                                         6
Notes: Management estimate for 2020; CAGR based on 2014-2020
Driving the clean energy transition - February 2021 - MBB SE
VORWERK offers critical solutions to transform and transport energy

         Production/
                                          Transformation/ transportation                       Consumer
           import

                                                     Compressor  Storage &  Gas pressure
                         LNG          Pipelines
                       Terminals                       station  measurement regulating &
                                                                           metering stations

                        Landfall

                                      Underground     Transformer    Power-
                                         cable          stations     to-heat

                               H2             H2           H2                         H2

                                                                         H2

                           Electrolysis    Storage     Compressor     Pipelines Gas pressure
                                                         station                regulating &
                                                                                  metering
                                                                                  stations

             H   VORWERK solutions

                                                                                                          7
Driving the clean energy transition - February 2021 - MBB SE
VORWERK in the midst of the universe of innovative energy players

   Energy                                                           Energy Transformation
   Grids

   Operation &
   Service                                                                      Hydrogen

                                                                                            8
Driving the clean energy transition - February 2021 - MBB SE
VORWERK benefits from sustainable market entry barriers

   Customers & References                                         Turnkey competence

                                                                       Energy grids

                                                             Energy transformation

                                                               Service & Operation

                                                    Intelligent Infrastructure Mgmt.

   Regulation & accreditation                                   Technology & Patents

                      G 468-1                           OrQa® flow metering HDD drilling
                                                            Cathodic corrosion protection
                                                        Carbon capture     Heat management
                                                        Knock-out drums       Gas analysis
                                                                          Heat exchangers
                                                                       + many more

                                                                                             9
Best-in-class governance through an experienced supervisory board

    Dr Christof Nesemeier                     Heike von der Heyden                        Dr Julian Deutz

    Chairman of the supervisory board         Member of the supervisory board             Member of the supervisory board

    CEO & Member of the Board at MBB SE       Head of M&A at Green City AG                Chief Financial Officer at Axel Springer SE

    Decades-long track-record in developing   10+ years of international experience in    Decades-long experience in finance & controlling
    successful German Mittelstand             M&A with a strong focus on driving          and strategy with a focus on realizing value
    companies                                 sustainability in the German Mittelstand    through innovation and digitalisation

    PhD University St Gallen                  Diploma in Business University of Munster   PhD with focus on banking & finance

    Born in 1965                              Born in 1966                                Born in 1968

                                                                                                                                             10
Key Investment Highlights

            Climate change commands billions in infrastructure investments in
            VORWERK core end markets gas, electricity and hydrogen

            50+ years of technology leadership in design, realization and operation of
            system critical energy infrastructure

            Key player in ramping up the European hydrogen infrastructure thanks
            to a unique combination of know-how and decade-long customer relations

            Double-digit revenue growth with a stable >16% EBIT margin as
            an ideal starting point for exponential growth potential ahead

            Owner-managed business with an ambitious strategy to further
            accelerate profitable growth

                                                                                         11
Business model & technologies

                                12
Full turnkey competence across all core end-markets from one source

                                                             H
                                                                        Adjacent
                            Natural gas    Electricity    Hydrogen    opportunities

  Planning & Design

  Energy grids

  Energy transformation

  Service & Operation

                                                                                      13
Planning & engineering complex energy grids and transformation systems

                              Metaplanning                • Route planning                   • Parameter & material selection
                                                          • Feasibility & geological         • Cost optimisation based on
                                                            analysis                           route and material choices

                              Approval                    • Specific route &                 • Rights of way & land
                                                            approval planning                  acquisitions
  Planning & Design           planning

                              Plant technical design • Customer-specific technical           • 3D plant visualization
                                                       design (flow diagram)
                              & process                                                      • Safety & emergency
  Energy grids                engineering            • Detailed process engineering            scenario analysis

                              Grid infrastructure         • Airborne laser scanning & GPS    • Curve angle calculation and
                                                                                               validation
                              engineering                 • Detail planning of grid layout
                                                          • Pipeline strength & safety       • Precise cable route
  Energy transformation                                     coefficient                        engineering

                              Intelligent                 • Electronic layout                • Emergency Shutdown
                                                                                               Systems (ESD)
                              infrastructure              • Cyber security design
                              management                                                     • Gas analysis & chromatography
                                                          • Digital Control Systems (DCS)
  Service & Operation

                            Deep-dive on following page
                                                                                                                                14
VORWERK leverages state-of-the-art digital planning and engineering tools

VORWERK competence in Grid Infrastructure & Plant Engineering

                                                                            15
Intelligent Infrastructure Management is the brain of VORWERK‘s integrated offering

Intelligent Infrastructure Management

                                      Intelligent
                                    Infrastructure
                                    Management

      Electrical & Automation Engineering            Digital Control System (DCS)
      Emergency Shutdown System (ESD)                Gas analysis & chromatography
      Flow metering (OrQa®)                          Safety engineering (HASOP, SIL)

                                                                                       16
Realizing critical energy grids through specialized technologies

                                Specialized          • Specialized welding for safe           • Sophisticated, manual tie-in
                                                       and reliable energy grids                welding
                                welding technologies
                                                            • Hot tapping                     • Specialized non-destructive
                                                                                                examination techniques

                                Grid inspection &           • Stress pressure & integrity     • Calibre tests by intelligent
                                                              testing                           pig robots
  Planning & Design             preparation
                                                                                              • Grid dehumidification

                                Horizontal                  • Preservation of sensitive nature • Patented relief shaft procedure
                                directional drilling                                             (C&P technology)
                                                            • Proprietary near-surface
  Energy grids                  (HDD)                         drilling technologies            • Patented in-pipe drilling
                                                                                                 (HCD technology)

                                Cable pull, handling, • Insertion technology into             • Stress-free laying of high-
                                logistics & installation protection pipe systems                weight cable lines
  Energy transformation

                                Landfall connections        • Underground transition          • Soil remediation & re-plantation
                                & renaturation                joints in coastal areas
                                                                                              • Proprietary Horizontal Casing
                                                            • Landfall installation             Drilling (HCD) patent
  Service & Operation                                       • Mud flats procedures

                              Deep-dive on following page
                                                                                                                                   17
HDD drilling technologies for optimised efficiency and low ecological impact

Horizontal Directional Drilling (HDD)

              Cable & Pipe (C&P) technology                     Horizontal Casing Drilling (HCD)

     Specialized near-surface drilling technology to     inserts a protective plastic tube simultaneously to
     puncture the borehole and control pressure of       the drilling process
     the drilling fluid to maintain borehole stability

                                                                                                               18
Delivering complex energy transformation systems based on best-in-class engineering

                              Plant                       • Process engineering, material         • Welding certification through
                                                            and welding expertise                   ultrasonic & x-ray testing
                              engineering

  Planning & Design                                       • Innovative heat exchangers,           • Own state-of-the-art
                              Proprietary plant             dust-liquidity separators, flow         production facilities with strong
                              components                    meters, etc.                            innovation capabilities

  Energy grids                Turnkey energy
                              transformation
                              systems                       Gas pressure regulation   Compressor stations       LNG terminals
                                                            systems

  Energy transformation
                                                            Gas & hydrogen storage    Gas metering stations     Transformer stations

  Service & Operation
                                                            Electrolyzers             Gas processing systems    Biogas plants

                            Deep-dive on following page
                                                                                                                                        19
Tailored heat exchanger solutions for specialised applications in energy transformation

     1/2
Proprietary heat exchangers

                     • Enables efficient and safe controlling and regulating temperature changes during
                       gas pressure regulation

                     • Used in: Gas regulating, compressor, storage, LNG & electrolyzer systems to
                       protect the ensuing system (e.g. freeze-in of components)

Proprietary dust liquidity separators
                     • Prevents corrosion/ damage to plant components through specialized knock-out
                       drums incl. special cyclone tubes & inlet filters

                     • Versatile aerodynamic gas flow technology with high reliability and safety

                     • Used in: Gas pressure regulating, storage, compressor, electrolyzer & other plant
                       systems

                                                                                                           20
Cutting-edge gas processing & measurement for precise and reliable operation

    2/2
Proprietary vortex tubes
                     • Enables CO2-neutral gas warming

                     • Based on thermodynamic process with four tangential gas feed-ins to
                       separate warm from the cold gas streams

                     • No gas volume losses as no gas combustion is required

                     • Used in: Gas pressure regulating, storage and other systems

Proprietary flow-metering devices (OrQa)
                     • Enables precise legally calibrated gas volume metering
                     • Manufactured from one seamless piece without moving external parts
                     • Requires no/ low maintenance & recalibration
                     • Used in: Gas pressure regulating, storage, compressor, electrolyzer & other plant
                       systems

                                                                                                           21
Ensuring reliability through our extensive service, maintenance & operation offering

                               Commissioning &       • Gassing of natural gas &          • Works & repairs on pressurised
                                                       hydrogen pipelines                  systems
                               expansion
                                                     • Hot tapping procedures            • Inductive preheating for welding
                                                                                           works on pipes in use

                               Cathodic corrosion    • Electrical engineering and        • Gas detection & inspection
  Planning & Design                                    cathodic corrosion protection
                               protection,
                               inspection & repair   • Calibration and function checks
                                                       of telecontrol engineering

  Energy grids                 Energy                • Recalibration of sensors & data   • Functional and electrical checks
                                                       collection components and
                               transformation          flow-metering systems
                               services

  Energy transformation                              • Operational management of         • Reporting & documentation
                               Infrastructure
                                                       gas-based plants and network
                               Operations              infrastructure                    • Standby services

                                                     • Constant remote monitoring

  Service & Operation

                                                                                                                              22
VORWERK focuses on high value-added proprietary solutions

  VORWERK          High value-added products & components
  value-add        (e.g. heat exchangers, flow meters)

                   Proprietary technologies (e.g. HD drilling,
                   CCP, special welding)

                   Engineering services (Process engineering,
                   electrical and mechanical engineering CAD)

                   Intelligent infrastructure management

                   Project management

  Purchased        Cable and pipeline raw materials
  externally
                   Low value-added services (e.g. building
                   construction, demolition, concrete works)

                   Non-differentiated high-volume plant
                   components (e.g. valves, tubes, switches)

                                                                 23
Our natural gas opportunity

                              24
Natural gas has gained significant momentum on European and German level

Total natural gas consumption
in PJ, blue bubbles show share of natural gas in total primary energy consumption

                                       18%                    24%                   15%     25%

                                                             16,680

                                     12,435

                                                                                            3,193

                                                                                    2,293

                                       1990                   2017                  1990    2019

                                                           -28

 Note: PJ = Petajoule = 1015 Joule                                                                  25
 Source: European Energy Agency, BMWi Energiedaten Gesamtausgabe
Industry and buildings sectors are currently largest gas consumers

                    +9%
                    vs. 2014      Industry                                                                          +11%
                                                                                             District heat          vs. 2014

               Industrial sector, e.g. Steel and iron                                              District heating systems
               manufacturing, Chemicals
                                                                                            Switch from individual heating
               Continued demand for natural gas         39%
                                                                                     solutions to centralised more efficient
               as energy, e.g. for process steam                     7%                       district heating systems (esp.
               generation or in high temperature                                        Combined Heat and Power plants)
               furnaces                                                   2%
               Use of natural gas as feedstock in
               the basic chemicals sector
                                                                               12%
                                                              2018
                                                                                                                   +48%
                                                                                     Power generation               vs. 2014

               +7%
               vs. 2014        Buildings                                             Power generation in gas-fired
                                                                                     power plants
            Residential and commercial (trade,                                       Switch from coal- to gas-fired power
            commerce & services) buildings
                                                              40%
                                                                                     plants due to coal/nuclear phase-out

            Natural gas most widely used fuel in                                     Installation of gas-fired power plants as
            Germany to heat residential and                                          flexible back-up solution next to
            commercial buildings                                                     renewables

                                                                                                                                 26
Source: BDEW Gaszahlen 2019
The nuclear and coal phase-out calls for rapid changes in the German energy sector

Lignite, coal and nuclear exit
Structure of the controllable power today vs 2038

No. of nuclear
                                    8                     0                 0
power plants

                                43 GW

                                                      30 GW

                                                                          17 GW

                                                                                  0 GW
                                  2017                 2022               2030    2038

                                                           Lignite         Coal

                                                                                         27
Source: Deutscher Gewerkschaftsbund, abc news, Energy Live News, Forbes
Gas-fired power plants represent the only viable complement to renewables

             CO2 footprint in electricity generation
             in g CO2/kWh

                                                           -67%                              Highly flexible due to short ramp-up time
                                 1,148

                                                                                             High level of operational efficiency
                                                             847

                                                                                             Independent of extreme weather conditions

                                                                                  382
                                                                                             Suited for back-up due to high storability

                                                                                             Dense transport and storage infrastructure
                               Lignite                      Coal               Natural gas

                                                                                                                                          28
Source: Zukunft Erdgas Report 2019; Wuppertal Institut, DIW Berlin, EcoLogic
Investments in the transmission grid have seen continuous increases since 2012

Historical investments in the German natural gas network                    Network development plan (NDP)
 in €bn; based on network development plan

                                                                            • Developed and published every 1.5-2
                                                                              years to outline the grid expansion plan
                                                                   8.9        for the gas transmission network

                                                                            • Contains all network expansion and
                                                        7.3
                                                                              upgrade measures incl. investment
                                                                              volumes over 10-year horizon

                                                                            • Drafted on the basis of various scenario
                                               4.5                            frameworks concerning the natural gas
                                                                              demand going forward

                            2.8
                                                                            • Based on iterative process involving
       2.2
                                                                              several consultation rounds with the
                                                                              public and experts

                                                                            • Disclosure of projects and expected
                                                                              costs in the NDP provide high revenue
  NDP 2012             NDP 2014            NDP 2016   NDP 2018   NDP 2020
                                                                              visibility and certainty of execution

                                                                                                                         29
Source: NDP Gas Database (NEP-Gas-Datenbank)
Investments in the German gas transmission grid of >€5bn over the next 5 years

Planned investments in the German natural gas infrastructure
in €bn

                                                                              Planned start
                                                                    €1.0bn    of operation
                                                                              2026+

                                                            €8.9                                   NDPs typically with high
                                                                                                   visibility over 4-6 years
                                                             bn               Planned start
                                                                    €5.2bn                          – projects in years 6+
                                                                              of operation
                                                                              up to 2026           determined in next NDP
                                                                                                              cycle

                                                                              Under construction
                                                                    €2.7bn

                         Transmission pipelines                    NDP 2020
                         Pipelines not in operation
                         Compressor not in operation
                         Storage connections abroad
                         Storage on transmission networks

                                                                                                                               30
Source: : NDP Gas Database (NEP-Gas-Datenbank)
VORWERK covers all critical components of the gas transmission grid

 LNG terminals                              Compressor stations
                                                                            Valves                                       Intelligent infrastructure
 Dedicated port terminals                   ensure gas remains                                                           management
 to enable large liquefied                  pressurized during              act as „gateways“ placed
 natural gas (LNG) carrier                  transportation. Distances       at 8-30 km spacings and                      monitors and controls gas flows
 ships to load, carry and                   between stations vary           enable safe daily                            end-to-end from injection to
 unload LNG for or after                    depending on systems            operations &                                 end-users using smart
 long-distance transport                    design.                         maintenance works                            infrastructure solutions

                                                   Gas storage solutions

                                                   Enable long-term                                    Gas pressure regulation &
                                                   storage across seasons                              metering stations
                   Transmission grid
                                                                                                       placed at transit and exit
                   transports gas from
                                                                                                       stations to reduce pressure
                   injection points to
                                                                                                       levels and feed gas through to
                   customers via large-
                                                                                                       end-use systems via distribution
                   diameter high pressure
                                                                                                       network
                   steel pipes
                                                                                                       Gas meters allow TSOs to
                                                                                                       monitor, manage and account
                                                                                                       for gas in their pipelines

                                                                                                                                                           31
VORWERK has a unique track-record and is set to benefit from strong projects pipeline
from NDP as well as additional investment opportunities

        Network development plan                                                                  Additional market opportunities

                                                                                                                   • Large industrial gas
                                                                                                   Single energy
                                                                                                                     consumers
                                                                                                   consumers
                                                                                                                   • Dedicated on-site
                                                                                                                     power plants

                                                                                                                   • Pipeline rerouting
                                                                                                   Grid

                           €5.2                                                      ~€5           upgrades        • Parts replacement
                                                                                                                   • Upgrades
                                bn                                                       bn
                            until 2026                                               until 2026
                                                                                                                   • International or cross-
                                                                                                  International
                                                                                                                     border projects not
                                                                                                  projects
                                                                                                                     covered by German NDP

                       ~35%
                   share of NDP projects                                                                           •   Inspections
                                                                                                   Service &
                      2012-2018 with                                                                               •   Function checks
                  VORWERK participation1                                                           Maintenance
                                                                                                                   •   Route maintenance
                                                                                                                   •   24/7 standby services

1) Based on all projects contained in gas network development plans 2012-2018 >€2m                                                             32
Source: NDP 2012-2018, NDP 2020-30 Gas (Draft); Company data
With the Closed Loop pigsar calibration facility VORWERK set the standard for gas meters

Case study:                                                        Technology highlights
Closed Loop pigsar (CLP) calibration facility for gas meters

                                                                   • World’s leading high-pressure
                                                                     gas meter test facility located in
                                                                     Dorsten, Germany
                                                                   • Home to the national standard
                                                                     for high-pressure natural gas
                                                                     measurement
                                                                   • Used for testing volumetric
                                                                     and mass flow meters for
                                           2                         natural gas transmission and
                                                                     trading
                                               1
                                                           4
                                                                    1   Proprietary heat exchangers

                                           7                       2    High-pressure blower
                                                       3

                                                               5   3    Test piece measuring station

                                                   6
                                                                   4    PTB measuring station1

                                                                   5    Transducer

 Customer:                                                         6    Emptying and filling compressors

                                                                    7   Measuring station

1) Physikalisch-Technische Bundesanstalt                                                                   33
Source: Management estimates
VORWERK‘s project for Ineos Phenol showcases our end-to-end turnkey competence

Case study:                                                       Technology highlights
Ineos Phenol turnkey project Gladbeck

                                                                  • Full turnkey project including
                                                                    energy grid, transformation and
                                                                    recurring operation & service

                                                                  • Connection of on-site gas-fired
                                                                    power plant to transmission grid

                                                    3               Metering station at connection
                                        1                     1
           Gladbeck                                                 point to OGE transmission grid

                                            2
                                                                    Dedicated 1.3 km gas pipeline
                                                              2     on client property (incl. CCP)

                                                                    Gas pressure regulating and
                                                              3     metering station at connection to
                                                                    gas-fired power plant

                                                                    Operational management of
                                                              4
                                                4       5           complete on-site gas system

 Customer:
                                                                    Recurring service &
                                                              5
                                                                    maintenance contract

                                                                                                        34
Source: Management estimates
VORWERK maintains and operates the largest part of the gas network in Eastern Germany

Case study:                                                                                        Technology highlights
Ontras service & operation contract for East German gas transmission grid

                                                                                                   • 10-year service, maintenance
                                                                                                     and operation contract with
                                                                                                     Ontras

                                                                                                   • Full range of maintenance and
                                                                                                     operations services associated
                                                                                                     with running a transmission grid

                                                                                                       Electrotechnical installations

                                                 Intelligent pig                                       Control of galvanic anode systems

                                                                                                       Plant maintenance and inspection

                                                                                                       Revision/ repair of CCP systems
                                                                   Cathodic corrosion protection
                                                                   (CCP) system                        Remote monitoring

 Customer:
                                                                                                       24/7 standby services

                                                                                                                                           35
Source: Management estimates
Our electricity opportunity

                              36
The energy transition requires large-scale electrification

             Final energy                                                    Final energy
                                                   Clean Energy Transition
             consumption                                                     consumption
                 2020                                                           2035+

              Molecular
               fuels
                                                                               Clean
                                                                              molecules

                                          Fuel switch

                                                                             Low-carbon
                                                                              electricity

              Electricity
                                          Electrification

                                                                                            37
The power sector is the key to decarbonizing the economy

          Electrical heat pumps                                     E-mobility

         Residential buildings                                      Passenger vehicles

         Commercial buildings                                       Light Commercial vehicles

                                                                    Other light vehicles

        Industrial energy

        Low to medium
        temperature heat
        (100-400°C)

                                  Power-to-heat      Electrolysis
                                                                                                38
Significantly increased demand for electricity across sectors

Gross electricity demand in Germany
TWh

                                                                                                 748

                                                                                                 117    Others
                                                                         595
                                                                                                  55    Electrolysis
                                                                          85             +157%
                                                                                                  75    Transport
                                                                          11

                                                                         213                     230    Buildings

                                                                         286                     271    Industrials

                                                                        2018                     2030

                                                                                                                       39
Source: Handelsblatt, Energiewissenschaftliches Institut an der Universität Köln (EWI)
To enable decarbonization, electrification is becoming increasingly carbon-neutral

Share of renewable energy in total electricity generation

                                                                                                 65%

                                                                  42%
                                                                   2%
                                                                  4%

                                                                  7%

                                                                  8%
                                                 19%

                               8%                                 20%
              5%
                                                                                      0%
              1990            2000               2010             2019                          2030
                                                                                                Target
                        Hydro power   PV solar      Biofuels   On and offshore wind    Others

                                                                                                         40
Source: IEA
In Germany, energy generation and consumption are becoming increasingly disparate

  Germany Wind Energy Production by State                                                                                               Germany Electricity Consumption by State
  in MW                                                                                                                                 in million kWh

                                                         Baltic Sea                                                       High    Low
               North Sea                                   1,076
                6,440

                                          Schleswig-                                                                                                                                         Schleswig-
                                           Holstein           Mecklenburg-                                                                                                                    Holstein            Mecklenburg-
                                            6,996             Vorpommern                                                                                                                       14,437             Vorpommern
                                                                 3,473                                                                                                                                               6,567
                                           Hamburg                                                                                                                            Bremen          Hamburg
                           Bremen            128                        Berlin                                                                                                                 13,922                     Berlin
                                                                                                                                                                               5,312
                             198                                         12                                                                                                                                               14,115
                                            Lower                                                                                                                                                 Lower
                                            Saxony                                                                                                                                                Saxony

                                                                                                Wind energy production
                                                                      Brandenburg

                                                                                                                                         Electricity Consumption
                                            11,325      Saxony                                                                                                                                    55,998   Saxony         Brandenburg
                                                         Anhalt          7,320
                     North rhine-                                                                                                                                                                           Anhalt           21,410
                     westphalia                          5,193                                                                                                            North rhine-                      20,737
                        5,920                                                                                                                                             westphalia
                                                                       Saxony                                                                                               143,710                                       Saxony
                                                  Thuringia             1,267                                                                                                                         Thuringia           26,085
                                    Hesse           1,613                                                                                                                                Hesse
                                    2,217                                                                                                                                                               15,306
                                                                                                                                                                                         37,485
                  Rhineland
                  Palatinate                                                                                                                                           Rhineland
                    3,685                                                                                                                                              Palatinate
                                                                                                                                                                        29,056

            Saarland                                      Bavaria
                                                                                                                                                                   Saarland                                  Bavaria
              483                                          2,531
                                 Baden-                                                                                                                             9,057                                    86,694
                                                                                                                                                                                      Baden-
                               Württemberg
                                                                                                                                                                                    Württemberg
                                  1,550
                                                                                                                                                                                      72,167

                                                                                                                         Low     High

Consumption data for Berlin, Brandenburg, Saxony-Anhalt and Thuringia 2016, for Saarland 2015 – for the remaining states 2017                                                                                                           41
Source: Handelsblatt, Agentur fuer Erneuerbare Energien
To enhance transmission capacity, Germany is realizing four major electricity highways

           1      A Nord                                                                                          2   3      Suedlink
        Route: Emden Ost (Lower Saxony) to Osterath                                                                   ROUTE 2
        (North Rhine Westphalia)
        Length: approx. 300 km                                                                                        Route: Brunsbüttel (Schleswig-Holstein) to
                                                                                                                      Großgartach (Baden-Wuerttemberg)
        Capacity: 2 GW                                                                                                Length: approx. 684 km
        Operator:                                                                                                     Capacity: 2 GW
                                                                                    1                                 Operators:
        Planned start of operation: 2025
                                                                                                                      Planned start of operation: 2026
        Investment volume: €2bn
                                                                                                              4
                                                                                                                      Investment volume : €5bn*
                                                                                                       3

          4      Suedostlink
                                                                                                  2                   ROUTE 3
        Route: Wolmirstedt (Saxony-Anhalt)
        to Isar (Bavaria)                                                                                             Route: Wilster (Schleswig-Holstein) to
                                                                                                                      Bergrheinfeld West (Baden-Wuerttemberg)
        Length: approx. 539 km
                                                                                                                      Length: approx. 532 km
        Capacity: 2 GW                                                                                                Capacity: 2 GW
        Operators:                                                                                                    Operators:

        Planned start of operation: 2025                                                                              Planned start of operation: 2026

        Investment volume: €5bn                                                                                       Investment volume : €5bn*

1) Assuming equal distribution of total investment volume of €10bn among both routes of Suedlink project                                                           42
Source: TransnetBW Website; Federal Network Agency; Amprion Website, Kurier, EW online, A-Nord, PV Magazine
To promote public acceptance of DC projects, underground cabling is required by law

                                                                  3-10x
                                                                 higher costs
                                                           compared to overland lines

                                                             +€3-8bn
                                                              additional investments
                                                           for major electricity projects
                                                           due to underground cabling

                                                                                            43
Source: en:former; BMWi
VORWERK is prequalified for all major high-voltage DC projects

                                                                          A-Nord                           Suedlink
                                                                                                           Route 2

                                                                            €2bn
                                                                                                           €5bn1

                                                                       Suedostlink                         Suedlink
                                                                                                           Route 3
                                                                           €5bn                            €5bn1

1) Assuming equal distribution of total investment volume of €10bn among both routes of Suedlink project              44
Source: en:former; BMWi
Investments in the transmission grid have increased continuously

Investments in the German electricity network                                                        Network development plan (NDP)
in €bn, based on network development plan (NDP) electricity (Scenario B)

                                                                                                     • Developed and published every 1.5-
                                                                                                       2 years to outline the grid expansion
                                                                                           72-76.5     plan for the electricity network

                                                                                                     • Contains all network expansion and
                                                                                   61.0                upgrade measures incl. investment
                                                                                                       volumes over 10- to 15-year horizon

                                                                                                     • Drafted on the basis of various scenario
                                                                                                       frameworks concerning the electricity
                                                        34.0                                           demand going forward

          22.0                   23.0                                                                • Based on iterative process involving
                                                                                                       several consultation rounds with the
                                                                                                       public and experts

                                                                                                     • Disclosure of projects and expected costs
                                                                                                       in the NDP provide high revenue visibility
     NDP 2023               NDP 2024               NDP 2025                NDP 2030       NDP 2035
                                                                                                       and certainty of execution
                                                                            (2019)         (2021)
                                                                                            Draft

                                                                                                                                                    45
Source: NDP Electricity 2023, 2024, 2025, 2030 (2019 Version), 2035 (2021) Draft
Investments in the German electricity transmission network of €61bn until 2030

Planned investments in the German electricity infrastructure1

                                                                                            €61bn                 €30bn

                                                                                                                            • DC 21
                                                                                                                  €13                       Planned
                                                                                             AC                             • DC 23         completion by
                                                                                                                   bn
                                                                                            €31bn                           • DC 25         2030
                                                                                                                            • Others

                                                       €61.0
                                                            bn                                      Addressable
                                                                                                    by VORWERK              • Suedlink
                                                                                                                                            Planned
                                                                                                                  >€17      • Suedostlink
                                                                                             DC                                             completion by
                                                                                                                   bn
                                                                                            €30bn                           • A-Nord        2025/2026
                                                                                                                            • Others

                                                                                         NDP 2019                 DC
                                                                                          (2030)              investments

1) Investment volumes and grid expansion measures based on Scenario B 2030 in NDP 2030 (2019)
2) DC investments refer to direct current electricity grids
3) AC refers to alternative current electricity grids                                                                                                       46
Source: Network Development Plan Electricity 2030 (2019)
VORWERK covers all critical components of the electricity transmission grid

                                                                                                        Power-to-heat

               Landfall                                        Transformer station                      enables the generation
                                                                                                        of heat with the use of
               connecting offshore                             serves to connect                        electrical energy (e.g. for
               wind farms to the                               different voltage levels                 district heating)
               onshore transmission                            by matching the grid
               grid                                            voltage to the input
                                                               voltage required by
                                                               the converter

                                      Converter station                        Transmission grid

                                      is located by the                        transports electricity
                                      connection point of DC                   over large distances,
                                      and AC and converts                      delivering the power
                                      AC to DC or vice versa                   from where it is
                                                                               produced to areas of
                                                                               demand

                                                                                                                                      47
Source: BMWi
VORWERK ready to capitalize on significant market opportunities in electricity

        Network development plan                                                                                                    Additional market opportunities

                                                                                                                                      Underground                      • Pilot projects for
                                                                                                                                      AC projects                        underground AC
                                                                                                                                                                         connections

                                                                                                                                      Single energy                    • Large industrial clients
                                                                                                                                      consumers                        • Dedicated on-site

                              €17                                                                       €3.4
                                                                                                                                                                         power plants

                                                                                                                                      Grid                             • Cable line rerouting
                                 bn                                                                          bn                                                        • Parts replacement
                                                                                                         until 20263                  upgrades
                             until 20261
                                                                                                                                                                       • Upgrades

                                                                                                                                      International                    • International or cross-
                                                                                                                                      projects                           border projects not

                        ~20%                                                                                                                                             covered by German NDP

                   VORWERK market share                                                                                               Service &                        • Inspections & function checks
                   based on total length of                                                                                                                            • Route maintenance
                                                                                                                                      Maintenance
                     realized cable line2
                                                                                                                                                                       • 24/7 standby services

1) Total NDP volume of €61bn (NDP Electricity 2030 (2019)), thereof at least €17bn of investments into the DC grid by 2026 which is by law primarily realized as underground cable
2) Estimation based on projects included in the Offshore NDP 2025 (Version 2015)
3) Additional project volume estimated at approximately 20% of market potential from NDP projects                                                                                                        48
Source: NDP 2025 Electricity (Version 2015); management estimates; company data
VORWERK enables the transport of green energy from wind farms to the mainland

Case study:                                                                            Technology highlights
DolWin 6 - 900 MW DC connection linking wind farms to the onshore grid

                                                                                       • 45 km onshore underground
                                                                                         cable for transporting 900 MW
                                                                                         green offshore wind electricity
                                                                                         from landfall to converter station
                                                                                         in Emden

                                                                                       • Completion scheduled for 2023

                                                                                           Airborne laser scanning

                                                                                           Route engineering

                                                                                           HDD installation & drilling

                                                                                           Cable pulling & testing

                                                                                           Landfall cable pull-in

                                                                         HD drilling
 Client:                                                                                   Soil analysis and management

                                                                                                                              49
Source: TenneT
VORWERK realized the substation Stade West as turnkey project

Case study:                                                     Technology highlights
Substation Stade-West

                                                                • Realization in the DOW
                                                                  chemistry park demand highest
                                                                  level of safety requirements

                                                                • Special requirements due to
                                                                  construction works in areas of
                                                                  plants in operation

                                                                • GPS controlled machinery with
                                                                  height limitations

                                                                    Structural Engineering

                                                                    Site development & safety concepts

                                                                    Concrete engineering

                                                                    Pile foundation

 Client:                                                            Specialized equipment

                                                                                                         50
Source: TenneT
VORWERK realized the substation Stade West as turnkey project

                                                                51
Our hydrogen opportunity

                           52
Without clean molecules deep decarbonisation will not be possible

                         Transport                           Buildings                              Industry

                        Passenger vehicles                  Residential buildings                Industrial energy
     Electrification                                                                             Low to medium temperature
                                                                                                 heat
                        Light Commercial vehicles           Commercial buildings                 (100-400°C)

                        Other light vehicles

                        Heavy-duty trucks                   Residential buildings                Industrial feedstock
     Clean molecules                                                                             (e.g. refinery processes,
                                                                                                 ammonia, chemicals)
                        Aviation                            Commercial buildings                 Industrial energy
                                                                                                 High temperature heat
                                                                                                 (>400°C), e.g. steel or
                        Shipping                                                                 cement production)

                       Highly energy and CO2 intensive   Highly dependent on fossil fuels   Electrification not viable or possible

                                                                                                                                     53
Source: VORWERK
Hydrogen offers many advantages as the clean molecule of the future

                Infinite supply             Extremely efficient         Zero CO2 emissions
                                                                         when combusted

             Most abundant element          One of the highest energy   Combustion produces water
                 in the universe             density values per mass       vapour and warm air

            Diverse production                   Non-toxic                     Storable
                 methods

            Potential for zero-emission    No harm or destruction to        Long-term storage
               production methods         human health or environment         across seasons

                                                                                                    54
Source: BloombergNEF, VORWERK
Going forward hydrogen demand is expected to increase substantially

    Global energy demand supplied with hydrogen
    in EJ

                                           +670%

                                                                     78

                                                                         9   Power generation, buffering

                                                                     22      Transportation

                                                                     16      Industrial energy
                                                     28
                                                                     11      Building heat and power
                                     14
                    10
                                                                         9   New feedstock (CCU, DRI)

                                                                     10      Existing feedstock uses

                   2020             2030            2040            2050

            Replace grey H2 in             Use green H2 to decarbonize
            existing applications          additional applications

                                                                                                           55
Source: Hydrogen Council
Two main drivers accelerate ramp-up of the hydrogen economy

                                        H

       Strategic push in                                Reducing production
      political roadmaps                               cost of clean hydrogen
      (driven by public pressure)

                                                                                56
EU Hydrogen Strategy may finally drive hydrogen beyond the tipping point

                                                                                                         Targets
                                                                                            Phase 1

                                     €430bn                                               Today - 2024   6 GW
                                                                                                         of electrolysis capacity
                            total investment volume by 20301
                                                                                                         1 m tons
                                                                                                         of green hydrogen

                                      13-14%                                                Phase 2
                                                                                           2024-2030     40 GW
                 share of hydrogen in the European energy mix                                            of electrolysis capacity
                             by 2050 (vs. 2% today)
                                                                                                         10 m tons
                                                                                                         of green hydrogen

         “Many indicators signal that we are                                                Phase 3
                                                                                                         500 GW
           now close to a tipping point.”                                                  2030-2050
                                                                                                         of electrolysis capacity

                                                                                                         Large-scale deployment
                                                                                                         of green hydrogen

1) Based on a first industry blueprint proposed by the European Clean Hydrogen Alliance                                             57
Source: European Commission; European Clean Hydrogen Alliance
Many countries have taken decisive action to kick start the hydrogen economy

                          2030: 5.0 GW                                                                               €10.0bn

                          2030: 5.0 GW
                                                                                                        €9.0bn
                          2040: 10.0 GW

                          2025: 0.5 GW

                                                                                                                               >€50bn
                                                                                                        €9.0bn
                          2030: 3.5 GW

                          2024: 0.3-0.6 GW
                                                                                                     €8.9bn                    total national investment programmes
                          2030: 4.0 GW
                                                                                                                               into hydrogen economy

                          2030: 6.5 GW                                               €7.2bn

                          2030: 2.0-2.5 GW                                    >€7.0bn

                                                                                                                                                                      58
Source: Reuters, BMWi, Ministère de l’Economie, des Finances et de la Relance France, Gasunie, Energías Renovables
Electrolyzer stack accounts for
VORWERK covers all critical components of the hydrogen value chain

                                         Compressor stations
    Water electrolyzer                                             Valves
                                         ensure hydrogen
    produces hydrogen                    remains pressurized       act as „gateways“ and
    through the chemical                 during transportation.    enable safe daily
                                                                                                                     Building heat
    decomposition of water               Distances between                                                           Building heat
                                                                   operations &
    into hydrogen and                    stations vary depending   maintenance works
    oxygen                               on systems design

                                                                                                                     Industry uses
                                                                                                                     Industry-heat and feedstock

                                                                            Hydrogen pressure regulation &
                                                                            metering stations

                                                                            placed at transit and exit stations to
                                                                            reduce pressure levels and feed
                                                                            hydrogen through to end-use
                   Hydrogen storage                                         systems via distribution network

                   Enables long-term storage                                Gas meters allow TSOs to monitor,
                   across seasons, e.g. for                                 manage and account for gas in their      Synthetic fuels
                   power generation                                         pipelines                                Kerosene, diesel replacement

                                                                                                                                                    60
VORWERK is already working on the nucleus of the European hydrogen backbone

                             2030        2050
                                                                                       Refinery           Customer
                                                                                       Lingen, BP

                                                                                                    Power plant            Customer
                                                                                                    Lingen, RWE

                                                                      Electrolyzer

                                                                                                                                      Chemical park
                                                                                                                                      Marl, Evonik

                                                                      Additional
                                                                order volume upgrade
                                                        up to           ~€18m

                                                     €64
                                                         bn1

                                                                                                         Order volume
      Plan developed by                                                                                 new construction                    Ruhr Oel refinery
                                                                                                             ~€9m                           Gelsenkirchen, BP
                         VORWERK customers

                                                                                 Engineering            Realization           Service/ Operation

                       VORWERK Top 20 customers
                                                                                                                                                                61
Source: Get H2 Nucleus, European Hydrogen Backbone, VORWERK
In Germany, VORWERK customers are planning 500 MW of new electrolysis capacity

            Select planned electrolyzer projects

                                                                                           Location      Plant size   Planned by
                                         30
                                      6 MW                                            1    Lingen        100 MW
                                100
                                MW                                                    2    Diele         100 MW
                          2

                          100                                                         3    Wesseling     100 MW               ITM Power
                          MW                           5                         10
                     1
                                                           35                9
                                                                                 MW
                                                                                      4    Leuna         100 MW
                                                           MW
            10
        8
            MW
                                                      100                             5    Bad Lauchstädt 35 MW
                               TBD
                                                       MW
                                                  4
                          10
                                                                                      6    Heide         30 MW                            Örsted
        100
         MW
    3
                                                                                      7    Fenne         18 MW

                     18                                                               8    Metelen       10 MW
                 7   MW

                                                                                      9    Schw. Pumpe   10 MW

                                                                                      10   Essen         tbd

                                          VORWERK location

                                                                                                                                              62
Source: Project map Strategieplattform Power to Gas; Westküste 100 Website
VORWERK participated in the realization of the first German electrolyzer pilot project

            Pilot plant                                                        VORWERK‘s balance-of-plants electrolysis competencies1
            Power-to-Gas Falkenhagen

                                                                                                       4
                                                                                                   1                                      5 6
                                                                                                                        9
                                                                                                                                                          17
                                                                                                               2
                                                                                                                   3                             8
                                                                                                                                      7
                                                                                                                       13
                                                                                                                                                     12
                                                                                                                                            11                 16
                                                                                                                                 10
                                                                                                                                                                    15
                                                                                                                                                                              19

                      "World's first                                                                                                                                18
                                                                                                                                                                         14
                      demonstration plant
                      for the storage of
                      wind power in the
                      natural gas grid”                                    1    Undergr. cable / cable pull                 5    H2 digital control system                    14   H2 feed-in
                                                                           2    Transformer design/ cabling                 6    H2 emergency shutdown system                 15   H2 measurement/ metering

               • 2 MW performance                                          3    Flow metering                               7    H2 gas drying                                16   H2 gas analysis
                                                                           4    Water supply system                         8    H2 gas separation                            17   H2 storage
               • 1.6 km H2 pipeline
                                                                                                                            9    H2 gas compression                           18   Waste water management
               • Feed-in in the long-distance                                                                               10   Water treatment                              19   Heat distribution network
                 gas network of ONTRAS
                                                                                                                            11   Water compression
                                                                                                                            12   Heat extraction
                                                                                                                            13   Electrolysis stack (purchase part)

1) VORWERKs general competencies for electrolyzers; not all were in the scope of the Falkenhagen pilot plant                                                                                                   63
Source: VORWERK
VORWERK is realizing the most important gas infrastructure project for Lower Saxony

Case study:                                                                            Technology highlights
Decarbonisation of industry through H2-ready pipeline Walle/ Wolfsburg

                                                                                       • ETL 178 will lead to a significant
                                                                                         reduction in CO2 emission in
                                                                                         Lower Saxony

                                                                                       • The annual CO2 savings amount
                                                                                         to around 1.5 million tonnes
          Planned transmission grid

                                                                                       • Shift from coal-based energy
                                                                                         supply to more emission-friendly
                                                                                         natural gas
                                         VW headquarter

                                                                                       • In a second step hydrogen will
                                                                                         replace natural gas

                                                                                       • Completion scheduled for 2021

                   Station Walle

                                                                         HD drilling
                                                                                            HDD installation & drilling

                                                                                            Special welding procedures

                                                                                            H2 ready valve stations
 Customer:

                                                                                                                              64
Source: Gasunie
Financial Overview

                     65
Key financial highlights

 I     Combining high double digit organic and inorganic growth…   …and high revenue visibility from a strong order backlog…   II

            15%                          22%                                                   €306m
        CAGR 2014-2020              CAGR 2014-2020                                             order backlog
           excl. BoDo                   incl. BoDo
                                                                                              31 December 2020
           acquisition                  acquisition

                                                                                                      €
                               €

                           16%                                                                  ~75%
                         EBIT margin                                                         Ø cash conversion
                             2020                                                                 2018-2020

 III     …with best-in-class profitability…                                                …and superior cash conversion…      IV

 V       …on the back of an asset-light business model

                                                                                                                                    66
I

Revenue growth: Combining high double digit organic and inorganic growth

         Revenue development                                                                                                    Revenue 2020 by segment
         in €m                                                                                                                  revenue split in %

                                      CAGR: 22.2%

                                                                         291
                                                          269
                                                                                                                                                    13%
                        CAGR: 14.6%
                                                                                                                                            1%

                                            173                                                                                        12%
                                                                                                                                                           €291m

                88

                                                                                                                                                                      74%

                               …
               2014                        2019           2019          2020
                                           as-if         as-if
                                           excl.         incl.
                                          BoDo1         BoDo2                                                                                   Natural Gas        Clean Hydrogen
                                                                                                                                                Electricity        Adjacent opportunities

1) Presentation as if Bohlen & Doyen had not been acquired by VORWERK in 2019
2) Presentation as if Bohlen & Doyen had been part of the VORWERK group starting 1 Jan 2019; excl. discontinued operations with revenues amounting to ~€7.5m                                67
Source: VORWERK
I

Revenue growth: VORWERK has substantially increased service revenues

        Revenue split by type                                      Service revenue 2020 by type

                        13%                                 17%
                                                                             23%

                        87%                                 83%

                                                                                                  77%

                  2019 like-for-like                        2020

                                       Project-based   Service                Recurring   Non-recurring

                                                                                                          68
Source: VORWERK
II

Order backlog: High revenue visibility from a strong order backlog

         Order backlog                                                                                                           Project pipeline1
         as at 31 December 2020                                                                                                  name and estimated project volume

                                                                                                                                          OGE new compressor station Legden         €32m

                                                                                                                                          CENAM Closed Loop high-pressure           €30m
                                       7%                                                                                                 test rig Mexico
                           7%

                                                                                                                                          Amprion Corridor A-Nord                   up to €300m
                     13%
                                         €306m                                                                                            TenneT requests from framework            €50-100m
                                                                                                                                          agreements Südlink/ Südostlink            per lot

                                                             73%                                                                          TenneT BorWin 5 DC connection             €50m

                                                                                                                                          Wärme Hamburg long distance               €63m
                                                                                                                                          heat pipeline Südleitung

                                                                                                                                   H      OGE hydrogen feed-in plant Haren          €3-5m
                        Natural Gas               Clean Hydrogen
                        Electricty                Adjacent opportunities
                                                                                                                                   H      Magdeburg 1-5 MW electrolyzer             €5-17m

                                                                                                                                          Gas         Electricity    H   Hydrogen     Heat

1) Contract values are based on current estimates and may change during the award procedure, not yet included in order backlog                                                                    69
Source: VORWERK
II

The order backlog clearly reflects changes in the German energy mix

        Order backlog
        as at 31 December

                                                                                                    306

                                                                    286                             7%
                                                                      6%                            7%        H
                                                                  2%
                                                                   12%                              13%

                              174
                                 9%
                            2%

                                                                   80%                              73%
                             90%

                             2018                                  2019                             2020

                                      Natural Gas   Electricity     Clean Hydrogen   Adjacent Opportunities

                                                                                                                  70
Source: VORWERK
III

Profitability: Best-in-class profitability profile

          EBIT adj.                                            EBIT adj. 2020 by segment1
          in €m and margin in bubbles                          as % of EBIT adj.

                   12.5%                    14.7%      16.3%

                                                       47.4

                                                                                10%
                                                39.5                       1%

                                                                    16%

                                                                                       €47m

                     13.2
                                                                                                    73%

                    2018                        2019   2020
                                             as-if
                                             incl.
                                            BoDo                          Natural Gas         Clean Hydrogen
                                                                          Electricty          Adjacent opportunities

1) Reconciliation of €177T are not considered                                                                          71
Source: VORWERK
IV

Cash Conversion: Proven ability of strong cash generation

          Cash conversion1                                                     Trade working capital
          in % of EBITDA                                                       in €m and as % of revenue

                                                                                     24.8%            7.8%           11.6%

                                          81.8%
                  73.8%
                                                                   Ø 73.0%
                                                           65.2%

                                                                                                                        33.8
                                                                                                      21.1               4.9
                                                                                                       3.8

                                                                                       26.3
                                                                                           3.3        20.3              27.8
                                                                                       10.4

                                                                                       22.3           24.6
                                                                                                                        20.9

                                                                                       -4.0
                   2018                    2019            2020                        -5.7
                                                                                                                        -17.8
                                           as-if                                                      -21.5
                                           incl.                                                                        -2.0
                                          BoDo                                                         -6.1

                                                                                      2018            2019              2020

                                                                             Inventories         Trade receivables              Trade liabilities
                                                                             Contract assets     Prepayments received
1) Cash conversion calculated as (EBITDA-Capex) / EBITDA                                                                                            72
Source: VORWERK
V

Asset-light: Fully invested and asset-light platform, ready-to-scale

        Capital expenditure                                   Depreciation and amortization
        in €m and as % of revenue                             in €m and as % of revenue

                  4.9%          2.0%             7.0%
                                                                    6.3%            3.9%     3.8%

                                                  20.4                                       11.2
                                                                                     10.5

                                                  11.4
                                                                     6.7

                                    9.1
                                2.3
                   5.2
                   1.8                            9.0
                                6.8
                   3.4

                  2018          2019              2020              2018            2019     2020
                                as-if                                                as-if
                                incl.                                                incl.
                               BoDo                                                 BoDo

                     Growth Capex         Maintenance Capex

                                                                                                    73
Source: VORWERK
Our asset-light business model results in a solid balance sheet

          Assets                                                                                                                  Equity and Liabilities
          in €m as at 31 December 2020                                                                                            in €m as at 31 December 2020

                                    177                                                                                                                      177

                                                        Fixed assets                                                                                         64         Equity
                                     72

                                                                                                                                                              10        Mezzanine financing1

                                                                                                                                                              17        Financial liabilities

                                                        Working capital                                                                                                 Operating liabilities (LT)
                                     60                                                                                                                       22

                                                                                                                                                                        Operating liabilities (ST)
                                                                                                                                                             64
                                     45                 Cash

                                  Assets                                                                                                                  Liabilities
                                                                                                                                                          & Equity

1) Financed by Irene und Friedrich VORWERK Stiftung: Non-profit foundation focusing on the promotion of young engineers, basic interest rate: 2-5% p.a.                                              74
Source: VORWERK
Substantial growth perspectives driven by accelerating clean energy transition

    Revenue outlook                                        Segment revenue split
    in €m, bubbles show EBIT margin targets                in €m

         >16%

                                               >1,000              291             >500            >1,000

                            >500

           291

          2020            Mid-term            Long-term            2020          Mid-term        Long-term
                          3-5 years           7-10 years                         3-5 years       7-10 years

                                                                   Clean Hydrogen         Natural gas
                                                                   Electricity            Adjacent opportunities

                                                                                                                   75
Strategy & Outlook

                     76
Clear strategic building blocks for sustainable and profitable growth

                 Capture structural growth
                 by focusing on clean energy and
                 hydrogen

                 Drive profitable growth
                                                            M&A
                                                            as catalyst to accelerate
                 leveraging existing client                 future growth
                 network and proven technology

                 International rollout

                 of proven business model
                 starting in Benelux and Spain

                                                                                        77
Capturing structural growth across markets with our fully integrated business model

                 Natural gas                                                                       Electricity                                                                       Hydrogen

                                    >€5
                                      bn
                                                                                                              ~€17
                                                                                                                   bn
                                                                                                                                                                                           €430
                                                                                                                                                                                                 bn

           Planned investment                                                               Planned investment                                                              Planned investment
               until 20261                                                                      until 20262                                                                     until 20303

1) NDP investment volume 2020-2026; volume attributed to year of planned project completion
2) Total NDP volume of €61bn (NDP Electricity 2030 (2019)), thereof at least €17bn of investments into the DC grid by 2026 which is by law primarily realized as underground cable                    78
3) Maximum cumulative investment volume until 2030 to achieve targets defined in European Hydrogen Strategy as outlined in the European Clean Hydrogen Alliance
The hydrogen economy is now at a critical tipping point

Hydrogen economy today

                           €11
                                               sees the opportunity to become
                                               a major driver of the European
                                 tn            clean hydrogen revolution

                                               … and needs to further strengthen its
                                               technological edge right now

                                                                                       79
 Source: Bank of America
Leveraging long-lasting customer relationships as partner of choice

                    • Repurpose/ upgrade
                      existing grid infrastructure

 Transmission
 System Operators

                    • Comply with increasingly
                      strict regulation (RED II)

 Industrial
                    • Compensate rising CO2
                      prices                                          H
 companies          • Innovate manufacturing
                      process

                    • Scale renewables to enable
                      large-scale hydrogen
                      production
 Energy             • Capture market share along
 producers            hydrogen value
                      chain

                                                                          80
The dedicated VORWERK hydrogen lab will focus on hydrogen-ready infrastructure

                                               Readily      Development   Research
                 VORWERK Component             deployable   required      required

                   Gas compressor

Electrolyzer       Gas dryer
technologies
                   Gas separator

                   Flow meters

                   Heat extractor

                   Chromatograph

                   Transmission pipeline

                   Compressor stations
H2 transport
infrastructure
                   GPRM station
                                                                                     Hydrogen Lab
                                                                                     Tostedt
                   Flow meter

                   Valves

                   Digital control system
Intelligent        Emergency Shutdown System
Infrastructure
Management         Safety systems

                                                                                                    81
VORWERK will continue to invest in acquiring the best talent on the market

                                                                 Employee development

                       University cooperations & scholarships1

                       In-house events (e.g. Pipeline Forum)                                    1,304
                                                                                        1,239

                       Attractive salary packages

                                                                              705
                       Industry fair presence
                                                                    572

                       Employer branding

                       Social media presence
                                                                    2017      2018      2019    2020

                                                                                                        82
1) Supported by the Vorwerk Foundation
VORWERK leverages its operational excellence through state-of-the-art digital solutions

                                                       Complete harmonization and
                                                       integration of ERP system

                                GPS route tracking
      Airborne laser                                                                        Improve precision and
      scanning                                                                              efficiency in engineering

                                                                        Drive process
                                                                        automation

                                                                                            Maximize utilization of
                                                                                            machinery and personnel
                                      Digitization

   Project data repository
   and documentation                                                                        Seamless and efficient
                               State-of-the-art                                             back-end processes
                             Building Information
                                                                          Digitized fleet
                               Modeling (BIM)
                                                                          management

                                                          Real-time
                                                     project tracking
                                                                                                                        83
M&A remains a key catalyst to further accelerate profitable growth

                                                                                               Specialized technologies
                                                                                                Hydrogen technologies
                                                                                                Horizontal direct drilling (HDD)
                                                                                                Biogenic gases and synthetic fuels

                                                 Power grids
                                                                    2020                       Employees & competencies
                                                 HDD drilling
                                                                                                Smaller regional players with fully certified
                                                                                Laufend
                                                                                                employees and/ or complimentary
                                                                                                competencies
                                                                          Cathodic corrosion
                    Intelligent
                  Infrastructure                   2019                    protection (CCP)

                  Management

                             2018                                                              Regional footprint
           2013
                                                                                                         Benelux
                                                       Specialized flow
                                                        measurement
                                                                                                         Spain
                                                          (OrQa®)
        Specialized                  Special
         pressure                     plant
        technology                 engineering

                                                                                                                                                84
Source: VORWERK
Key Investment Highlights

            Climate change commands billions in infrastructure investments in
            VORWERK core end markets gas, electricity and hydrogen

            50+ years of technology leadership in design, realization and operation of
            system critical energy infrastructure

            Key player in ramping up the European hydrogen infrastructure thanks
            to a unique combination of know-how and decade-long customer relations

            Double-digit revenue growth with a stable >16% EBIT margin as
            an ideal starting point for exponential growth potential ahead

            Owner-managed business with an ambitious strategy to further
            accelerate profitable growth

                                                                                         85
Driving the clean energy transition

Appendix

                                      86
Legal structure of the VORWERK Group

                                                                       ALX1                                        MBB

                                                              33.33%                                                     66.67%

                                                                                  Friedrich Vorwerk Group SE
                                     Management board                                        Tostedt              Supervisory board
                                     Torben Kleinfeldt (CEO)                                                      Dr Christof Nesemeier (chairman)
                                     Tim Hameister (CFO)                                                          Heike von der Heyden
                                                                                                                  Dr Julian Deutz

                                     Irene Vorwerk

                                 10.07%                                89.93%                                            100.00%

                                                                                                                  Friedrich Vorwerk Management SE
                                                         Friedrich Vorwerk SE & Co. KG                                         Tostedt
                                                                     Tostedt
                                                                                                               Management board:
                                                                                                               Torben Kleinfeldt (CEO)
                                                                                                               Tim Hameister (CFO)
                                                                                                               Klaus-Dieter Ehlen
                                                                                                               Kevin Loots
                                                                       OpCos2
                                                                                                               Chairman of the supervisory board:
                                                                                                               Dr Christof Nesemeier

                                                                                                                           Complementary

1) ALX = Torben Kleinfeldt; 2) OpCos including holding companies                                                                                     87
Source: VORWERK
VORWERK is leading the way towards a sustainable future

                                                                                                                                     Reporting according
                                                                                                                                     to SASB standards

                         Decarbonisation                                                          Social engagement                        Work safety

          Shift towards emission-free resources                                     Irene & Friedrich Vorwerk Foundation     Total Recordable Incident Rate (TRIR)1

                                                                                       Educational support of universities

                                                                                                                                    2.34
                                   -67%
                                                                                                    Development aid                                 1.80

                                               -100%

                     Lignite        Gas       Green
                                             hydrogen                                                                               2019           2020

                                                                                      UN Sustainable Development Goals

1) Only includes incidents recorded on project sites; Bohlen & Doyen included from 2019 on a like-for-like basis                                                      88
Source: VORWERK; Zukunft Erdgas Report 2019
You can also read