Using a Multi-Criteria Model to Assess the Suitability of Potential Sites to Implement Off-Grid Solar PV Projects in South America - MDPI
←
→
Page content transcription
If your browser does not render page correctly, please read the page content below
sustainability

Article
Using a Multi-Criteria Model to Assess the Suitability of
Potential Sites to Implement Off-Grid Solar PV Projects in
South America
Laura M. Hinestroza-Olascuaga 1, * , Pedro M. S. Carvalho 1,2 and Célia M. S. Cardoso de Jesus 1,2

                                          1   Instituto Superior Técnico, Universidade de Lisboa, Av. Rovisco Pais 1, 1049-001 Lisbon, Portugal;
                                              pcarvalho@tecnico.ulisboa.pt (P.M.S.C.); celiaj@tecnico.ulisboa.pt (C.M.S.C.d.J.)
                                          2   INESC-ID, Rua Alves Redol 9, 1000-029 Lisbon, Portugal
                                          *   Correspondence: laura.hinestroza@tecnico.ulisboa.pt

                                          Abstract: The role of the private sector is essential in providing energy access to all by 2030. However,
                                          private investors often face the decision problem of deciding where to implement off-grid projects.
                                          This selection process can be considered a multifactorial task because it requires accounting not
                                          only for local conditions, technical constraints, and economic-financial feasibility but also for socio-
                                          cultural dynamics and environmental consequences. In this paper, we implemented a multi-criteria
                                          decision-making (MCDM) method based on the Measuring Attractiveness by a Categorical Based
                                          Evaluation Technique (MACBETH) to assist in the selection of the most suitable location to implement
                                off-grid solar PV projects in South America. Following a participatory process with the input of a

                                          decision-maker representing the private sector, we combined 13 criteria, within 5 dimensions, to
Citation: Hinestroza-Olascuaga,           evaluate the performance of three potential sites, namely Bolivia, Peru and Colombia. Based on
L.M.; Carvalho, P.M.S.; Cardoso de
                                          an overall score associated with each alternative, we grouped them into three categories: highly
Jesus, C.M.S. Using a Multi-Criteria
                                          sustainable, sustainable, and unsustainable. As a result, Colombia represents the highest sustainable
Model to Assess the Suitability of
                                          option for a potential private investor. This methodology provides guidance not only to investors but
Potential Sites to Implement Off-Grid
                                          also to local utility companies and policymakers assessing off-grid locations with electricity access
Solar PV Projects in South America.
Sustainability 2021, 13, 7546. https://
                                          deficits, in developing countries.
doi.org/10.3390/su13147546
                                          Keywords: decision-making process; rural electrification; electricity access; sustainability assessment;
Academic Editors: Blanca                  private investment; multi-criteria evaluation
Pérez Gladish, Vicente Liern Carrión
and Marc A. Rosen

Received: 25 April 2021                   1. Introduction
Accepted: 29 June 2021
                                               Rural Electrification (RE), the process of delivering electricity to rural and remote
Published: 6 July 2021
                                          areas, has become a priority in the agenda of developing countries [1]. Globally, ru-
                                          ral areas account for 84% of the global population living without access to electricity
Publisher’s Note: MDPI stays neutral
                                          (640 million unserved people, as of 2019) [2]. In addition, although the number of people
with regard to jurisdictional claims in
                                          worldwide living without electricity has fallen from 1.2 billion (in 2010) to 759 million (in
published maps and institutional affil-
                                          2019), disparities between rural and urban electrification continue to prevail. Urban areas
iations.
                                          are approaching universal access, with an electrification rate of about 97%, but in contrast,
                                          in rural areas, the electricity access rate is below 80% [1].
                                               Within this context, governments across the world have identified the need of achiev-
                                          ing universal electricity access by adopting the United Nations Sustainable Development
Copyright: © 2021 by the authors.
                                          Goal (SDG) 7, which aims to “ensure access to affordable, reliable, sustainable, and modern
Licensee MDPI, Basel, Switzerland.
                                          energy for all by 2030” [3]. Unfortunately, in some parts of the world, such as in rural
This article is an open access article
                                          and peri-urban areas of Sub-Saharan Africa, the population without access to electricity
distributed under the terms and
                                          is growing in line with population growth. This means that the access rate will have to
conditions of the Creative Commons
                                          more than triple between now and 2030 to reach universal access. As a result, according to
Attribution (CC BY) license (https://
                                          the 2021 energy progress report tracking SDG 7, the world is falling behind to reach this
creativecommons.org/licenses/by/
4.0/).
                                          goal and 660 million people will still lack access to electricity by 2030 [2]. In addition, the

Sustainability 2021, 13, 7546. https://doi.org/10.3390/su13147546                                        https://www.mdpi.com/journal/sustainability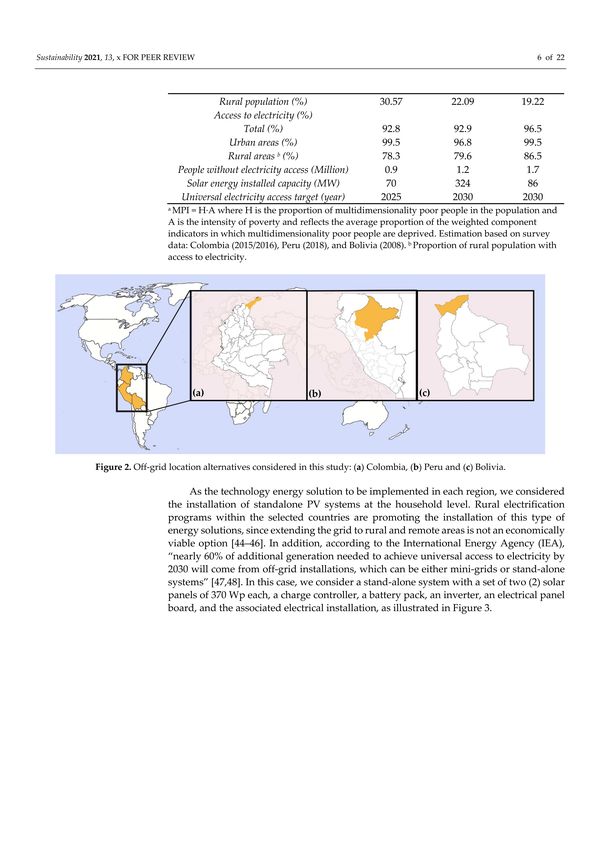
Sustainability 2021, 13, 7546                                                                                               2 of 21

                                COVID-19 pandemic has threatened the electrification progress by increasing investors’
                                risk perception and shifting public funding priorities in developing countries [2]. Thus, as
                                public financing may remain limited over the next few years, it is critical to unlock and
                                promote private financing in the rural electrification sector.
                                      However, off-grid electrification projects are often considered high-risk investments
                                by utilities and off-grid service providers, mainly due to the uncertainty around revenues,
                                project sustainability, scarcity of capital, potentially low returns and the lack of clear and
                                effective public policies [4]. As a result, potential investors and project developers face the
                                decision problem of deciding where to invest in rural and remote areas, while guaranteeing
                                the sustainability of rural electrification projects in the long-term view [5], namely the
                                “capability of the project to be continually operational over its useful lifespan” [6]. This site
                                selection decision making process can be considered a complex task because it requires
                                accounting on different factors (qualitative and quantitative) that influence the selection of a
                                potential off-grid site over other alternatives [7]. Unfortunately, as authors Rahman et al. [8]
                                argue, “a large number of off-grid rural electrification projects have failed because the
                                focus was given on technical installation without paying sufficient attention to the long-
                                term sustainability”. Thus, a multi-criteria analysis is useful to address this multi-faceted
                                decision problem while accounting on multiple dimensions [8,9].
                                      In the literature, we find a variety of multi-criteria decision making (MCDM) methods
                                that support different rural electrification decision making processes [8–18]. In particular,
                                these multi-criteria approach are mainly incorporated in two types of studies: (1) stud-
                                ies that apply a technology assessment to select the most appropriate technology for the
                                energy provision in rural communities based on the attributes that each potential technol-
                                ogy exhibits [11–16,19]; (2) studies that evaluate potential site alternatives to implement
                                rural electrification projects based on different criteria [8–10,18]. In both scenarios, the
                                sustainability assessments require accounting on a set of indicators that are related to the
                                SDGs and cover multiple dimensions of sustainability [20]. Some authors refer to these
                                dimensions as ‘criteria’, a term that finds correspondence in the “set of factors that may
                                be used to assess which of a range of options offers the greatest contribution to achieving
                                sustainability objectives” [21].
                                      Traditionally, the concept of sustainability is associated with the triple bottom line
                                (TBL) framework, composed of three key dimensions of sustainability: social, environmen-
                                tal, and economic or principles [20,22]. However, we, along with some other authors [8–18],
                                believe that the TBL is not sufficient to capture all the perspectives that affect the sustain-
                                ability of rural electrification projects. Fuso Nerini et al. [10] argue that rural electrification
                                in the Brazilian Amazon is associated with 16 criteria grouped under five dimensions,
                                namely technical, economic, environmental, social and institutional/political. They ap-
                                plied a multi-criteria approach based on a simple weighting methodology (i.e., the direct
                                method of Anchored Rating Scale (ARS)), where decision-makers were asked to quantify
                                their preference through a participatory process. As a result, biomass systems and solar
                                PV systems registered the highest scores in the final index, 77%, and 76%, respectively.
                                Ghasempour et al. [17] present a review on a variety of multi-criteria decision-making
                                techniques applied to select solar plant sites and technologies. This includes the application
                                of Technique for Order of Preference by Similarity to Ideal Solution (TOPSIS) methods,
                                Analytic network process (ANP), Analytic Hierarchy Process (AHP), the Preference Rank-
                                ing Organization Method for Enrichment of Evaluation (PROMETHEE) method, among
                                others. Rahman et al. [8] applied a Stochastic Multi-criteria Acceptability Analysis (SMAA)
                                method and Monte Carlo simulation to aid the process of selecting the best option for
                                expanding electricity access in a rural area of Bangladesh. In this case study, the author
                                considered 24 criteria values grouped into five sustainability dimensions. As a result of
                                this process, the solar PV and biogas plants were found as the most preferable alternatives
                                with 59% and 41% acceptability in their first rank, respectively.
                                      Pérez and Díaz [16] used the case study of Colombia to develop a methodology to
                                assess the implementation of solar PV projects in rural areas of Colombia. They assessed all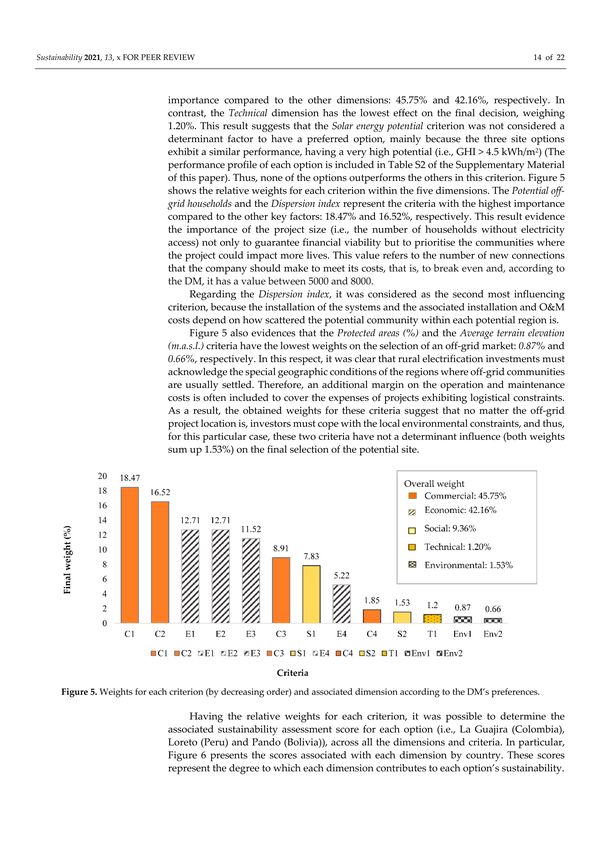
Sustainability 2021, 13, 7546                                                                                            3 of 21

                                the country’s departments using an AHP and considering techno-economic, social and en-
                                vironmental risk dimensions. The evaluation was based on data from the National Survey
                                on Living Conditions in Colombia (NSLCC) and the Institute of Hydrology, Meteorology
                                and Environmental Studies (IDEAM). As a result, a list of eight departments represented
                                the prioritised regions to implement solar power projects in the country. Cherni et al. [9]
                                designed and implemented a multi-criteria sustainable rural energy decision support
                                system (SUREDSS) to select the most appropriate set of energy options for providing
                                sufficient power to a rural and remote community in the department of Arauca, Colombia.
                                Based on this multi-criteria approach, they ranked the possible energy system options
                                (i.e., Micro-hydro, solar PV, Biogas, Hybrid diesel-biogas, Hybrid diesel-solar and Hybrid
                                diesel-hydro) through four dimensions: physical, financial, natural, physical and human
                                assets. As a result, the SURE program identified the best technology option based on a
                                total score for each possible energy alternative where the highest given rating is 1 and the
                                lowest is 0.
                                       Overall, there is not a unique reference for the type of MCDM methods, dimensions
                                and criteria used to implement sustainability assessments within the rural electrification
                                sector. In this paper, we use the MACBETH approach and software to assess the suitability
                                of different potential off-grid sites for implementing off-grid solar PV projects, based on a
                                set of sustainable dimensions and key criteria. MACBETH is a non-numerical approach
                                designed to aid decision-makers to quantify the relative attractiveness of options [23]. It has
                                been successfully applied in several real-world case studies including the area of energy
                                technology choice [24–29]. However, this paper constitutes the first study applying the
                                MACBETH approach to the off-grid site selection decision problem.
                                       Unlike other existing methods that assist rural electrification decision-making, the
                                MACBETH approach uses a simple dialogue process in which the decision-maker (DM)
                                carries out pairwise comparisons and gives only qualitative judgments about the differ-
                                ences in preferences of certain options [20,30,31] As a result, this procedure may be suitable
                                for a DM who does not like to quantify preferences or to express his preference judgments
                                numerically. Also, a particularly useful aspect is that MACBETH allows graphical represen-
                                tations of the performance profiles of the assessed options, making it possible to visually
                                compare the attributes of each alternative in each criterion.
                                       One of the limitations of this approach appears when evaluating more than five options.
                                When the number of options (or the level of descriptors) is high, the MACBETH method might
                                become an exhausting process to the DM, who must provide judgments of the difference
                                of attractiveness between all the possible options and thus, resulting in a time demanding
                                process. It is also worth mentioning that some of the methodological steps followed in this
                                paper, are not exclusive to the MACBETH methodology, such as the procedures for developing
                                and validating constructed descriptors of performance. Instead, they can be combined with
                                other value function assessment approaches. Doing so, however, may sacrifice the added
                                value of using a qualitative pairwise comparison approach.
                                       In this paper, we illustrate the application of this multi-criteria model by evaluat-
                                ing the performance of three potential off-grid sites (i.e., Bolivia, Peru and Colombia) to
                                implement off-grid solar PV projects. We focus on addressing the following questions:
                                Which factors determine the long-term sustainability of off-grid electrification projects
                                in rural and remote communities? and Which region represents the most sustainable
                                option for implementing off-grid solar PV projects? To provide some answers, we cali-
                                brate the model, following a participatory process with the input of a DM with extensive
                                experience in the rural electrification sector. As a result, we identify a set of sustainable
                                dimensions and key criteria that influence the decision-making of selecting the most ap-
                                propriate locations to implement off-grid solar PV projects. In addition, we reflect on the
                                concept of sustainability assessment for site selection by estimating a composite score that
                                groups each alternative into three categories: Highly sustainable (score > 100), Sustainable
                                (0 < score < 100) and Unsustainable (score < 0), considering that each place offers a different
                                level of attractiveness of investment for the DM.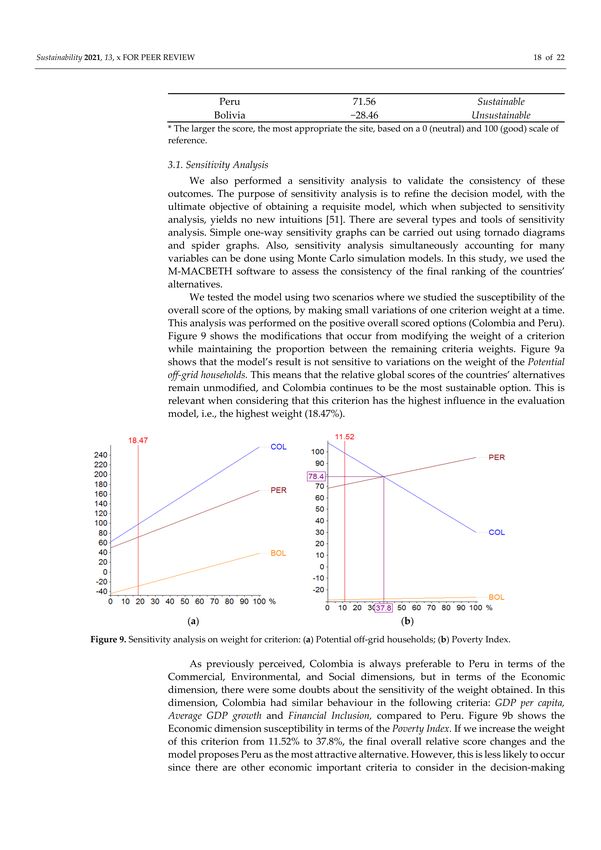
Sustainability 2021, 13, 7546                                                                                            4 of 21

                                      The results from this study offer guidance to investors seeking to identify the most
                                 suitable sites for implementing off-grid solar PV projects in rural and remote areas, while
                                 accounting for sustainable criteria. Also, these results can help policymakers to identify and
                                 prioritise geographical areas for the provision of electricity access in developing countries.

                                 2. Materials and Methods
                                 2.1. Multi-Criteria Modelling
                                       In the present study, we applied the MACBETH approach, to evaluate the performance
                                 of three potential locations for implementing off-grid solar PV projects in terms of a set of
                                 key criteria defined by the DM.
                                       Figure 1 illustrates the main phases of the multi-criteria modelling implemented in
                                 this study.

           Figure 1. Schematic overview of the MACBETH approach and associated outputs. Source: Adapted from [30,31].

                                 2.1.1. Problem and Model Structuring
                                      As mentioned above, private firms face the decision problem of valuating options for
                                 expanding their operations to other countries. In a setting where uncertainty is the norm,
                                 decision-makers seek information that enables them to select a foreign market from a set of
                                 possible alternatives, based on different aspects that guarantee the sustainable operation
                                 of a particular project, providing provide a favourable investment environment for the
                                 investor. Relevant criteria concerning this choice include, for instance, the level of poverty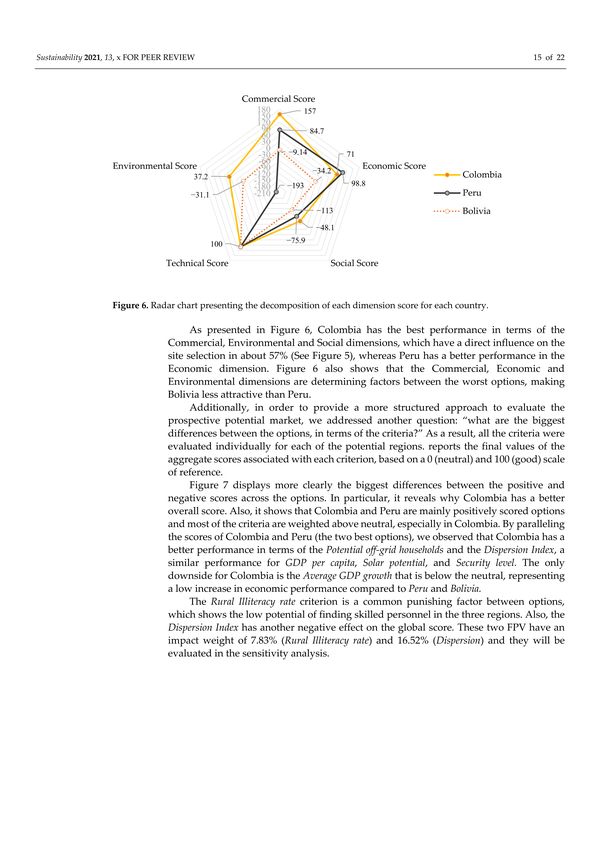
Sustainability 2021, 13, 7546                                                                                                             5 of 21

                                in the region, the political and economic environment of the countries, among other aspects.
                                Therefore, a MCDM is technically adequate for dealing with this problem [23–25].
                                      To illustrate the real-world application of the MCDM model, we used the MACBETH
                                approach and software to evaluate the performance of three potential locations for imple-
                                menting off-grid solar PV projects in developing countries. Following a participatory process,
                                the model was calibrated with the input of a decision-maker (DM) with extensive experience
                                in off-grid energy projects (a co-founder and former CEO of Kingo (Kingo is a provider of
                                prepaid solar energy that has installed over 50,000 solar home systems (SHS) in off-grid com-
                                munities of Guatemala and Colombia, between 2013 and 2020)) [32]. Thus, these judgements
                                represent the point of view of a private company that makes investments in the rural electri-
                                fication sector of developing countries. The point of view of other stakeholders, including
                                academia, governments, or NGOs, are not considered in this study.
                                      After defining the decision problem and its context, the following step was to define
                                the screening criteria (i.e., any process that reduces a large set of alternatives to a smaller
                                set that (most likely) contains the best choice [33]). During the meeting with the DM, we
                                performed a preliminary screening analysis to select or reject possible options. In this
                                case, based on the company’s commercial experience and the 2018 electricity access rates
                                (acceptance criterion), we selected the three South American countries with the lowest
                                rates of rural electrification, namely Bolivia, Peru and Colombia, as suitable alternatives to
                                implement off-grid solar PV projects (see Table 1). These locations also represent interesting
                                business opportunities for off-grid companies since there has been a strong commitment
                                from the local governments to implement national policies, regulations and programs
                                aiming at increasing the electricity provision in rural and remote communities mainly
                                through stand-alone PV systems and the grid extension [5,34,35]. The greatest cases
                                correspond to Bolivia and Peru, where rural electrification rates increased in about 65%
                                between 2000 and 2018 [36]. In the Colombian context, as of 2020, there were about 13,000
                                stand-alone PV systems installed in off-grid areas of the country. In addition, it is estimated
                                that about 4821 rural and remote households will receive the electricity service through
                                this type of energy solutions. by 2021 [37]. Table 1 presents a comparative review of the
                                key development indicators between the three countries.

                                Table 1. Comparison of electricity access rates and other development indicators associated with the
                                selected countries (as of 2018). Source: Adapted from [36,38–43].

                                                                                                 Countries under Assessment
                                                                                   Bolivia                  Peru              Colombia
                                            Population (Million)                    11.35                  31.99                 49.65
                                           GDP per capita ($ US)                   3548.59                6941.24               6667.79
                                    Multidimensional Index Poverty (MPI)
                                                        a                        Value = 0.094          Value = 0.029         Value = 0.02
                                                                                  H = 20.4%              H = 7.4%             H = 4.8%
                                                                                  A = 46%                A = 39.6%            A = 40.6%
                                             Rural population (%)                   30.57                  22.09                19.22
                                            Access to electricity (%)
                                                   Total (%)                         92.8                   92.9                  96.5
                                               Urban areas (%)                       99.5                   96.8                  99.5
                                               Rural areas b (%)                     78.3                   79.6                  86.5
                                       People without electricity access
                                                                                      0.9                    1.2                  1.7
                                                   (Million)
                                     Solar energy installed capacity (MW)             70                    324                   86
                                    Universal electricity access target (year)       2025                   2030                 2030
                                aMPI = H·A where H is the proportion of multidimensionality poor people in the population and A is the intensity
                                of poverty and reflects the average proportion of the weighted component indicators in which multidimensionality
                                poor people are deprived. Estimation based on survey data: Colombia (2015/2016), Peru (2018), and Bolivia
                                (2008). b Proportion of rural population with access to electricity.

                                     Within each country, three states were selected for the sustainability assessment
                                (see Figure 2): La Guajira (Colombia), Loreto (Peru) and Pando (Bolivia). These regions
Sustainability 2021, 13, 7546                                                                                                  6 of 21

                                    have the lowest electricity access rate in each selected country: 58.81%, 76.6% and 83.1%,
                                    respectively [38–40].

                  Figure 2. Off-grid location alternatives considered in this study: (a) Colombia, (b) Peru and (c) Bolivia.

                                         As the technology energy solution to be implemented in each region, we considered
                                    the installation of standalone PV systems at the household level. Rural electrification
                                    programs within the selected countries are promoting the installation of this type of
                                    energy solutions, since extending the grid to rural and remote areas is not an economically
                                    viable option [44–46]. In addition, according to the International Energy Agency (IEA),
                                    “nearly 60% of additional generation needed to achieve universal access to electricity by
                                    2030 will come from off-grid installations, which can be either mini-grids or stand-alone
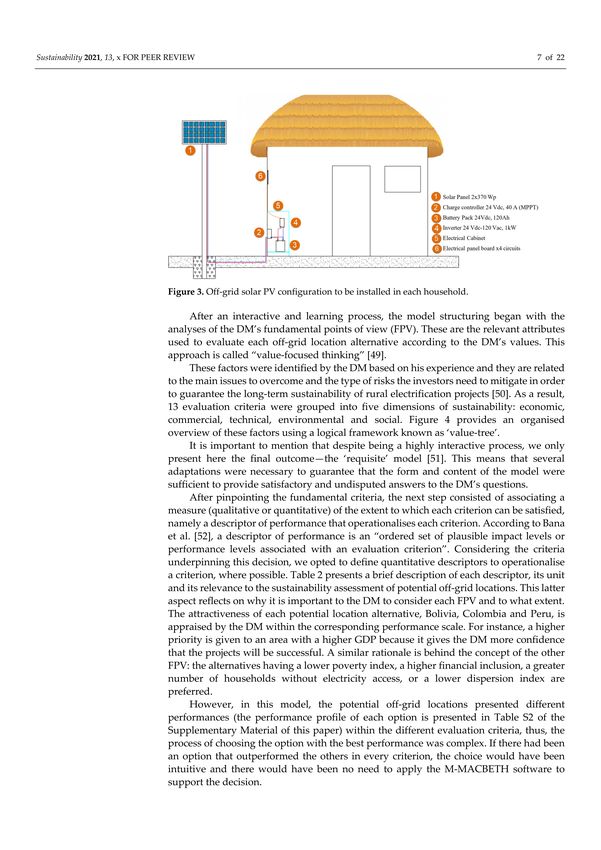
                                    systems” [47,48]. In this case, we consider a stand-alone system with a set of two (2) solar
                                    panels of 370 Wp each, a charge controller, a battery pack, an inverter, an electrical panel
                                    board, and the associated electrical installation, as illustrated in Figure 3.

                                    Figure 3. Off-grid solar PV configuration to be installed in each household.

                                         After an interactive and learning process, the model structuring began with the
                                    analyses of the DM’s fundamental points of view (FPV). These are the relevant attributes
                                    used to evaluate each off-grid location alternative according to the DM’s values. This
                                    approach is called “value-focused thinking” [49].
                                         These factors were identified by the DM based on his experience and they are related
                                    to the main issues to overcome and the type of risks the investors need to mitigate in
                                    order to guarantee the long-term sustainability of rural electrification projects [50]. As a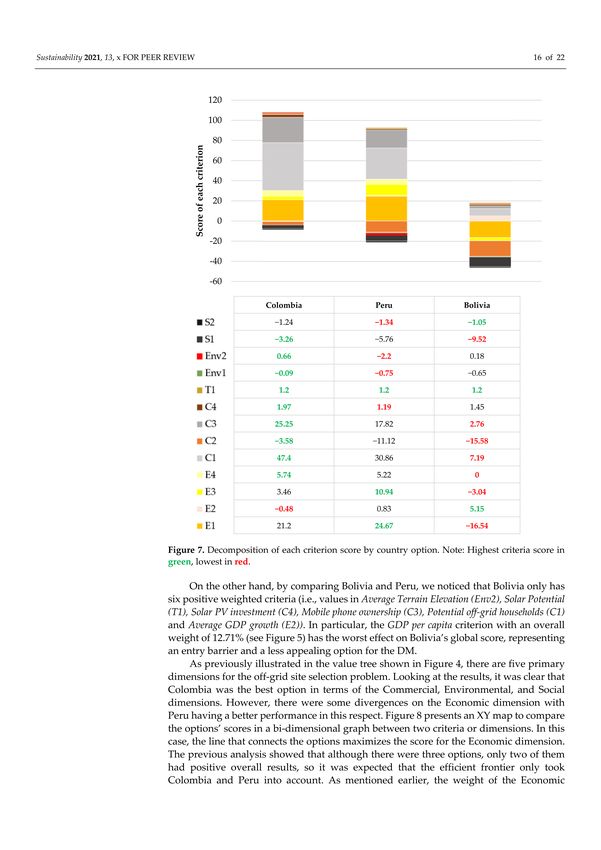
Sustainability 2021, 13, 7546                                                                                            7 of 21

                                result, 13 evaluation criteria were grouped into five dimensions of sustainability: economic,
                                commercial, technical, environmental and social. Figure 4 provides an organised overview
                                of these factors using a logical framework known as ‘value-tree’.

                                       Figure 4. Final value tree of the evaluation criteria.

                                     It is important to mention that despite being a highly interactive process, we only
                                present here the final outcome—the ‘requisite’ model [51]. This means that several adapta-
                                tions were necessary to guarantee that the form and content of the model were sufficient to
                                provide satisfactory and undisputed answers to the DM’s questions.
                                     After pinpointing the fundamental criteria, the next step consisted of associating a
                                measure (qualitative or quantitative) of the extent to which each criterion can be satisfied,
                                namely a descriptor of performance that operationalises each criterion. According to
                                Bana et al. [52], a descriptor of performance is an “ordered set of plausible impact levels
                                or performance levels associated with an evaluation criterion”. Considering the criteria
                                underpinning this decision, we opted to define quantitative descriptors to operationalise a
                                criterion, where possible. Table 2 presents a brief description of each descriptor, its unit
                                and its relevance to the sustainability assessment of potential off-grid locations. This latter
                                aspect reflects on why it is important to the DM to consider each FPV and to what extent.
                                The attractiveness of each potential location alternative, Bolivia, Colombia and Peru, is
                                appraised by the DM within the corresponding performance scale. For instance, a higher
                                priority is given to an area with a higher GDP because it gives the DM more confidence
                                that the projects will be successful. A similar rationale is behind the concept of the other
                                FPV: the alternatives having a lower poverty index, a higher financial inclusion, a greater
                                number of households without electricity access, or a lower dispersion index are preferred.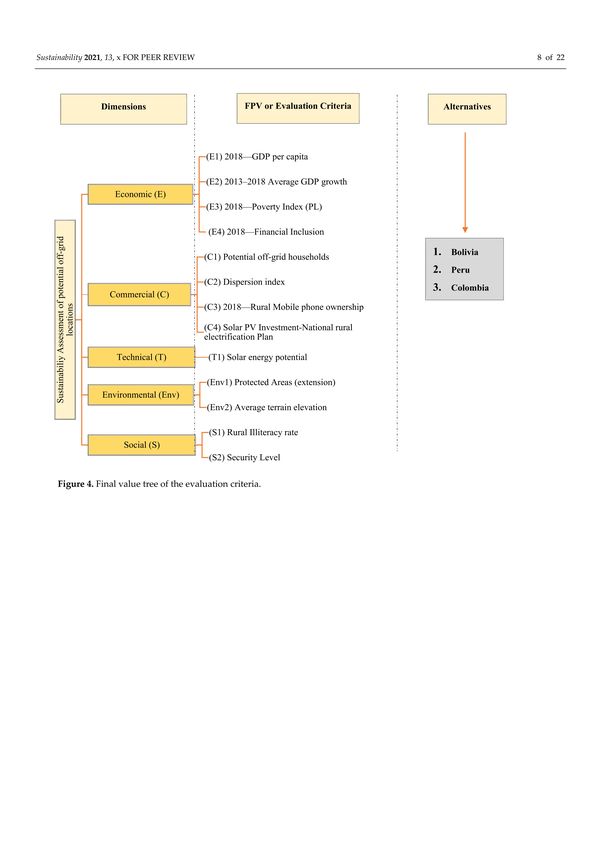
Sustainability 2021, 13, 7546 8 of 21
Table 2. Selected evaluation criteria and associated descriptors of performance.
Descriptors of Performance (Brief
Dimension Criteria Unit of the Descriptor Relevance
Description)
The extent to which a higher GDP provides more
confidence about the economic performance of the
Estimated by the country’s gross domestic
(E1) 2018—GDP per capita US $ country. This indicator allows for making cross-country
product
comparisons of average living standards and
economic wellbeing.
The extent to which the potential project is affected by
(E) (E2) 2013–2018 Average GDP Estimated by the average of the GPD during
% the economic stability of the country. It reflects the
Economic growth the last five years
country’s efforts to promote economic growth.
The extent to which the poverty condition of the families
(E3) 2018—Poverty Index Estimated by the percentage of people living in
% undermines the collection of the payments and increases
(PL) extreme poverty (currently set at $1.90 a day)
the customer churn rate.
Estimated by the percentage of people having The extent to which the potential project is affected by
(E4) 2018—Financial access to at least one financial service the lack of evidence of the consumer’s credit history. It
%
Inclusion (including bank account, credits, loan, equity, represents a risk to the energy provider who assumes the
and insurance products) consumer’s responsibility in repaying debts.
(C1) Potential off-grid The extent to which the project is impacted by the new
Estimated by the total number of potential
households (without Number of households potential installations within a community. The higher
households without access to electricity
electricity access) the number of households, the better.
The extent to which the project sustainability is affected
(C2) Dispersion index Estimated by the population density of the by low-density communities, namely how scattered is
Number of
(potential off-grid potential site. In this case, the potential number the community within each potential region. This index
households/km2
(C) households/area) of off-grid households per unit area increases/decreases the total installation and operations
Commercial and maintenance (O&M) costs of the project
The extent to which the project’s commercial operation is
affected by the lack of local people owning a cell phone,
(C3) 2018—Rural Mobile Estimated by the percentage of people (>5 years
% required for the monetary transactions. It is important to
phone ownership old) living in rural areas, that own a cell phone
guarantee the success of the energy prepaid model used
by most off-grid energy companies.
Estimated by the total investment for rural The extent to which the local government is investing in
(C4) Solar PV
electrification projects based on solar PV energy solar energy for rural electrification and in particular, if
Investment-National rural US $M
and included in the National rural there are available funds to provide financing for solar
electrification plan
electrification plan PV projects in the country.Sustainability 2021, 13, 7546 9 of 21
Table 2. Cont.
Descriptors of Performance (Brief
Dimension Criteria Unit of the Descriptor Relevance
Description)
The extent to which the project is impacted by the
Estimated by the Global Horizontal Irradiance
availability of local solar energy resources. In rural and
(kWh/m2 ). It is the total amount of shortwave
(T) Technical (T1) Solar energy potential kWh/m2 remote areas, having robust systems with high reliability
terrestrial irradiance received by a surface
is an important advantage due to the logistical
horizontal to the ground
difficulties in providing maintenance.
The extent to which the project is impacted by the
Estimated by the percentage of conservation
percentage of protected areas (e.g., natural parks,
areas that receive protection because of their
(Env1) Protected Areas % indigenous settlements or marine reserves),
recognized natural, ecological, or cultural
increasing/decreasing the installation and O&M costs of
values
(Env) Environmental the project.
The extent to which the commercial operation of the
(Env2) Average terrain Estimated by the altitude (above sea level) of project is affected by the topography of the project
m.a.s.l.
elevation the project potential location location, measured by the easiness of accessing the
community due to its terrain elevation.
The extent to which the commercial operation of the
project is affected by the lack of local technicians with a
Estimated by the percentage of the population
(S1) Rural Illiteracy rate % minimum level of education. Hiring local technicians
(>15 years old) that can read and write
not only reduces the installation and O&M costs but also
(S) increases community acceptance.
Social The extent to which the potential location provides a
good level of safety for the technical staff
Estimated by the Global Peace Index which
installing/operating the systems in the community.
(S2) Security Level measures the level of peacefulness within a points
Some indicators included in this score are the number
country
and duration of internal conflicts, the number of
homicides per 100,000 people, among others.Sustainability 2021, 13, 7546 10 of 21
However, in this model, the potential off-grid locations presented different perfor-
mances (the performance profile of each option is presented in Table S2 of the Supple-
mentary Material of this paper) within the different evaluation criteria, thus, the process
of choosing the option with the best performance was complex. If there had been an
option that outperformed the others in every criterion, the choice would have been intu-
itive and there would have been no need to apply the M-MACBETH software to support
the decision.
2.1.2. Building the Additive Evaluation Model
After the classification of the options according to each FPV, we proceeded to the
construction of the multi-criteria additive evaluation model. Following the MACBETH
approach, we built the value functions for each FPV. This process was done by requesting
the DM to define two reference levels (or anchors) in terms of performance for each FPV: a
reference of “Neutral” performance and a reference of “Good” performance, explaining
that the former refers to the level below which there are the unattractive options or from
which the DM set a minimally satisfying performance and the latter refers to the level above
which there are the most attractive or outstanding options with satisfying performance.
The partial values (v j ) of these anchors for a criterion j are defined as: v j ( good) = 100 and
v j (neutral ) = 0. These references helped us to investigate whether each option had an
undesirable (worse than Neutral), satisfactory (from Neutral to Good) or an outstanding
(better than Good) performance [53]. As a result, Table 3 presents the reference levels for
each descriptor.
Table 3. Reference levels (‘good’ and ‘neutral’) and attractiveness of each criterion.
Reference Values
Ranking of
Dimension Criteria Neutral
Good Importance
(Acceptable)
(E1) 2018—GDP per capita 5000 6000 4
(E2) 2013–2018 Average GDP growth—
Economic 3 7 3
5 years
(E3) 2018 Poverty Index (PL) 30 20 5
(E4) 2018 Financial Inclusion 60 80 8
(C1) Potential off-grid
40,000 80,000 1
households (without electricity access)
(C2) Dispersion index (potential off-grid
Commercial 0.5 1 2
households/area)
(C3) 2018 Rural Mobile phone ownership 50 60 6
(C4) Solar PV Investment-
200 M 400 M 9
National rural electrification plan
Technical (T1) Solar potential Medium Very High 11
(Env1) Protected Areas 10 0 12
Environmental
(Env2) Average terrain elevation 110 50 13
(S1) Rural Illiteracy rate 10 5 7
Social
(S2) Security Level 4 0 10
Afterwards, to build the value functions for each FPV, the DM was requested to give a
qualitative judgment on the difference of attractiveness between levels of performance of
the respective FPV. To model the differences in preference, the DM used one of the seven
MACBETH categories for the judgments, namely: “extreme”, “very strong”, “strong”,
“moderate”, “weak”, “very weak”, and “no” difference. If unsure about the difference of
attractiveness, the DM could choose more than one qualitative rating. If any two options
were considered to be equally attractive during the ranking process, they were assigned
a “no” in the matrix [30]. Then, after checking for no remaining inconsistencies, these
judgments were processed by the M-MACBETH and the program proposed a quantitativeSustainability 2021, 13, 7546 11 of 21
value function for each FPV (See Figure S1 of the Supplementary Material). This quan-
titative value function represents the judgments of the DM and assigns value scores to
the levels of each performance descriptor relative to the fixed scores of 0 and 100 (i.e.,
the neutral and good reference levels in the model). As a simplification (and to expedite
the decision meetings), this model assumes a linear relationship between performance
and score, namely a linear value function that measures the attractiveness of each site
alternative within each FPV [31]. This additive aggregation is represented by the value
function model defined in Equation (1):
n
V(xi ) = ∑ wj vj (xi ), (1)
j=1
With,
n
∑ wj = 1
j=1
wj > 0
vj xi+ = vj (0 goodi ) = 100
vj x0i = vj (neutrali ) = 0
i = 1, . . . , m and j = 1, . . . , n
where i = 1, . . . , m represents each site alternative and j = 1, . . . , n designates each
evaluation criterion (e.g., Dispersion Index); wj are the scaling constants or the weight-
ing coefficient assigned to criterion j multiplied by the partial value score vj (xi ); x0i and
xi+ are, respectively, the neutral and good performance levels defined for each perfor-
mance descriptor, and V(xi ) is the overall score of alternative xi that measures its global
attractiveness. As a result, the most appropriate off-grid location results from max V in
Equation (1).
2.1.3. Computing the Weighting Coefficients
In order to measure the added benefit of each potential off-grid location, we de-
fined the weighting coefficients of each criterion that needed to be defined. According
to Marques et al. [20], weighting coefficients are ‘scaling constants’ that transform partial
scores (in each criterion) into global scores. For each criterion, these coefficients represent
the importance that the DM gives to the swings in performance (e.g., from ‘neutral’ to
‘good’). Thus, after establishing how well each off-grid site alternative performs on each
criterion, those performances must be combined or aggregated to have an overall score for
each potential site. This stage of the model evaluation consisted of ranking the criteria by
decreasing order of attractiveness, considering a switch from “neutral” to “good” refer-
ence level of each criterion. For this purpose, we used the MACBETH qualitative swing
weighting process [54] and the following question was asked: “Presume that one of the
alternatives is expected to have a low (‘Neutral’) performance on all 13 criteria; on which
criterion would a swing from ‘Neutral’ to ‘Good’ be most attractive?” The same question
was made for the second most important criterion, and so on until the last criterion was
included. The final ranking is presented in Table 3. Then, the DM compared qualitatively
the most important swing to each of the others and finally, followed by the comparison of
each two swings consecutive in the ranking.
As each DM’s judgment was given, the M-MACBETH software automatically verified
the matrix consistency and suggested judgments modifications that were used to fix the
detected inconsistencies. Finally, the software proposed a set of weighting coefficients that
were compatible with the DM’s qualitative judgments. With these weights and the partial
value function vj (xi ) of each option for each criterion, the software also computed the global
attractiveness of each option. This overall score resulted from the additive aggregation of the
weights and performance of each option within each criterion, as defined in Equation (1).Sustainability 2021, 13, 7546 12 of 21
2.1.4. Testing the “Requisiteness” of the Model
As presented in Figure 1, the last step of the multi-criteria modelling consists of
validating the model. This process required performing a sensitivity analysis. Thus, we
modelled some susceptibilities and assessed the model’s consistency. In particular, we
evaluated how a change in any of the weights (within the allowed interval) would affect
the overall scores of the options, and, to a greater extent, possibly change the model’s
recommendation. To facilitate this process, we first asked the DM to examine and confirm
the weights and then to identify the weights whose values he was not certain about. Finally,
we validated and analysed the effect on the alternatives’ overall score.
3. Results and Discussion
In this study, we applied a multi-criteria decision analysis approach, namely an
additive value model, to evaluate the performance of three potential site options for
implementing an off-grid solar PV project. By using the MACBETH approach and software
we could provide an overview of the performance profiles of the assessed options, rank each
site alternatives according to a sustainability scale, identify the main factors influencing the
site selection process and show the remaining challenges that investors and policymakers
need to overcome to guarantee the sustainability of off-grid solar PV projects in developing
countries. In this section, we present the main results of the implemented sustainability
assessment process. These results only represent one type of stakeholder, namely the
private sector or developers of off-grid solar PV projects.
Based on the weighting procedure presented in Section 2.1.3, the DM ranked the
criteria, and with his qualitative judgments, the M-MACBETH software provided the
numerical weights for each criterion, as illustrated in Table 4.
Table 4. Weights of criteria and associated dimension.
Weight of
Dimension Weight (%) Criteria
Criteria (%)
(E1) 2018—GDP per capita 12.71
(E2) 2013–2018 Average GDP
Economic 42.16 12.71
growth—5 years
(E3) 2018 Poverty Index (PL) 11.52
(E4) 2018 Financial Inclusion 5.22
(C1) Potential off-grid households
18.47
(without electricity access)
(C2) Dispersion index (potential
16.52
off-grid households/area)
Commercial 45.75
(C3) 2018 Rural Mobile phone
8.91
ownership
(C4) Solar PV Investment-
1.85
National rural electrification plan
Technical 1.2 (T1) Solar energy potential 1.2
(Env1) Protected Areas 0.87
Environmental 1.53
(Env2) Average terrain elevation 0.66
(S1) Rural Illiteracy rate 7.83
Social 9.36
(S2) Security Level 1.53
The obtained weights have a direct influence on the final decision because they allow
the DM to evaluate the most critical dimension and criterion affecting the selection of
an off-grid market. The resulting matrix of judgments is presented in Table S4 of the
Supplementary Material of this paper.
Accordingly, the sum of each criterion yielded to the total weight assigned to each
dimension. Overall, the Economic and Commercial dimensions report the highest importance
compared to the other dimensions: 45.75% and 42.16%, respectively. In contrast, theSustainability 2021, 13, 7546 13 of 21
Technical dimension has the lowest effect on the final decision, weighing 1.20%. This result
suggests that the Solar energy potential criterion was not considered a determinant factor to
have a preferred option, mainly because the three site options exhibit a similar performance,
having a very high potential (i.e., GHI > 4.5 kWh/m2 ) (The performance profile of each
option is included in Table S2 of the Supplementary Material of this paper). Thus, none of
the options outperforms the others in this criterion. Figure 5 shows the relative weights for
each criterion within the five dimensions. The Potential off-grid households and the Dispersion
index represent the criteria with the highest importance compared to the other key factors:
18.47% and 16.52%, respectively. This result evidence the importance of the project size
(i.e., the number of households without electricity access) not only to guarantee financial
viability but to prioritise the communities where the project could impact more lives. This
value refers to the number of new connections that the company should make to meet its
costs, that is, to break even and, according to the DM, it has a value between 5000 and 8000.
Figure 5. Weights for each criterion (by decreasing order) and associated dimension according to the DM’s preferences.
Regarding the Dispersion index, it was considered as the second most influencing
criterion, because the installation of the systems and the associated installation and O&M
costs depend on how scattered the potential community within each potential region is.
Figure 5 also evidences that the Protected areas (%) and the Average terrain elevation
(m.a.s.l.) criteria have the lowest weights on the selection of an off-grid market: 0.87% and
0.66%, respectively. In this respect, it was clear that rural electrification investments must
acknowledge the special geographic conditions of the regions where off-grid communities
are usually settled. Therefore, an additional margin on the operation and maintenance
costs is often included to cover the expenses of projects exhibiting logistical constraints. As
a result, the obtained weights for these criteria suggest that no matter the off-grid project
location is, investors must cope with the local environmental constraints, and thus, for this
particular case, these two criteria have not a determinant influence (both weights sum up
1.53%) on the final selection of the potential site.
Having the relative weights for each criterion, it was possible to determine the associ-
ated sustainability assessment score for each option (i.e., La Guajira (Colombia), Loreto
(Peru) and Pando (Bolivia)), across all the dimensions and criteria. In particular, Figure 6
presents the scores associated with each dimension by country. These scores represent the
degree to which each dimension contributes to each option’s sustainability.Sustainability 2021, 13, 7546 14 of 21
Figure 6. Radar chart presenting the decomposition of each dimension score for each country.
As presented in Figure 6, Colombia has the best performance in terms of the Com-
mercial, Environmental and Social dimensions, which have a direct influence on the site
selection in about 57% (See Figure 5), whereas Peru has a better performance in the Eco-
nomic dimension. Figure 6 also shows that the Commercial, Economic and Environmental
dimensions are determining factors between the worst options, making Bolivia less attrac-
tive than Peru.
Additionally, in order to provide a more structured approach to evaluate the prospec-
tive potential market, we addressed another question: “what are the biggest differences
between the options, in terms of the criteria?” As a result, all the criteria were evaluated in-
dividually for each of the potential regions. reports the final values of the aggregate scores
associated with each criterion, based on a 0 (neutral) and 100 (good) scale of reference.
Figure 7 displays more clearly the biggest differences between the positive and nega-
tive scores across the options. In particular, it reveals why Colombia has a better overall
score. Also, it shows that Colombia and Peru are mainly positively scored options and
most of the criteria are weighted above neutral, especially in Colombia. By paralleling the
scores of Colombia and Peru (the two best options), we observed that Colombia has a better
performance in terms of the Potential off-grid households and the Dispersion Index, a similar
performance for GDP per capita, Solar potential, and Security level. The only downside for
Colombia is the Average GDP growth that is below the neutral, representing a low increase
in economic performance compared to Peru and Bolivia.
The Rural Illiteracy rate criterion is a common punishing factor between options,
which shows the low potential of finding skilled personnel in the three regions. Also,
the Dispersion Index has another negative effect on the global score. These two FPV have
an impact weight of 7.83% (Rural Illiteracy rate) and 16.52% (Dispersion) and they will be
evaluated in the sensitivity analysis.
On the other hand, by comparing Bolivia and Peru, we noticed that Bolivia only has
six positive weighted criteria (i.e., values in Average Terrain Elevation (Env2), Solar Potential
(T1), Solar PV investment (C4), Mobile phone ownership (C3), Potential off-grid households (C1)
and Average GDP growth (E2)). In particular, the GDP per capita criterion with an overall
weight of 12.71% (see Figure 5) has the worst effect on Bolivia’s global score, representing
an entry barrier and a less appealing option for the DM.Sustainability 2021, 13, 7546 15 of 21
Figure 7. Decomposition of each criterion score by country option. Note: Highest criteria score in
green, lowest in red.
As previously illustrated in the value tree shown in Figure 4, there are five primary
dimensions for the off-grid site selection problem. Looking at the results, it was clear
that Colombia was the best option in terms of the Commercial, Environmental, and Social
dimensions. However, there were some divergences on the Economic dimension with Peru
having a better performance in this respect. Figure 8 presents an XY map to compare the
options’ scores in a bi-dimensional graph between two criteria or dimensions. In this case,
the line that connects the options maximizes the score for the Economic dimension. The
previous analysis showed that although there were three options, only two of them had
positive overall results, so it was expected that the efficient frontier only took Colombia and
Peru into account. As mentioned earlier, the weight of the Economic dimension is 42.16%
(12.71% from GDP per capita, 12.71% from Average GDP growth, 11.52% from Poverty Index,
and 5.22% from Financial Inclusion). We used this result as a starting point for sensitivity
analysis of the best two options found.Sustainability 2021, 13, 7546 16 of 21
Figure 8. XY Map—Site selection vs. Economic dimension.
On the other hand, the application of the model enabled the DM to appraise the
potential alternatives under consideration. After considering the scores for each criterion
and the associated weights, the model proposed Colombia as the most attractive option
given the DM’s judgments. This country has the best score (98.23 on a scale of 0 to 100),
leading over Peru (the second-best option) by about 27 points.
Based on the sustainability score attained by each country and also on the definition
used to set the good and neutral levels of reference associated with each criterion, we
categorised the countries’ sustainability as follows [20]:
• Highly sustainable: if the potential site has a score above 100 (i.e., more sustainable
than a country that has a performance equal to the ‘good’ level in all criteria).
• Sustainable: if the potential site has a score between 0 and 100 (i.e., it represents the
minimum acceptable level)
• Unsustainable: if the potential site has a score below 0 (i.e., less sustainable than a
country that has a performance equal to the ‘neutral’ level in all criteria).
As we present in Table 5, the off-grid solar PV project in La Guajira, Colombia, has
the best performance in the sustainability assessment, namely, it represents the highest
sustainable option for a project investor, among the remaining site options. Table 5 also
shows that not all the alternatives have a positive evaluation score, which suggests that
Bolivia is a low viability alternative or an unsustainable option for the DM, with a score
of −28.56. None of the options has a highly sustainable score, meaning that none of
the countries represents an outstanding option, however, Colombia and Peru, are the
alternatives with a minimally satisfying performance according to the DM’s judgments
of preference.
Table 5. Global Scores for the most appropriate market option and the associated level of sustainability.
Market Option Global Score of Appropriateness * Country’ Sustainability
Colombia 98.23 Sustainable
Peru 71.56 Sustainable
Bolivia −28.46 Unsustainable
* The larger the score, the most appropriate the site, based on a 0 (neutral) and 100 (good) scale of reference.
3.1. Sensitivity Analysis
We also performed a sensitivity analysis to validate the consistency of these outcomes.
The purpose of sensitivity analysis is to refine the decision model, with the ultimateSustainability 2021, 13, 7546 17 of 21
objective of obtaining a requisite model, which when subjected to sensitivity analysis,
yields no new intuitions [51]. There are several types and tools of sensitivity analysis.
Simple one-way sensitivity graphs can be carried out using tornado diagrams and spider
graphs. Also, sensitivity analysis simultaneously accounting for many variables can be
done using Monte Carlo simulation models. In this study, we used the M-MACBETH
software to assess the consistency of the final ranking of the countries’ alternatives.
We tested the model using two scenarios where we studied the susceptibility of the
overall score of the options, by making small variations of one criterion weight at a time.
This analysis was performed on the positive overall scored options (Colombia and Peru).
Figure 9 shows the modifications that occur from modifying the weight of a criterion
while maintaining the proportion between the remaining criteria weights. Figure 9a shows
that the model’s result is not sensitive to variations on the weight of the Potential off-grid
households. This means that the relative global scores of the countries’ alternatives remain
unmodified, and Colombia continues to be the most sustainable option. This is relevant
when considering that this criterion has the highest influence in the evaluation model, i.e.,
the highest weight (18.47%).
Figure 9. Sensitivity analysis on weight for criterion: (a) Potential off-grid households; (b) Poverty Index.
As previously perceived, Colombia is always preferable to Peru in terms of the Com-
mercial, Environmental, and Social dimensions, but in terms of the Economic dimension,
there were some doubts about the sensitivity of the weight obtained. In this dimension,
Colombia had similar behaviour in the following criteria: GDP per capita, Average GDP
growth and Financial Inclusion, compared to Peru. Figure 9b shows the Economic dimension
susceptibility in terms of the Poverty Index. If we increase the weight of this criterion
from 11.52% to 37.8%, the final overall relative score changes and the model proposes
Peru as the most attractive alternative. However, this is less likely to occur since there are
other economic important criteria to consider in the decision-making process, such as the
GDP per capita, and the Average GDP growth representing a total weight of 25.42% on the
final selection.
Both situations were validated with the DM and no change in weights was required.
It is worthy to mention that in terms of the Commercial, Environmental and Social dimen-
sions, both countries had divergent scores for the set of criteria, so no matter the weight,
Colombia is always the most suitable site option.
There are two possible areas for further work. First, we propose to validate the
obtained set of criteria, by calibrating this model with the input of other decision-makers
(e.g., other off-grid energy utilities, actors from the local government and experts from the
academic sector) to reflect a diversity of stakeholder views. Second, we suggest to include
additional factors that were not considered in this study, namely the following criteria:Sustainability 2021, 13, 7546 18 of 21
Community acceptance (i.e., to guarantee the successful implementation of an off-grid system,
the project should fit well into the socio-cultural context of the community) and Political
environment (i.e., the extent to which the potential business is impacted by the political
stability of the country), which could also contribute to the long-term sustainability of
off-grid projects. Finally, it would be useful to provide a detailed discussion of how to
make those regions not selected, more attractive to investors.
3.2. Policy Implications
The definition of sustainable rural electrification programs and policy guidelines
depends on considering the point of view of different stakeholders, such as utility com-
panies, providers, academia, and the public sector. Having each sector’s insights creates
a collaborative visualisation and understanding of the regulatory, financial, economic,
environmental, social, and technical needs to guarantee the long-term sustainability of
off-grid projects, regarding of the type of technology.
In this study, we focused on identifying key sustainability criteria for implementing
off-grid projects based on the private sector perspective. These indicators are of different
relevance depending on the key actor’s perspective. For instance, for private companies, a
higher GDP per capita gives more confidence that the off-grid project will be successful. In
contrast, the public sector could give more relevance to a lower GDP per capita, because
the government wants to have a maximal impact on poverty.
In consequence, it is essential to incorporate the private sector’s concerns into the
rural electrification policy and, in particular to the process of designing rural electrification
mechanisms that incentivise the private capital participation in off-grid projects by offering
an adequate investment environment for private companies. The MCDM method carried
out in this paper can be replicated to assess other potential off-grid locations and thus, to
roll out electricity access programs in developing countries.
4. Conclusions
Selecting the most appropriate site for implementing off-grid solar PV projects, is one
of the key decisions that private investors face within the rural electrification sector. In this
paper, we implemented a multicriteria model to support a decision-maker representing
the private sector’s point of view, in evaluating the performance of three off-grid site
alternatives against 13 criteria grouped in 5 sustainability dimensions.
Through analysing the three options with the MACBETH approach and software,
we found that Colombia and Peru are the most sustainable alternatives based on their
associated global score (98.23% and 71.56%, respectively). In addition, the number of
Potential off-grid households is the criterion with the highest influence on this evaluation
model, with a weight of 18.47%. Overall, the Economic and Commercial dimensions have
a direct influence (in about 88%) on the decision making of selecting the most appropriate
off-grid location to implement stand-alone solar PV projects.
In summary, the main contribution of this paper is threefold: first, we provided a useful
roadmap for MCDM modelling through participatory processes, with a practical example
on how to structure a model considering the case of developing countries, and in particular,
the context of off-grid rural electrification projects. Second, we identified key criteria and
associated descriptors of performances that contribute to achieving sustainability in the
off-grid energy sector. We integrated two additional sustainability dimensions to the TBL
approach, namely the technical and commercial criteria. These additional dimensions
build upon the technical and non-technical features that influence the decision-making of
selecting the most appropriate off-grid site to implement solar PV projects, based on the
private sector’s point of view. Third, our general findings may offer some direction for
project developers and potential investors willing to undertake their own sustainability
assessments. In particular, this methodology can be applied to evaluate other regions,
namely, to identify and prioritise geographical areas for the provision of electricity access.Sustainability 2021, 13, 7546 19 of 21
Supplementary Materials: The following are available online at https://www.mdpi.com/article/10
.3390/su13147546/s1, Figure S1: Value function for the “Potential off-grid households” criterion (M-
MACBETH software); Figure S2: Matrix of judgments for the “Potential off-grid households” criterion
(M-MACBETH software); Figure S3: Weighting matrix of judgments (M-MACBETH software); Figure
S4: Table of rankings for each criterion (M-MACBETH software); Table S1: Constructed performance
scale for each criterion; Table S2: Performance Profile of the Options (M-MACBETH software); Table
S3: MACBETH categories used by the DM to model the differences in preference; Table S4: Final
weighing matrix of judgments and associated weighting scale.
Author Contributions: Conceptualization, L.M.H.-O., P.M.S.C. and C.M.S.C.d.J.; methodology,
L.M.H.-O.; software, L.M.H.-O.; validation, L.M.H.-O.; formal analysis, L.M.H.-O.; investigation,
L.M.H.-O.; resources, L.M.H.-O.; data curation, L.M.H.-O.; writing—original draft preparation,
L.M.H.-O.; writing—review and editing, P.M.S.C. and C.M.S.C.d.J.; visualization, L.M.H.-O.; supervi-
sion, P.M.S.C. and C.M.S.C.d.J.; project administration, L.M.H.-O., P.M.S.C. and C.M.S.C.d.J.; funding
acquisition, L.M.H.-O. All authors have read and agreed to the published version of the manuscript.
Funding: This paper is part of the first author’s doctoral research. This work is supported by the
Governorates of the Atlántico Department through the Colombian Department of Science, Technology,
and Innovation (COLCIENCIAS) scholarship No. 673. The findings and recommendations in this
paper are the sole responsibility of the authors and may not represent the views of the funding
sources.
Institutional Review Board Statement: Not applicable.
Informed Consent Statement: Not applicable.
Data Availability Statement: The data presented in this study are available in Supplementary
Materials.
Acknowledgments: We would like to thank to J. Rodriguez for the useful discussions and for
providing valuable information to the first author’s research work.
Conflicts of Interest: The authors declare no conflict of interest. The funders had no role in the design
of the study; in the collection, analyses, or interpretation of data; in the writing of the manuscript, or
in the decision to publish the results.
References
1. IEA; IRENA; UNSD; World Bank; WHO. Tracking SDG 7: The Energy Progress Report; World Bank: Washington, DC, USA, 2020.
2. IEA; IRENA; UNSD; World Bank; WHO. Tracking SDG 7: The Energy Progress Report; World Bank: Washington, DC, USA, 2021.
3. IEA; IRENA; UNSD; World Bank; WHO. Tracking SDG 7: The Energy Progress Report; World Bank: Washington, DC, USA, 2018.
4. Williams, N.J.; Jaramillo, P.; Taneja, J.; Selim, T. Enabling private sector investment in microgrid-based rural electrification in
developing countries: A review. Renew. Sustain. Energy Rev. 2015, 52, 1268–1281. [CrossRef]
5. Eras-Almeida, A.A.; Fernández, M.; Eisman, J.; Martín, J.G.; Caamaño, E.; Egido-Aguilera, M.A. Lessons learned from rural
electrification experiences with third generation solar home systems in latin America: Case studies in Peru, Mexico, and Bolivia.
Sustainability 2019, 11, 7139. [CrossRef]
6. Louie, H.; Dauenhauer, P.; Wilson, M.; Zomers, A.; Mutale, J. Eternal light: Ingredients for sustainable off-grid energy development.
IEEE Power Energy Mag. 2014, 12, 70–78. [CrossRef]
7. Aldrin Wiguna, K.; Sarno, R.; Ariyani, N.F. Optimization Solar Farm site selection using Multi-Criteria Decision Making
Fuzzy AHP and PROMETHEE: Case study in Bali. In Proceedings of the 2016 International Conference on Information &
Communication Technology and Systems (ICTS), Surabaya, Indonesia, 12 October 2016; pp. 237–243. [CrossRef]
8. Rahman, M.M.; Paatero, J.V.; Lahdelma, R. Evaluation of choices for sustainable rural electrification in developing countries: A
multicriteria approach. Energy Policy 2013, 59, 589–599. [CrossRef]
9. Cherni, J.A.; Dyner, I.; Henao, F.; Jaramillo, P.; Smith, R. Energy supply for sustainable rural livelihoods. A multi-criteria
decision-support system. Energy Policy 2007, 35, 1493–1504. [CrossRef]
10. Fuso Nerini, F.; Howells, M.; Bazilian, M.; Gomez, M.F. Rural electrification options in the Brazilian Amazon. A multi-criteria
analysis. Energy Sustain. Dev. 2014, 20, 36–48. [CrossRef]
11. Zhang, J.; Xu, C.; Song, Z.; Huang, Y.; Wu, Y. Decision framework for ocean thermal energy plant site selection from a sustainability
perspective: The case of China. J. Clean. Prod. 2019, 225, 771–784. [CrossRef]
12. Fetanat, A.; Khorasaninejad, E. A novel hybrid MCDM approach for offshore wind farm site selection: A case study of Iran.
Ocean Coast. Manag. 2015, 109, 17–28. [CrossRef]
13. Latinopoulos, D.; Kechagia, K. A GIS-based multi-criteria evaluation for wind farm site selection. A regional scale application in
Greece. Renew. Energy 2015, 78, 550–560. [CrossRef]You can also read


