Limousine Service Management: Capacity Planning with Predictive Analytics and Optimization
←
→
Page content transcription
If your browser does not render page correctly, please read the page content below
Limousine Service Management: Capacity Planning
                                               with Predictive Analytics and Optimization
                                                                                                Peng Liu
                                                    Department of Statistics & Applied Probability, National University of Singapore, peng.liu@u.nus.edu

                                                                                               Ying Chen
                                                            Department of Mathematics, National University of Singapore, matcheny@nus.edu.sg

                                                                                           Chung-Piaw Teo
                                                    Institute of Operations Research and Analytics, National University of Singapore, bizteocp@nus.edu.sg
arXiv:2009.05422v1 [stat.AP] 11 Sep 2020

                                              The limousine service in luxury hotels is an integral component of the whole customer journey in the
                                              hospitality industry. One of the largest hotels in Singapore manages a fleet of both in-house and outsourced
                                              vehicles around the clock, serving 9000 trips per month on average. The need for vehicles may scale up
                                              rapidly, especially during special events and festive periods in the country. The excess demand is met by
                                              having additional outsourced vehicles on standby, incurring millions of dollars of additional expenses per
                                              year for the hotel. Determining the required number of limousines by hour of the day is a challenging service
                                              capacity planning problem. In this paper, a recent transformational journey to manage this problem in
                                              the hotel is introduced, driving up to S$3.2 million of savings per year with improved service level. The
                                              approach builds on widely available open-source statistical and spreadsheet optimization tools, along with
                                              robotic process automation, to optimize the schedule of its fleet of limousines and drivers, and to support
                                              decision-making for planners/controllers to drive sustained business value.

                                              Key words : demand forecasting; scheduling; process automation; hospitality

                                           Introduction
                                           High-end hotels offer their guests a touch of chauffeur-driven luxury for direct airport and
                                           city transfers to major destinations within the city in a limousine vehicle of their choice.
                                           This service is often the first point of contact for the hotels to shape the service experience
                                           of their guests. Upon arrival, the VIPs are greeted by a driver and swiftly brought to their
                                           destination in comfort. Since most of the customers are hotel guests staying at suite level or
                                           above, a high level of vehicle availability is required to ensure a smooth customer journey.
                                           Furthermore, before the start of a shift, drivers engaged for this service would need to
                                           ensure that the cars are in good condition for the VIPs. Timely recording of each stage
                                           of a trip from start to end is also done to provide immediate feedback for the planning
                                           system to manage operational productivity and service availability.
                                             Given stringent service standards, a new driver is usually trained for weeks and scored
                                           based on audit performance before being deployed to serve the VIPs. Outsourcing this
                                                                                                     1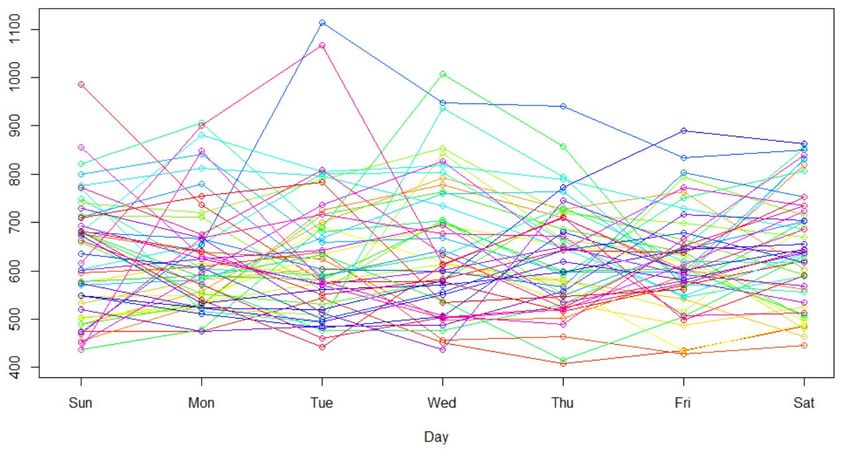
Liu, Chen and Teo: Limousine Service Management
2                                                           Article submitted to Interfaces; manuscript no. 047-05-20-OM

service to popular ride hailing platforms is not viable, despite the fast growth of the latter
in recent years (See Figure 1 for the growth in the private car hire sector in Singapore,
over the last eight years). Ride hailing platforms offer higher service availability due to the
larger fleet size, but falls short of the exclusive service standards and experiences offered
by professional, in-house drivers of the hotel.

Figure 1   The number of private hire cars in Singapore from 2012 to 2019, both self-drive and chauffeured. Source
           is https://www.statista.com/statistics/953848/number-of-private-hire-cars-singapore/

    This paper describes the transformation journey of a hotel in Singapore in managing this
limousine service provision problem. Boasting a luxury clientele with high expectations,
the hotel in our study is the leading destination for business, leisure and entertainment in
Singapore. It offers an exquisite hotel, state-of-the-art convention and exhibition facilities,
theatres, world-class entertainment and arguably the best shopping and dining experience
in the region. As Singapore’s largest hotel with a significant volume of VIP clientele, the
hotel constantly faces the challenge of managing its pool of limousines to ensure that
services are available upon request, while ensuring operations are efficient and productive.
    With more than 100,000 trips to serve annually, the limousine service provisioning prob-
lem for this hotel is a daunting challenge, especially in a tight labor market like Singapore
with an increasing number of tourist arrivals each year. Moreover, demand for limousine
services in the hotel is often volatile; a fair number of guests tend to request limousine
Liu, Chen and Teo: Limousine Service Management
Article submitted to Interfaces; manuscript no. 047-05-20-OM                                3

services without prior reservation, making both timing and volume of the demands unpre-
dictable for operational planning. Since high quality and yet affordable service cannot be
fully provided using a fixed internal fleet of vehicles and drivers, the hotel has to engage
external vendors to provide a “flexible” buffer of resources available to meet demands in
the peak periods. The hotel studied in this paper has a composite fleet structure consisting
of over 70 in-house drivers and 34 limousines as its in-house fleet, and 10 other drivers and
cars from a contractor as its base fleet. The contractor can also provide additional drivers
working in flexible shifts, serving as the hotel’s disposal fleet that can be decommissioned
when no longer needed, with at least half an hour advance notice.
   Managing the delicate balance between demand and supply directly impacts the bottom
line of the limousine department. However, because outsourced vehicles need to be activated
in time to avoid “no vehicle available” situations, and because demand is erratic, the hotel
often erred on the safe side and had an excessive number of vehicles on standby, leading
to low productivity and wasted resources. The solution was not sustainable, and hence
a more scientific forecasting method beyond intuitive prediction based on experience was
needed to forecast demand and manage supply.
   The old system also relied too heavily on manual tracking of limousine bookings and
used different billing methods for the entire fleet of vehicles. Even finding a consistent way
to do the reporting proved too difficult, despite numerous attempts and efforts to stan-
dardize the format. At the same time, vendor invoicing arrangements involved separate
and independent billings to two departments (Transportation and International Market-
ing). Due to poor communication and lapses in internal controls, the hotel had substantial
billing errors. On numerous occasions, the vendor double-charged the hotel or incorrectly
charged one department’s job to the other. In addition, many discrepancies in the invoices
were unresolved and were pending resolution due to data issues in the limousine booking
system. These discrepancies contributed to delayed payments to the vendors. It was clear
that an integrated and automated system was needed to remove the process inefficiencies,
and to allow management to monitor and deploy resources.
   The study undertaken in this paper is part of the hotel’s responses to the Singapores
Smart Nation initiative, designed to prepare the country for the new digital economy. The
hotel has chosen to focus on the strategic roadmap shown in Figure 2, around the culture
of innovation, emphasizing (i) data analytics, (ii) innovative technology, and (iii) team
Liu, Chen and Teo: Limousine Service Management
4                                                           Article submitted to Interfaces; manuscript no. 047-05-20-OM

member engagement. Data analytics is at the core of data-based scientific thinking and
decision making for the hotel, as represented by its centralized forecasting and scheduling
function, which supports property-wide manpower arrangement and cross deployment.
This is further enhanced by adopting innovative technologies at both software (e.g. RPA
solutions and systems that support real-time monitoring) and hardware (e.g. automatic
laundry system and autonomous vehicles) level. The improved productivity enables its staff
to better focus on their guests, with many initiatives designed to improve guest satisfaction,
which in turn increases its profitability. The hotel also invests significantly in its cultural
development by conducting customized training programs and regular engagement sessions
with the management team, all of which purposed at shaping a caring and sustainable
culture.

Figure 2   Productivity and service strategic roadmap of the hotel in response to Singapore’s Smart Nation initia-
           tive, highlighting the three pillars - data analytics, innovative technology and team member engagement.

    Hotel management believes in the value of “Data over Anecdotes” and has in recent years
established new baseline measurements to focus on reporting cause and effect, in as near to
real time as possible. To support these efforts, the hotel has explored and installed people
counting and crowd monitoring cameras in numerous locations to generate queue and
traffic flow information in real time, has adopted beacon and radio-frequency identification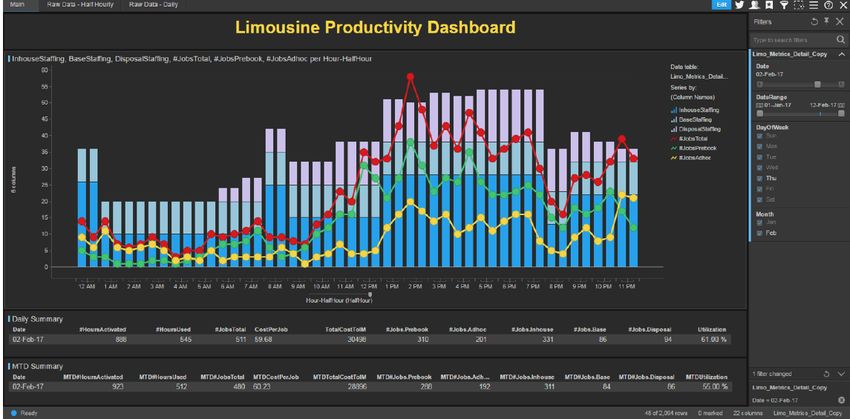
Liu, Chen and Teo: Limousine Service Management
Article submitted to Interfaces; manuscript no. 047-05-20-OM                                5

(RFID) technology to track equipment and team members, has added point-of-contact iPad
surveys at front desk and parking area, and has developed real-time streaming dashboards
using big data services and the Google Cloud Platform (GCP).
   The value of the data captured is further enhanced by robotic process automation, to
mimic or replicate a human by carrying out a series of steps that the same person would
do, to aggregate or stitch together data from multiple sources and systems automatically,
and to move data between systems. This effort has culminated in the adoption of software
robots with configurations and algorithms to automate manual, repeatable tasks.
   The limousine service provisioning problem is one of the first areas where scientific
forecasting principles and data analytics were adopted to solve operational problems in
the hotel. Using time series modelling and optimization techniques to predict transaction
volumes and manage the demand for and supply of limousines, the output is then refined
and polished using expert opinion and human edits. This combined approach allows the
hotel to schedule its supply of limousines more effectively to maintain service levels and to
increase productivity.
   The project has also revealed cross-deployment opportunities between different opera-
tions within the hotel. The project team has developed comprehensive dashboards using
Qlikview, Spotfire and R Shiny, which organize all relevant data in a structured manner
to visualize and present the information. A daily summary report is also generated for the
management to monitor key metrics such as daily and month-to-date productivity, service
level and cost. The dashboard thus aided overall management of the operations and facili-
tated timely action for improvement. Figure 3 shows the dashboard used on a typical day,
displaying the number of ad-hoc and pre-booked jobs, the total number of jobs (in line
plots), and the number of in-house, base and disposal staff (in bar plots).
   The underlying engine and decision support system have helped the hotel to make timely
and accurate decisions, with seven figure savings while achieving 99.97% vehicle availability
for 105,000 limo transfers in the year of 2016. The following sections first highlight the
encountered issues such as robust forecasting and business process automation, followed
by an in-depth review of the adopted solution and its implementation across the hotel.
The Issues
The limousine service provision problem mainly revolves around managing the delicate
balance between supply of vehicles and demand from guests, providing just enough vehicles
at the right time. To achieve this, there are three challenges:
Liu, Chen and Teo: Limousine Service Management
6                                                            Article submitted to Interfaces; manuscript no. 047-05-20-OM

Figure 3   Daily managerial dashboard for limousine operations. The hourly demand (red line) consists of pre-
           booked (green line) and adhoc (yellow line) jobs, while the hourly supply is indicated by the stacked
           bars from in-house fleet (dark blue bar), base fleet (light blue bar) and disposal fleet (light purple
           bar). Note that the data are presented at an hourly interval after inflating the job duration for ease of
           reporting, although an up-to-the-minute picture would be a more accurate depiction of the reality.

    • Accurate forecasting of demands. The operations team used to assess the weekly
demand qualitatively, based on recent demand patterns using three-period moving average
and future pre-booked jobs. Forecasting the demand for limo drivers and vehicles on a
particular day is difficult because the usage of the vehicle can vary widely depending on
the nature of the trips. Table 1 shows sample events related to the trips and the various
attributes that are used in developing the forecast. In an integrated resort that offers MICE
(meetings, incentives, conferences and exhibitions) solutions, the demand for limousine
services is often volatile. The category of an event (wedding, business meeting, etc.) and
the number of attendees for the event affect the duration of the trip. The model needs
to anticipate the number of such requests, and also the duration of usage, to arrive at a
cumulative hourly demand for limousines in the department. The model must also utilize
historical data (from past usage) and incorporate the implicit expert knowledge on the
impact of future events to build the final demand forecast.
    • Sufficient and proper deployment of limousines subject to operational constraints.
The weekly deployment of the limited resources (drivers and limousines) must cover the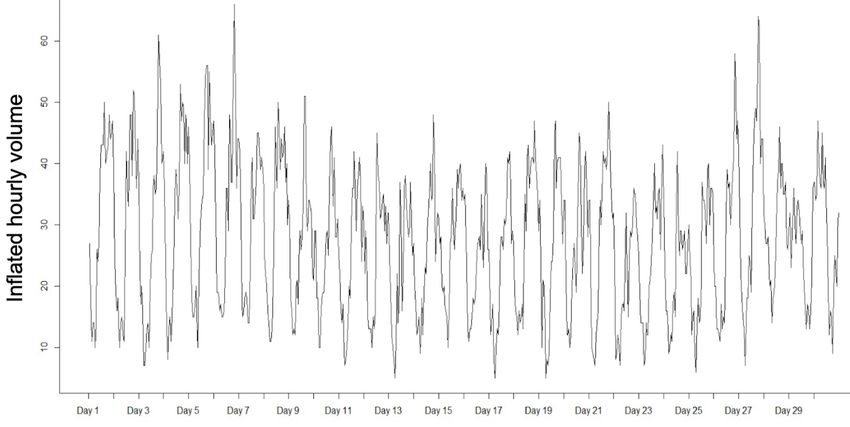
Liu, Chen and Teo: Limousine Service Management
Article submitted to Interfaces; manuscript no. 047-05-20-OM                                                7

                                      Table 1      Sample events and their attributes

     Event                    Start Time End Time              Status         Category         Attendance
     Weekly         Plan- 02/12/2016 02/12/2016 Definite                      Internal Event   40
     ning Meeting             10:00 am          02:00 pm
     Wedding Dinner 30/12/16                    30/12/16       Definite       Wedding          210
                              08:00 am          11:00 pm
     Church Service           24/12/16          26/12/16       Tentative      Local Business   5000
                              08:00 am          08:00 am
     Exhibition               20/11/16          23/11/16       Definite       Local Business   2000
                              08:00 am          08:00 pm
     Dinner & Dance 25/12/16                    25/12/16       Tentative      D&D              1000
                              08:00 am          08:00 pm

predicted demand, subject to certain operational constraints, while not incurring additional
wasted resources. For example, a driver cannot work for more than 12 hours in a single
shift, and the system can only deploy up to certain number of shifts in a single day. Such
operational constraints have led to a total of four shifts for in-house drivers in the hotel,
starting at 8am, 11am, 1pm and 9pm respectively and each lasting 12 hours for four days
in a row, followed by a four-day rest. Combined with (say) 10 fixed base fleet drivers from
the subcontractor who are available 24/7, the difference between supply and demand can
be easily derived. Figure 4 depicts a situation where the total number of cars (in-house
plus base fleet from vendor) falls short of the forecast demand forecast at 11am, 12pm, and
from 4pm to 8pm. Additional disposal vehicles need to be deployed to guarantee sufficient
coverage of the forecasted demand, subject to various operational constraints as follows:
      — A minimum of three hours, and a maximum of eight hours per shift, is required for
each activation of disposal vehicle.
      — The earliest activation starts at 5am, and the number of activated disposal vehicles
should not exceed 60 in each shift.
      — At most six shifts should be scheduled daily.
As the standard roster planning system of the hotel cannot handle these constraints all
together, the weekly schedule for disposal fleet was often produced by operational managers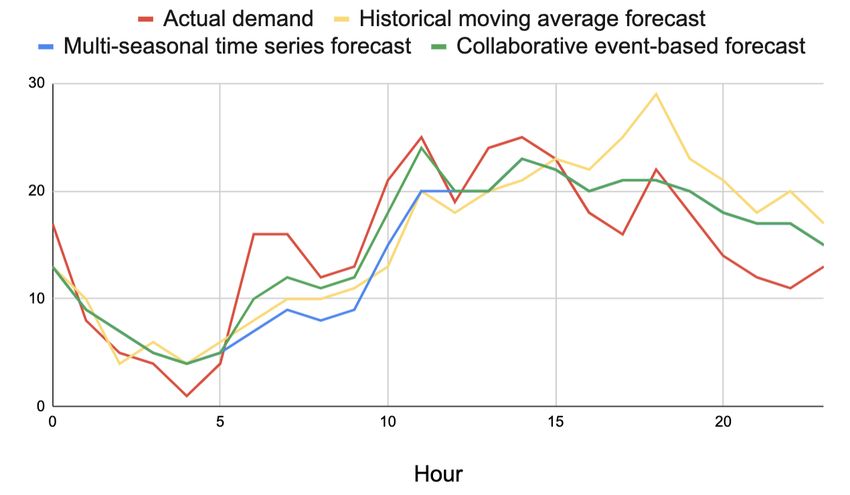
Liu, Chen and Teo: Limousine Service Management
8                                                         Article submitted to Interfaces; manuscript no. 047-05-20-OM

based on personal preferences and experiences, leading to inconsistent, unstable and sub-
optimal solutions. A customized solution based on mathematical programming is thus
desired.

Figure 4   Example of deriving hourly buffer using in-house and base fleet against forecasted demand. Hours
           with negative balance need to be served with the disposable fleet of drivers, subject to operational
           constraints

                                                      .

    • Continuous reporting and monitoring of operations. Limousine operations require near
real time monitoring of available supply and demand. To better anticipate upcoming busi-
ness volumes for the next few hours, the operations team needs constantly to generate
status reports indicating the current operational status including number of pre-booked
jobs, vehicles activated and available buffer, and to determine if additional vehicles need
to be activated. This 3-hourly process, however, takes around half an hour to run, as
it requires manually retrieving and processing data from different systems including the
business management and roster systems. Further data processing in a spreadsheet is also
required to produce the hourly metrics. Often the report generating process is interrupted
by unexpected operational challenges which require immediate attention. In addition, the
report doesn’t consider historical distributions of demand, thus giving no indication as to
whether some of the disposal vehicles could be de-activated to save cost.
Liu, Chen and Teo: Limousine Service Management Article submitted to Interfaces; manuscript no. 047-05-20-OM 9 In this paper, an integrated approach is introduced to solve the limousine scheduling problem for the hotel. In order to accurately forecast the demands so that a high service level can be achieved, the objective is to focus on minimizing the stockout situations (i.e. no-vehicle-available cases), while keeping cost low to avoid unnecessary outlays. To do this, a combination of statistical tools, spreadsheet optimization and data analytics is used to support operations in the following three ways. • A demand forecasting model was implemented effectively to predict business volume, together with an optimization model to schedule the corresponding shifts of drivers and vehicles. • Next, a mission critical bot was developed to update operational status on an hourly basis and to provide recommendations on the time and number of disposal vehicles to be stood down. • Finally, a centralized managerial dashboard was developed to display key daily perfor- mance indicators, thus enabling effective performance monitoring, scenario-based planning and decision-making. Note that several papers have approached similar manpower staffing problem from dif- ferent perspectives. For example, Chun (2010) introduced a Fleet Management System (FMS) which supports efficient scheduling and management of vehicles by utilizing open- source technology and robust scheduling procedures, while Wan et al. (2020) illustrated how taxi services can be optimized using key performance metrics such as number of pick-ups, customer waiting time, and vacant traveled distance. However, none has covered the use of statistical and optimization tools and applications in analyzing high-frequency demand data with complex seasonal patterns and multiple concurrent events, the case often encountered in the hospitality industry. Solution Overview and Implementation Demand Forecast with Time Series Model A valid limousine job consists of multiple attributes, including start time, end time, and job type. The job type could be airport arrival or departure, single trip, round trip, or disposal at guest’s will, each taking a different amount of time to complete. Different types of jobs and their typical job duration, assumed to follow an empirical normal distribution, are shown in Table 2, along with the standard deviation often observed by operations team. Note that this table is used to establish the duration of jobs with missing or incorrect
Liu, Chen and Teo: Limousine Service Management
10 Article submitted to Interfaces; manuscript no. 047-05-20-OM
information in the business management system, although a further refinement based on
hour of the day would better capture the hourly sensitivity across the day.
Table 2 Typical duration for each type of job in minutes
Job Category Mean Standard Deviation
Round Trip 95 20
Single Trip 70 15
Airport Arrival 90 20
Airport Departure 50 10
Ferry Arrival 90 20
Ferry Departure 40 10
Malaysia Transfer 360 60
In order to estimate the number of ongoing jobs per hour, or equivalently, the number
of cars required per hour, it is necessary to account for the job duration, since each job
may last more than an hour. Figure 5 illustrates the original volume and the “inflated”
ongoing jobs on an hourly basis, which represents the true business demand for limousines
for each hour.
Figure 5 Deriving the true business volume via inflating the job duration according to different type of job. The
inflated number of job (red line), an indication of ongoing business volume, is generated by taking into
account the duration of the raw jobs (blue line)
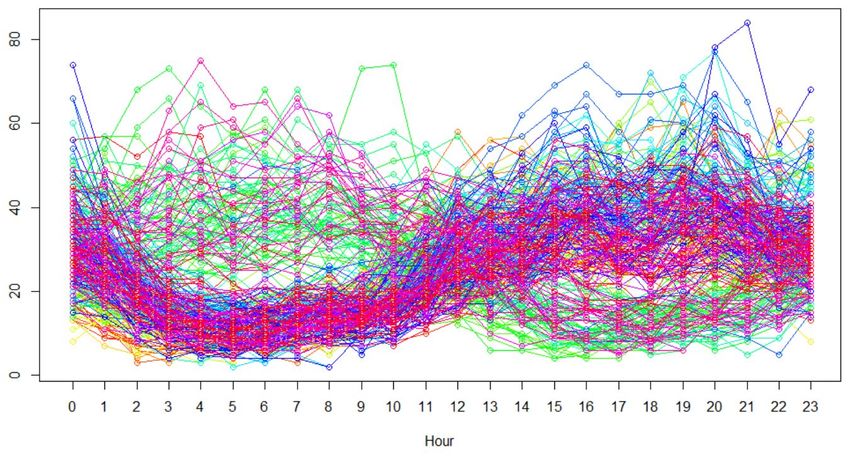
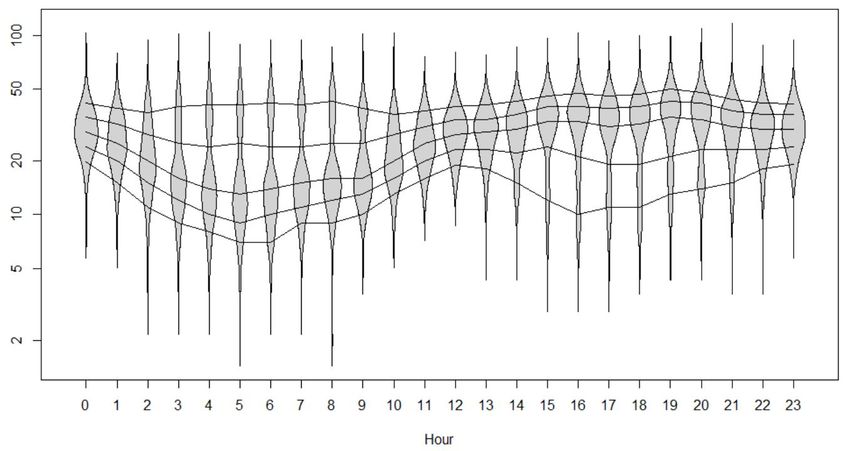
.Liu, Chen and Teo: Limousine Service Management Article submitted to Interfaces; manuscript no. 047-05-20-OM 11 Figure 6 shows the hourly number of ongoing jobs (after inflation) over a 30-day horizon. For limousine services which operate around the clock, the business demands can exhibit multiple seasonality patterns. For example, the hourly number of guests requesting limou- sine services has a short term daily seasonal pattern, a weekly seasonal frequency, and a longer annual seasonality pattern. To forecast demand in this problem, the underlying trend and seasonality need to be uncovered from the data. Figure 6 Inflated hourly volume over 30 days. To gain a better understanding of the seasonal component in the time series, the inflated hourly volume across the whole year of 2017 is visualized in both line chart and bean plot (see Figure 7). Demand volume typically starts to increase gradually from around 12pm, peaking between 5pm and 10pm, with considerable volume arising towards the end of the day. These peaks are consistent with our observation that most guests tend to engage in entertainment activities and explore the night life at the hotel and in Singapore, leading to higher volume in the evening than in the morning hours. The hour-of-the-day seasonality is fairly consistent across the whole period, except for certain periods when external factors such as major events in the city (e.g. a concert by a well known singer) result in atypical volume on a certain day. Moreover, by aggregating daily volume as a whole and plotting aggregated volume by each day of week, a certain level of seasonality is also observed as shown in the last graph in Figure 7. In general, business volume from Friday to Sunday is heavier than from Monday to Thursday, as more guests engage in leisure activities over the weekend.
Liu, Chen and Teo: Limousine Service Management
12                                                         Article submitted to Interfaces; manuscript no. 047-05-20-OM

Figure 7   Inflated hourly volume across 2017, where each line in the first graph represents one day’s inflated
           volume. In the second graph, each line represents 10%, 25%, 50%, 75% and 90% quantile respectively.
           Peak volume above the 90% percentile is usually due to events such as Jay Chou concert. In the third
           graph, each line represents total inflated volume for each day of week
Liu, Chen and Teo: Limousine Service Management Article submitted to Interfaces; manuscript no. 047-05-20-OM 13 The common seasonal models used in practice include the well-known Holt-Winters additive and multiplicative methods, and various extensions to include more seasonal com- ponents. The Holt-Winters method is extended by Livera et al. (2011) to handle non- integer seasonality and calendar effects, or time series with non-nested seasonal patterns. This approach includes a Box-Cox transformation, ARMA errors and multiple seasonal patterns as follows. The model is called TBATS, with T standing for trigonometric, B for Box-Cox transform, A for ARMA errors, T for trend, and S for seasonal components. In this model, a trigonometric representation of seasonal components based on Fourier series is introduced to reduce the number of parameters that require estimation. Details on the model are included in the appendix, and the derivation is available in the references therein. Implementation of this model is based on the “forecast” package using R, after smoothing out outlier observations usually caused by events, public holidays or system recording error. The outliers are identified as jobs with duration above the 95% percentile of full empirical distribution on job duration. Since removing the outlier observation would disrupt the seasonality in time series, a typical value from a normal day, for the same hour of the day and day of the week, is selected from the historical data to replace and therefore smooth out the outliers. This approach performs well for our problem. As an illustration, the data between Jan- uary and September in 2016 are used as a training set to assess the performance of this approach in Oct 2016. The average results are tabulated in Table 3. By comparing the two methods with respect to three different metrics - root mean squared error (RMSE), mean absolute error (MAE) and mean absolute percentage error (MAPE), it is observed that the forecasting model proposed appears to dominate the moving average method in all dimensions, measured at a daily level for one-day-ahead forecasts across all the days in test set. Compared to the previous forecasting model using a simple three-period moving average, the superiority of the enhanced model is demonstrated in the following three aspects. First, better test set performance in all three metrics. This is due to a further exploitation of structural components like trend and multiple seasonalities in the time series over a longer horizon. Second, automated weekly forecasts. The previous forecasting exercise requires manual processing over spreadsheet every week, suffering from operation risks such as incorrect entry. The automated forecasting system thus offers a more reliable and consistent
Liu, Chen and Teo: Limousine Service Management
14                                                       Article submitted to Interfaces; manuscript no. 047-05-20-OM

output for consumption. Third, as mentioned in the later part of the paper, the system
gives a visual representation of both forecasted and historical value by hour of the day and
day of the week, supporting critical decisions such as determining if the current stock of
vehicles needs to be boosted or reduced.
     Since new data are constantly generated, a monthly re-training task is scheduled to re-
estimate the model coefficients and re-align to the latest changes in data. However, the
refreshed TBATS model occasionally suffers from overfitting and generates unstable and
excessive hourly forecasts. To avoid such circumstance and further stabilize the automated
forecasting system, a separate seasonal moving average model was added in an equally
weighted ensemble fashion from 2017 onwards. This results in more operationally consistent
and reliable forecasts, yet the performance is on par with the standalone TBATS model
on normal days.

        Table 3   Comparison of average one-day-ahead daily out-of-sample performance over one month.

             Forecasting Model                       RMSE            MAE               MAPE
             Previous model based on three- 9.311                    7.1               0.306
             period moving averages
             Multi-seasonal time series model 8.297                  6.206             0.249

Collaborative Event-based Forecast
Although mathematical forecasting approaches can lead to reliable demand forecasts by
extrapolating regular patterns in time series, unpredictable events that do not appear in
historical data can reduce the usefulness of mathematical forecasts for demand planning.
Since forecasters have partial knowledge of the context and of future events, it is important
to group and structure the fragmented expert knowledge to be integrated into final demand
forecasts. In this regard, the approach proposed by Cheikhrouhou et al. (2011) is followed.
The baseline mathematical forecast is adjusted by structured and combined knowledge
from different forecasters, thus leading to a more accurate and practical forecast.
     To better understand the impact of different events on the baseline model, a thorough
analysis was jointly conducted by forecaster and planners/controllers on the quantitative
impact from events or public holidays, including the details of events such as event type,
number of attendees, duration, and internal operational status on a particular day. Recall
Liu, Chen and Teo: Limousine Service Management
Article submitted to Interfaces; manuscript no. 047-05-20-OM 15
Figure 8 Flow chart of collaborative event-adjusted time series forecast. The initial baseline forecast is generated
using an ensemble of multi-seasonal time series model and seasonal moving average model based on
smoothed historical data. The output from mathematical forecasting is then editted, often increased,
by operational experts based on relevant event factors, producing the final collaborative event-adjusted
forecasts.
that Table 1 shows some of the events and associated attributes, which may also differ from
their actual value. For example, a wedding dinner may end later than originally scheduled,
while multiple weddings on the same day may result in a bigger shift in demand pattern
as it may be a public holiday or an auspicious day in the calendar. In addition, for big
events in the city with over 5000 anticipated attendees, the actual attendance is likely
to fluctuate considerably. This changes the demand for limousine services at the hotel.
Since it is very difficult for the forecasting model to capture the dynamics in a demand
pattern driven by different events and other factors, it is observed that the multi-seasonal
time-series model is more likely to be inaccurate during days with big events. Therefore,
being aware of this reference information on future events and corresponding uncertainties,
operational staff will evaluate the impact of such events by observing the demand pattern
during similar days in the past, and quantify the additional amount to be added on top of
the aforementioned forecasting output as a measure of empirical adjustment.Liu, Chen and Teo: Limousine Service Management
16 Article submitted to Interfaces; manuscript no. 047-05-20-OM
The collaborative event-adjusted forecasting process is illustrated in Figure 8. First, the
raw time series data is carefully cleaned by smoothing out the potential outliers using
historical average, presenting an event-free picture of the demand pattern. Second, an
ensemble of multi-seasonal time series model and seasonal moving average model is applied
to generate the initial mathematical forecasts, followed by operational perusal and potential
edits from experts based on relevant internal and external events or public holidays. Once
finalized, the collaborative event-adjusted forecasts are then submitted for weekly planning
of fleet schedule.
Figure 9 Comparison of different forecasts on October 5 2016. The multi-seasonal time series forecast (blue
line) is able to better track the actual demand (red line), especially during the later half of the day
(overlapped with green line), compared with the historical moving average forecast (yellow line). The
peak in the actual demand from 5am to 12am, driven by a big group check-in, is partly captured by
the collaborative event-based forecast (green line), which is an improvement compared with the blue
line. The additional gap between red and green lines is also used to update the operational knowledge
on the impact of similar events, leading to better edits in the future.
For instance, the operations team knew that there was a big group checking in at the
hotel on the morning of October 5 2016. This knowledge was not accounted for in the
mathematical model. Based on past data, the operations team was able to provide a
rough estimate of additional jobs needed for such a group event. As illustrated in FigureLiu, Chen and Teo: Limousine Service Management
Article submitted to Interfaces; manuscript no. 047-05-20-OM 17
9, the improvement in accuracy using the revised forecast is obtained by adding on-the-
ground knowledge. The revised composite forecast fits the actual demand better than the
mathematical model. Table 4 quantifies the improvement in RMSE, MAE and MAPE,
using the revised forecast, for the same data used in Table 3. The composite forecast proves
to be better in predicting future demand than single model-based forecasts, especially
during days with big events in the city, i.e. China’s Golden Week holiday in October.
Table 4 Comparison of average daily out-of-sample performance for the three models over one month
Forecasting Model RMSE MAE MAPE
Previous model based on three- 9.311 7.1 0.306
period moving averages
Multi-seasonal time series model 8.297 6.206 0.249
Collaborative event-based model 7.791 5.78 0.239
Optimal Resource Scheduling
In view of the surge in demand due to events and ad-hoc, last-minute requests, the in-house
and base fleets alone are insufficient to cover the demand at all hours of the day, thus
necessitating the need for additional support from the disposal fleet. As an integral portion
of supply to ensure a high service level, the disposal fleet is also the most expensive fleet
due to its flexible schedule. Prior to the adoption of a data driven approach to forecasting
and shift optimization, disposal activation was based on gut feel, and often resulted in
either under-utilization or a shortage of vehicles. Figure 10 shows a sample problem; the
forecast total car column is derived from the proposed forecasting model. Note that the
historical peaks in hourly demand, observed in days with similar characteristics, are also
considered, so as to guide the managers to stand down unnecessary ad-hoc hires, in case
the demand is lower than the expected volume.
The next section shows how the number of disposal vehicles to be activated could be
determined automatically using a mathematical programming approach. The section for
disposal activation in Figure 10 used to be manually filled in by operational managers
based on experience and gut feel. Automating this task is challenging, in part because
capturing the constraints in the problem using the natural decision variables (how many
cars to reserve at each hour in each shift) is difficult, as the consecutivity and uniformityLiu, Chen and Teo: Limousine Service Management
18 Article submitted to Interfaces; manuscript no. 047-05-20-OM
Figure 10 An example of the problem solved. 5am is used as the start of the planning horizon, and wrap around
midnight into the next day. The shaded cells for shifts correspond to the starting time of the shifts.
Note how the balance across different hours of the day is maintained above or equal to zero by the
additional support from disposal activation. The disposal activation details, namely activation number,
start and end time, are then submitted to the vendor one week in advance.
constraints need to be modelled (i.e., each shift has the same number of drivers for each
hour in the shift). Instead, the scheduling constraints are incorporated using a set covering
formulation.
Let l(j) denote the length of shift j, and let s(j) and e(j) denote the start and end time
of shift j. The set of feasible shift patterns, denoted by S, is generated in advance. Let
xj denote the number of drivers activated for shift j. Let yj = 1 if shift j is activated and
0 otherwise. Using a mathematical programming approach, the problem is re-formulated
P
with an objective to minimize the total activation hours, i.e. j∈S l(j)xj , such that the total
activated cars are sufficient to cover the forecasted demand. In addition, there are maximum
six times of activation for disposal vehicles, and each activation can only accommodate
up to 60 vehicles. These constraints are per the service level agreement between the hotel
and its vendor. More details on the formulation are available in the appendix. Note that
there are at most 19 slots to activate the drivers (from 5am to 11pm), and 6 possible shift
lengths (from 3 to 8 hours), and hence at most 114 possible shift patterns. The solution of
this formulation can be obtained using a spreadsheet optimization solver.Liu, Chen and Teo: Limousine Service Management
Article submitted to Interfaces; manuscript no. 047-05-20-OM 19
Figure 11 illustrates the scheduling process of a normal day and compares the manual
solution with model-based optimal solution. The result shows that the optimal solution
uses 21 hours less of driver time and yet ensures all buffers are covered, thus being a more
preferred schedule. The model-based scheduling is performed for each day of the week one
week in advance, and the solution time is less than 2 seconds for each day using OpenSolver
in Excel.
Figure 11 Comparison of manual solution versus model-based optimal solution. The optimal solution uses 21
hours less of driver time and yet ensures all buffers are covered, thus being a more preferred schedule.
Efficient Resource Planning via Process Automation
To strike a proper balance between supply and demand, it is important to equip operational
staff with the right data at the right time. Recall that the status report, which givess the
supply and demand for the next 12 hours, used to take half an hour if generated manually.
Automating this process requires finding solutions to two challenges - data availability and
processing complexity. It is a relatively trivial task to replicate the manual data stitching
process using a scripting language like R, so that the latter two components of the usual
ETL (Extract, Transform, Load) routine are automated. The main challenge, however, lies
in extracting data from operational systems.Liu, Chen and Teo: Limousine Service Management
20 Article submitted to Interfaces; manuscript no. 047-05-20-OM
The demand data are stored in LIS, a web-based application, while the manpower data
are kept in Virtual Roster (VR), a standalone application. Both vendor systems require
authentication and proper navigation to locate and download the data needed to produce
the status report. The navigation and downloading process could take up to 10 minutes
depending on network stability and system loading capacity. Logging in again is necessary
should the systems time out during a session.
The significant bottleneck for data availability not only prolongs the report generation
time, but also prevents the operations team from having an up-to-the-minute understand-
ing of the ongoing operations, since the status report only conveys the picture half an hour
ago. To address this challenge, the project team invested a lot of time to understand the
features of the two systems and came up with a two-pronged approach, via a bot, to access
the relevant data. For LIS, a self-contained script was developed using R to establish a valid
session upon authentication, enter certain parameters such as date range, and download
the relevant data, all completed in the backend without manual intervention. For VR, a
Python script was developed to download data by performing mouse moves and keystroke
entries according to a pre-configured procedure. The key to this approach lies in knowing
the exact location to click on the screen and the keys to strike in each step, along with the
interval to wait between steps. Although these automated processes work properly most
of the time, occasional breakdown still occurs due to unforeseen factors such as network
failure or unwanted use of dedicated workstation hosting the system. To overcome this, a
separate early warning system is also developed to monitor the execution status and alert
the relevant person should a failure occur.
With the right data available, the mission critical bot then performs extensive data
engineering to properly massage the data, followed by report knitting using RMarkdown
and report distribution by calling the Microsoft Outlook API. The whole automation
process is able to generate and distribute the status report using around 5 minutes, and
is scheduled to run every hour via a batch job in Windows Task Scheduler, as shown in
Figure 12.
Besides automating reporting solution, the bot also provides recommendation on vehicle
deactivation, saving operational cost if it is identified safe to do so. As mentioned earlier,
the historical distributions of the number of jobs by job type, hour of the day and day of
the week are also analyzed. By assessing the current volume with a certain percentile ofLiu, Chen and Teo: Limousine Service Management
Article submitted to Interfaces; manuscript no. 047-05-20-OM 21
Figure 12 Overview of mission critical automation bot. Following a three-hourly schedule, the bot first col-
lects data from difference sources such as cloud systems, spreadsheets and databases. After proper
wrangling and reshaping of data, an operational status report is generated using R Markdown and
distributed via Microsoft Outlook API.
the distribution on the historical hourly volume, operations can decide if one or more vehi-
cle can be deactivated safely for the next few hours. For example, if the minimum hourly
balance between supply and demand, based on the real time operational data, exceeds
one vehicle for the next 12 hours, the bot will recommend standing down one disposal
vehicle. Planners/controllers also have the flexibility to tell the bot which percentile they
would like to choose when comparing current volume with historical distributions. A high
percentile means a relatively conservative approach towards serving customers with high
service level, but may risk having too many vehicles on stand by, while a low percentile
indicates a relatively aggressive attitude towards serving customers with just enough vehi-
cles, but may not reserve enough vehicles for sudden surges in demand. By constantly
adjusting the percentile or threshold for different hours of the day and days of the week, the
planners/controllers were able to improve the service level to nearly 100% by minimizing
the no-vehicle-available instances which used to happen on a daily basis, and save up to
S$3.2 million after adopting this bot as a key decision-making reference.Liu, Chen and Teo: Limousine Service Management
22 Article submitted to Interfaces; manuscript no. 047-05-20-OM
Implementation and Evaluation
To maximize the likelihood of adoption, the limo operational managers are also given the
final right to edit, often to increase, the supply provision and generated schedule from the
system, based on their operational experience, to deal with any last-minute changes not
captured by the system. After all, they are the stakeholders who have eventually to bear
the cost and answer to senior management.
To better understand the system effectiveness and the need to do editing, the team
created additional metrics in the daily management dashboard, to understand the number
of cars originally scheduled by the system, the actual cars scheduled after editing (if any),
and the actual number of cars in use. All three metrics were measured by hour of the day.
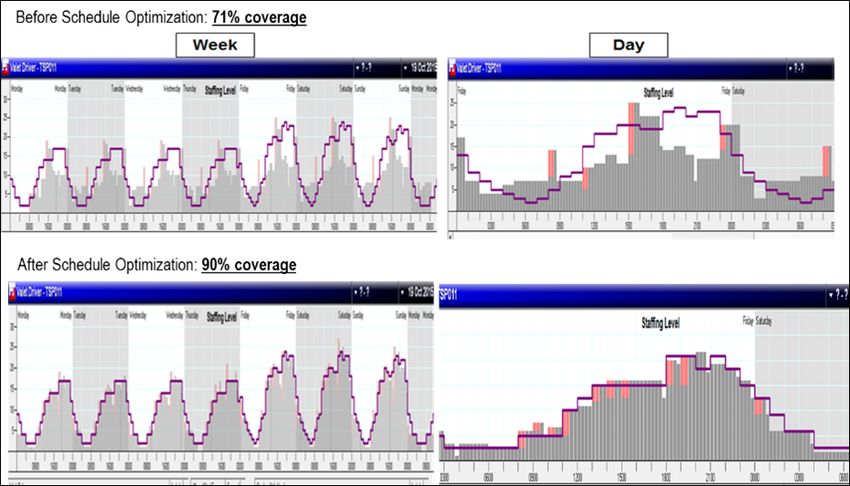
Figure 13 shows the performance before and after the adoption of the system as shown
in the dashboard. It was discovered that scheduled shifts are enough to cover the actual
number of cars needed for over 90% of the cases, with no need for human edits.
Figure 13 Impact of the new system on demand coverage. More than 90% of service requests are accommodated
by optimized shift schedule, showing an improved coverage of nearly 20% compared with previous
experience-based scheduling approach.
The project was also rolled out in a gradual manner, introducing the systems recom-
mendations slowly and gradually, until the limo operational managers trusted the recom-Liu, Chen and Teo: Limousine Service Management Article submitted to Interfaces; manuscript no. 047-05-20-OM 23 mendations of the system with enough confidence. For example, in the initial days, an activation of 25 disposal vehicles was often observed across the busy evening hours on weekends, although the system recommended only 10. Instead of making a drastic cut to follow the system’s recommendation, the managers are allowed to reduce the number first to 20 in the following weeks, and then to 15 and to 10 gradually, if no major complaints were observed. The success of the adoption of the system, in some sense, was partially due to project team’s ability to convince the managers that the oversized schedule in the old approach had led to a big buffer compared with the new systems recommendation. The reduction in outsourced labor due to the system’s recommendation was also welcomed by most in-house drivers, since they have more opportunities to interact with guests and to earn tips. The reduced reliance on disposal vehicles also pushed the vendor towards more lean operations, such as engaging the same contract driver across consecutive shifts to reduce switching cost among different drivers. A significant impact from the new system on service level and cost savings is observed: up to a 99.98% service level was achieved for over 100,000 jobs per year in comparison with frequent no-vehicle-available instances in the past; Net Promoter Score increased from 89.1% to 92% year-on-year in October, showing an improvement of 2.9% since adoption of the new approach; a total cost saving of S$ 3.2 million in the first year and more in following years, as illustrated in Figure 14. Besides reduction in total cost, another effective and consistent measure is cost per job. As shown in Table 5, a substantial decrease in cost per job is observed since adoption of the forecasting and optimization system. After accounting for other factors such as depreciation of in-house vehicles, the cost per job decreased by over 20% between 2015 and 2016 while total volume decreased by 7.5%, with a further reduction of 12% in cost per job between 2016 and 2017 despite a 6.3% increase in total volume. The implementation of this system in the hotel has been a resounding success. The following are the summary of the documented benefits derived from this project: • Achieved 99.97% availability of limousine cars for patrons, a vast improvement com- pared to previous years. Only 22 instances of no vehicle available with 93,721 jobs com- pleted from Jan-Nov 2016 compared to a few instances on daily basis in 2015 • Increase in internal fleet productivity resulted in reduced dependency on outsourcing services. This is highlighted by a savings of S$3.2 million in limo expense for 2016 compared
Liu, Chen and Teo: Limousine Service Management
24                                                            Article submitted to Interfaces; manuscript no. 047-05-20-OM

Figure 14    Plot of scaled total annual cost and number of jobs per year (top), and scaled cost per job (bottom). A
             relatively big decrease in annual cost is observed in 2016, the year when the system was implemented.
             Although the cost saving is partly accounted for by lower business volume, a further reduction in cost
             despite of increasing volume in the following year further demonstrates the effectiveness of the new
             system. This is also illustrated by the metric of total cost per job in the second figure, which is a more
             robust measure on cost reduction in view of change in business volume.

against internal budgeted amount, a lowered cost per job by 21% in 2016 compared to
2015, and a reduced commitment of the permanent outsourced base fleet in the limousine
fleet from 10 to 9 in 2017.
     • Enhanced Limo billing and verification process which drastically reduced billing dis-
crepancies, and ensured timely payment to vendor. Using the new integrated system, the
Liu, Chen and Teo: Limousine Service Management
Article submitted to Interfaces; manuscript no. 047-05-20-OM 25
2014 2015 2016 2017
Total $ $/Job Total $ $/Job Total $ $/Job Total $ $/Job
Total Fixed Cost 1,000 0.02147 1,209.98 0.02263 1,672.07 0.02205 1,794.52 0.02147
Depreciation 503.36 0.01081 673.29 0.01259 571.72 0.00767 548.62 0.00657
Total Variable Costs 262.37 0.00563 238.76 0.0045 291.07 0.00384 330.99 0.00396
Total In-house Cost 1765.73 0.03791 2122.02 0.03968 2544.86 0.03357 2674.13 0.032
Total Outsourced Cost 3083.36 0.04262 3145.03 0.05254 1338.1 0.04619 951.72 0.03435
Total Limo Cost (In-house and Outsourced) 4849.09 0.0408 5267.05 0.04647 3882.96 0.03706 3629.7 0.03259
Table 5 Breakdown of annual total cost and cost per job scaled by a common denominator of S$1,000 total
fixed cost in 2014
operations team identified and recovered overcharges equivalent to 5% of total outsourced
limo expense for 2015.
The above automation and tools also allowed the team to brainstorm and identify fur-
ther potential areas of improvement, such as spotting certain trends in service delivery,
that will bring about a better experience for the hotel’s guests. For instance, vehicles trav-
elling between the airport and the hotel typically require the same amount of time. Upon
analyzing the data from the system’s integrated dashboard, the team noticed that certain
drivers would take longer to return from their jobs. This led them to identify a way to
resolve the issue of staff accountability which is to install a GPS tracker on every vehicle.
This change not only allowed the team to track the vehicles location in real time, but also
provided information such as speed of the vehicle. Since the implementation, a higher level
of staff engagement and more consistent work performance are observed. The data also
enabled management to make more effective decisions pertaining to scheduling, timing of
breaks, and job allocations.
Moreover, the system developed for this problem is also used to manage the productivity
and performance of the department, presenting an individualized 360-degree performance
evaluation dashboard for each in-house driver. For example, key metrics such as the number
of jobs completed and the average job duration for each individual driver are visualized
together with the distribution of these metrics across the whole fleet, so as to indicate the
relative performance ranking of the driver. Such automated performance dashboard also
facilitates better team member engagement on a regular basis.
Concluding Remarks
This paper explained how the time series demand forecasting methods, mission critical
scheduling optimization and operational dashboards are applied to drive significant costLiu, Chen and Teo: Limousine Service Management
26 Article submitted to Interfaces; manuscript no. 047-05-20-OM
savings and a big increase in service level, for a major hotel in Singapore. Experiences
in using open-source technologies to alleviate a staff shortage problem that was impeding
business growth are also discussed. In terms of business benefits, the proposed approach
was able to help operations achieve service level close to 100% while maintaining a fixed
fleet size without having additional permanent planners/controllers or a major increase in
outsourcing, thus greatly improving resource utilization.
Appendix
Details on TBATS Model
The TBATS model consists of the following elements.
(ω)
yt −1
ω 6= 0
(ω) ω
yt = (1)
log yt
ω=0
T
X
(ω) (i)
yt = lt−1 + φbt−1 + st−mi + dt (2)
i=1
lt = lt−1 + φbt−1 + αdt (3)
bt = (1 − φ)b + φbt−1 + βdt (4)
(i) (i)
st = st−mi + γi dt (5)
p q
X X
dt = ϕi dt−i + θi t−i + t (6)
i=1 i=1
(ω)
Here, yt is the inflated hourly volume at time t with parameter ω used for Box-Cox
transformation, m1 , ..., mT denote seasonal periods, lt is the local level in period t, b is the
(i)
long-run trend, bt is the short-run trend in t, st represents the ith seasonal component at
time t, dt denotes an ARMA(p,q) process and t is a Gaussian white noise process with
zero mean and constant variance σ 2 . The smoothing parameters are given by α, β and γi
for i = 1, ..., T . The damped trend has a damping parameter φ, which is supplemented by a
long-run trend b. The arguments for the model are (ω, φ, p, q, m1 , ..., mT ), making for a large
number of parameters to be estimated. In order to have a more flexible and parsimonious
approach, Livera et al. (2011) introduced the following trigonometric representation of
seasonal components based on Fourier series:Liu, Chen and Teo: Limousine Service Management
Article submitted to Interfaces; manuscript no. 047-05-20-OM 27
ki
X
(i) (i)
st = sj,t (7)
j=1
(i) (i) (i) ∗(i) (i) (i)
sj,t = sj,t−1 cosλj + sj,t−1 sinλj + γ1 dt (8)
∗(i) (i) ∗(i) (i) (i)
sj,t = −sj,t−1 sinλj + sj,t−1 cosλj + γ2 dt (9)
(i) (i) (i) (i)
Note that γ1 and γ2 are smoothing parameters and λj = 2πj/mi . Here, sj,t represents
∗(i)
the stochastic level of the ith seasonal component, while sj,t represents the stochastic
growth in the level of the ith seasonal component, i.e. change in the seasonal component
over time. The number of harmonics required for the ith seasonal component is denoted
by ki . Most seasonal components will likely require fewer harmonics, thus reducing the
number of parameters to be estimated from that of the previously described approach.
(i)
Therefore, the seasonal component st in equation (5) is replaced by trigonometric seasonal
(w) (i)
formulation, and equation (2) becomes yt = lt−1 + φbt−1 + Ti=1 st−1 + dt .
P
Details on Fleet Scheduling via Mathematical Programming
The scheduling problem can formulated as follows.
P
minimize j∈S l(j)xj
P
s.t. j:s(j)≤tLiu, Chen and Teo: Limousine Service Management
28 Article submitted to Interfaces; manuscript no. 047-05-20-OM
Livera A, Hyndman R, Snyder RD (2011) Forecasting time series with complex seasonal patterns using
exponential smoothing. Journal of the American Statistical Association 106(496):1513–1527.
Wan X, Ghazzai H, Massoud Y (2020) A generic data-driven recommendation system for large-scale regular
and ride-hailing taxi services. Electronics 9(648).You can also read