Using Multiple Natural Enemies to Manage Sweetpotato Whiteflies (Hemiptera: Aleyrodidae) in Commercial Poinsettia (Malpighiales: Euphorbiaceae) ...
←
→
Page content transcription
If your browser does not render page correctly, please read the page content below
Journal of Integrated Pest Management, (2021) 12(1): 18; 1–13
doi: 10.1093/jipm/pmab010
Case Study

Using Multiple Natural Enemies to Manage Sweetpotato
Whiteflies (Hemiptera: Aleyrodidae) in Commercial
Poinsettia (Malpighiales: Euphorbiaceae) Production
Erfan K. Vafaie,1,5, H. Brent Pemberton,2 Mengmeng Gu,3 David Kerns,4
Micky D. Eubanks,4 and Kevin M. Heinz4

                                                                                                                                                                    Downloaded from https://academic.oup.com/jipm/article/12/1/18/6254918 by guest on 24 September 2021
1
 Department of Entomology, Texas A&M AgriLife Research and Extension Center, 1710 N. 3053 FM, Overton, TX 75684, USA, 2Texas
A&M AgriLife Research, Texas A&M AgriLife Research and Extension Center, 1710 N. 3053 FM, Overton, TX 75684, USA, 3Depart-
ment of Horticultural Sciences, Texas A&M AgriLife Extension Service, HFSB 225/TAMU 2134, College Station, TX 77843, USA,
4
 Department of Entomology, Texas A&M University, TAMU 2475, College Station, TX 77843, USA, and 5Corresponding author, tel: 903-
834-6191, e-mail: erfan.vafaie@ag.tamu.edu

Subject Editor: Donald Weber
Received 22 October 2020; Editorial decision 14 March 2021

Abstract
In this case study, we investigate the efficacy and economics of using two natural enemies in an integrated
pest management (IPM) program to manage sweetpotato whitefly, Bemisia tabaci (Gennadius) (Hemiptera:
Aleyrodidae), in commercial poinsettia (Euphorbia pulcherrima Willd. ex Klotzsch) production. Two similar
greenhouses at each of three different grower locations were designated as either the IPM or the conventional
insecticide greenhouses in southeastern United States. In the IPM greenhouses, we released Eretmocerus
eremicus (Rose & Zolnerowich) (Hymenoptera: Aphelinidae) weekly and Amblyseius swirskii (Athias-Henriot)
(Acari: Phytoseiidae) every 4 wk, and selective insecticides were used to treat high whitefly densities as needed.
In the conventional greenhouses, growers were autonomous in their insecticide application decisions. All
whitefly stages were counted weekly on a maximum of 20 leaves per 50 randomly sampled poinsettias and 50
flagged (i.e., revisited) poinsettias in every greenhouse. Whitefly densities were consistently similar or higher
in the IPM greenhouses compared to their conventionally managed counterparts for the duration of the trial.
The cost of inputs and labor for whitefly management in the IPM greenhouses was between 0.57- and 3.0-
fold the cost of conventional management. Our study supports that releasing E. eremicus and A. swirskii can
reduce insecticide applications by 25–78% and may be considered a feasible strategy to manage B. tabaci in
commercial poinsettia production in place of conventional insecticidal control in southeastern United States.

Key words: seasonal inoculative biological control, greenhouse, economics

Poinsettias, Euphorbia pulcherrima Willd. ex Klotzsch, are an im-                         Westwood (Hemiptera: Aleyrodidae), and the sweetpotato whitefly,
portant seasonal ornamental crop sold for their aesthetics and colorful                   Bemisia tabaci (Gennadius); although the latter has been considered a
bracts between November and December in the United States with a                          ‘species complex’ composed of morphologically indistinguishable spe-
wholesale value of $148,760,000 in the United States in 2018 (U.S.                        cies (Perring 2001, Shu-sheng et al. 2012). The taxonomy of B. tabaci
Department of Agriculture 2020). For the duration of the 12- to 18-wk                     is in need of revision, but currently the most pertinent B. tabaci spe-
production cycle for poinsettias, growers must protect the plants from                    cies in greenhouse ornamentals in southern United States include the
a suite of common greenhouse pests, including whiteflies (Hemiptera:                      MEAM1 (formerly known as B biotype) and MED (formerly known
Aleyrodidae), thrips (Thysanoptera: Thripidae), mealybugs (Hemiptera:                     as Q biotype) (Tay et al. 2012, McKenzie et al. 2014). Bemisia tabaci
Pseudococcidae), and fungus gnats (Diptera: Sciaridae), with whiteflies                   MEAM1 was problematic in greenhouse ornamentals in the United
frequently the predominant pest (Ecke et al. 2004).                                       States since the early 1980s (Costa et al. 1993, Brown et al. 1995,
                                                                                          Frewin et al. 2014, McKenzie et al. 2014), but populations were man-
                                                                                          ageable with available insecticides. Bemisia tabaci MED was first ob-
Managing Whiteflies on Poinsettias                                                        served in the United States in 2004 and was characterized by resistance
The two main species of whiteflies frequently found on poinsettias in the                 to several insecticides, such as pyriproxyfen, acetamiprid, buprofezin,
United States are the greenhouse whitefly, Trialeurodes vaporariorum                      fenpropathrin, acephate, imidacloprid, and thiamethoxam (Dennehy

© The Author(s) 2021. Published by Oxford University Press on behalf of Entomological Society of America.
This is an Open Access article distributed under the terms of the Creative Commons Attribution-NonCommercial License (http://creativecommons.org/              1
licenses/by-nc/4.0/), which permits non-commercial re-use, distribution, and reproduction in any medium, provided the original work is properly cited.
For commercial re-use, please contact journals.permissions@oup.com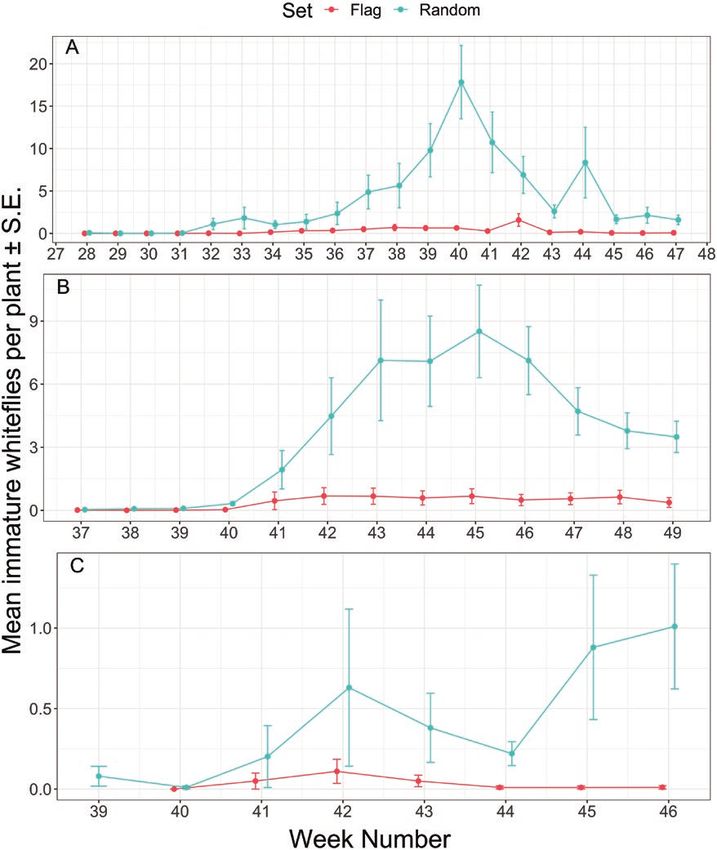
2                                                                           Journal of Integrated Pest Management, 2021, Vol. 12, No. 1

et al. 2005). For example, the lethal concentration of imidacloprid        2020a and Vafaie et al. 2021a, respectively). The spatial scale of
required to cause 50% mortality (LC50) was found to be 83.8-fold           augmentative biological control research can drastically alter the
higher for B. tabaci MED compared to MEAM1 (Luo et al. 2010).              outcome due to factors such as Allee effects on prey and natural
Specific rotations of insecticides can be used to manage both common       enemies, or physiological trade-offs that occur at different spatial
cryptic species of B. tabaci (McKenzie et al. 2014); however, in cir-      scales (Courchamp et al. 1999, Kneitel and Chase 2004, Bajeux et al.
cumstances where effective management with available insecticides          2017). Our goal in this study was to determine whether efficacious
was limited and B. tabaci MED was prevalent, growers had to resort         augmentative biological control could be maintained at the scale of
to alternative whitefly management strategies, such as the use of bio-     commercial poinsettia production in Texas.
logical control (Murphy et al. 2008).                                          In the state of Texas, 81.1% of the greenhouse growing area
    Whiteflies on poinsettias are predominantly managed with fre-          is considered semi-open, hoop-houses with plastic film (single or
quent insecticide applications in the southern United States. The lack     multilayer poly) (Vilsack and Reilly 2015). Due to the semi-open
of adoption of biological control in greenhouse ornamentals has fre-       conditions, a seasonal inoculative biological control program was
quently been attributed to concerns of cost or insufficient pest sup-      considered most suitable. A seasonal inoculative biological con-
pression (Stevens et al. 2000, Bethke and Cloyd 2009). Historically,       trol program is defined as a regular release (commonly weekly or

                                                                                                                                                         Downloaded from https://academic.oup.com/jipm/article/12/1/18/6254918 by guest on 24 September 2021
retailer thresholds for pests on ornamentals were thought to be            monthly) of natural enemies to suppress a target pest of a seasonal
‘zero’ or undetectable (Stevens et al. 2000, Bethke and Cloyd 2009),       crop, with the expectation that the natural enemies will reproduce
which has recently been demonstrated as an incorrect assumption            to provide residual control (van Lenteren 2000, van Lenteren and
for whiteflies on poinsettias (Vafaie et al. 2020b). Average whitefly      Bueno 2003). Our past work demonstrated that the combination of
immatures were between 4.38 and 40.38 per poinsettia (60-s survey          two natural enemies, Eretmocerus eremicus (Rose & Zolnerowich)
per plant) at various retailers in Texas, potentially raising the bench-   (Hymenoptera: Aphelinidae) and Amblyseius swirskii (Athias-
mark in the published literature for acceptable whitefly densities at      Henriot) (Acari: Phytoseiidae), may be effective at reducing whitefly
retailers (Vafaie et al. 2020b). In some cases, more than 200 nymphs       populations (Vafaie et al. 2020a), despite whitefly immigration
per plant and up to 100% infestation with whiteflies were detected         or delays in natural enemy releases (Vafaie et al. 2021a). Adding
at retailers (Vafaie et al. 2020b), despite current weekly insecticide     A. swirskii also provides the benefit of suppressing secondary pests,
applications, raising concerns about the sustainability of relying on      such as thrips (Ghasemzadeh et al. 2017) and twospotted spider
insecticides for whitefly control on poinsettias. Furthermore, pres-       mites (Acari: Tetranychidae) (Seiedy et al. 2017). In this case study,
sure from consumers, retailers (Friends of the Earth 2017), and the        we investigate the efficacy and economics of using a combination of
U.S. Environmental Protection Agency (2017) has increased de-              E. eremicus and A. swirskii in an integrated pest management (IPM)
mands to reduce insecticide use and increased pesticide application        program to manage whiteflies on poinsettias compared to conven-
regulations, providing the impetus to study the potential use of bio-      tional whitefly management at three commercial grower facilities in
logical control to manage whiteflies on poinsettias in Texas, United       Texas.
States.

                                                                           Materials and Approach
Commercial Scale Augmentation                                              Cooperative Growers
Biological Control                                                         Three different commercial growers were included in this trial, all
While quite a few studies have investigated augmentative bio-              within 80 km of the Texas A&M AgriLife Research and Extension
logical control for management of B. tabaci on poinsettias (Heinz          Center in Overton, Texas, United States (Table 1). Names and loca-
and Parrella 1994a; Hoddle and Van Driesche 1996; Hoddle et al.            tions of growers were anonymized with capital letters ‘A’, ‘B’, and ‘C’
1997, 1998, 1999; Hoddle and Van Driesche 1999a,b; Van Driesche            to maintain confidentiality. At each grower, two greenhouses with
et al. 1999, 2001, 2002; Stevens et al. 2000; Van Driesche and Lyon        similar conditions were chosen and designated as the IPM green-
2003), all have been conducted in cooler regions of the United States      house and the conventional insecticide greenhouse, respectively. Area
(Massachusetts, New York, and northern California) as compared             of usable growing space (m2), quantity of poinsettias at final spacing,
to Texas, all investigated the release of single enemy species to          type of greenhouse structure, and greenhouse cooling method are
manage B. tabaci (with the exception of Heinz and Parrella 1994a),         outlined in Table 1. Poinsettia cultivars were all ‘Prestige Red’ and
and economic comparisons have not been considered in over 17 yr            ‘Christmas Magic Red’ for Growers B and C, respectively. Grower
(Van Driesche and Lyon 2003). Additionally, our previous work              A had 20 cultivars in both greenhouses, which included ‘Premium
supporting sufficient suppression of B. tabaci using natural enemy         Red’, ‘Jubilee Jingle’, ‘WinterSun White’, ‘Christmas Day’, ‘Frozen’,
release rates economically comparable to insecticide inputs was con-       ‘Ice Punch’, ‘Protégé’, ‘Jingle Bell’, ‘Ice Crystal’, ‘Ferrara’, ‘Christmas
ducted in small cages containing 2 or 12 poinsettias (Vafaie et al.        Wish’, ‘Christmas Beauty Red’, ‘Autumn Leaves’, ‘Lipstick’, ‘Majestic

Table 1. Greenhouse structure type, cooling method, growing space in square meters (m2), and poinsettias at final spacing for convention-
ally and IPM greenhouses at the three different grower locations (A, B, and C)

                Conventional control                    IPM                      Greenhouse type                               Cooling
                    2                            2
Grower          m           Poinsettias        m           Poinsettias

A              1,151          2,451           1,142           3,722        Rigid plastic                        Evaporative cooling; active air flow
B                50            295              50             515         Rigid plastic                        Evaporative cooling; active air flow
C               186           2,256            186             559         Hoop-house with plastic film         Passive airflow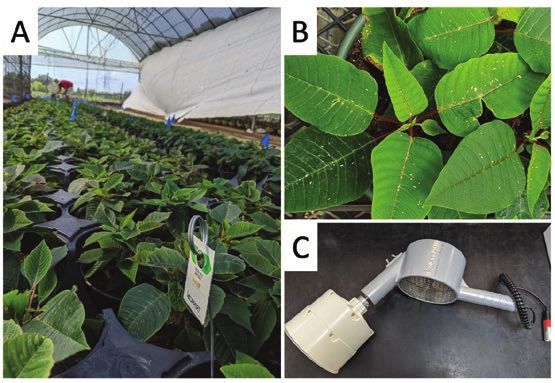
Journal of Integrated Pest Management, 2021, Vol. 12, No. 1                                                                                           3

Pink’, ‘Grand Italia’, ‘Red Glitter’, ‘Christmas Cheer’, ‘Premium                 applicator walked up and down each row of poinsettias at a con-
Polar’, and ‘Premium Marble’.                                                     sistent speed that was paced to provide limited extra carrier ma-
                                                                                  terial after covering all poinsettias. Left-over carrier material was
IPM and Conventional Whitefly Management                                          dispersed in whitefly hotspot areas as identified by monitoring (see
In the IPM greenhouses, E. eremicus pupae (Ercal, Koppert                         ‘Weekly Assessments’ below). In addition to releases of E. eremicus
Biological Systems, Howell, MI) were released approximately                       and A. swirskii, growers applied select insecticides that were con-
weekly and A. swirskii (Swirski-Mite, Koppert Biological Systems)                 sidered relatively compatible with natural enemies in areas of high
were released approximately every 4 wk. A uniform natural enemy                   whitefly densities.
release density based on area (m2) across all greenhouses would have                  In the conventional greenhouses, growers were autonomous in
resulted in drastically different input costs due to variability in poin-         insecticide use decision-making, with no restrictions on quantity
settia density per square meter (due to differences in plant spacing              or type of insecticides used. It should be noted that the growers
between growers and over time) and pot size (Table 1). To avoid this              had access to our monitoring data for both the IPM and conven-
discrepancy, density of E. eremicus and A. swirskii released within               tional greenhouses, providing them with detailed information about
each greenhouse was based on a combination of recommendations                     whitefly densities that would otherwise not be available. Subsamples

                                                                                                                                                            Downloaded from https://academic.oup.com/jipm/article/12/1/18/6254918 by guest on 24 September 2021
from the insectary (Koppert Biological Systems) and economic con-                 of whitefly adults (14–20 adult B. tabaci per subsample) were
straints (calculated as input cost per poinsettia) to be competitive              collected in 95% ethanol and sent to Dr. Cindy McKenzie (U.S.
with conventional insecticide input costs. Eretmocerus eremicus were              Department of Agriculture – Agricultural Research Service, Fort
released as pupae placed in a saw-tooth pattern within a given green-             Pierce, FL) for DNA barcoding using mitochondrial cytochrome c
house, hooked on metal stakes hanging just above the plant canopy                 oxidase I (mtCOI) as described in Shatters et al. (2009) to confirm
(Fig. 1A). Eretmocerus eremicus release density was 2.58 and 1.83                 species identification in 2018 (four subsamples) and 2019 (seven
pupae/m2 for growers A and B, respectively, per release, assuming 60              subsamples). Subsamples were collected from a combination of
pupae per card. Release density of E. eremicus in greenhouse C was                greenhouses in the area of the trial (2018) and colonies maintained
1.94 pupae/m2 for the first five releases, and subsequently reduced               from field-collected whiteflies (2019). One subsample from 2018
to 0.97 pupae/m2 due to removal of half of the poinsettias from the               had two adults that were B. tabaci Mediterranean (MED; previously
greenhouse on 30 October 2019. The E. eremicus release rates we                   Q biotype) and one subsample from 2019 had a single adult that
used were mostly within the recommended range of 1.5–3 pupae/                     was B. tabaci Mediterranean. The rest of the subsamples (three from
m2 provided by Koppert Biological Systems for preventative control                2018 and six from 2019) were confirmed as 100% B. tabaci Middle-
of B. tabaci. Our previous work demonstrated that the E. eremicus                 East Asia Minor 1 (MEAM1; previously B biotype). Due to the pres-
pupae cards utilized from Koppert Biological Systems actually con-                ence of both cryptic species in the region and potential change in
tain an average of 91.1 ± 3.6 pupae per card with a mean emer-                    composition over time, management decisions at grower locations
gence rate of 74.3 ± 3.2%, resulting in approximately 67.7 adult                  assumed a mix of both MED and MEAM1 species.
E. eremicus released per card (Vafaie et al. 2021a).
    Amblyseius swirskii were released at a density of 44.1, 42.0, and             Weekly Assessments
26.9 mites/m2 in greenhouses A, B, and C, respectively, per release,              Poinsettias were monitored starting from the time of transplanting
which is between the preventative (25 mites/m2) and light curative                until the time of shipping to retailers, with the exception of grower
(50 mites/m2) release rates recommended by Koppert Biological                     C, which were started 4 wk after transplanting. The late start at
Systems. Amblyseius swirskii was shipped in a carrier material,                   grower C was due to a decision by the regional grower to move the
which was mixed in a large container to increase homogeneity of                   trial to a different location due to unrelated crop protection and per-
A. swirskii prior to loading aliquots into the Koppert Mini-Airbug                formance issues at the original location.
hopper (Koppert Biological Systems) for even spread on the poin-                      Within each greenhouse, a maximum of 20 leaves on 50 ran-
settia canopy (Fig. 1B and C). To apply A. swirskii evenly, the                   domly sampled poinsettias were inspected weekly using a 2.5× head
                                                                                  lens. In addition to the randomly sampled poinsettias, 50 poin-
                                                                                  settias were flagged and a single leaf tagged with string to track a
                                                                                  single area of plant material over the length of the trial (Fig. 1A).
                                                                                  Number of whitefly immatures, pupae, exuviae, and adults, number
                                                                                  of E. eremicus exuviae (identified using features described in Vafaie
                                                                                  et al. 2021a) and adults, and A. swirskii motiles were counted on all
                                                                                  sampled plant material. Yellow sticky traps (between one per 25 m2
                                                                                  and one per 288 m2) were also suspended just above the plant canopy
                                                                                  and inspected weekly. Sticky traps were replaced when more than
                                                                                  approximately 50% of the surface area was occupied by trapped
                                                                                  insects. The number of whiteflies counted on a given sampling date
                                                                                  was reduced by the maximum number of whiteflies found previously
                                                                                  on the yellow traps to determine the quantity of new whitefly adults
                                                                                  trapped within the given sampling period. The sampling period was
                                                                                  recorded as week number, with week 2 starting on 6 January 2019.

                                                                                  Economic Evaluation
Fig. 1. Photos of the E. eremicus pupae cards being hung just above the plant
canopy and the flagged plants (blue flags) in the background (A), and the
                                                                                  We used partial budget analysis to determine the cost of whitefly
A. swirskii carrier material on the poinsettias after broadcast application (B)   management, independent from other activities or inputs (Stevens
made with the mini-airbug (Koppert Biological Systems) (C).                       et al. 2000). To determine an average estimate of the cost of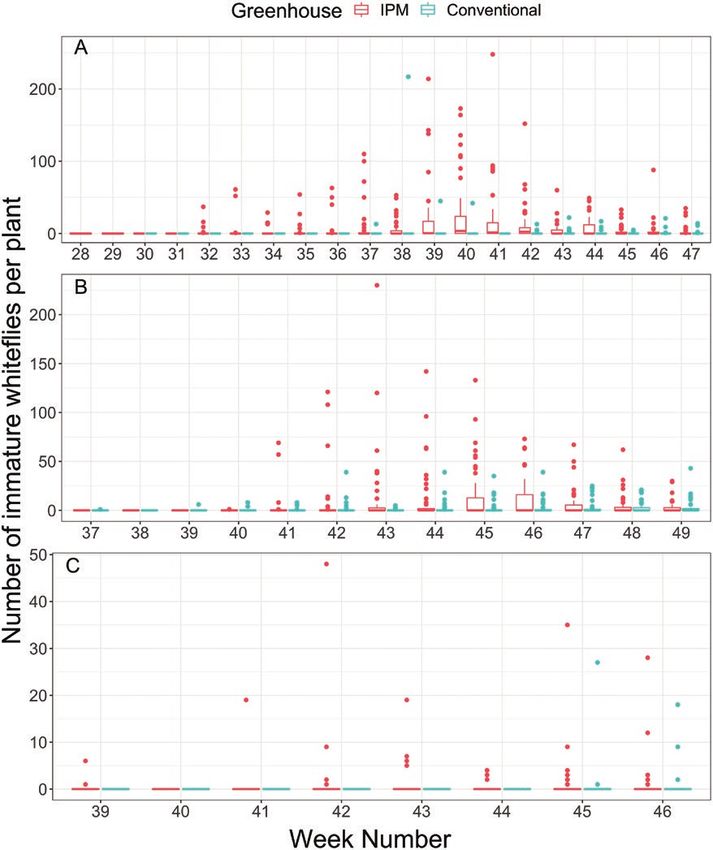
4 Journal of Integrated Pest Management, 2021, Vol. 12, No. 1
Table 2. Mean cost (± SE) of whitefly management products, the distributors, and active ingredients/species
Product Company Active ingredient or species Quantity per order Mean cost per order ± SE ($ USD)
Ercal Kopperta E. eremicus 3,000 pupae 49.50 (n = 1)
Swirski-Mite Koppert A. swirskii 50,000 mites 103.25 (n = 1)
Avid 0.15 EC Syngentab Abamectin 3.8 L (128 fl. oz.) 590.33 ± 60.33 (n = 3)
Capsil Aquatrolsc Polyether 3.8 L (128 fl. oz.) 133.76 ± 44.16 (n = 2)
Kontos OHPd Spirotetramat 0.2 L (8.45 fl. oz.) 181.15 ± 9.15 (n = 3)
Marathon II OHP Imidacloprid 0.2 L (8.45 fl. oz.) 141.05 ± 21.04 (n = 2)
Merit 2F Bayere Imidacloprid 3.8 L (128 fl. oz.) 59.52 ± 10.43 (n = 2)
Rycar SeProf Pyrifluquinazon 0.2 L (8 fl. oz.) 179.3 ± 12.82 (n = 3)
Safari 20 SG Valentg Dinotefuran 1.4 L (48 fl. oz.) 341.36 ± 8.06 (n = 3)
Talus 70DF SePro Buprofezin 1.4 L (48 fl. oz.) 328.05 ± 23.53 (n = 3)
Azatin O OHP Azadirachtin 0.9 L (32 fl. oz.) 218.74 ± 15.21 (n = 3)
Mainspring GNL Syngenta Cyantraniliprole 0.5 L (16 fl. oz.) 338.92 ± 13.92 (n = 3)
Downloaded from https://academic.oup.com/jipm/article/12/1/18/6254918 by guest on 24 September 2021
Xxpire Cortevah Spinetoram and sulfoxaflor 0.5 L (16 fl. oz.) 224 ± 14 (n = 2)
Conserve SC Corteva Spinosad 1.0 L (32 fl. oz.) 141.68 ± 4.51 (n = 3)
Endeavor Syngenta Pymetrozine 0.4 kg (15 oz.) 169.31 ± 13.51 (n = 3)
a
Koppert Biological Systems, Berkel en Rodenrijs, Holland, Netherlands; bSyngenta Group, Basel, Switzerland; cAquatrols, Paulsboro, NJ; dOHP, Inc., Bluffton,
SC; eBayer, Monheim am Rhein, Germany; fSePRO Corporation, Carmel, IN; gValent U.S.A. LLC, Walnut Creek, CA; hCorteva Agriscience, Wilmington, DE.
Prices for products acquired from up to two distributors and one online retailer (domyown.com).
insecticide inputs, we averaged the price of insecticides from two and conventionally managed greenhouses using an analysis of vari-
different distributors and from a readily available online retailer ance in R Studio (R Studio Team 2015). Total quantity of E. eremicus
(https://domyown.com) (Table 2). Prices for natural enemies were exuviae and A. swirskii motiles were summed for all plants within
based on their source and include taxes and shipping. Shipping costs a greenhouse and sampling period due to low natural enemy re-
were estimated based on quotes from the providers on an order covery rates. Percent parasitism by E. eremicus was calculated as total
quantity of 10 orders of either Ercal (USD $65) or Swirskii-mite number of E. eremicus exuviae divided by the total number of exuviae
(USD $80). We estimated the cost of insecticide inputs per square (E. eremicus and whitefly) multiplied by 100%. Whitefly counts from
meter based on the insecticide label and usable grower space for all locations, greenhouses, and weeks were pooled and plotted using
each greenhouse, assuming 200 gallons of mixed insecticides/0.40 frequency histograms with bin sizes representing five whiteflies each.
ha (1 acre). When limited areas within a greenhouse were treated Bins were inclusive of the value on the left (left-closed) and less than
with insecticides (i.e., whitefly hotspots), only the cost of treating the the value on the right (right-open) of each bin. Lastly, we determined
specific area was used in the economic evaluation. how well proportion of plants infested within a greenhouse during
We estimated labor cost using a reasonably average hourly wage a specific sampling period could predict average immature whiteflies
of $17.50/h for specialized labor (pesticide applicator), approximately on the poinsettias within the same sample. Initial model composed
40 min for preparation and cleaning of insecticide application equip- of proportion of plants infested with immature whiteflies as a fixed
ment and 100 min for an applicator to treat 856 m2 of greenhouse factor, greenhouse nested within grower, and week number as random
space, as estimated by Stevens et al. (2000). There was no preparation factors, and log-transformed mean immature whiteflies per plant as
time for releasing E. eremicus and minimal time for mixing and loading the response variable in a generalized linear mixed model (GLMM)
bulk A. swirskii material (6 min). We estimated the time it took to re- using the lmer (Kuznetsova et al. 2017) function in R Studio (R Studio
lease natural enemies at each location and calculated time to treat each Team 2015). Random factors did not increase model fit (using Akaike
1,000 m2 greenhouse as 15 and 50 min for E. eremicus and A. swirskii, Information Criterion with correction for small sample sizes; AICc)
respectively. Since an inventory of the total number of poinsettias was and were subsequently removed from the final model. All plots were
recorded during each visit, we were able to estimate the cost of man- created using the ggplot package (Wickham 2016) in R Studio (R
agement per poinsettia for any given application (Table 3). Studio Team 2015). Full raw dataset, analysis files, and output have
been published in Mendeley Data (Vafaie et al. 2021b).
Data Interpretation
The number of whiteflies counted on each poinsettia (subsample) was Major Findings
not normally distributed for any given greenhouse for all sampling All greenhouses (IPM and conventional) at all grower locations had
periods (experimental unit) even after log-transformation. Whitefly final average whitefly densities below 3.5 ± 1.09 immatures per plant
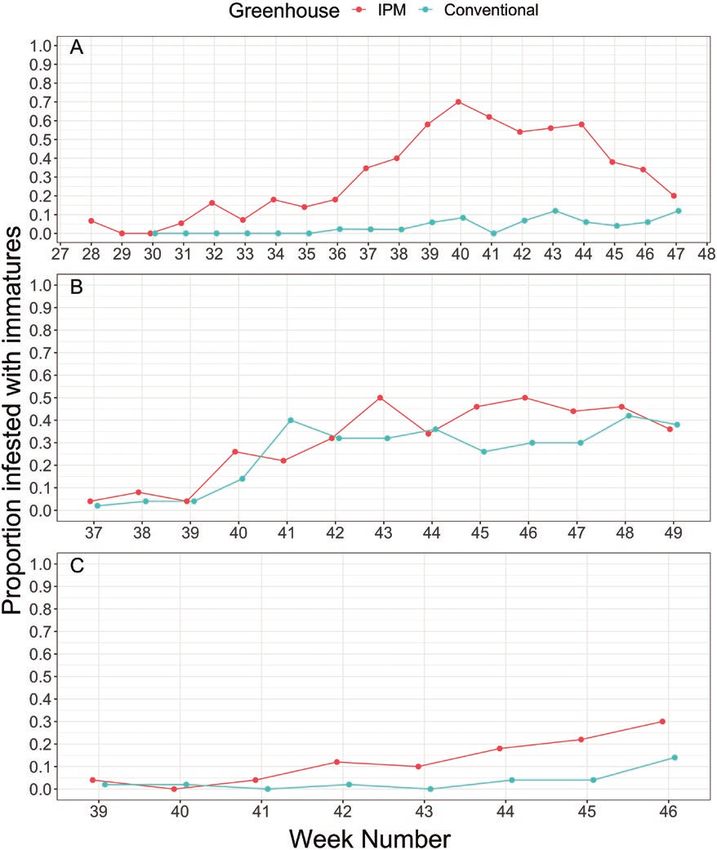
count data were subsequently visualized using box plots, with boxes (Fig. 2) and less than 38% of poinsettias infested (Fig. 3), which is
representing middle, lower (25%), and upper quartiles (75%), vertical below infestation levels found in Texas retailers (Vafaie et al. 2020b).
lines representing top quartile, and dots representing outliers, where For all grower locations during the growing season, the IPM green-
outliers are defined as values above the sum of the upper quartile (Q3) houses had similar (grower B) or higher whitefly (growers A and C)
and 1.5 times the interquartile range (IQR; outlier = Q3 + 1.5 * IQR). immature numbers than the conventionally managed greenhouses
The proportion of poinsettias infested was calculated as the total for most weeks (Fig. 2), although the final whitefly densities were
number of poinsettias with one or more whiteflies divided by the total not significantly different (F1,4 = 0.66, P = 0.462). The proportion of
number of poinsettias inspected per greenhouse for each visit. Log- poinsettias infested with immature whiteflies was consistently higher
transformed final density (log(1 + x)) and final proportion of plants in IPM greenhouses than conventionally managed greenhouses over
infested with immature whiteflies (calendar weeks 47, 49, and 46 for the duration of the study (0.94, 0.62, and 0.88 of the weeks sam-
growers A, B, and C, respectively) was compared between the IPM pled for growers A, B, and C, respectively), with the percentage of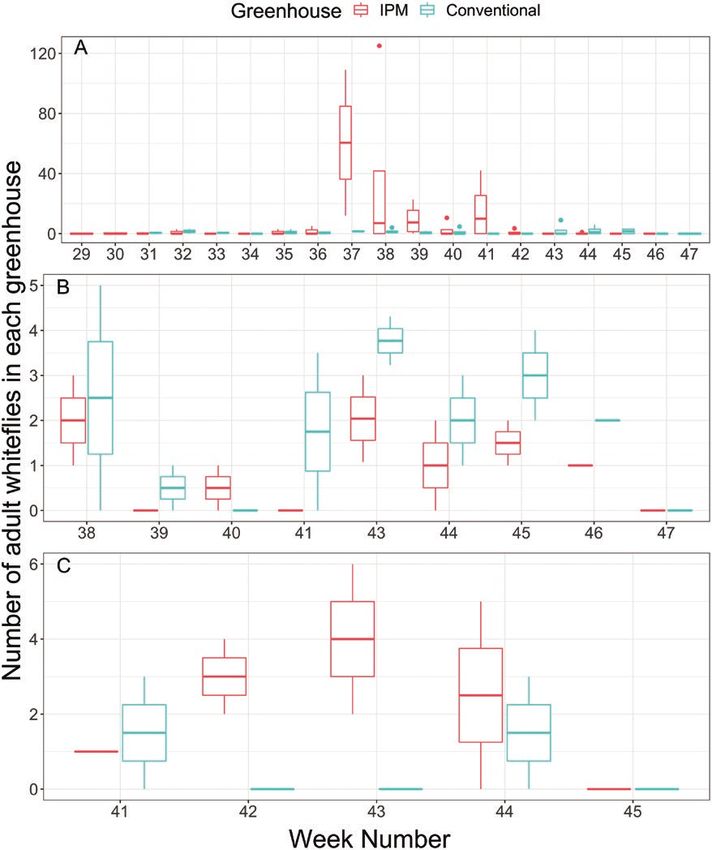
Table 3. Total cost, cost per poinsettia, and cost per square meter (m2) for the IPM and conventionally (conv.) managed greenhouses at growers A, B, and C

                                                                                                                   Input cost ($ USD)                            Labor cost ($ USD)                         Total ($ USD)

                            Product                  Application frequency            Pot size         Per poinsettia      Per m2         Total        Per poinsettia      Per m2           Total     Per poinsettia      Per m2
                                                                                   (diam. in cm)

Grower A        IPM         Ercal                               15                       20                0.178           1.191        1,324.09           0.071            0.431          352.14         0.250            1.622
                            Swirski-Mite                         4
                            Rycar                                3
                            Talus 70DF                           1
                            Merit 2F                             1
                Conv.       Rycar                                2                    20 – 30              0.024           0.093           74.30           0.060            0.218          172.40         0.084            0.311
                            Xxpire                               1
                            Merit 2F                             1
Grower B        IPM         Ercal                               12                       15                0.134           0.870           43.18           0.153            0.948           47.05         0.287            1.819
                                                                                                                                                                                                                                     Journal of Integrated Pest Management, 2021, Vol. 12, No. 1

                            Swirski-Mite                         2
                            Rycar                                2
                            Kontos                               1
                Conv.       Safari 20 SG                         3                       15                0.020           0.214           10.60           0.122            1.352           67.08         0.142            1.566
                            Rycar                                1
                            Capsil                               1
                            Marathon II                          1
Grower C        IPM         Ercal                                7                       10                0.057           0.297           55.12           0.044            0.247           45.97         0.101            0.544
                            Swirski-Mite                         1
                            Kontos                               1
                            Avid 0.15 EC                         1
                Conv.       Kontos                               1                       10                0.029           0.314           58.26           0.148            0.875          162.50         0.177            1.189
                            Avid 0.15 EC                         1
                            Mainspring GML                       2
                            Azatin O                             1
                            Conserve SC                          3
                            Endeavor                             1

  Cost of application per poinsettia was calculated based on the number of poinsettias in the greenhouse at the time of application. Size of poinsettia pots are given as a diameter of the top of the pot, rounded to the nearest
centimeter.
                                                                                                                                                                                                                                      5

                                                   Downloaded from https://academic.oup.com/jipm/article/12/1/18/6254918 by guest on 24 September 2021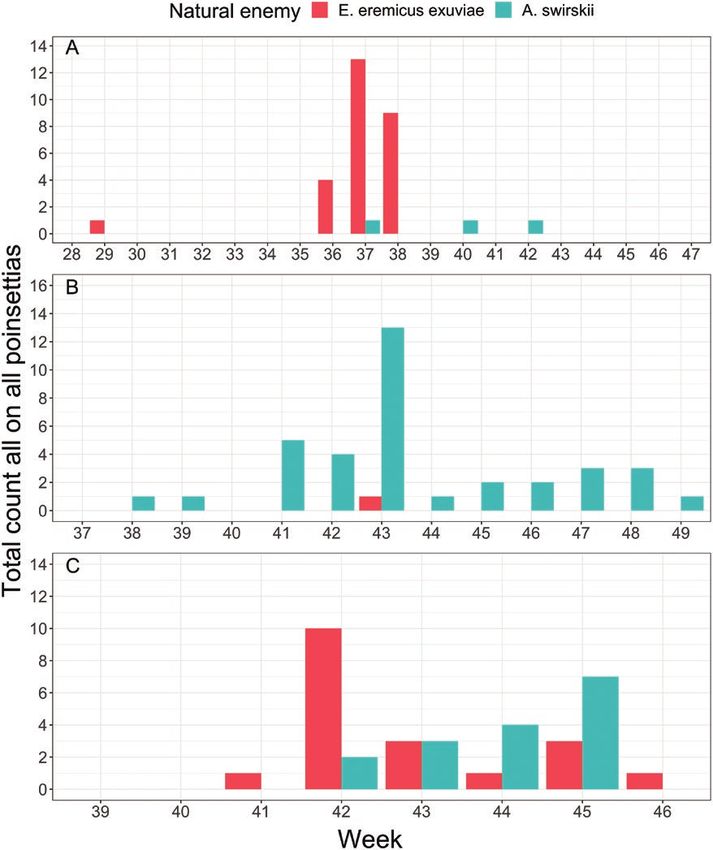
6                                                                                  Journal of Integrated Pest Management, 2021, Vol. 12, No. 1

                                                                                                                                                                 Downloaded from https://academic.oup.com/jipm/article/12/1/18/6254918 by guest on 24 September 2021
Fig. 2. Number of immature whiteflies per plant either on randomly sampled poinsettias in the IPM or conventionally managed greenhouse by calendar week
number for growers A, B, and C. Number of immature whiteflies are represented by box plots, where dots represent extreme cases (i.e., outliers), vertical
lines represent the top quartile of the counts, and the boxes (seen in grower A and B) represent the lower/middle and upper quartile of whitefly immatures per
poinsettia.

poinsettias with immature whiteflies reaching as high as 70% of                  conventional and biological control managed greenhouses (Hoddle
randomly sampled plants for grower A on week 40 (Fig. 3). The                    and Van Driesche 1999b, Van Driesche et al. 1999) to reduce the
average difference in proportion of poinsettias infested with white-             discrepancy in starting densities; however, introducing adult white-
flies between the IPM and conventionally managed greenhouses was                 flies into commercial poinsettia production was not considered an
0.30, 0.06, and 0.09 for growers A, B, and C, respectively (Fig. 3),             acceptable option in our case study.
although the final proportion of plants infested with whiteflies were                 In the IPM greenhouse (grower A), there was a specific cultivar
not significantly different (F1,4 = 158, P = 0.711). For grower A, the           that initially experienced an increase in whitefly density, which may
greater difference in proportion and number of immature white-                   have contributed to overall increased whitefly pressure in that par-
flies counted in the IPM greenhouse compared to the conventional                 ticular greenhouse. Higher whitefly densities on specific cultivars
greenhouse may be explained by lower overall whitefly pressure in                could be attributed to whitefly populations from the propagators or
the conventional greenhouse. Grower A used our monitoring data                   due to differences in B. tabaci performance (Medina-Ortega 2011)
to determine whether to make insecticidal applications in the con-               or natural enemy performance on different poinsettia cultivars
ventional greenhouse and thus, the lower whitefly densities are not              (Heinz and Parrella 1994b). Although that particular cultivar and
due to prophylactic use of insecticides, but rather, a lack of whitefly          initial whitefly infestation was relatively isolated to a few benches
pressure warranting insecticidal applications (Table 3). In a pre-               (out of 50 benches total), poinsettias were spaced throughout the
vious study, researchers introduced adult whiteflies in low-density              entire IPM greenhouse at week 34, resulting in increased spread of
greenhouses to produce similar starting initial whitefly pressure in             whitefly infestations within the greenhouse (Fig. 3A). We also found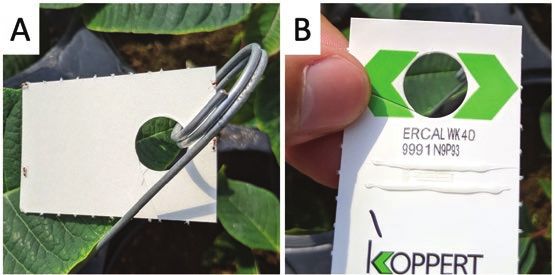
Journal of Integrated Pest Management, 2021, Vol. 12, No. 1                                                                                           7

                                                                                                                                                            Downloaded from https://academic.oup.com/jipm/article/12/1/18/6254918 by guest on 24 September 2021
Fig. 3. Proportion of poinsettias infested with whiteflies (any stage or density) on randomly sampled poinsettias in the IPM or conventionally management
greenhouse by calendar week number for growers A, B, and C.

fungus gnats on the yellow sticky traps and Echinothrips americanus            between our grower locations. Our lower parasitism rates at growers
Morgan (Thysanoptera: Thripidae) on poinsettias; however, densities            A and B compared to grower C could have been explained by the
were sufficiently low at all locations that no additional management           higher overall cumulative quantities of whitefly immatures (6,795,
was required by growers.                                                       4,487, and 314 for growers A, B, and C, respectively) or whitefly
    Recovery rate of natural enemies were relatively low at growers            exuviae (11,397, 3,095, and 198 for growers A, B, and C, respect-
A and B (Fig. 4), with the rate of parasitism reaching a maximum               ively). The parasitism rate may have also been underrepresented by
of 4.0% at week 37 for grower A and 0.8% at week 43 for grower                 quantifying E. eremicus exuviae instead of parasitized pupae; how-
B. At grower C, parasitism rates reached a peak of 71.4% at week               ever, variation in lighting, plant cultivars, and whitefly pupae raised
42 and a final parasitism rate of 1.7%. These parasitism rates are             concerns over reliability of E. eremicus pupae identification in our
similar to findings in other commercial poinsettia production trials.          trial. At grower C, red imported fire ants, Solenopsis invicta Buren
For example, Hoddle and Van Driesche (1999a) found up to 43%                   (Hymenoptera: Formicidae) were found in numerous pots and had
parasitism of B. tabaci by E. eremicus in color poinsettia produc-             removed all E. eremicus pupae from the release cards within 2 h
tion in one greenhouse, but a maximum of 30% in another which                  of release on week 40 (Fig. 5). The red imported fire ant is known
declined to 4–7% for the last few weeks of production. Some of                 for tending honeydew-producing insects (Zhou et al. 2015) and
discrepancy in parasitization rate was due to differences in emer-             engaging in intraguild predation (Harvey and Eubanks 2005),
gence rate of the introduced E. eremicus pupae (between 24.6 and               which may be problematic in our trial by reducing the density of
50.6% emergence rate) (Hoddle and Van Driesche 1999a), which                   E. eremicus without providing any direct suppression of B. tabaci.
could have also explained some differences in parasitization rate              Red imported fire ants were managed with granular incorporation of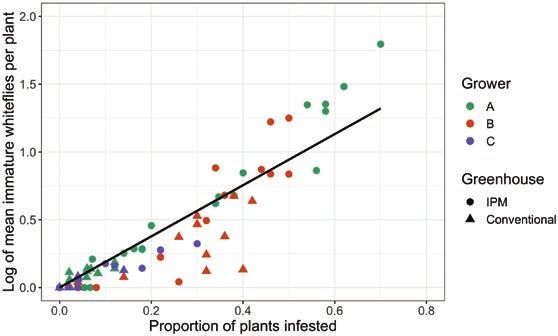
8                                                                                 Journal of Integrated Pest Management, 2021, Vol. 12, No. 1

                                                                                                                                                            Downloaded from https://academic.oup.com/jipm/article/12/1/18/6254918 by guest on 24 September 2021
Fig. 4. Total E. eremicus exuviae and A. swirskii counted on 50 randomly sampled poinsettias in the IPM greenhouse by calendar week for growers A, B, and
C. Absence of bars signifies a zero count for a given natural enemy for a particular sampling period.

                                                                                     Recovery rate of A. swirskii was also low, with a maximum
                                                                                 quantity of 1 (weeks 37, 40, and 41), 13 (week 43), and 16 (week
                                                                                 46) A. swirskii counted on all poinsettias at growers A, B, and C,
                                                                                 respectively (Fig. 4). Amblyseius swirskii is rather small and difficult
                                                                                 to find within the poinsettia plant canopy at lower densities. Even
                                                                                 when over 250 A. swirskii mites were released on a single chrys-
                                                                                 anthemum with prey, recover rate was approximately 25%, 2 wk
                                                                                 later (Buitenhuis et al. 2010). In our trial, we did not exceed over 20
                                                                                 A. swirskii per poinsettia, assuming that all A. swirskii distributed
                                                                                 through the mini-Airbug Hopper landed on poinsettias, possibly ex-
                                                                                 plaining the low recovery rate of A. swirskii.
Fig. 5. Photos of red imported fire ants (A) on the Ercal cards and after they       When considering the cost of inputs and labor, the cost of the
had removed all the E. eremicus pupae (B). The glue that is designed to          IPM strategy was between 0.57- and 3.0-fold the cost of conven-
adhere the E. eremicus pupae to the card was all that remained.                  tional management (Table 3), demonstrating the economic com-
                                                                                 petitiveness of using multiple natural enemies to manage B. tabaci
                                                                                 in commercial poinsettia production. Previous studies calculated
bifenthrin in all greenhouses, as required by the Texas Department of            conventional management of B. tabaci in commercial poinsettia
Agriculture for potted plants being shipped out of fire ant quarantine           production to cost between $0.09 and $0.14 per 15-cm poinsettia
areas (Miller 2018).                                                             when excluding labor costs (Hoddle and Van Driesche 1999a;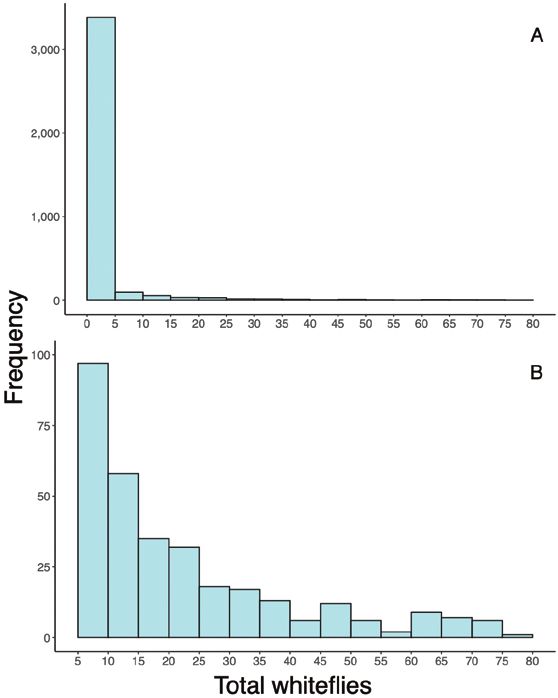
Journal of Integrated Pest Management, 2021, Vol. 12, No. 1                                                                                              9

Van Driesche et al. 2001, 2002; Van Driesche and Lyon 2003) and
up to $0.27 per poinsettia when including labor costs (Stevens et al.
2000). Despite our insecticide input costs being substantially lower
than the studies mentioned, the labor costs associated with releasing
natural enemies in this study compared to preparing and spraying
insecticides greatly favored the IPM strategy (Table 3). For example,
similar number of product applications at grower C (10 and 9 appli-
cations in the IPM and conventional strategy, respectively) resulted
in 70.3% lower labor costs in the IPM strategy compared to the
conventional strategy (Table 3).
    Previous studies found augmentative biological control programs
of B. tabaci on poinsettias to cost between 3- and 44-fold more than
conventional insecticide management (Hoddle and Van Driesche
1999a,b; Stevens et al. 2000; Collier and Van Steenwyk 2004), with

                                                                                                                                                               Downloaded from https://academic.oup.com/jipm/article/12/1/18/6254918 by guest on 24 September 2021
the exception of Van Driesche and Lyon (2003). In their study, the
cost of biological control was similar or even a bit lower than con-
ventional insecticide management due to decreased release densities
of E. eremicus and tandem use of insect growth regulators. We par-
tially attribute the competitive economics of our IPM strategy to
the lower overall release rates of natural enemies; with a range of
0.5–7.5 female E. eremicus per poinsettia (Van Driesche et al. 1999
and Van Driesche and Lyon 2003, respectively) in previous research
compared to the low peak of 0.32 female E. eremicus per poinsettia
in our study. The addition of A. swirskii to provide complementary
suppression of B. tabaci (Vafaie et al. 2020a, 2021a) and tandem use
of compatible insecticides (Van Driesche et al. 2001, Van Driesche
and Lyon 2003) also contributed to the competitive economics of
the IPM strategy. Acquiring equivalent or superior suppression of           Fig. 6. Frequency histogram for whitefly counts on randomly sampled
B. tabaci by decreasing the density of E. eremicus per release has          poinsettias for all growers, locations, and weeks pooled together including
been observed previously (Hoddle et al. 1999; Vafaie et al. 2020a,          relatively clean (less than five whiteflies) poinsettias (A) and excluding
                                                                            relatively clean plants (B). The vast majority of poinsettias had less than five
2021a), which may be explained by intraspecific competition
                                                                            whiteflies (A) and were subsequently removed from the histogram (B) to
through host feeding or super-parasitism when whitefly densities are
                                                                            scale the y-axis for plants containing five or more whiteflies. Bins are left-
low (Hoddle et al. 1999, Javad et al. 2005). When compared to input         closed, right-open, and represent intervals of five whiteflies each.
costs of other past insecticide rotations for whiteflies on poinsettias
($0.09–$0.14/15-cm poinsettia) (Hoddle and Van Driesche 1999b;
Van Driesche et al. 1999, 2001; Stevens et al. 2000; Van Driesche               Yellow sticky traps consistently detected whitefly adults at the
and Lyon 2003; Vafaie et al. 2020a), we see a 1.27-fold increase in         same time or earlier than detected through plant inspection for all
cost at most by using the IPM management strategy. It should be             growers and greenhouses (Figs. 2 and 8). However, yellow sticky
noted that our economic analysis could be considered superficial by         traps were not great indicators of actual whitefly densities; presence
only looking at input and simplifying labor costs. More in-depth            of whiteflies on sticky traps can be an indicator of a low whitefly
economic analyses may further favor strategies that rely on bio-            population density or may be due to higher attraction to nearby
logical control due to decreased depreciation costs of pesticide appli-     plants (Berlinger 1980). Attempts to correlate yellow sticky trap
cation equipment, annual Worker Protection Standard and pesticide           catches with whitefly densities have been inconsistent, depending on
applicator training requirements, and non-market costs, such as             factors such as whitefly species, crop, and density of yellow sticky
long-term effects on worker health and water quality, which have            traps (Pinto-Zevallos and Vänninen 2013). To rely on yellow sticky
been rarely quantified (Naranjo et al. 2019). The variation in poin-        cards as reliable indicators of whitefly densities, one trap needs to be
settia pot size, spacing, and greenhouse area under biological control      used per 18–20 plants in greenhouse tomato production (Gillespie
for all three grower locations may have also impacted economics in          and Quiring 1987), which would be considered impractical in poin-
our trial and merits further investigation.                                 settia production. Our density of yellow sticky traps ranged from
    The vast majority of plants inspected across all grower locations       one trap per 25–287 m2, which is within the sticky trap densities sug-
and inspection dates had 5 or less whiteflies of any stage on them          gested by suppliers, researchers, and extension officers worldwide
(Fig. 6), with very few plants having more than 25 whiteflies of all life   (one trap per 93–500 m2) (McDonough et al. 1999, Pinto-Zevallos
stages. The abundance of seemingly ‘clean’ plants can serve as a cau-       and Vänninen 2013). Due to the highly aggregated distribution of
tionary tale against limited monitoring of poinsettias. Distribution of     B. tabaci on poinsettias (Liu et al. 1993a), we would not suggest
B. tabaci on greenhouse-grown poinsettias is considered highly ag-          using less than one sticky trap per 300 m2 to detect the presence of
gregated both between plants and within a plant (Liu et al. 1993a).         B. tabaci, and additional traps would certainly be needed to better
We anticipated that flagging plants and revisiting the same plants          estimate densities and spatial distribution of B. tabaci populations
weekly would provide more consistent and reliable monitoring                within the greenhouse.
data. Although the flagged plants consistently had lower standard               To reduce labor costs associated with scouting, growers may
error, flagged plants also failed to represent plants with high whitefly    consider ‘presence/absence’ sampling, also known as ‘binomial sam-
densities (Fig. 7), perhaps supporting the use of randomly sampled          pling’, rather than counting all whitefly individuals on a given plant.
plants in monitoring compared to revisiting flagged plants.                 Binomial sampling has been investigated for B. tabaci on cantaloupe
10 Journal of Integrated Pest Management, 2021, Vol. 12, No. 1
Downloaded from https://academic.oup.com/jipm/article/12/1/18/6254918 by guest on 24 September 2021
Fig. 7. Mean immature whiteflies (± SE) per poinsettia either on flagged plants or randomly sampled plants by calendar week number for growers A, B, and
C. Fifty random and approximately 50 flagged plants were inspected each sampling period. Only select flagged leaves were inspected on the flagged poinsettias,
whereas up 20 randomly selected leaves were inspected on randomly sampled poinsettias.
(Tonhasca et al. 1994), watermelon (Lima et al. 2017), greenhouse is the maximum number of whitefly immatures found on a plant
ornamentals (Liu et al. 1993a,b; Burns et al. 1999), cotton (Diehl within a sampling time period. Growers may consider curative in-
et al. 1994, Naranjo et al. 1996), and greenhouse vegetable crops secticide applications when the proportion of plants infested exceeds
(Spinner et al. 2011), frequently correlating log variance of whitefly 0.4 (or 40%), as the highest number of immatures on a single plant
counts between plants with mean densities of B. tabaci within plants predicted starts to exceed densities found at the retailer (~70 nymphs
using Taylor’s power law method (Taylor 1961). Across all growers, per plant) (Vafaie et al. 2020b). Our predictive model was based
greenhouses, and weeks, we found a strong correlation between pro- on the limits of our dataset, with proportion data ranging from 0
portion of poinsettias infested and log-transformed mean whitefly to 0.7 poinsettias infested with whiteflies, mean infestation densities
immatures (P < 0.001, adjusted r2 = 0.898; Fig. 9). The number of ranging from 0 to 26.28 ± 6.45 immatures per plant, and a max-
immature whiteflies found on poinsettias could be described by the imum of up to 406 immature whiteflies found on a single poinsettia.
equation: y = e(1.886x), where y is the average number of whitefly However, caution should also be exercised when using presence/ab-
immatures per plant, e is the exponential function, and x is the pro- sence sampling, as the predictive power of this method decreases
portion of plants that have immature whiteflies. We also found a with decreasing sampling size and time spent inspecting a given
similar correlation when comparing proportion of plants infested plant (Burns et al. 1999). Growers can benefit from future research
with log-transformed maximum number of whitefly immatures investigating minimum sample size and validating the robustness of
(P < 0.001, adjusted r2 = 0.777): ymax = exp(10.4098x), where ymax using binomial sampling to predict whitefly density.Journal of Integrated Pest Management, 2021, Vol. 12, No. 1 11
Downloaded from https://academic.oup.com/jipm/article/12/1/18/6254918 by guest on 24 September 2021
Fig. 8. Number of adult whiteflies on yellow sticky traps from IPM or conventionally management greenhouse by calendar week number for growers A, B, and
C. Number of adult whiteflies on sticky traps are represented by box plots, where dots represent extreme cases (i.e., outliers), vertical lines represent the top
or bottom quartile, and the boxes represent the lower, middle (i.e. median), and upper quartile for adult whiteflies counted. The number of whiteflies counted
on a given sampling date was reduced by the maximum number of whiteflies found previously on the yellow traps to determine the quantity of new whitefly
adults trapped within the given sampling period.
Recommendations
Growers cannot rely on yellow sticky traps alone to determine
whitefly densities, but can use yellow sticky traps (one trap per 300 m2
at minimum) as good indicators of when to start scouting poinsettias
for whiteflies within greenhouse-grown poinsettias. Growers can re-
duce labor costs associated with scouting for whiteflies on poinsettias
by using ‘presence/absence’ sampling rather than counting all individ-
uals on a plant as a predictor of average whitefly density or max-
imum immature whiteflies per plant; however, additional validation
is needed to determine the minimum number of poinsettias needed to
be sampled and time spent scouting each plant to still reliably predict
whitefly densities. Whiteflies are unevenly distributed within a green-
house, so care should be taken to sample throughout the greenhouse
Fig. 9. Relationship between average immature whiteflies observed per plant to detect any areas that may have high whitefly densities.
(log-transformed) and proportion of plants infested with whiteflies (P < 0.001, Whitefly management was most effective throughout the
adjusted r2 = 0.898; y = e(1.886x), where ‘e’ is the exponential function). growing season using conventional management strategies;12 Journal of Integrated Pest Management, 2021, Vol. 12, No. 1
however, both IPM and conventional management strategies pro- Friends of the Earth. 2017. Nursery and retailer commitments. (https://foe.org/
vided sufficiently low whitefly densities and proportion of plants nursery-retailer-commitments/) (accessed 8 August 2020).
infested for retail and were economically comparable. Both strat- Ghasemzadeh, S., A. Leman, and G. J. Messelink. 2017. Biological control of
Echinothrips americanus by phytoseiid predatory mites and the effect of
egies relied on effective monitoring data to make spray applica-
pollen as supplemental food. Exp. Appl. Acarol. 73: 209–221.
tion decisions rather than prophylactic use of insecticides. Based
Gillespie, D. R., and D. Quiring. 1987. Yellow sticky traps for detecting and
on susceptibility of local B. tabaci populations to currently avail-
monitoring greenhouse whitefly (Homoptera: Aleyrodidae) adults on
able insecticides, the current cost of natural enemies, and recom- greenhouse tomato crops. J. Econ. Entomol. 80: 675–679.
mended natural enemy release rates, growers in Texas, United Harvey, C. T., and M. D. Eubanks. 2005. Intraguild predation of parasitoids
States may consider releasing E. eremicus weekly (between 0.97 by Solenopsis invicta: a non-disruptive interaction. Entomol. Exp. Appl.
and 2.58 pupae/m2) and A. swirskii every 4 wk (between 26.9 and 114: 127–135.
42 mites/m2) with focused insecticidal treatments when B. tabaci Heinz, K. M., and M. P. Parrella. 1994a. Biological control of Bemisia
populations continue to increase over several consecutive sam- argentifolii (Homoptera: Aleyrodidae) infesting Euphorbia pulcherrima:
pling periods. Added benefits of reduced insecticide use include evaluations of releases of Encarsia luteola (Hympenoptera: Aphelinidae)
and Delphastus pusillus (Coleoptera: Coccinellidae). Biol. Control 23:
lack of re-entry interval, less concerns with phytotoxicity or in-
Downloaded from https://academic.oup.com/jipm/article/12/1/18/6254918 by guest on 24 September 2021
1343–1353.
secticide residues, and decreased concern for pesticide applicator
Heinz, K. M., and M. P. Parrella. 1994b. Poinsettia (Euphorbia pulcherrima
health, especially during high temperatures.
Willd. ex Kotlz.) cultivar-mediated differences in performance of five
natural enemies of Bemisia argentifolii Bellows and Perring, n. sp.
(Homoptera: Aleyrodidae). Biol. Control 4: 305–318.
Acknowledgments Hoddle, M. S., and R. G. Van Driesche. 1996. Evaluation of Encarsia formosa
This article is part of the Ph.D. dissertation to be awarded by the Texas A&M (Hymenoptera: Aphelinidae) to control Bemisia argentifolii (Homoptera:
University to EKV. We would like to thank Dr. Cindy McKenzie with USDA- Aleyrodidae) on poinsettia (Euphorbia pulcherrima): a life table analysis.
ARS for species identification, and David Newburn and Christine Bays for as- Fla Entomol. 79: 1–12.
sisting with whitefly counts and releases of natural enemies. We would like to Hoddle, M. S., and R. G. Van Driesche. 1999a. Evaluation of inundative re-
thank Koppert Biological Systems for providing the natural enemies, coopera- leases of Eretmocerus eremicus and Encarsia formosa Beltsville strain in
tive growers for our trial locations, and insecticide distributors for insecticide commercial greenhouses for control of Bemisia argentifolii (Hemiptera:
pricing information. Aleyrodidae) on poinsettia stock plants. J. Econ. Entomol. 92: 811–824.
Hoddle, M. S., and R. G. Van Driesche. 1999b. Evaluation of Eretmocerus
eremicus and Encarsia formosa (Hymenoptera: Aphelinidae) Beltsville
References Cited strain in commercial greenhouses for biological control of Bemisia
Bajeux, N., F. Grognard, and L. Mailleret. 2017. Augmentative biocon- argentifolii (Homoptera: Aleyrodidae) on colored poinsettia plants. Fla
trol when natural enemies are subject to Allee effects. J. Math. Biol. 74: Entomol. 82: 556.
1561–1587. Hoddle, M. S., R. Van Driesche, and J. Sanderson. 1997. Biological control
Berlinger, M. J. 1980. A yellow sticky trap for whiteflies: Trialeurodes of Bemisia argentifolii (Homoptera: Aleyrodidae) on poinsettia with
vaporariorum and Bemisia tabaci (Aleurodidae). Entomol. Exp. Appl. 27: inundative releases of Encarsia formosa Beltsville strain (Hymenoptera:
98–102. Aphelinidae): can parasitoid reproduction augment inundative releases? J.
Bethke, J. A., and R. A. Cloyd. 2009. Pesticide use in ornamental production: Econ. Entomol. 90: 910–924.
what are the benefits? Pest Manag. Sci. 65: 345–350. Hoddle, M. S., R. G. Van Driesche, J. S. Elkinton, and J. P. Sanderson. 1998.
Brown, J. K., D. R. Frohlich, and R. C. Rosell. 1995. The sweetpotato or Discovery and utilization of Bemisia argentifolii patches by Eretmocerus
silverleaf whiteflies: biotypes of Bemisia tabaci or a species complex? eremicus and Encarsia formosa (Beltsville strain) in greenhouses. Entomol.
Annu. Rev. Entomol. 40: 511–534. Exp. Appl. 87: 15–28.
Buitenhuis, R., L. Shipp, and C. Scott-Dupree. 2010. Dispersal of Amblyseius Hoddle, M. S., R. G. Van Driesche, J. P. Sanderson, and O. P. J. M. Minkenberg.
swirskii Athias-Henriot (Acari: Phytoseiidae) on potted greenhouse chrys- 1999. Biological control of Bemisia argentifolii (Hemiptera: Aleyrodidae)
anthemum. Biol. Control 52: 110–114. on poinsettia with inundative releases of Eretmocerus eremicus
Burns, K. A., K. M. Heinz, and B. M. Drees. 1999. A multiple species ap- (Hymenoptera: Aphelinidae): do release rates affect parasitism? Bull.
proach to binomial scouting of greenhouse ornamentals, pp. 116–120. In Entomol. Res. 89: 41–51.
Southern Nursery Association Research Conference, Atlanta, Georgia. Javad, M., P. W. De Jong, and J. C. van Lenteren. 2005. Intra- and interspecific
Collier, T., and R. Van Steenwyk. 2004. A critical evaluation of augmentative host discrimination in arrhenotokous and thelytokous Eretmocerus spp.
biological control. Biol. Control 31: 245–256. Biol. Control 33: 74–80.
Costa, H. S., J. K. Brown, S. Sivasupramaniam, and J. Bird. 1993. Regional Kneitel, J. M., and J. M. Chase. 2004. Trade-offs in community ecology:
distribution, insecticide resistance, and reciprocal crosses between the linking spatial scales and species coexistence. Ecol. Lett. 7: 69–80.
A and B biotypes of Bemisia tabaci. Int. J. Trop. Insect Sci. 14: 255–266. Kuznetsova, A., P. B. Brockhoff, and R. H. B. Christensen. 2017. lmerTest
Courchamp, F., T. Clutton-Brock, and B. Grenfell. 1999. Inverse density de- package: tests in linear mixed effects models. J. Stat. Softw. 82: 1–26.
pendence and the Allee effect. Trends Ecol. Evol. 14: 405–410. Lima, C. H., R. A. Sarmento, P. S. Pereira, T. V. Galdino, F. A. Santos,
Dennehy, T. J., B. A. DeGain, V. S. Harpold, J. K. Brown, S. Morin, J. Silva, and M. C. Picanço. 2017. Feasible sampling plan for Bemisia
J. A. Fabrick, F. J. Byrne, and R. L. Nichols. 2005. New challenges to man- tabaci control decision-making in watermelon fields. Pest Manag. Sci.
agement of whitefly resistance to insecticides in Arizona. Univ. Arizona 73: 2345–2352.
Coll. Agric. Life Sci. Veg. Rep. 2005: 1–31. Liu, T.-X., R. D. Oetting, and G. D. Buntin. 1993a. Distribution of Trialeurodes
Diehl, J. W., S. E. Naranjo, and P. C. Ellsworth. 1994. Whitefly growth regu- vaporariorum and Bemisia tabaci (Homoptera: Aleyrodidae) on some
lators: a field sampling protocol for nymphs. Cotton: Coll. Agric. Rep. 2: greenhouse-grown ornamental plants. J. Entomol. Sci. 28: 102–112.
265–271. Liu, T. X., R. D. Oetting, and G. D. Buntin. 1993b. Population dynamics
Ecke, P. I., J. E. Faust, A. Higgins, and J. Williams. 2004. The Ecke poinsettia and distribution of Trialeurodes vaporariorum and Bemisia tabaci
manual. Ball Publishing, Batavia, IL. (Homoptera: Aleyrodidae) on poinsettia following applications of three
Frewin, A. J., C. Scott-Dupree, G. Murphy, and R. Hanner. 2014. Demographic chemical insecticides. J. Entomol. Sci. 28: 126–135.
trends in mixed Bemisia tabaci (Hemiptera: Aleyrodidae) cryptica spe- Luo, C., C. M. Jones, G. Devine, F. Zhang, I. Denholm, and K. Gorman.
cies populations in commercial poinsettia under biological control- and 2010. Insecticide resistance in Bemisia tabaci biotype Q (Hemiptera:
insecticide-based management. J. Econ. Entomol. 107: 1150–1155. Aleyrodidae) from China. Crop Prot. 29: 429–434.Journal of Integrated Pest Management, 2021, Vol. 12, No. 1 13
McDonough, M. J., D. Gerace, and M. E. Ascerno. 1999. Whiteflies in Taylor, L. R. 1961. Aggregation, variance and the mean. Nature 189: 732–735.
commercial greenhouse poinsettia production. FO-07373. (http://cues. Tonhasca, A., J. C. Palumbo, and D. N. Byrne. 1994. Binomial sampling plans
cfans.umn.edu/old/extpubs/7373whiteflies/DG7373.html) (accessed 4 for estimating Bemisia tabaci populations in cantaloupes. Res. Popul. Ecol.
September 2020). (Kyoto) 36: 181–186.
McKenzie, C. L., V. Kumar, C. L. Palmer, R. D. Oetting, and L. S. Osborne. U.S. Department of Agriculture. 2020. National Agricultural Statistics Service.
2014. Chemical class rotations for control of Bemisia tabaci (Hemiptera: (https://quickstats.nass.usda.gov/) (accessed 15 September 2020).
Aleyrodidae) on poinsettia and their effect on cryptic species population U.S. Environmental Protection Agency. 2017. Revised certification standards for
composition. Pest Manag. Sci. 70: 1573–1587. pesticide applicators. (https://www.epa.gov/pesticide-worker-safety/revised-
Medina-Ortega, K. J. 2011. Poinsettia (Euphorbia pulcherrima Willd. ex certification-standards-pesticide-applicators) (accessed 20 August 2020).
Klotzsch: Euphorbiacea) resistance mechanisms against the silverleaf Vafaie, E. K., H. B. Pemberton, M. Gu, D. Kerns, M. D. Eubanks, and
whitefly, Bemisia tabaci (Gennadius) (Hemiptera: Aleyrodidae) biotype B. K. M. Heinz. 2020a. A comparison of repetitive releases of single or mul-
Doctoral dissertation. The Ohio State University, Columbus, OH. tiple natural enemy species on the suppression of Bemisia tabaci infesting
Miller, S. 2018. Texas Department of Agriculture TDA Mission Statement. (https:// poinsettias. Biol. Control 151: 104407.
www.texasagriculture.gov/Portals/0/Files/ACP/PQ/Quarantines/Fire%20 Vafaie, E. K., H. B. Pemberton, M. Gu, D. Kerns, M. D. Eubanks, and
Ant/Imported_Fire_Ant_Shipper_Guide.pdf) (accessed 25 September 2020). K. M. Heinz. 2020b. Whitefly abundance on rooted poinsettia cuttings
Murphy, G., M. Short, A. M. Cooper, M. Fast, and D. Neal. 2008. Biological
Downloaded from https://academic.oup.com/jipm/article/12/1/18/6254918 by guest on 24 September 2021
and finished poinsettias. HortTechnology 30: 486–491.
control of whitefly in poinsettia in Ontario, Canada. Integr. Control Prot. Vafaie, E. K., H. B. Pemberton, M. Gu, D. Kerns, M. D. Eubanks, and
Crop. Temp. Clim. 32: 139–142. K. M. Heinz. 2021a. Increasing natural enemy diversity to respond to un-
Naranjo, S. E., H. M. Flint, and T. J. Henneberry. 1996. Binomial sampling planned challenges to augmentative biological control. Environ. Entomol.
plans for estimating and classifying population density of adult Bemisia (in press).
tabaci in cotton. Entomol. Exp. Appl. 80: 343–353. Vafaie, E., H. B. Pemberton, M. Gu, M. D. Eubanks, D. L. Kerns, and
Naranjo, S. E., G. B. Frisvold, and P. C. Ellsworth. 2019. Economic value of K. M. Heinz. 2021b. Using multiple natural enemies to manage whiteflies
arthropod biological control, pp. 49–85. In D. W. Onstad and P. R. Crain in commercial poinsettia production dataset. Mendeley Data V1.
(eds.), The economics of integrated pest management for insects. CABI, Van Driesche, R. G., and S. Lyon. 2003. Commercial adoption of bio-
Oxfordshire, United Kingdom. logical control-based IPM for whiteflies in poinsettia. Fla Entomol. 86:
Perring, T. M. 2001. The Bemisia tabaci species complex. Crop Prot. 20: 481–483.
725–737. Van Driesche, R. G., S. M. Lyon, M. S. Hoddle, S. Roy, and J. P. Sanderson.
Pinto-Zevallos, D. M., and I. Vänninen. 2013. Yellow sticky traps for 1999. Assessment of cost and performance of Eretmocerus eremicus
decision-making in whitefly management: what has been achieved? Crop (Hymenoptera: Aphelinidae) for whitefly (Homoptera: Aleyrodidae) con-
Prot. 47: 74–84. trol in commercial poinsettias crops. Fla Entomol. 82: 570.
R Studio Team. 2015. RStudio: integrated development for R. RStudio, PBC, Van Driesche, R. G., M. S. Hoddle, S. M. Lyon, J. P. Sanderson,
Boston, MA. R. G. Van Driesche, S. M. Lyon, and J. P. Sanderson. 2001. Compatibility
Seiedy, M., S. Soleymani, and M. Hakimitabar. 2017. Development and repro- of insect growth regulators with Eretmocerus eremicus (Hymenoptera:
duction of the predatory mite Amblyseius swirskii Athias-Henriot (Acari: Aphelinidae) for whitefly (Homoptera: Aleyrodidae) control on poinset-
Phytoseiidae) on Tetranychus urticae Koch (Acari: Tetranychidae) and Bemisia tias I. Laboratory assays. Biol. Control 20: 122–131.
tabaci Gennadius (Heteroptera: Aleyrodidae). Int. J. Acarol. 43: 160–164. Van Driesche, R. G., S. Lyon, K. Jacques, T. Smith, and P. Lopes. 2002.
Shatters, R. G., Jr, C. A. Powell, L. M. Boykin, H. Liansheng, and Comparative cost of chemical and biological whitefly control in poin-
C. L. McKenzie. 2009. Improved DNA barcoding method for Bemisia settia: is there a gap? Fla Entomol. 85: 488–493.
tabaci and related Aleyrodidae: development of universal and Bemisia van Lenteren, J. C. 2000. Success in biological control of arthropods by aug-
tabaci biotype-specific mitochondrial cytochrome c oxidase I polymerase mentation of natural enemies, pp. 77–103. In G. Gurr and S. Wratten
chain reaction primers. J. Econ. Entomol. 102: 750–758. (eds.), Biological control: Measures of Success. Springer, Dordrecht, the
Shu-Sheng, L., J. Colvin, and P. J. De Barro. 2012. Species concepts as applied Netherlands.
to the whitefly Bemisia tabaci systematics: how many species are there? J. van Lenteren, J. C., and V. H. P. Bueno. 2003. Augmentative biological control
Integr. Agric. 11: 176–186. of arthropods in Latin America. BioControl. 48: 123–139.
Spinner, J. E., S. Mansfield, L. J. Pilkington, and P. Thomson. 2011. Sampling Vilsack, T., and J. T. Reilly. 2015. Census of horticultural specialties (2014).
protocol to detect Bemisia tabaci (Gennadius) (Hemiptera: Aleyrodidae) Usda.Gov.
in mixed species populations in greenhouse vegetable crops. Aust. Wickham, H. 2016. ggplot2: elegant graphics for data analysis. Springer-Verlag,
J. Entomol. 50: 276–280. New York. (https://www.nass.usda.gov/Publications/AgCensus/2012/Online_
Stevens, T. J., 3rd, R. L. Kilmer, and S. J. Glenn. 2000. An economic com- Resources/Census_of_Horticulture_Specialties/HORTIC.pdf) (accessed 14
parison of biological and conventional control strategies for whiteflies August 2020).
(Homoptera: Aleyrodidae) in greenhouse poinsettias. J. Econ. Entomol. Zhou, A. M., D. Wu, G. W. Liang, Y. Y. Lu, and Y. J. Xu. 2015. Effects of tending
93: 623–629. by Solenopsis invicta (Hymenoptera: Formicidae) on the sugar composition
Tay, W. T., G. A. Evans, L. M. Boykin, and P. J. de Barro. 2012. Will the real and concentration in the honeydew of an invasive mealybug, Phenacoccus
Bemisia tabaci please stand up? PLoS ONE 7: 7–11. solenopsis (Hemiptera: Pseudococcidae). Ethology 121: 492–500.You can also read