Postpartum meloxicam administration alters plasma haptoglobin, polyunsaturated fatty acid, and oxylipid concentrations in postpartum ewes ...
←
→
Page content transcription
If your browser does not render page correctly, please read the page content below
Olagaray et al. Journal of Animal Science and Biotechnology                (2020) 11:68
https://doi.org/10.1186/s40104-020-00473-y

 RESEARCH                                                                                                                                           Open Access

Postpartum meloxicam administration
alters plasma haptoglobin, polyunsaturated
fatty acid, and oxylipid concentrations in
postpartum ewes
Katie E. Olagaray1, Barry J. Bradford1* , Lorraine M. Sordillo2, Jeffery C. Gandy2, Laman K. Mamedova1,
Turner H. Swartz1, Trey D. Jackson3, Emma K. Persoon3, Caitlin S. Shugart3 and Curtis R. Youngs3

  Abstract
  Background: Postpartum inflammation is a natural and necessary response; however, a dysfunctional inflammatory
  response can be detrimental to animal productivity. The objective of this study was to determine the effects of a
  non-steroidal anti-inflammatory drug (meloxicam) on ewe postpartum inflammatory response, ewe plasma
  polyunsaturated fatty acid and oxylipid concentrations, and lamb growth.
  Results: After lambing, 36 Hampshire and Hampshire × Suffolk ewes were sequentially assigned within type of
  birth to control (n = 17) or meloxicam orally administered on d 1 and 4 of lactation (MEL; 90 mg, n = 19). Milk and
  blood samples were collected on d 1 (prior to treatment) and d 4. Milk glucose-6-phosphate was not affected by
  MEL. Plasma haptoglobin (Hp) concentrations were less for MEL ewes; control ewes with greater d 1 Hp
  concentrations had elevated Hp on d 4, but this was not the case for MEL-treated ewes. Treatment with MEL
  increased plasma arachidonic acid concentration by more than 4-fold in ewes rearing singles but decreased
  concentrations of 9,10-dihydroxyoctadecenoic acid, prostaglandin F2α, 8-iso-prostaglandin E2, and 8,9-
  dihydroxyeicosatetraenoic acid. Nine oxylipids in plasma had interactions of treatment with d 1 Hp concentration,
  all of which revealed positive associations between d 1 Hp and d 4 oxylipid concentrations for CON, but neutral or
  negative relationships for MEL. MEL decreased 13-hydroxyoctadecadienoic acid:13-oxooctadecadienoic acid ratio
  and tended to increase 9-hydroxyoctadecadienoic acid:9-oxooctadecadienoic acid ratio (both dependent on d 1
  values), indicating progressive metabolism of linoleic acid-derived oxylipids occurred by enzymatic oxidation after
  MEL treatment. Meloxicam reduced oxylipids generated across oxygenation pathways, potentially due to an
  improved redox state.
  Conclusions: Postpartum MEL treatment of ewes decreased plasma concentrations of Hp and several oxylipids,
  with the greatest impact in ewes with biomarkers reflecting a greater inflammatory state before treatment. Anti-
  inflammatory strategies may help resolve excessive postpartum inflammation in some dams.
  Keywords: Eicosanoid, Inflammation, Lactation, Nonsteroidal anti-inflammatory drug, Sheep

* Correspondence: bjbrad@msu.edu
1
 Department of Animal Sciences and Industry, Kansas State University,
Manhattan 66506, USA
Full list of author information is available at the end of the article

                                        © The Author(s). 2020 Open Access This article is licensed under a Creative Commons Attribution 4.0 International License,
                                        which permits use, sharing, adaptation, distribution and reproduction in any medium or format, as long as you give
                                        appropriate credit to the original author(s) and the source, provide a link to the Creative Commons licence, and indicate if
                                        changes were made. The images or other third party material in this article are included in the article's Creative Commons
                                        licence, unless indicated otherwise in a credit line to the material. If material is not included in the article's Creative Commons
                                        licence and your intended use is not permitted by statutory regulation or exceeds the permitted use, you will need to obtain
                                        permission directly from the copyright holder. To view a copy of this licence, visit http://creativecommons.org/licenses/by/4.0/.
                                        The Creative Commons Public Domain Dedication waiver (http://creativecommons.org/publicdomain/zero/1.0/) applies to the
                                        data made available in this article, unless otherwise stated in a credit line to the data.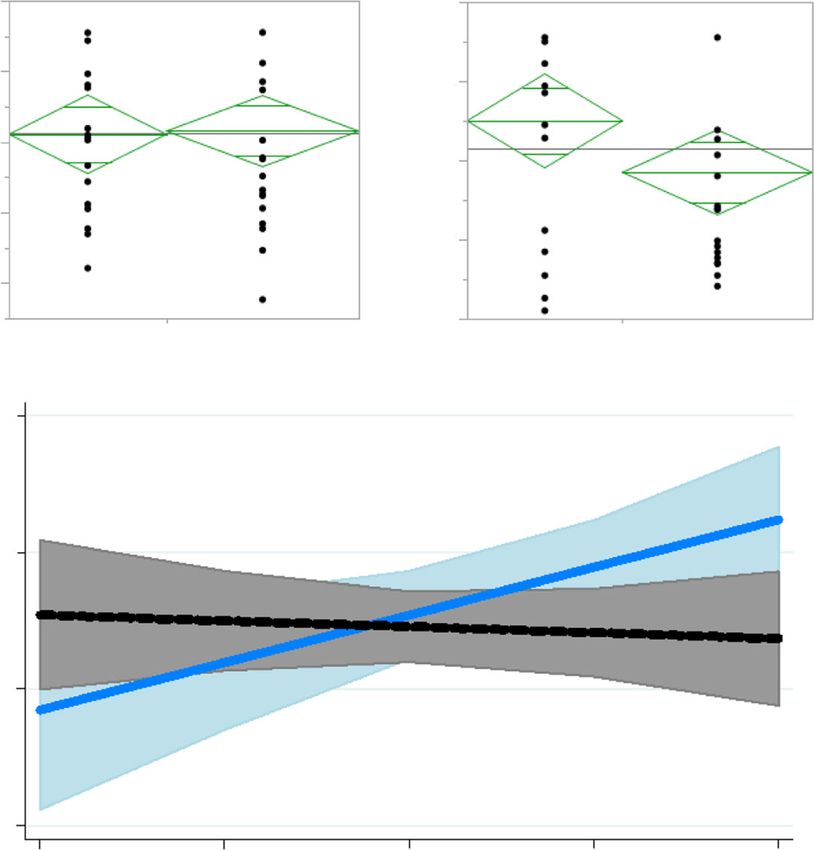
Olagaray et al. Journal of Animal Science and Biotechnology   (2020) 11:68                                             Page 2 of 14

Background                                                             Methods
Inflammation is a natural and necessary biological re-                 Experimental procedures were approved by the Iowa
sponse to parturition; however, an uncontrolled inflamma-              State University Institutional Animal Care and Use
tory response can be detrimental to animal productivity.               Committee (protocol #5-17-8532-O).
Postpartum inflammation has been well established in
dairy cattle [1] with greater degrees of inflammation asso-            Animals and treatments
ciated with decreased milk production [2], increased in-               Thirty-six ewes lambing during the 2018 winter lambing
nate immune response [3], and decreased hazard of                      season at the Iowa State University Sheep Teaching
conception [4]. Use of nonsteroidal anti-inflammatory                  Farm were used in a randomized design. At lambing
drugs (NSAID) to attenuate early lactation inflammation                ewes were sequentially assigned within type of birth (i.e.
has been successful to increase both early lactation [5, 6]            singleton, twin) to control (CON; n = 17) or treatment
and whole-lactation milk production [7].                               with meloxicam (MEL; n = 19). A dose of 90 mg of
   Increased plasma concentrations of the positive acute               meloxicam, approximately 1 mg/kg BW (six 15 mg tab-
phase proteins α1-acid glycoprotein, haptoglobin, and ce-              lets in a #13 veterinary capsule; Torpac Inc., Fairfield,
ruloplasmin, suggests sheep also experience postpartum                 NJ) was administered orally within 24 h of lambing (d 1)
inflammation [8]. To our knowledge, associations of post-              and again on d 4 of lactation. Treatment time points
partum inflammatory biomarkers with health and prod-                   were chosen for the first to be the most proximal time
uctivity of ewes and their lambs have not been evaluated,              to lambing without hindering placenta expulsion [14],
nor have there been any studies that investigated anti-                and the second to follow 3 d later, based on the 72 h
inflammatory intervention strategies in sheep. Meloxicam               clearance rate of meloxicam in sheep [17, 18].
is non-steroidal anti-inflammatory drug approved for use                 Ewes and lambs were housed in a dry lot barn from
in Australia, New Zealand, and Canada, but the scope of                the time of birth until weaning. Ewes typically lambed in
research has been limited to its analgesic application dur-            communal lambing pens and were then moved into indi-
ing events such as lameness [9], castration, tail docking              vidual 4′ × 5′ postpartum acclimation pens for no more
[10], and mulesing [11]. If postpartum meloxicam admin-                than 48 h. If a lamb was not thriving, the ewe and
istration induces responses in ewes similar to those re-               lamb(s) may have stayed in the individual postpartum
ported in dairy cattle [5–7], there is potential to improve            pen for up to 96 h. The number of lambs born and
ewe health and increase ewe milk production with subse-                reared were recorded. Fewer lambs were reared than
quent increases in growth of suckling lambs.                           born because of lamb death and removal of lamb(s) from
   Meloxicam decreases inflammation by inhibiting                      ewes with insufficient milk. Descriptive statistics of ewes
cyclooxygenase-2 (COX-2), the enzyme responsible for                   and lambs pre-treatment are presented in Table 1.
converting polyunsaturated fatty acids (PUFA) to oxyli-                  To avoid the potential stress associated with frequent
pids that include prostaglandins, thromboxanes, and leu-               sorting and weighing of lambs at specific d of age, which
kotrienes [12]. The inhibitory action of meloxicam on                  could adversely impact lamb growth performance, lambs
COX-2 is known, but much remains to be elucidated                      were weighed and weaned in groups. Lambs were
with respect to the mechanism through which meloxi-                    weighed at approximately 30 d of age (32 ± 2 d), weaning
cam changes physiology. The few plasma parameters                      (61 ± 6 d of age), and approximately 30 and 60 d post-
that have been measured (Hp and serum amyloid A) in                    weaning (90 ± 5 and 120 ± 6 d of age, respectively). To
response to postpartum meloxicam treatment in cows                     reflect potential treatment effects on lamb weight gained
were unaltered [7, 13, 14]. Despite the direct effect of               per ewe, birth weights were removed, and lamb weights
meloxicam on one of the enzymatic pathways respon-                     standardized to a constant d of age. For example, 30-d
sible for oxylipid synthesis, to our knowledge investiga-              lamb weight gain was calculated by subtracting lamb
tion of how meloxicam might create shifts within the                   birth weight from actual lamb weight (near 30 d of age)
oxylipid network has been limited to knee synovial fluid               and then dividing the resultant value by the lamb’s age
in horses [15] and humans [16].                                        (in d) to acquire an average daily gain (ADG). The
   Our primary objective was to determine if postpartum                lamb’s ADG was then multiplied by 30 to achieve weight
meloxicam administration to ewes would alter biomarkers                gained by 30 d. Because the effect of ewe meloxicam
of systemic inflammation. Our secondary objective was to               treatment on lamb growth was evaluated as lamb weight
determine the effect of postpartum meloxicam treatment of              gained per ewe, for twin-rearing ewes it represents the
ewes on offspring growth. We hypothesized that postpartum              combined weight gain of each twin lamb.
meloxicam administration to ewes would reduce biomarkers
of systemic inflammation, increase ewe milk production,                Sampling and analysis
and lead to greater lamb growth, particularly for ewes                 Blood samples were collected from each ewe within 24 h
rearing twins.                                                         of lambing (immediately prior to MEL treatment) and
Olagaray et al. Journal of Animal Science and Biotechnology   (2020) 11:68                                             Page 3 of 14

Table 1 Descriptive statistics for control ewes, ewes treated with 90 mg meloxicam on d 1 and 4 after lambing, and their lambs
                                            Control                                            Meloxicam
                                            Mean ± SD                  Range                   Mean ± SD                 Range
Ewe data
  n                                         17                                                 19
Breed
  Hampshire                                 12 (71%)                                           16 (84%)
  Hampshire × Suffolk                       5 (29%)                                            3 (16%)
Parity                                      4.2 ± 2.2                        1–8               3.2 ± 2.1                    1–7
Weight, kg                                  97.5 ± 15.1                73.5–122.0              90.4 ± 17.3               64.9–142.4
Total No. lambs born/trt                    28                                                 33
Avg. No. lambs born/ewe                     1.65 ± 0.49                      1–2               1.74 ± 0.56                  1–3
  1                                         6 (33%)                                            6 (32%)
  2                                         11 (56%)                                           12 (63%)
  3                                         0                                                  1 (5%)
Avg. No. lambs reared                       1.59 ± 0.51                      1–2               1.63 ± 0.50                  1–2
Total No. lambs reared                      27                                                 31
  1                                         7 (41%)                                            7 (37%)
  2                                         10 (59%)                                           12 (63%)
Sire Breed
  Hampshire                                 13 (76%)                                           16 (84%)
  Hampshire × Suffolk                       4 (24%)                                            3 (16%)
Lamb data
  Sex of lamb
      Male                                  16 (59%)                                           16 (48%)
      Female                                11 (41%)                                           15 (52%)
  Birth weight, kg                          6.7 ± 0.7                   5.2–8.4                6.4 ± 1.0                  4.5–8.6

again 3 d later. Samples were collected into 2 evacuated               3.0%, respectively. Results are presented as both G6P
tubes (Thermo Fisher Scientific Inc. Waltham, MA), one                 concentration and G6P as a percent of total glucose
containing heparin and the other K3EDTA, inverted sev-                 available for phosphorylation.
eral times, and placed on ice. Samples were centrifuged at               Haptoglobin (Hp) was measured using a colorimetric
3000 × g for 15 min at 20 °C and plasma transferred to 1.5             assay that measures Hp-hemoglobin complexing via dif-
mL microcentrifuge tubes for storage at − 80 °C until ana-             ferences in peroxidase activity [21]. Haptoglobin concen-
lyses. Prior to storing, plasma from EDTA tubes were snap              trations from the colorimetric assay were validated using
frozen in liquid nitrogen for PUFA and oxylipid analyses.              a commercial ELISA kit (cat#HAPT-11; Life Diagnostics
Milk samples were also collected from ewes on d 1 (to                  Inc., West Chester, PA). Trolox equivalent antioxidant
avoid colostrum) and d 4 of lactation. Milk samples were               capacity (TEAC) was measured using a commercial anti-
centrifuged at 1380 × g for 20 min at 4 °C. The fat layer              oxidant assay kit (#709001; Cayman Chemical; Ann
was removed, and skim milk was stored at − 20 °C until                 Arbor, MI). Intra- and inter-assay coefficients of vari-
analysis of glucose and glucose-6-phosphate (G6P).                     ation for haptoglobin were 3.5% and 4.3%, and for TEAC
  Milk glucose and G6P concentrations were measured                    were 3.0% and 3.4%, respectively.
by a fluorometric assay as previously described [19, 20].                Plasma PUFA were analyzed with LC-MS and oxyli-
In short, G6P was determined through enzymatic oxida-                  pids by LC-MS/MS [22]. Briefly, 1 mL plasma was
tion by G6P dehydrogenase using NADP+ and the total                    mixed with an antioxidant reducing agent mixture (50%
(both glucose and G6P) was determined by enzymatic                     methanol, 25% ethanol, and 25% water), butylhydroxy-
oxidation by both G6P dehydrogenase and hexokinase.                    toluene (0.9 mmol/L), EDTA (0.54 mmol/L), tripheny-
Intra- and inter-assay coefficients of variation for G6P               phosphine (3.2 mmol/L), and indomethacin (5.6 mmol/
were 2.5% and 2.3%, and for glucose were 4.1% and                      L) to prevent ex vivo lipid peroxidation and oxidation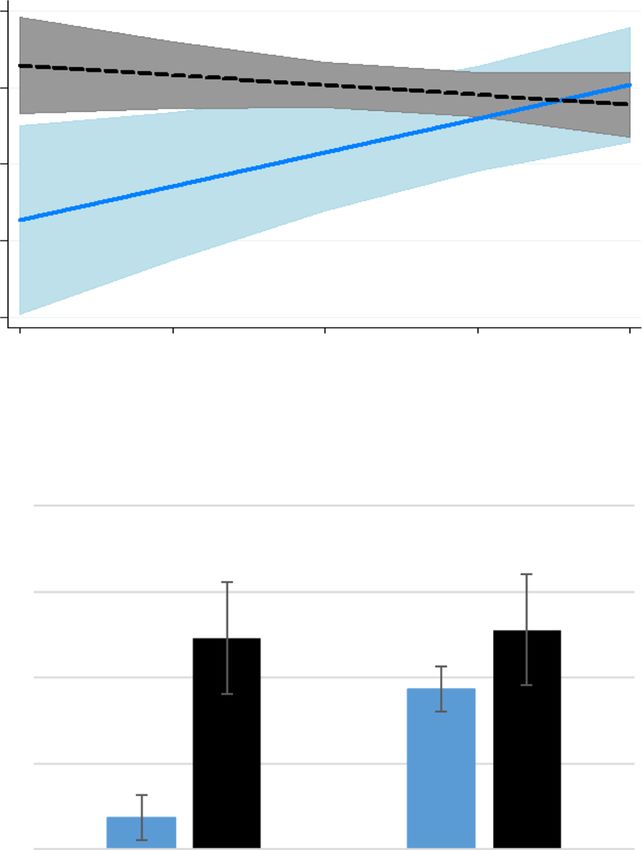
Olagaray et al. Journal of Animal Science and Biotechnology   (2020) 11:68                                              Page 4 of 14

of preformed oxylipids [23]. The following internal                    with the fixed effects of treatment, d 1 covariate values,
standards were added to each sample: 5(S)-hydroxyeicosate-             number of lambs born, and the two-way interactions of
traenoic acid-d8 (0.25 μmol/L), 15(S)-hydroxyeicosatetraenoic          these variables, the quadratic term for d 1 covariate values
acid-d8 (0.25 μmol/L), 8,9-epoxyeicosatrienoic acid-d11                and its interaction with treatment, the d 1 covariate for
(0.5 μmol/L), prostaglandin E2-d9 (0.5 μmol/L), 8,9-dihydrox-          Hp, and the Hp covariate × treatment interaction. Ewe
yeicosatrienoic acid-d11 (0.25 μmol/L), arachidonic acid-d8            was included as a random effect. Treatment and covariates
(50 μmol/L), 2-arachidonoyl glycerol-d8 (2 μmol/L), and                for outcomes of interest were retained in all models. Un-
arachidonoyl ethanolamide-d8 (0.25 μmol/L) in 15 μL.                   less part of a significant interaction, all other variables
A 7-point standard curve was generated with a mix                      were removed from the model when P > 0.20. Residual
of standards and internal standards for quantification.                plots were assessed visually for normality. Any parameters
  Solid phase extraction was used for both PUFA and oxyli-             violating that assumption were log-transformed prior to
pids [22]. Samples were reconstituted in a 2:1 methanol:               analysis with reported data back-transformed.
HPLC-grade water mixture and passed through Acrodisc 13                   Weight of lamb raised per ewe at approximately 30,
mm GHP 0.2 μm syringe filters (Waters, Milford, MA) to re-             60, 90, and 120 d of lamb age was analyzed using the
move any particulates. Samples were transferred to glass               MIXED procedure of SAS (version 9.4, SAS Institute,
chromatography vials with glass inserts.                               Cary, NC) with the fixed effects of treatment, number of
  Fatty acids were quantified using a reverse phase LC                 lambs reared, lamb sex, and their two-way interactions,
on a Waters Acquity UPLC with a Supleco (State Col-                    and with the random effect of ewe. Variables were re-
lege, PA) Ascentis Express C18 10 cm × 2.1 mm, 2.7 μm                  moved from the model when P > 0.20.
column with a flow rate of 0.35 mL/min at 50 °C coupled                   All models utilized variance components as the covari-
to a quadrupole mass spectrometer. Mobile phases in-                   ance structure and removed observations when Studen-
cluded A = acetonitrile, B = methanol, and D = 0.1% for-               tized residuals were ≤ − 3 or ≥ 3. Significance was
mic acid. The gradient mobile phase was programmed                     declared at P < 0.05 and tendencies at 0.05 ≤ P < 0.10.
as follows (A/B/D ratio): time 0 to 0.2 min (45/22/33), to
(80/19/1) at 4.0 min and maintained to 5.0 min, to (45/                Results
22/33) at 6 min and held until 8 min. Fatty acids were                 Ewe inflammatory, oxidative balance, and energy balance
identified and quantified by matching mass-1 and reten-                biomarkers
tion time with corresponding internal standard and cali-               Plasma Hp concentrations were lesser for MEL ewes, in-
brated using a linear 7-point standard curve (R2 > 0.99).              dicating reduced inflammatory status of ewes (P < 0.05);
  Oxylipids were quantified using a Waters Acquity                     however, magnitude of the treatment response was
UPLC connected to a Waters Xevo-TQ-S tandem quad-                      dependent on d 1 Hp concentrations (P = 0.04; Fig. 1).
rupole mass spectrometer using multiple reaction moni-                 As expected, there was a positive relationship between d
toring. The Ascentis Express C18 HPLC column (Sigma                    1 and d 4 Hp concentrations in control ewes, but melox-
Aldrich) was set at 50 °C and the autosampler at 10 °C.                icam treatment eliminated this association. Ewes treated
Flow rate was 0.3 mL/min. Eluents included 0.1% formic                 with MEL had similar d 4 Hp concentrations regardless
acid in water (A) and acetonitrile (B). The 15 min run                 of pre-treatment (d 1) concentration. Plasma TEAC, a
time was programmed with a linear gradient as follows                  measure of antioxidant capacity, did not differ between
(A:B ratio): time 0 to 0.5 min (99:1), to (60:40) at 2.0               control and MEL ewes (P = 0.82). Milk G6P, an indirect
min, to (20:80) at 8.0 min, to (1:99) until 13.0 min, then             indicator of ewe energy balance, was unaltered by MEL
returned to (99:1) at 13.01 min, and held until 15.0 min.              whether expressed as a concentration or as a percent of
Oxylipids were detected using electrospray ionization in               milk glucose (P ≥ 0.12; Table 2).
negative-ion mode. Cone voltage and collision voltages
were optimized for each analyte using Waters QuanOp-                   Ewe plasma polyunsaturated fatty acid concentrations
timize software [23], and data analysis was carried out                Quantified plasma PUFA included linoleic acid (LA),
with Waters TargetLynx software.                                       arachidonic acid (ArA), eicosapentaenoic acid, dihomoli-
  All samples for fatty acid and oxylipids were analyzed               nolenic acid, adrenic acid, and docosahexaenoic acid
in one batch. The signal to noise ratio was monitored;                 (Table 3). Among PUFA, ArA was the only one altered
only data with a signal to noise ratio above 3 were con-               by MEL, with concentrations increased by more than 4-
sidered detected and data with a signal to noise ratio ≥               fold in ewes rearing singles (P < 0.01 main effect and
10 were used for calculations.                                         interaction; Fig. 2).

Statistical analysis                                                   Ewe oxylipid profile
Ewe plasma data (d 4) were analyzed using the MIXED                    Plasma samples were analyzed for 57 oxylipids, 36 of
procedure of SAS (version 9.4, SAS Institute, Cary, NC)                which were detected and 31 of which were statistically
Olagaray et al. Journal of Animal Science and Biotechnology (2020) 11:68 Page 5 of 14
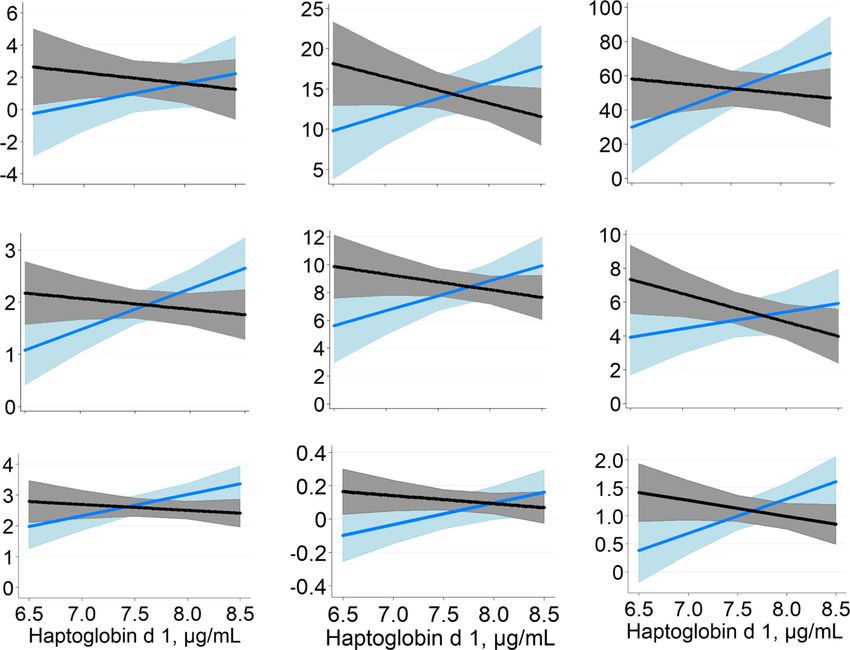
Fig. 1 Baseline (d 1) haptoglobin relationship with d 4 haptoglobin is altered by meloxicam. a Log-transformed haptoglobin concentrations on d
1 (prior to treatment) and d 4 of lactation. The diamonds show means and 95% confidence intervals of the mean for each group. b Log
haptoglobin concentration × treatment interaction (P = 0.04). Control ewes that had greater plasma haptoglobin concentration on d 1 had
greater haptoglobin concentration on d 4, whereas initial plasma haptoglobin concentration on d 1 (before meloxicam) of treated ewes was not
related to their d 4 values. D 4 haptoglobin concentration (log) = 8.10–0.09 × log haptoglobin covariate – 5.8[control] + 0.78 × log haptoglobin
covariate[control]. Shaded areas represent 95% confidence intervals
analyzed. Although detectable, concentrations of PGD2, 11,
12- epoxy-eicosatrienoic acid (EET), 14,15-EET, 6-keto-
prostaglandin (PG) F1α, and 10,17- dihydroxydocosahexae-
noic acid were very low and lacked sufficient variation to
Table 2 Plasma biomarkers of inflammation (haptoglobin) and
detect treatment differences. Effects of MEL on oxylipids
antioxidant capacity (TEAC) and milk markers of energy balance
are summarized by biosynthetic pathway (COX, lipoxygen-
(G6P) in ewes treated with meloxicam at d 1 and 4 after
lambing ase [LOX], cytochrome P450 [CYP], and non-enzymatic
oxidation [NE]) in Tables 4, 5, 6, 7 and 8. Overall shifts to
P-values1
the oxylipid network can be visualized in Fig. 3.
CON MEL SEM Trt Cov Cov × trt
The interaction between treatment and initial Hp
Plasma
concentration (Fig. 4) was significant or tended to be
Haptoglobin, μg/mL 2063 1713 275 < 0.05 NS 0.04 significant for many oxylipids (12- hydroxyeicosatrie-
TEAC, mmol/L 1.00 1.00 0.02 NS NS NS noic acid [HHTrE], 11-hydroxyeicosatetraenoic acid
Milk [HETE], 9-hydroxyoctadecadienoic acid [HODE],
G6P2, μmol/L 190.4 218.0 13.8 NS 0.01 0.09 9-oxooctadecadienoic acid [oxoODE], 15-HETE, 9,
3 10-epoxyoctadecenoic acid [EpOME], 20-HETE, 14,
G6P , % of glucose 76.2 82.6 2.80 NS NS NS
1
15-dihydroxyeicosatrienoic acid [DHET], and 9-HETE:
NS: P > 0.10; Cov: effect of d 1 covariate
2
Cov × cov: P = 0.01; Cov × cov × trt: P = 0.08
P < 0.05; 8,9-DHET and 19,20- dihydroxydocosapen-
3
Effect of haptoglobin covariate: P = 0.05 taenoic acid [DiHDPA]: P < 0.10). Generally, theOlagaray et al. Journal of Animal Science and Biotechnology (2020) 11:68 Page 6 of 14
Table 3 Plasma polyunsaturated fatty acid concentrations (μmol/L) in control ewes and ewes treated with 90 mg meloxicam on d 1
and 4 after lambing
P-values1
Fatty acid CON MEL SEM Trt Cov Lambs
Linoleic acid2 C18:2 (n-6) 97.61 86.50 16.07 NS < 0.05 < 0.01
α-linolenic acid C18:3 (n-3) 60.50 61.20 14.27 0.16 NS < 0.01
3
Arachidonic acid C20:4 (n-6) 4.81 10.15 1.66 < 0.01 0.01 < 0.01
Eicosapentaenoic acid C20:5 (n-3) 1.13 0.94 0.20 NS NS 0.06
Dihomo-linolenic acid C20:6 (n-6) 0.33 2.22 0.34 NS 0.03 NS
Adrenic acid C22:4 0.016 0.013 0.002 NS 0.09 NS
Docosahexaenoic acid C22:6 (n-3) 4.11 3.55 0.70 0.15 0.11 0.02
Total 263.6 289.6 40.4 NS NS < 0.01
1
NS: P > 0.20; Cov: effect of d 1 covariate
2
loghaptocov × trt: P = 0.03
3
cov × trt: P = 0.01; cov × cov: P = 0.04; cov × cov × trt: P = 0.01; trt × lambs: P < 0.01; loghaptocov: P < 0.05; loghaptocov × trt: P < 0.01
observed interactions indicated a positive association be-
tween initial inflammatory status and the oxylipid in con-
trol ewes, but a negative relationship for MEL ewes.
The detected COX-derived oxylipids were all metabo-
lites of ArA (Table 4). The only main effect of MEL on
COX-derived oxylipids was decreased PGF2α.
The LOX-derived oxylipid concentrations are shown
in Table 5. The α-linolenic acid metabolite
13-hydroxyocctadecatrienoic acid (HOTrE) tended to
have a covariate × treatment interaction, with greater d
1 values related to decreased concentrations on d 4 for
control, but little difference for MEL (P = 0.08). Ewes
rearing twins had greater concentrations of 9-HODE
(39.9 vs. 57.4 ± 4.8 μmol/L; P = 0.03), 9-oxoODE (10.7 vs.
16.2 ± 1.3 μmol/L), and 5-HETE (− 0.12 vs. 0.51 ±
0.23 μmol/L) compared with ewes rearing singletons.
Concentration of 17- hydroxyl-docosahexaenoic acid
(HDoHE) tended to have a treatment × lamb interaction
with MEL attenuating the drop in HDoHE otherwise
seen in twin-bearing ewes (MEL: 1.03 vs. 0.96 ±
0.29 μmol/L, CON: 1.92 vs. 0.66 ± 0.33 μmol/L; P = 0.07).
Effects of MEL on CYP-derived oxylipids are show in
Table 6. Treatment with MEL tended to decrease 17,18-
dihyroxy-eicosatetraenoic acid (DiHETE; P = 0.07). Con-
centrations of 9,10-DiHOME decreased with MEL, with
Fig. 2 Meloxicam alters arachidonic acid relationships with baseline
the largest effect in ewes with greater initial concentra-
haptoglobin and type of rearing. a The treatment × haptoglobin
covariate interaction (P = 0.01) for plasma arachidonic acid (ArA) tions (P = 0.03). MEL also decreased the ArA metabolite
concentration in control ewes (CON) and ewes treated with 90 mg 8,9-DHET, and the cov2 × treatment interaction showed
meloxicam (MEL) on d 1 and 4 after lambing. D 4 ArA MEL prevented the decrease in d 4 concentrations for
concentrations was dependent on d 1 haptoglobin concentrations ewes with greater initial concentrations of 8,9-DHET
(inflammation marker), with greater initial haptoglobin related to
(P = 0.05). Ewes raising twins had greater concentrations
greater ArA in control ewes, but lesser ArA in ewes receiving MEL.
D 4 ArA = 7.02–3.87 × covariate + 0.70 × covariate2–5.41[control] + of 9,10-dihydroxyoctadecenoic acid (DiHOME; 18.0 vs.
3.85 × covariate[control] – 0.77 × covariate2[control]. Shaded areas 21.7 ± 1.1 μmol/L), 8,9-DHET (0.66 vs. 0.81 ± 0.18 μmol/
represent 95% confidence intervals; slopes differ at P = 0.01. b D 4 L), 17,18-DiHETE (36.5 vs. 47.8 ± 2.5 μmol/L), and 19,
plasma ArA was less in control ewes rearing single lambs compared 20-DiHDPA (1.83 vs. 2.96 ± 0.24 μmol/L; all P ≤ 0.04),
to MEL ewes rearing either single lambs or twins and control ewes
and a tendency for greater concentrations of 14,15-
rearing twins (Trt × lambs: P < 0.001)
DHET and 14,15-DiHETE (2.34 vs. 2.85 ± 0.16 μmol/LOlagaray et al. Journal of Animal Science and Biotechnology (2020) 11:68 Page 7 of 14
Table 4 Cyclooxygenase-derived oxylipids in plasma in control ewes and ewes treated with 90 mg meloxicam on d 1 and 4 after
lambing (mean ± SEM; μmol/L)
P-values1
Oxylipid2 Substrate3 CON MEL SEM Trt Cov Cov × cov Hpcov × trt
PGE2 ArA 0.19 0.15 0.03 NS 0.10 NS NS
PGF2α ArA 0.21 0.09 0.03 < 0.01 < 0.01 < 0.01 0.10
12-HHTrE ArA 0.79 0.98 0.11 NS NS NS 0.04
TXB2 ArA 1.67 2.12 0.78 NS NS NS NS
1
NS: P > 0.10; Cov = d 1 covariate values
2
PG Prostaglandin, HHTrE Hydroxyeicosatrienoic acid, TXB2 Thromboxane B2
3
ArA Arachidonic acid
and 4.78 vs. 5.92 ± 0.40 μmol/L, respectively; P = 0.07) for control, but negatively associated for MEL. Concen-
compared to ewes rearing a single lamb. trations of 9-HODE were greater for MEL, and again
MEL effects on oxylipids formed through NE oxidation there was a positive relationship between d 1 and 4
were mostly dependent on number of offspring reared and values in control ewes; however, post-treatment concen-
initial inflammatory status (Table 7). Concentrations of 8- trations in MEL were independent of d 1 covariate
iso-PGE2 were similar amongst control ewes raising singles, values (cov × trt: P < 0.01).
control ewes raising twins, and MEL ewes raising twins Differences in the progressive metabolism of oxylipids
(0.51, 0.97, and 0.48 ± 1.5 μmol/L, respectively), but lesser within certain pathways were assessed through ratios of hy-
for MEL ewes raising singles (0.06 ± 1.4 μmol/L). Control droxyl oxylipids to their ketone derivatives (HODE to
ewes with twins had the least 8-iso-PGA2 concentration oxoODE) and epoxides to vicinal diols (EpOME to
(0.28 ± 0.07 μmol/L), control and MEL ewes with singles DiHOME). Ratios of 9-HODE:9-oxoODE and 13-HODE:13-
were intermediate (0.49 and 0.41 ± 0.09 μmol/L), and MEL oxoODE were both greater than 1 for both control and
ewes with twins were the greatest (0.52 ± 0.07 μmol/L). MEL, which signifies greater abundance of the hydroxyl oxy-
Treatment effects on 9-HETE were influenced by covariate lipids relative to their ketone derivatives. Initial 9-HODE:9-
values, in which 9-HETE decreased from initial values for oxoODE tended to be positively related to values on d 4 for
control, but remained greater at d 4 for those treated with MEL but negatively related for control (P = 0.06; Fig. 5a).
MEL (P = 0.04; Fig. 4h). This ratio also tended to be related to initial inflammatory
The oxidized LA metabolites 9- and 13-HODE can be status with greater initial Hp related to slight increases for
formed from COX, LOX, CYP, or non-enzymatic (pro- MEL and decreases for control (P ≤ 0.10). In contrast, the
oxidant) pathways; however, because racemic structures 13-HODE:13oxoODE ratio was less with MEL, with initial
of these metabolites were not analyzed, we could not values positively related to d 4 values in control but nega-
determine the relative proportion produced by each oxi- tively related in MEL (P = 0.04; Fig. 5b). Progressive metabol-
dation pathway. Treatment effects on 13-HODE and 9- ism of 9,10-EpOME tended to be lesser for MEL (P = 0.06);
HODE depended or tended to depend on d 1 covariate however, unlike the HODE:oxoODE ratios, there was a
values (P < 0.01 and P = 0.07). Greater 13-HODE con- greater proportion of the downstream metabolite 9,10-
centrations were positively related to d 4 concentrations DiHOME (ratio < 1).
Table 5 Lipoxygenase-derived oxylipids in plasma of control ewes and ewes treated with 90 mg meloxicam on d 1 and 4 after
lambing (mean ± SEM; μmol/L)
P-values1
2 3
Oxylipid Substrate CON MEL SEM Trt Cov Cov × trt Lambs Hpcov × trt
5-HETE ArA 0.10 0.29 0.22 NS NS NS 0.07 NS
15-HETE ArA 2.03 1.96 0.16 NS 0.02 NS NS 0.02
5,6-LXA4 ArA 0.13 0.16 0.03 NS NS NS NS NS
13(S)-HOTrE4 ALA 130.8 100.3 28.3 NS 0.08 0.08 NS NS
17-HDoHE5 DHA 1.29 0.99 0.22 NS < 0.01 NS < 0.05 NS
RvD2 DHA 0.30 0.17 0.06 NS NS NS NS NS
1
NS = P > 0.10; Cov = d 1 covariate values
2
HETE Hydroxyeicosatetraenoic acid, LXA4 Lipoxin A4, HOTrE Hydroxyoctadecatrienoic acid, HDoHE Hydroxyl-docosahexaenoic acid, RvD2 Resolvin D2
3
ArA Arachidonic acid, ALA α-Linolenic acid, DHA Docosahexaenoic acid
4
Cov × cov: P = 0.08; cov × cov × trt: P = 0.08
5
Cov × cov: P = 0.02; trt × lambs: P = 0.07Olagaray et al. Journal of Animal Science and Biotechnology (2020) 11:68 Page 8 of 14
Table 6 Cytochrome P450-derived oxylipids in plasma in control ewes and ewes treated with 90 mg meloxicam on d 1 and 4 after
lambing (mean ± SEM; μmol/L)
P-values1
Oxylipid2 Substrate3 CON MEL SEM Trt Cov Cov × cov Cov × trt Lambs Hpcov × trt
9,10-EpOME LA 8.20 8.12 0.52 NS < 0.01 NS NS NS 0.03
9,10-DiHOME LA 22.13 17.55 1.05 < 0.01 < 0.10 NS 0.03 0.02 NS
12,13-EpOME LA 24.30 24.09 1.68 NS – – – – –
20-HETE ArA 5.15 5.26 0.48 NS NS NS NS NS 0.04
4
8,9-DHET ArA 1.11 0.36 0.19 0.04 0.10 0.04 NS 0.04 0.07
11,12-DHET ArA 1.48 1.48 0.13 NS 0.10 NS NS NS NS
14,15-DHET ArA 2.72 2.47 0.15 NS < 0.001 < 0.01 NS 0.07 0.03
14,15-DiHETE EPA 5.64 5.06 0.38 NS < 0.01 < 0.01 0.10 0.07 NS
17,18-DiHETE EPA 45.16 39.07 2.35 0.07 < 0.001 < 0.001 NS < 0.01 NS
19,20-EpDPE DHA 3.29 4.06 0.51 NS NS – – – –
19,20-DiHDPA DHA 2.31 2.47 2.39 NS < 0.01 0.02 NS < 0.01 0.09
1
NS = P > 0.10; Cov = d 1 covariate values
2
EpOME Epoxyoctadecenoic acid, DiHOME Dihydroxyoctadecenoic acid, HETE Hydroxyeicosatetraenoic acid, DHET Dihydroxyeicosatrienoic acid, DiHETE Dihyroxy-
eicosatetraenoic acid, EpDPE Epoxydocosapentaenoic acid, DiHDPA Dihydroxydocosapentaenoic acid
3
LA Linoleic acid, ArA Arachidonic acid, EPA Eicosapentaenoic acid, DHA Docosahexaenoic acid
4
Cov × cov × trt: P = 0.05
Lamb growth MEL on d 1 and 4 after lambing decreased plasma
Lamb weight produced per ewe did not differ by treat- haptoglobin concentrations, and the reduction was most
ment at 30, 60, 90, or 120 d of age (Table 9). Unsurpris- pronounced for ewes with greater plasma Hp concentra-
ingly, type of rearing affected lamb weight produced, tions prior to treatment.
with ewes rearing twins producing more lamb weight Although meloxicam is a selective inhibitor of COX-2
than singles for all time points (P < 0.001). [25], treatment strategies that target only one enzymatic
oxygenation pathway typically also have unpredicted ef-
Discussion fects on the entire oxylipid network [26]. For a thorough
Despite the necessity of inflammatory signaling at par- understanding of MEL effects on plasma oxylipid concen-
turition, a dysfunctional inflammatory response in this trations, we examined differences at each of the following
period has been attributed to health disorders and de- levels that control oxylipid biosynthesis: 1) substrate
creased animal productivity [1, 24]. Several studies in (PUFA) availability, 2) products of multiple oxygenation
dairy cattle have investigated NSAID administration dur- pathways, and 3) the degree to which intermediate metab-
ing the periparturient period to attenuate inflammation, olites were catabolized to their end products [27].
but to our knowledge this is the first study to apply this The only difference we observed for PUFA concentra-
intervention strategy to sheep. Our 2-dose regimen of tions was a 4-fold increase in ArA for MEL ewes bearing
Table 7 Nonenzymatic-derived oxylipids in plasma in control ewes and ewes treated with 90 mg meloxicam on d 1 and 4 after
lambing (mean ± SEM; μmol/L)
P-values1
2 3
Oxylipid Substrate CON MEL SEM Trt Cov × trt Lambs Trt × lambs Hpcov × trt
5-iso-PGF2α-VI ArA 0.39 0.45 0.04 NS – – – –
8-iso-PGA2 ArA 0.40 0.45 0.06 NS NS NS 0.07 NS
8-iso-PGE24 ArA 0.70 0.16 0.12 < 0.01 NS < 0.01 0.08 NS
8,12-iso-PGF2α-VI ArA 0.40 0.42 0.04 NS NS NS NS NS
9-HETE5 ArA 0.06 0.11 0.04 NS 0.04 NS NS 0.03
11-HETE ArA 1.07 1.03 0.12 NS NS NS NS < 0.01
1
NS = P > 0.10
2
PG Prostaglandin, HETE Hydroxyeicosatetraenoic acid
3
ArA Arachidonic acid
4
Haptocov: P = 0.06
5
Cov × cov: P = 0.06Olagaray et al. Journal of Animal Science and Biotechnology (2020) 11:68 Page 9 of 14
Table 8 Plasma concentrations of oxidized linoleic acid singletons. Although PUFA can be oxidized by each
metabolites derived from multiple sources and ratios of select pathway, some pathways have a substrate preference
upstream:downstream metabolites in control ewes and ewes [26]. In the case of COX-2, ArA is preferentially oxi-
treated with 90 mg meloxicam on d 1 and 4 after lambing dized. Given MEL’s inhibition of COX-2, it is seemingly
(mean ± SEM; μmol/L) logical for the substrate to accumulate; however, ArA
P-values1
oxidation is expected to shift to other pathways in this
Oxylipid or Ratio2 CON MEL SEM Trt Cov Cov × trt Lambs Hpcov
× trt
scenario [25]. Additionally, it is unclear why MEL treat-
9-HODE 52.5 44.9 4.2 NS 0.01 0.07 0.03 < 0.01
ment decreased, rather than increased, ArA concentra-
9-oxoODE 13.99 12.37 1.24 NS NS NS 0.01 0.02
tion in ewes with greater initial Hp concentrations.
Because this result is somewhat counterintuitive, add-
13-HODE 133.0 124.8 8.45 NS NS < 0.01 NS NS
itional studies are needed to replicate the finding and ex-
13-oxoODE 1.90 2.55 0.31 NS NS NS NS NS
plore potential explanations.
9-HODE:9-oxoODE3 3.35 3.59 0.17 NS NS 0.06 0.06 < 0.10
Direct downstream effects of COX inhibition were ob-
13-HODE:13-oxoODE4 62.3 51.1 5.4 NS NS 0.04 NS NS
served through the overall reduction in PGF2α and de-
9,10-EpOME:9,10- 0.37 0.46 0.03 0.06 – – – – creased HHTrE in MEL ewes with greater pretreatment
DiHOME
1
inflammation. As all COX-derived oxylipids detected in
NS = P > 0.10
2
HODE Hydroxyoctadecadienoic acid, oxoODE Oxooctadecadienoic acid, EpOME this study were metabolites of ArA, the observed effect
Epoxyoctadecenoic acid, DiHOME Dihydroxyoctadecenoic acid for HHTrE could be partially attributed to reduced sub-
3
Cov × cov × trt: P = 0.06
4
Cov × cov: P = 0.09; Cov × cov × trt: P = 0.04 strate availability. Effects on PGF2α but not other prosta-
noids (PGD2, PGE2, PGI2) generated from the same
substrate (PGH) could be due to the timing of our
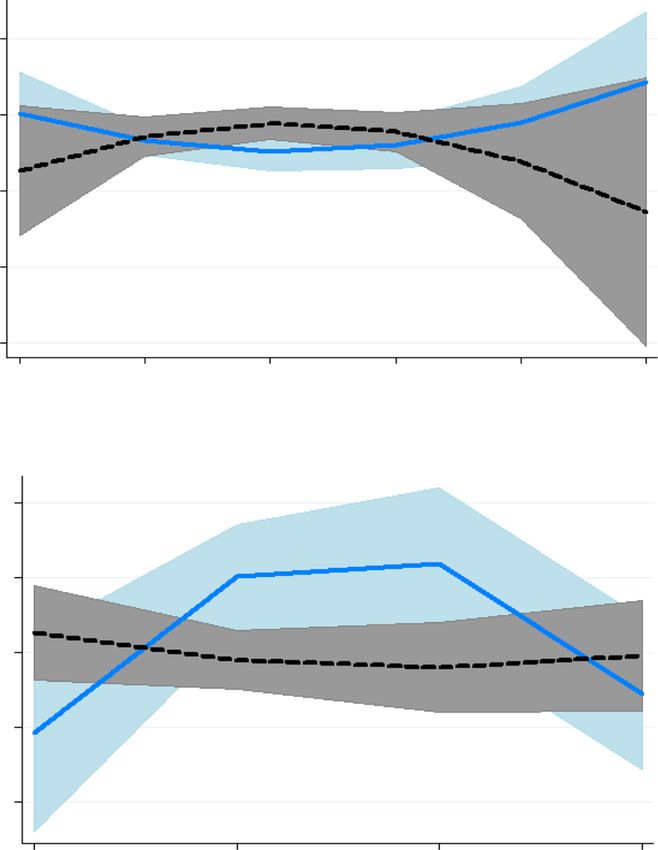
Fig. 3 Oxylipid biosynthesis by fatty acid substrate and pathway. The effect of MEL administration to ewes on d 1 and 4 after lambing on
oxylipid concentrations are shown with decreases represented in red text with an asterisk (*) and treatment × haptoglobin covariate represented
in blue text and with a hashtag (#). Oxylipids that were not detected are in gray. The symbol (•) denotes oxylipids that can also be derived via
non-enzymatic oxidation. Abbreviations: CYP = cytochrome P450; DHET = dihydroxyeicosatrienoic acid; DiHDoHE = dihydroxydocosahexaenoic
acid; DiHDPA = dihydroxydocosapentaenoic acid; DiHETE = dihydroxyeicosatetraenoic acid; DiHOME = dihydroxyoctadecenoic acid; EET =
epoxyeicosatrienoic acid; EpDPE = epoxydocosapentaenoic acid; EpOME = epoxyoctadecenoic acid; LX = lipoxin; HDoHE = hydroxyl-
docosahexaenoic acid; HETE = hydroxyeicosatetraenoic acid; HHTrE = hydroxyheptadecatrienoic acid; HODE = hydroxyoctadecadienoic acid;
HOTrE = hydroxyoctadecatrienoic acid; LOX = lipoxygenase; NE = nonenzymatic oxidation; oxoODE = oxooctadecadienoic acid; PG = prostaglandin;
RvD2 = resolvin; sEH = soluble epoxide hydrolase; TXB2 = thromboxane B2Olagaray et al. Journal of Animal Science and Biotechnology (2020) 11:68 Page 10 of 14 Fig. 4 Meloxicam alters plasma oxylipid relationships with baseline haptoglobin. Treatment (trt) × haptoglobin covariate (log; loghaptocov) interactions for oxylipid concentrations (μmol/L) in control ewes (CON; blue line) and ewes treated with 90 mg meloxicam (MEL; black line) on d 1 and 4 after lambing. All interactions P < 0.05; shaded areas represent 95% confidence intervals. Cyclooxygenase-derived oxylipid: a 12-HHTrE. Lipoxygenase-derived oxylipids: b 9-oxoODE, c 9-HODE, d 15-HETE. Cytochrome P450-derived oxylipids: e 9,10-EpOME, f 20-HETE, g 14,15-DHET. Nonenzymatically derived oxylipids: h 9-HETE, i 11-HETE sample relative to the stage of inflammation [28]. For ex- 9-HODE can be produced both enzymatically via LOX ample, PGE2 is elevated during the early stages of in- or through NE oxidation, it can also serve as a marker of flammation compared with PGD2 which is more oxidative status [31]. Similar to 9 and 11-HETE, 9- prevalent during the final stages of the response [29]. HODE concentration was less in MEL ewes with greater Meloxicam effects extended to oxylipids derived from degrees of initial inflammation, but since LA concentra- the other oxygenation pathways, with the effects largely tion was not different with MEL, this result can be more related to alterations in redox state and inflammatory confidently attributed to the presence of fewer oxidants. status. As isoprostanes are only produced when there is Such a claim would be even further supported had we a significant shift in redox state [24], they are considered measured racemic structures of 9-HODE and could the gold standard biomarkers of oxidative stress [30]. show that it was the proportion formed by NE that was Thus, the observed decrease in 8-iso-PGE2 is one indica- reduced by MEL. tor that MEL reduced oxidative stress. Decreased concentrations of oxylipids that contribute to Oxylipids formed by NE oxidation also serve as indica- a prooxidant environment would also indicate improved tors of oxidative stress and include 9-HETE, 11-HETE, oxidative status. 20-HETE is a CYP-derived oxylipid that and 9-HODE. Both 9-HETE and 11-HETE were de- is not only a prooxidant itself, but also indirectly exacer- creased in MEL ewes with greater degrees of initial in- bates oxidative stress via stimulation of mitochondrial re- flammation, suggesting a possible improved redox active oxygen species production and activation of status. As both are predominately derived by NE oxida- NADPH oxidase enzymes [32, 33]. Meloxicam decreased tion of ArA, reduced substrate availability could partially 20-HETE concentration in ewes with greater initial in- explain the reductions in 9- and 11-HETE. Kuhn et al. flammation, which suggests decreased presence of reactive [31] reported a similar scenario in which milk concen- metabolites and thus improved redox status. tration of 11-HETE was elevated in early lactation; how- The initial products from 15-LOX oxidation of ArA ever, the significant correlation with its substrate ArA in and LA (15-HPETE and 13-HPODE, respectively) are milk (r = 0.60) only partially explained the elevation in also highly reactive and greatly contribute to oxidative their study. The greater oxidative environment of the stress [34]. Prior to LC-MS quantification, 15-HPETE mammary gland also contributed. Since the LA-derived and 13-HPODE had to be reduced to their hydroxyl and
Olagaray et al. Journal of Animal Science and Biotechnology               (2020) 11:68                                             Page 11 of 14

                                                                                   13-HODE:13-oxoODE and 9-HODE:9-oxoODE indi-
                                                                                   cated further metabolism of 13-HODE to 13-oxoODE
                                                                                   and less oxidation of 9-HODE to 9-oxoODE for MEL
                                                                                   ewes compared to control. The further progression to
                                                                                   13-oxoODE is favorable because of its anti-inflammatory
                                                                                   properties as a PPAR gamma ligand [35].
                                                                                     Soluble epoxide hydrolase (sEH), the enzyme that cata-
                                                                                   lyzes the further metabolism of EETs to DHETs and
                                                                                   EpHOMEs to DiHOMEs, is upregulated by prooxidant
                                                                                   status [36]. Evaluation of ratios between these oxylipids
                                                                                   and their downstream metabolites can provide some
                                                                                   insight into sEH activity. The tendency for MEL to in-
                                                                                   crease 9,10-EpOME/9,10-DiHOME could be the result
                                                                                   of decreased sEH activity because of improved redox sta-
                                                                                   tus. As DiHOME are more toxic than EpOME [37], the
                                                                                   greater ratio in MEL ewes is preferable. Ratios of metab-
                                                                                   olites from CYP oxidation, EETs to DHETs, could not
                                                                                   be evaluated. Although detected in some samples, EET
                                                                                   concentrations were not statistically analyzed due to low
                                                                                   concentrations with little variability. MEL did decrease
                                                                                   8,9-DHET overall and decreased 12,15-DHET in ewes
                                                                                   with greater initial inflammation. Again, these reductions
                                                                                   could indicate decreased sEH activity, but without know-
                                                                                   ing concentrations of their substrate precursors, we can-
 Fig. 5 Meloxicam alters baseline haptoglobin associations with                    not differentiate between MEL shifting whole pathway
 progressive metabolism of oxylipids. Linoleic acid-derived oxylipids in           flux vs. progression of oxidation within a pathway.
 plasma for control ewes and ewes treated with 90 mg meloxicam on d 1                Oxylipids largely regulate inflammation by influencing
 and 4 after lambing (mean ± SEM; μmol/L), expressed as ratios of select           the development of oxidative stress [24]. Our data reveal
 upstream:downstream metabolites. Shaded areas represent 95%
 confidence intervals and treatment (trt) is equal to 0 for MEL in the
                                                                                   improved oxidant status for ewes treated with MEL, espe-
 following eqs. a The 9-HODE/9-oxoODE ratio tended to have a treatment             cially for those with greater initial degrees of inflamma-
 × covariate interaction (P = 0.06). Ewes with relatively greater proportion of    tion. The haptoglobin covariate × treatment interaction
 9-HODE at d 1 had a greater ratio on d 4 for MEL, but control ewes with           was significant for 9 oxylipids with an additional 2 tending
 a greater ratio at d 1 had a relatively lesser ratio at d 4. D 4 9-HODE/9-        to be significant. The interaction for each of these were in
 oxoODE = − 10.34 + 7.96 × covariate – 1.12 × covariate2 + 24.76[control] –
 14.24 × covariate[control] + 2.00 × covariate2[control]. b The 13-HODE/13-
                                                                                   the same direction: decreased oxylipid concentrations for
 oxoODE ratio tended to have treatment × covariate interaction (P = 0.06).         MEL ewes with greater inflammation that were otherwise
 Progressive metabolism from 13-HODE to 13-oxoODE was greater for                  increased for control ewes. The fact that characteristically
 MEL with greater initial ratio, but there was less progressive metabolism         pro- and anti-inflammatory oxylipids were both altered in
 for CON ewes with greater initial ratios. D 4 13-Hode/13-oxoODE = 60.78–          a similar manner demonstrates the natural balance within
 0.25 × covariate + 0.00065 × covariate2–66.97[control] + 1.77 ×
 covariate[control] – 0.0054 × covariate2[control]
                                                                                   the complex oxylipid network. Not only does it seem
                                                                                   oxylipids balance each other, but individual oxylipids can
                                                                                   have different effects based on the receptor present on tar-
hydroperoxy derivatives. Thus, values for 15-HETE and                              get cells or stage of inflammation. For example, 8-iso-
13-HODE represent the combined concentrations of the                               PGE2 promotes vasoconstriction when working through
hydroperoxides and their hydroxyl derivatives. Treat-                              the thromboxane receptor, but vasodilation through the
ment with MEL decreased concentration of 15-HETE in                                PGE2 prostanoid receptor [38]. Overall, our results dem-
ewes with greater initial inflammation. Although relative                          onstrate MEL decreased systemic inflammation in ewes
contributions of 15-HPETE and 15-HETE cannot be                                    with greater degrees of initial inflammation, in part
teased apart in our data, our observed decrease in 15-                             because of alterations to oxylipid biosynthesis across
HETE could have been driven by reductions in 15-                                   multiple oxidation pathways.
HPETE. This alteration would further support improved                                The many interactions we observed with initial inflam-
oxidative status through decreased reactive metabolite                             matory status could be a possible explanation to the in-
availability.                                                                      consistency of NSAID response in transition dairy cattle
  The progressive metabolism of LA-derived oxylipids                               studies. For example, Carpenter et al. [7] reported sub-
through the LOX pathway was also shifted. The ratios of                            stantial whole-lactation milk yield responses after oral
Olagaray et al. Journal of Animal Science and Biotechnology (2020) 11:68 Page 12 of 14
Table 9 Weight of lamb produced per ewe (kg) at approximately 30, 60, 90, and 120 d after lambing for control ewes and ewes
treated with 90 mg meloxicam on d 1 and 4 after lambing. To obtain average weight of an individual lamb at any time point, divide
stated value by 1.58 (the average number of lambs reared per ewe) and add 6.3 kg (average birth weight)
P–values1
Age, d CON MEL SEM Trt TOR2
30 14.9 15.6 0.6 NS < 0.001
60 35.3 36.1 1.3 NS < 0.001
90 55.0 55.7 1.7 NS < 0.001
120 72.1 75.9 2.2 NS < 0.001
1
NS = P > 0.10
2
TOR Type of rearing (single, twin). TOR × trt was tested but not significant
administration of sodium salicylate to dairy cows for 3 d compared to a singleton). Increasing nutrient supply via
after calving; however, when the study was later repli- increased milk production could increase pre-weaning
cated, no difference in milk production through 120 d lamb growth, thereby increasing profit potential for
was observed [39]. As plasma haptoglobin concentra- sheep producers.
tions were nearly 3-fold greater in the former cohort (~
600 vs. 200 μg/mL), authors speculated a milk response Conclusions
to NSAID treatment could be dependent on baseline in- Postpartum meloxicam administration decreased ewe in-
flammation [39]. As discussed throughout the paper, our flammatory status as measured by plasma haptoglobin,
data supports the notion that response to postpartum with reductions greatest for those with greater initial
NSAID treatment in ruminants is dependent on initial haptoglobin concentrations. MEL increased plasma ArA
inflammatory status. concentrations in ewes bearing singletons, but decreased
Despite MEL decreasing inflammation, no treatment ArA in ewes with greater initial inflammation. Meloxi-
effect was observed for milk G6P, an indirect indicator cam also decreased plasma concentrations of an array of
of energy balance. Zachut and others [20] have demon- oxylipids extending across different PUFA substrates
strated a negative linear correlation between milk G6P and oxidation pathways, and altered their progressive
concentration and energy balance (r = − 0.45). As sys- metabolism. Many of the oxylipid MEL effects pointed
temic inflammation is correlated with decreased feed in- to improved redox state that paralleled the reductions in
take, we hypothesized alleviation of inflammation would inflammation. No differences in lamb growth were de-
promote feed intake and greater energy balance. Feed in- tected, but future research with a larger sample size, par-
take and milk yield data were not available, therefore ticularly of twins and triplets, is warranted.
analysis of milk G6P was employed to gain some insight
Abbreviations
into energy balance. To our knowledge, this is the first ArA: Arachidonic acid; COX: Cyclooxygenase; CYP: Cytochrome P450;
experiment to report milk G6P concentrations in sheep DiHDoHE: Dihydroxydocosahexaenoic acid;
milk; values for controls were only slightly lower than DiHDPA: Dihydroxydocosapentaenoic acid;
DiHETE: Dihydroxyeicosatetraenoic acid; DiHOME: Dihydroxyoctadecenoic
concentrations reported for dairy cattle on d 3 of lacta- acid; DHET: Dihydroxyeicosatrienoic acid; EET: Epoxy-eicosatrienoic acid;
tion (200–350 μmol/L [40]). EpDPE: Epoxydocosapentaenoic acid; EpOME: Epoxyoctadecenoic acid;
Postpartum meloxicam treatment of ewes did not FA: Fatty acid; G6P: Glucose-6-phosphate; HDoHE: Hydroxyl-docosahexaenoic
acid; HETE: Hydroxyeicosatetraenoic acid; HHTrE: Hydroxyeicosatrienoic acid;
affect lamb weight produced per ewe (a proxy of lamb HODE: Hydroxyoctadecadienoic acid; HOTrE: Hydroxyocctadecatrienoic acid;
growth); however, our small sample size likely limited Hp: Haptoglobin; LnA: Linoleic acid; LOX: Lipoxygenase; LXA4: Lipoxin A4;
our ability to detect a statistical difference. It is also pos- MEL: Meloxicam; NE: Nonenzymatic oxidation; OxoODE: Oxooctadecadienoic
acid; PG: Prostaglandin; PUFA: Polyunsaturated fatty acid; RvD2: Resolvin;
sible that a greater dose of MEL (e.g. 2 mg/kg BW) may sEH: Soluble epoxide hydrolase; TEAC: Trolox equivalent antioxidant capacity;
have yielded differences in milk yield and growth of TXB2: Thromboxane B2
suckling lambs, although a recent study [9] could argue
Acknowledgements
against the potential benefit of a greater dose. Future Authors would like to thank the undergraduate student employees at Iowa
studies should reevaluate the hypothesis that postpartum State University Sheep Teaching Farm that assisted with biological sample
MEL might increase ewe milk production and thereby collections and recording of lamb weights.
increase lamb growth, especially in ewes bearing mul- Authors’ contributions
tiple offspring. Even though ewes suckling twin lambs KO participated in initial study design, analyzed plasma samples for Hp
produce 17–61% more milk than ewes suckling single concentration and TEAC and milk samples for glucose and glucose-6-
phosphate concentrations. KO compiled and performed statistical analysis on
lambs [41], the nutrient supply is split between the 2 all data, and drafted the manuscript. BB participated in study design, over-
lambs, resulting in 60–80% of the nutrients (20–40% less sight of statistical analysis, and manuscript revision. LS was responsible forOlagaray et al. Journal of Animal Science and Biotechnology (2020) 11:68 Page 13 of 14
plasma FA and oxylipid methodology. JG analyzed plasma samples for fatty 11. Paull DR, Lee C, Atkinson SJ, Fisher AD. Effects of meloxicam or tolfenamic
acid and oxylipid concentrations. LM analyzed plasma samples for Hp con- acid administration on the pain and stress responses of merino lambs to
centrations. TS assisted with statistical analysis and results interpretation. TJ, mulesing. Aust Vet J. 2008;86:303–11.
EP and CS were responsible for sample collection and processing. CY partici- 12. Steinmeyer J. Pharmacological basis for the therapy of pain and inflammation
pated in initial study design, obtained research funding, supervised the trial, with nonsteroidal anti-inflammatory drugs. Arthritis Res. 2000;2:379–85.
and was responsible for provision of milk and plasma samples. All authors 13. Mainau E, Cuevas A, Ruiz-de-la-torre JL, Abbeloos E, Manteca X. Effect of
reviewed and approved the final manuscript. meloxicam administration after calving on milk production, acute phase
proteins, and behavior in dairy cows. J Vet Behav Clin Appl Res. 2014;9:357–
Funding 63. https://doi.org/10.1016/j.jveb.2014.07.007.
This research was funded by a Let’s Grow grant through the American 14. Newby NC, Leslie KE, Dingwell HDP, Kelton DF, Weary DM, Neuder L, et al.
Sheep Industry. The effects of periparturient administration of flunixin meglumine on the
health and production of dairy cattle. J Dairy Sci. 2017;100:582–7. https://
doi.org/10.3168/jds.2016-11747.
Availability of data and materials
15. de Grauw JC, van de Lest CHA, van Weeren PR. A targeted lipidomics
The datasets used and/or analyzed during this study are available from the
approach to the study of eicosanoid release in synovial joints. Arthritis Res
corresponding author on reasonable request.
Ther. 2011;13:R123.
16. Valdes AM, Ravipati S, Pousinis P, Menni C, Mangino M, Abhishek A, et al.
Ethics approval and consent to participate Omega-6 oxylipins generated by soluble epoxide hydrolase are associated
All animal procedures were reviewed and approved by the Iowa State with knee osteoarthritis. J Lipid Res. 2018;59:1763–70.
University Committee on Animal Care. 17. Shukla M, Singh G, Sindhura BG, Telang AG, Rao GS, Malik JK. Comparative
plasma pharmacokinetics of meloxicam in sheep and goats following
Consent for publication intravenous administration. Comp Biochem Physiol. 2007;145:528–32.
All authors provide their consent to this publication. 18. Stock ML, Johann F, Kukanich B, Smith BI. Pharmacokinetics of intravenously
and orally administered meloxicam in sheep. Am J Vet Res. 2013;74:779–83.
Competing interests 19. Silanikove N, Merin U, Shapiro F, Leitner G. Milk metabolites as indicators of
The authors declare that they have no competing interests. mammary gland functions and milk quality. J Dairy Res. 2014;81:358–63.
20. Zachut M, Kra G, Portnik Y, Shapiro F, Silanikove N. Milk glucose-6-
Author details phosphate dehydrogenase activity and glucose-6-phosphate are
1 associated with oxidative stress and serve as indicators of energy
Department of Animal Sciences and Industry, Kansas State University,
Manhattan 66506, USA. 2College of Veterinary Medicine, Michigan State balance in dairy cows. RSC Adv. 2016;6:65412–7. https://doi.org/10.1039/
University, 2265K Anthony Hall, East Lansing, MI 48824-1225, USA. C6RA11924G.
3
Department of Animal Science, Iowa State University, Ames, IA, USA. 21. Cooke RF, Arthington JD. Concentrations of haptoglobin in bovine plasma
determined by ELISA or a colorimetric method based on peroxidase activity.
Received: 8 February 2020 Accepted: 17 May 2020 J Anim Physiol Anim Nutr (Berl). 2013;97:531–6.
22. Putman AK, Brown JL, Gandy JC, Abuelo A, Sordillo LM. Oxylipid profiles of
dairy cattle vary throughout the transition into early mammary gland
References involution. J Dairy Sci. 2019;102:2481–91 https://linkinghub.elsevier.com/
1. Bradford BJ, Yuan K, Farney JK, Mamedova LK, Carpenter AJ. Inflammation retrieve/pii/S0022030219300773.
during the transition to lactation: new adventures with an old flame. J Dairy 23. Mavangira V, Gandy JC, Zhang C, Ryman VE, Jones AD, Sordillo LM.
Sci. 2015;98:6631–50. https://doi.org/10.3168/jds.2015-9683. Polyunsaturated fatty acids influence differential biosynthesis of oxylipids
2. Bertoni G, Trevisi E, Han X, Bionaz M. Effects of inflammatory conditions on and other lipid mediators during bovine coliform mastitis. J Dairy Sci. 2015;
liver activity in puerperium period and consequences for performance in dairy 98:6202–15. https://doi.org/10.3168/jds.2015-9570.
cows. J Dairy Sci. 2008;91:3300–10. https://doi.org/10.3168/jds.2008-0995. 24. Mavangira V, Sordillo LM. Role of lipid mediators in the regulation of
3. Nightingale CR, Sellers MD, Ballou MA. Elevated plasma haptoglobin oxidative stress and inflammatory responses in dairy cattle. Res Vet Sci.
concentrations following parturition are associated with elevated leukocyte 2018;116:4–14. https://doi.org/10.1016/j.rvsc.2017.08.002.
responses and decreased subsequent reproductive efficiency in multiparous 25. Dennis EA, Norris PC. Eicosanoid storm in infection and inflammation. Nat
Holstein dairy cows. Vet Immunol Immunopathol. 2015;164:16–23. https:// Rev Immunol. 2015;15:511–23. https://doi.org/10.1038/nri3859.
doi.org/10.1016/j.vetimm.2014.12.016. 26. Sordillo LM. Symposium review: Oxylipids and the regulation of bovine
4. Huzzey JM, Mann S, Nydam DV, Grant RJ, Overton TR. Associations of mammary inflammatory responses 1. J Dairy Sci. 2018;101:5629–41. https://
peripartum markers of stress and inflammation with milk yield and doi.org/10.3168/jds.2017-13855.
reproductive performance in Holstein dairy cows. Prev Vet Med. 2015;120: 27. Willenberg I, Ostermann AI, Schebb NH. Targeted metabolomics of the
291–7. https://doi.org/10.1016/j.prevetmed.2015.04.011. arachidonic acid cascade: current state and challenges of LC–MS analysis of
5. Shock DA, Renaud DL, Roche SM, Poliquin R, Olson ME. Evaluating the oxylipins. Anal Bioanal Chem. 2015;407:2675–83.
impact of meloxicam oral suspension administered at parturition on 28. Tilley SL, Coffman TM, Koller BH. Mixed messages: modulation of
subsequent production, health, and culling in dairy cows: a randomized inflammation and immune responses by prostaglandins and thromboxanes.
clinical field trial. PLoS One. 2018;13:1–13. J Clin Invest. 2001;108:15–23.
6. Swartz TH, Schramm HH, Bewley JM, Wood CM, Leslie KE. Meloxicam 29. Gilroy DW, Colville-Nash PR, Willis D, Chivers J, Paul-Clark MJ, Willoughby
administration either prior to or after parturition: effects on behavior, health, DA. Inducible cyclooxygenase may have anti-inflammatory properties. Nat
and production in dairy cows. J Dairy Sci. 2018;101:10151–67. https://doi. Med. 1999;5:698–701.
org/10.3168/jds.2018-14657. 30. Kuhn MJ, Mavangira V, Gandy JC, Sordillo LM. Production of 15-F2t-isoprostane
7. Carpenter AJ, Ylioja CM, Vargas CF, Mamedova LK, Mendonça LG, Coetzee as an assessment of oxidative stress in dairy cows at different stages of
JF, et al. Hot topic: early postpartum treatment of commercial dairy cows lactation. J Dairy Sci. 2018;101:9287–95. https://doi.org/10.3168/jds.2018-14669.
with nonsteroidal antiinflammatory drugs increases whole-lactation milk 31. Kuhn M, Mavangira V, Gandy JC, Sordillo LM. Differences in the oxylipid
yield. J Dairy Sci. 2016;99:672–9. profiles of bovine milk and plasma at different stages of lactation. J Agric
8. Sheldon IM, Noakes DE, Bayliss M, Dobson H. The effect of oestradiol on Food Chem. 2017;65:4980–8.
postpartum uterine involution in sheep. Anim R. 2003;78:57–70. 32. Han Y, Zhao H, Tang H, Li X, Tan J, Zeng Q, et al. 20-
9. Colditz IG, Paull DR, Lloyd JB, Johnston L, Small AH. Efficacy of meloxicam in Hydroxyeicosatetraenoic acid mediates isolated heart ischemia/reperfusion
a pain model in sheep. Aust Vet J. 2019;97:23–32. injury by increasing NADPH oxidase-derived reactive oxygen species
10. Small AH, Belson S, Holm M, Colditz IG. Efficacy of a buccal meloxicam production. Circ J. 2013;77:1807–16.
formulation for pain relief in merino lambs undergoing knife castration and 33. Waldman M, Peterson SJ, Arad M, Hochhauser E. The role of 20-HETE in
tail docking in a randomised field trial. Aust Vet J. 2014;92:381–8. cardiovascular diseases and its risk factors. Prostaglandins Other LipidYou can also read