Impacts of the COVID-19 lockdown on air pollution at regional and urban background sites in northern Italy
←
→
Page content transcription
If your browser does not render page correctly, please read the page content below
Atmos. Chem. Phys., 21, 7597–7609, 2021
https://doi.org/10.5194/acp-21-7597-2021
© Author(s) 2021. This work is distributed under
the Creative Commons Attribution 4.0 License.

Impacts of the COVID-19 lockdown on air pollution at regional and
urban background sites in northern Italy
Jean-Philippe Putaud1 , Luca Pozzoli1 , Enrico Pisoni1 , Sebastiao Martins Dos Santos1 , Friedrich Lagler1 ,
Guido Lanzani2 , Umberto Dal Santo2 , and Augustin Colette3
1 European  Commission, Joint Research Centre (JRC), Ispra, Italy
2 Agenzia Regionale per la Protezione dell’Ambiente (ARPA-Lombardia), Milan, Italy
3 Milieux et Impacts sur le Vivant, Institut National de l’Environnement Industriel et des Risques (INERIS),

Verneuil-en-Halatte, France

Correspondence: Jean-Philippe Putaud (jean.putaud@ec.europa.eu)

Received: 22 July 2020 – Discussion started: 12 October 2020
Revised: 27 January 2021 – Accepted: 19 March 2021 – Published: 19 May 2021

Abstract. The COVID-19 lockdown measures gradually im-           (and PM10 precursors) emissions from traffic being com-
plemented in Lombardy (northern Italy) from 23 Febru-            pensated for by increases in emissions from domestic heat-
ary 2020 led to a downturn in several economic sectors           ing and/or from changes in the secondary aerosol formation
with possible impacts on air quality. Several communica-         regime resulting from the lockdown measures. The imple-
tions claimed in the first weeks of March 2020 that the          mentation of the lockdown measures also led to an increase
mitigation in air pollution observed at that time was actu-      in the highest O3 concentrations at both the urban and re-
ally related to these lockdown measures without consider-        gional background sites resulting from reduced titration of
ing that seasonal variations in emissions and meteorology        O3 by NO. The relaxation of the lockdown measures begin-
also influence air quality. To determine the specific impact     ning in May resulted in close-to-expected NO2 concentra-
of lockdown measures on air quality in northern Italy, we        tions in the urban background and to significant increases in
compared observations from the European Commission At-           PM10 in comparison to expected concentrations at both re-
mospheric Observatory of Ispra (regional background) and         gional and urban background sites.
from the regional environmental protection agency (ARPA)
air monitoring stations in the Milan conurbation (urban back-
ground) with expected values for these observations using
two different approaches. On the one hand, intensive aerosol     1   Introduction
variables determined from specific aerosol characterisation
observations performed in Ispra were compared to their 3-        The COVID-19 pandemic is an epidemic of the coronavirus
year averages. On the other hand, ground-level measured          disease 2019 (COVID-19), of which the outbreak was first
concentrations of atmospheric pollutants (NO2 , PM10 , O3 ,      identified in Wuhan, China, in late December 2019. The
NO, SO2 ) were compared to expected concentrations derived       World Health Organization declared COVID-19 a pandemic
from the Copernicus Atmosphere Monitoring Service Re-            on 11 March 2020. The first case of COVID-19 in north-
gional (CAMS) ensemble model forecasts, which did not ac-        ern Italy was detected on 20 February 2020 in Codogno,
count for lockdown measures. From these comparisons, we          about 60 km south-east of Milan (Fig. 1). To reduce the
show that NO2 concentrations decreased as a consequence          virus spreading, the Italian government quickly adopted a
of the lockdown by −30 % and −40 % on average at the ur-         series of measures, such as the quarantine for 10 munici-
ban and regional background sites, respectively. Unlike NO2 ,    palities, the cancellation of all main public events, and the
PM10 concentrations were not significantly affected by lock-     closure of schools and universities in northern Italy (DL,
down measures. This could be due to any decreases in PM10        23 February 2020a). The lockdown started in all of Italy on
                                                                 9 March 2020 (DPCM, 8 March 2020a). All commercial and

Published by Copernicus Publications on behalf of the European Geosciences Union.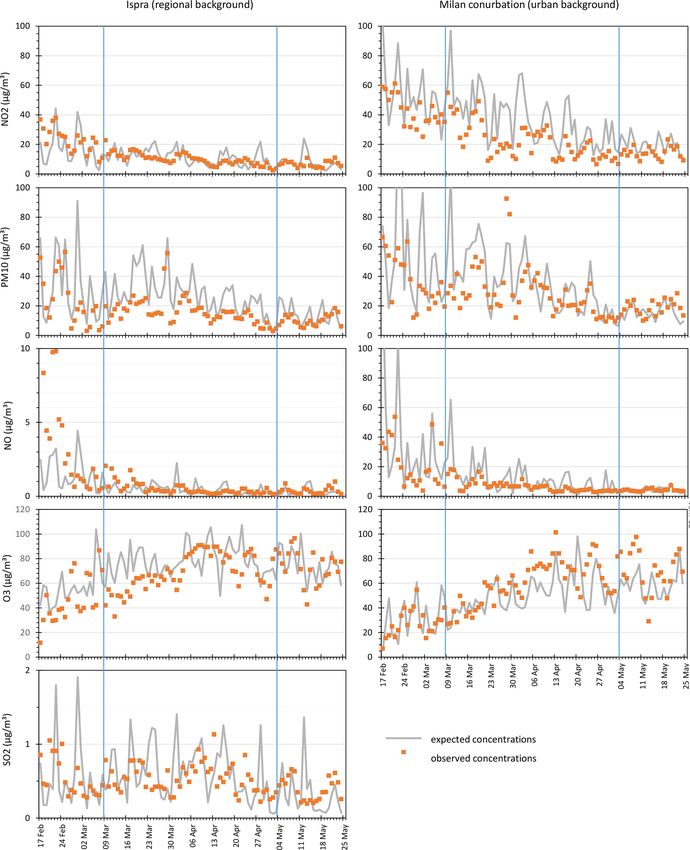
7598                                                  J.-P. Putaud et al.: Impacts of the COVID-19 lockdown on air pollution

retail activities were closed on 11 March, except for grocery       cle km driven also decreased by roughly −70 % between
shops and pharmacies (DPMCM, 11 March 2020b), and it                the beginning and the end of March and started increasing
was forbidden to move outside the place of residence, ex-           again after 4 May but with a slower recovery than for light-
cept for health issues or work. Further lockdown measures           duty vehicles. The number of requests for driving directions
were decreed on 22 March 2020 (DPCM, 22 March 2020c),               (https://www.apple.com/covid19/mobility, last access: 9 Oc-
including the suspension of all non-essential industrial pro-       tober 2020) showed similar variations (Fig. 2).
duction activities. The lockdown lasted until 4 May 2020               Numerous early communications based on preliminary
(DPCM, 26 April 2020d), when a gradual relaxation of the            measurement data analyses associated observed improve-
measures was decided by the government. The reopening of            ments in air quality with the lockdown measures taken to
manufacturing industries and construction sites was allowed,        contain the spread of the COVID-19 epidemic. In Brazil, the
but schools and universities as well as some commercial             lockdown in São Paulo was followed by drastic reductions in
activities such as restaurants remained closed. Movements           NO (up to −77 %) and NO2 (up to −54 %) and by an increase
from a region to another were still forbidden, but moving           in O3 (approximately +30 %) compared to the previous 5-
short distances to work and to visit relatives was possible.        year means for the same period (Nakada et al., 2020). In the
From 18 May 2020, most commercial businesses could re-              Yangtze River Delta region (China), Li et al. (2020) showed
open, and free movement was granted within regional bor-            that concentrations of PM2.5 , NO2 and SO2 decreased by
ders (DL, 16 May 2020b). This lockdown provided a unique            32 %, 45 % and 20 % during the first lockdown phase and
opportunity to determine how such dramatic measures can             by 33 %, 27 % and 7 % during the second lockdown phase,
eventually influence air quality. This is the focus of this pa-     compared with the 2017–2019 average for the same period.
per.                                                                O3 also increased in that region. Across Europe, Grange et
   Lombardy, Piedmont and Emilia-Romagna in northern                al. (2021) estimated that NO2 and O3 concentrations at ur-
Italy produce roughly 50 % of the national gross domes-             ban background sites were 32 % lower and 21 % higher than
tic product (GDP), with Lombardy alone producing 22 %               expected, respectively, when maximum mobility restrictions
of the national GDP (data from ISTAT, 2020). This eco-              were in place. A clear decrease in NO2 concentrations in
nomic dynamism (mainly linked to industrial production and          Barcelona and Madrid (Spain) during the lockdown was also
service-related activities) is associated with significant pollu-   described by Baldasano (2020). In France, the analysis by
tant emissions, which together with unfavourable conditions         INERIS (Institut national de l’environnement industriel et
for pollution dispersion (due to low wind speeds and partic-        des risques) compared air pollution forecast data (calculated
ular orography) cause high pollution levels, leading to ex-         without incorporating changes in emissions due to lockdown
ceedances of the EU standards for nitrogen dioxide (NO2 ),          measures) with adjusted simulations performed a posteriori
particulate matter (PM10 ) and ozone (O3 ) in northern Italy        by assimilating observation data influenced by the lockdown
(European Environment Agency, 2019). In this area, the im-          measures. They estimated that NO2 concentrations were on
pact of the lockdown on economic activities was quite im-           average approximately 50 % lower than expected in France’s
portant, as illustrated by data relative to the production of       largest cities (INERIS, 2020).
electricity and energy for heating and to transport-related ac-        Regarding Italy, maps of NO2 surface concentrations esti-
tivities (ARPA Lombardia, 2020a). Compared to 2019, the             mated from satellite data (e.g. Sentinel-5p) were published
Italian thermal electricity production (Fig. 2) fell in March       by several websites and media showing large reductions
(−18 %), April (−24 %) and May 2020 (−16 %). The con-               in NO2 concentrations over northern Italy in March 2020
sumption of natural gas by the industrial sector as reported        as compared to the previous months and to March 2019
by the Italian natural gas provider (https://www.snam.it, last      (e.g. Copernicus Atmosphere Monitoring Service headlines
access: 9 October 2020) also fell by roughly −30 % at the           published on 17 and 26 of March 2020; CAMS, 2020a,
end of March in comparison to the beginning of March 2020.          b). Observations and models were also combined in the
   Regarding transport, the Monitoring of Polluting Vehicles        analysis from the German Aerospace Center (DLR) which
project (MOVE-IN) managed by the Lombardy region pro-               estimated a decrease of about 40 % in the total column-
vided data on the traffic changes derived from its monitor-         integrated NO2 tropospheric concentrations over norther
ing of “vehicle km” (the sum of kilometres travelled by all         Italy due to the lockdown measures using Sentinel-5p data.
vehicles in the area) driven by light-duty vehicles and pas-        They also estimated reductions in ground level NO2 con-
senger cars (for a small number of vehicles compared to             centrations of about −20 µg m−3 (−45 %) by comparing
the full fleet circulating in the region though). MOVE-IN           ground-based observations from 25 stations in Lombardy
data show that the number of vehicle km driven by light-            to a model simulation with pre-lockdown emission levels
duty vehicles remained quite constant till 9 March 2020, then       (German Aerospace Center, 5 May 2020). In situ obser-
dropped by −75 % to reach a minimum between 16 March                vations also showed reduced ground level NO2 concentra-
and 13 April 2020 before returning to “usual” (i.e. as be-          tions as lockdown measures were implemented. The en-
fore the lockdown period) values after 4 May 2020 (ARPA             vironmental protection agency ARPA Lombardia showed
Lombardia, 2020a). For private cars, the number of vehi-            that March 2020 NO2 concentrations were below the stan-

Atmos. Chem. Phys., 21, 7597–7609, 2021                                              https://doi.org/10.5194/acp-21-7597-2021
J.-P. Putaud et al.: Impacts of the COVID-19 lockdown on air pollution                                                             7599

Figure 1. Northern Italy areas impacted by COVID-19 at the beginning of March 2020 (red zones) and location of the air pollution mea-
surement sites in Ispra and Milan considered in this study. (b) © OpenStreetMap contributors 2020. Distributed under a Creative Commons
BY-SA License.

                                                                           Air pollution did decline in northern Italy from February
                                                                        to May in 2020 as it does every year, mainly due to sea-
                                                                        sonal variations in emissions and weather conditions. The
                                                                        strength of certain sources does indeed change during the
                                                                        course of the year, like, for example, domestic heating, while
                                                                        weather conditions influence pollution concentration in di-
                                                                        verse ways: advection and dispersion of pollutants resulting
                                                                        from horizontal winds; dilution of pollutants throughout the
                                                                        mixed boundary layer resulting from convection; and pollu-
                                                                        tant lifetimes resulting from photochemical reactions (sun ra-
                                                                        diation), wet removal (clouds and rain), etc. It is therefore not
                                                                        straightforward to disentangle the effects of changing emis-
                                                                        sions due to lockdown measure implementation from those
Figure 2. Variations in activities resulting from lockdown measures     of seasonal changes in emissions and variability in meteo-
(2020). Percentages are calculated in comparison with 2019 data for     rological conditions between different seasons and different
thermal energy production (source: https://www.terna.it, last access:
                                                                        years. In the present study we determine how much of the
9 October 2020) and in comparison with data from the third week
                                                                        changes in air pollution observed during the lockdown pe-
of February 2020 for mobility data (source: https://www.apple.com/
covid19/mobility, last access: 9 October 2020).                         riod in northern Italy were actually due to lockdown mea-
                                                                        sures, independently from expected variations in pollutants’
                                                                        emissions, lifetime and dispersion. Our results are based on
dard deviation calculated from previous years, indicating a             comparisons between air pollution observation data from Is-
possible signal of reduced emissions from traffic and eco-              pra (regional background site) and the Milan conurbation (ur-
nomic sectors (ARPA Lombardia, 2020a). The European En-                 ban background sites) with CAMS regional ensemble (here-
vironment Agency (EEA) developed a viewer that tracks                   after ENSEMBLE) model forecast data for the same sites.
NO2 and particulate matter (PM10 and PM2.5 ) weekly av-                 To help understand the effect of the lockdown measures in
erage concentrations (https://www.eea.europa.eu/themes/air/             the regional background area, we also use 4 years of specific
air-quality-and-covid19, last access: 9 October 2020). It               aerosol measurements from Ispra.
shows that NO2 concentrations in Milan were at least 24 %
lower after the lockdown implementation than during previ-
ous weeks and 21 % lower compared to the same period in                 2   Material and methods
2019. Similar trends were found in other cities of northern
Italy and European countries where strong measures were                 Model and observation air pollution data from four sites lo-
taken to contain the epidemic. In contrast, no consistent ef-           cated in Lombardy covering the time periods 17 February–
fect of the lockdown measures on particulate matter (PM2.5              24 May 2019 and 2020 were collected and analysed. We se-
and PM10 ) could be observed in the main European cities                lected three sites located in the Milan conurbation as rep-
(European Environment Agency, 2020).                                    resentative of the Milan urban background and the site of

https://doi.org/10.5194/acp-21-7597-2021                                                 Atmos. Chem. Phys., 21, 7597–7609, 2021
7600                                                J.-P. Putaud et al.: Impacts of the COVID-19 lockdown on air pollution

Ispra as representative of the regional background of the up-     2800 km−2 in Milan, Cormano and Limito di Pioltello, re-
per Po Valley (Fig. 1). Ground level concentrations of NO,        spectively (ISTAT, 2020).
NO2 , SO2 , O3 and PM10 as measured in situ at the moni-
toring stations and as calculated by the ENSEMBLE model           2.2   Measurements
forecast were considered. Particle number size distribution
and aerosol light absorption Ångström exponent data from          At ECAtmO in Ispra, online in situ air pollution measure-
Ispra for the 2017–2020 period were also utilised.                ments are performed from appropriate inlets located at 6.5
                                                                  and 9 m above ground level for gaseous and particulate pol-
                                                                  lutants, respectively. The inlet for reactive gas is made of
2.1    Site description
                                                                  PTFE (inner diameter: 2.7 cm). The sample residence time
                                                                  in the inlet tube is ca. 2 s. Each analyser samples from the
The European Commission Atmospheric Observatory                   main inlet through a Nafion dryer. In 2019–2020, the mea-
(ECAtmO) has been operated in Ispra (45.815◦ N, 8.636◦ E;         surement programme included CO, NO, NOx , NO2 , SO2 ,
209 m a.s.l.) since November 1985. It has contributed to          O3 , non-methane hydrocarbons (until 6 March 2020) and
the CLRTAP-EMEP (co-operative programme for moni-                 NH3 (since 28 January 2020) as gaseous pollutants. The
toring and evaluation of the long-range transmission of air       NOx (i.e. NO and NO2 ), SO2 and O3 data reported in this
pollutants in Europe under the Convention on Long-range           work were obtained with trace level instruments based on
Transboundary Air Pollution) and WMO-GAW (World                   infrared (IR) (1200 nm) chemiluminescence and a Mo con-
Meteorological Organization – Global Atmosphere Watch)            verter (Thermo Fisher 42iTL), ultraviolet (UV) (214 nm) flu-
air pollution measurement programmes for several decades          orescence (Thermo Fisher 43i TLE), and UV (254 nm) ab-
and to the European Research Infrastructures ICOS (Inte-          sorption (Thermo Fisher 49C), respectively. These instru-
grated Carbon Observation System) and ACTRIS (Research            ments are calibrated every 3 months using zero air and
Infrastructure for the observation of Aerosol, Clouds and         certified gas cylinders (NO and SO2 ) or a primary stan-
Trace Gases) for several years. ECAtmO is located on the          dard ozone generator (O3 ). In 2019, annual average con-
north-western edge of the Po Valley, 20–60 km away from           centrations of NO, NO2 , SO2 , O3 and PM10 were 4, 16,
major pollution point sources but still in a densely populated    0.4, 38 and 21 µg m−3 , respectively. Particulate matter is
area (ca. 500 km−2 ) with significant economic activity           sampled through metal-made inlets characterised by negli-
(GDP per capita = EUR 29 000; EUROSTAT, 2017). Wood               gible losses. Each instrument samples isokinetically from
burning for domestic heating is also an important source          the main aerosol inlet through Nafion dryers. In 2019–2020,
of particulate matter during the cold period of the year          the aerosol online in situ measurement programme included
(Gilardoni et al., 2011). Past measurements of HCHO / NO2         PM10 mass concentration, particle number concentration and
ratios compared to the threshold values proposed by Ton-          number size distribution, particle light extinction, absorption,
nensen and Dennis (2000) suggest that the photochemical           scattering, and backscattering at several wavelengths. The
production of O3 is limited by the availability of volatile       PM10 mass, particle number concentration and light absorp-
organic compounds (VOCs) in February–May in Ispra.                tion data reported in this work were obtained with a TEOM-
   The Milan metropolitan area is the second most densely         FDMS (Thermo Fisher 1405-DF), a differential mobility
populated area in Italy (ca. 2300 km−2 ), with a GDP per          particle sizer (home-made Vienna-type differential mobility
capita of about EUR 54 000 (EUROSTAT, 2017) and about             analyser + TSI 3772 condensation particle counter) cover-
4100 circulating vehicles km−2 (ISTAT, 2020). Three sta-          ing the particle mobility diameter range 10–800 nm and a
tions in the Milan conurbation were selected as representa-       seven-wavelength aethalometer (Magee AE31), respectively.
tive of the urban background in Milan city, namely “Milan         The TEOM has been calibrated using a standard filter pro-
via Pascal” (45.478◦ N, 9.236◦ E; 122 m a.s.l.), “Cormano”        vided by the manufacturer, while the differential mobility
(45.548◦ N, 9.167◦ E; 155 m a.s.l.) and “Limito di Pioltello”     particle sizer (DMPS) and the aethalometer are operated,
(45.483◦ N, 9.328◦ E; 123 m a.s.l.). All three stations are op-   maintained and controlled according to ACTRIS guidelines
erated by ARPA Lombardia. We selected only urban back-            (https://www.actris.eu, last access: 9 October 2020). They
ground stations because pollutant concentrations at traffic       were both calibrated at the specific ACTRIS central facil-
sites are hardly reproducible by regional air quality mod-        ity (https://www.actris-ecac.eu, last access: 9 October 2020)
els with a horizontal resolution of about 10 km. The station      on 3–7 June 2019. Near-real-time data are available from the
in Milan via Pascal is located near the university, and it is     JRC data catalogue at http://data.jrc.ec.europa.eu/collection/
considered to be the urban background station of the city,        abcis (last access: 9 October 2020).
while the other two stations are located in the hinterland,          The three stations in the Milan conurbation are part of
near (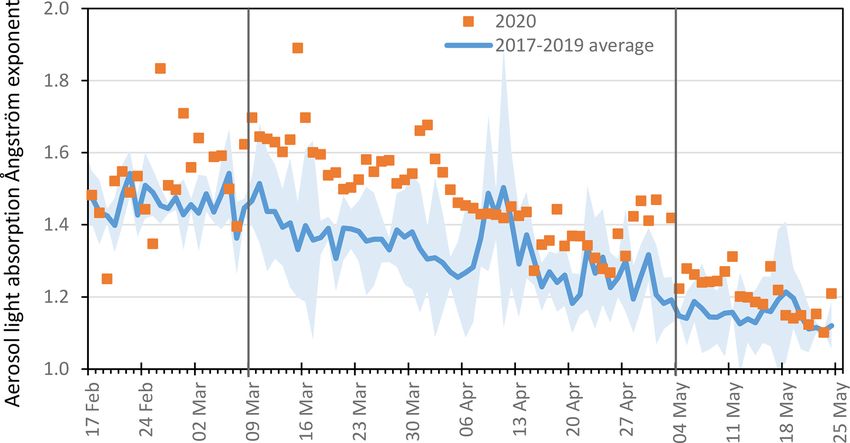
J.-P. Putaud et al.: Impacts of the COVID-19 lockdown on air pollution                                                   7601

all pollutants. The measurement programmes comprise NO,          2015). This method provides an optimal estimate (Riccio et
NOx , NO2 , SO2 and O3 at all three sites. Additional mea-       al., 2007) which is rather insensitive to outliers and gener-
surements include benzene, toluene, xylenes, PM10 , PM2.5 ,      ally yields better estimates than the individual models (Gal-
benzo[a]pyrene and NH3 in Milan and CO and PM10 in Lim-          marini et al., 2018). CAMS regional air quality forecasts are
ito. Each gas analyser samples from the main inlet through a     routinely quality-controlled, and dedicated evaluation reports
Nafion dryer. The NOx data reported in this work for the Mi-     are published every third month for both individual and the
lan conurbation were obtained with trace level instruments       ENSEMBLE models (see https://atmosphere.copernicus.eu/
based on IR (1200 nm) chemiluminescence and a Mo con-            regional-services, last access: 9 October 2020). In this work,
verter (Teledyne API 201E, Thermo Fisher 42i and Thermo          we used daily averages of the ENSEMBLE surface concen-
Fisher 42c in Milan Pascal, Limito and Cormano, respec-          tration forecast each day for the next 24 h (D0). For the pe-
tively), and O3 was measured by UV (254 nm) fluorescence         riod March–May 2019, the differences between daily mean
(Thermo Fisher 49i at all three sites). All measurements are     D0 forecasts and measurements performed at various refer-
performed according to a specific quality assurance and qual-    ence stations across northern Italy (expressed as median of
ity control programme. All gas monitors are calibrated every     the root mean square errors, RMSEs) were 10.5, 10.6 and
3 months using zero air and certified gas cylinders (NO) and     24.5 µg m−3 for NO2 , PM10 and O3 , respectively. Additional
every 6 months using a primary standard ozone generator for      statistical scores are available in quarterly CAMS reports
O3 . The PM10 mass concentrations in the Milan conurbation       (CAMS, 2019, 2020c). Note that the actual ENSEMBLE
reported in this work were measured using beta absorption        RMSEs relative to the stations and time periods we analyzed
analysers (FAI SWAM DC and 5A models in Milan Pascal             are part of our statistical analysis described in Sect. 2.4.1.
and Limito, respectively). The PM analysers are checked for         As the anthropogenic emissions used by the individual
temperature, pressure, flow rates, leaks and other operational   models did not change to account for any lockdown mea-
parameters every 3 months. A periodical comparison with          sure, the ENSEMBLE model continued to forecast pollu-
gravimetric samples has been performed once yearly in Mi-        tants’ concentrations as if the COVID-19 epidemic had not
lan Pascal and upon a specific audit programme in Limito.        occurred in 2020.
In 2019, annual average concentrations of NO, NO2 and O3
were, respectively, 25, 37 and 46 µg m−3 in Milan Pascal; 29,    2.4     Data analysis
45 and 46 µg m−3 in Cormano; and 26, 34 and 44 µg m−3
in Limito. For PM10 , 2019 annual averages were 29 and           2.4.1    Pollutant concentrations
31 µg m−3 in Milan Pascal and Limito, respectively. Data are
                                                                 To determine the specific impact of lockdown measures on
available online at https://www.arpalombardia.it (last access:
                                                                 concentrations of air pollutants, we compared daily observa-
9 October 2020).
                                                                 tions (Obs2020 ) with daily expected concentrations (Exp2020 )
                                                                 for the period 17 February–24 May 2020, which com-
2.3   CAMS regional ensemble forecast description
                                                                 prises the 8 lockdown weeks (D = 9 March–3 May 2020),
                                                                 the 3 weeks before the beginning (A = 17 February–
The Copernicus Atmospheric Monitoring Service (CAMS)
                                                                 8 March 2020) and the 3 weeks after the end of the lock-
provides 4 d ahead air quality forecasts daily for Europe
                                                                 down period (P = 4–24 May 2020). NO2 , PM10 , NO, O3
from currently nine different regional air quality mod-
                                                                 and SO2 observed and expected concentrations are shown in
els (CHIMERE, DEHM, EMEP, EURAD-IM, GEM-AQ,
                                                                 Fig. 3. Expected concentrations were derived from 2020 EN-
LOTOS-EUROS, MATCH, MOCAGE, SILAM). Hourly
                                                                 SEMBLE forecasts, which account for variations in meteo-
pollutant concentrations are calculated for altitudes rang-
                                                                 rological conditions and seasonal changes in emission source
ing from the 40 m thick surface layer to 5 km. The out-
                                                                 strengths in a “business as usual” world, i.e. without lock-
puts of the different individual models are interpolated
                                                                 down measures. However, since data from 2019 show that
on a common regular 0.1◦ × 0.1◦ latitude × longitude grid
                                                                 the agreement between ENSEMBLE forecasts (CAMS2019 )
(about 10 km × 10 km) over the European domain (30–
                                                                 and observations (Obs2019 ) improves from February to May
72◦ N, 25◦ W–45◦ E). Forecasts are performed independently
                                                                 (see Figs. S1–S3 in Supplement), CAMS2020 was corrected
by all the individual regional air quality systems: each
                                                                 for this seasonality. Thus, 2020 daily expected pollutant con-
air quality model is based on different chemical (gas and
                                                                 centrations (Exp) were calculated as follows:
aerosols) and physical parameterisations but uses the same
meteorological drivers as input (the ECMWF Integrated                         CAMS2020
Forecasting System, IFS) and the same anthropogenic emis-        Exp2020 =             Obs2019 .                            (1)
                                                                              CAMS2019
sions data (Kuenen et al., 2014; Denier van der Gon et al.,
2015) based on 2011 emission inventories until June 2019         The comparison of observations with these expected concen-
and on 2016 emission inventories afterwards. An ensemble         trations for 2020 has the great advantage of being insensi-
(named “ENSEMBLE forecast”) is calculated from individ-          tive to the fact that the emissions inventories used to cal-
ual model outputs with a median approach (Marécal et al.,        culate ENSEMBLE forecast data for 2019 and 2020 were

https://doi.org/10.5194/acp-21-7597-2021                                          Atmos. Chem. Phys., 21, 7597–7609, 2021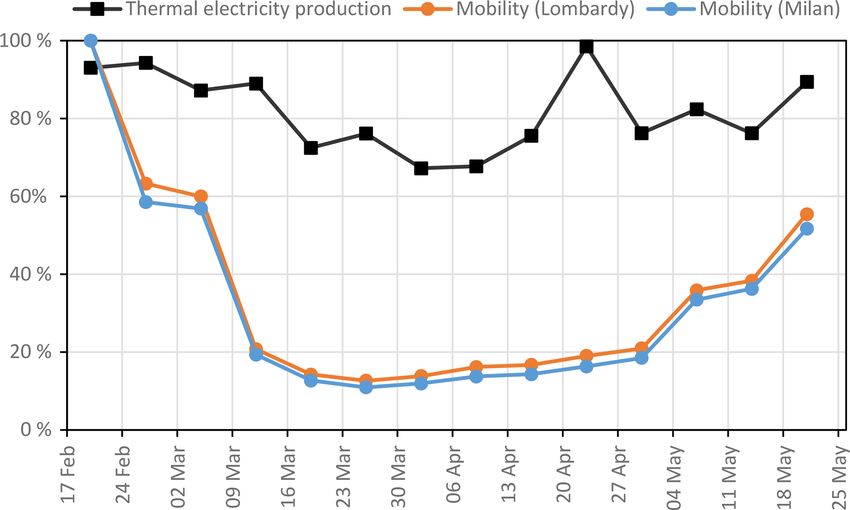
7602                                               J.-P. Putaud et al.: Impacts of the COVID-19 lockdown on air pollution

different. The disadvantage of this approach is that Obs and     al., 2014). The second variable is the aerosol light absorption
Exp cannot be compared to each other on a daily basis            Ångström exponent (AÅE). It represents the wavelength de-
since Exp values are affected by random variations in the        pendence of light absorption by aerosol particles. AÅE val-
Obs2019 / CAMS2019 ratio. Therefore Obs2020 and Exp2020          ues vary with particle sources and have commonly been used
data were compared statistically for the three periods A, D      to apportion pollution particles between, for example, traffic
and P . Since changes in pollutant emission rates are expected   and wood burning (Sandradewi et al., 2008). Traffic-emitted
to result in changes in pollutant concentrations in terms of     particles (mainly from diesel engines) have an AÅE close to
percentages or ratios, statistical analyses were performed       1, while particles from wood combustion have more variable
on Obs2020 / Exp2020 daily ratios. We calculated occurrence      AÅEs around 2 (Sandradewi et al., 2008). The mixture of
frequency distributions of the Obs2020 / Exp2020 ratio using     pollution particles with primary or secondary aerosol of bio-
eight class bins ranging from 2, all equally wide      genic origin can also lead to AÅE values much greater than
on a logarithmic scale (except the last one when specifically    1. Since both variables are insensitive to air pollution disper-
indicated). Cumulative frequencies of occurrence were also       sion, they are much less variable than the extensive variables
plotted to facilitate comparisons (Fig. 4). To detect possible   (i.e. atmospheric concentrations) they are derived from (e.g.
specific impacts of lockdown measures on the highest con-        Putaud et al., 2014). The values expected for these so-called
centrations, specific occurrence frequency distributions were    intensive variables were calculated as the arithmetic averages
also calculated by selecting the 28 d on which ENSEMBLE          observed during the 2017–2019 period.
forecast data were greater than the median during the lock-
down period. These days are different for each pollutant and
each site. The statistical significance of the differences in    3     Results and discussion
Obs2020 / Exp2020 ratios during the lockdown period in com-
parison with before and after the lockdown period (i.e. be-      The observation and ENSEMBLE forecast data used to esti-
tween A and D or P and D) was assessed by applying a t           mate the values expected for the air pollution variables dis-
test assuming unequal variances to the means A, P and D,         cussed in this section are described in Sects. 1 and 2 of the
defined as follows:                                              Supplement to this article. The high PM10 concentrations ob-
                                                    !!           served at all sites on 28 and 29 March 2020 were related to
                       (Obs/CAMS)during lockdown                 desert dust advection from the east (see maps from the World
D = mean log                                            ,
                    (Obs/CAMS)10 Mars–25 May 2019                Meteorological Organisation Sand and Dust Storm Warn-

                      (Obs/CAMS)before lockdown
                                                               ing Advisory and Assessment System, 2021). The data from
A = mean log                                          ,          these two dates were not excluded from our statistical analy-
                    (Obs/CAMS)17 Feb–9 Mars 2019
                                              !!                 sis since they did not affect its results.
                     (Obs/CAMS)after lockdown
P = mean log                                      .        (2)
                    (Obs/CAMS)5–25 May 2019                      3.1    Regional background (Ispra)

The null hypotheses (D = A and D = P ) were tested at the        The trend in AÅE observed in Ispra in 2017–2019 (and also
95 % confidence level, and results were used to determine if     in 2020) is consistent with a decreasing contribution of wood
differences between D and A and D and P were statistically       burning to particulate pollution from winter to summer. The
significant.                                                     AÅE values measured in 2020 can of course not be com-
                                                                 pared point to point to the 2017–2019 average in Fig. 5 be-
2.4.2   Intensive aerosol variables                              cause the use of wood fuel for domestic heating also de-
                                                                 pends on weekend and cold-evening occurrences. However,
To complement our analyses based on pollutant concentra-         the clear increase in the AÅE average between 9 March and
tions, we also looked at two characteristics of the atmo-        4 May 2020 compared to the 3 weeks before, the 3 weeks
spheric aerosol measured at ECAtmO in Ispra. The first one       after and the corresponding period in 2017–2019 undoubt-
is the percentage of number of tiny particles with mobil-        edly shows a change in particle sources related to lockdown
ity diameters (Dp ) between 15 and 70 nm as compared with        measures (Table 1). A specific analysis focused on the first 4
the “total” number of particles with mobility diameters be-      weeks of the lockdown period (before significant numbers of
tween 15 and 800 nm. This percentage was calculated from         biogenic aerosols are expected) suggests a −45 % reduction
full particle number size distributions (10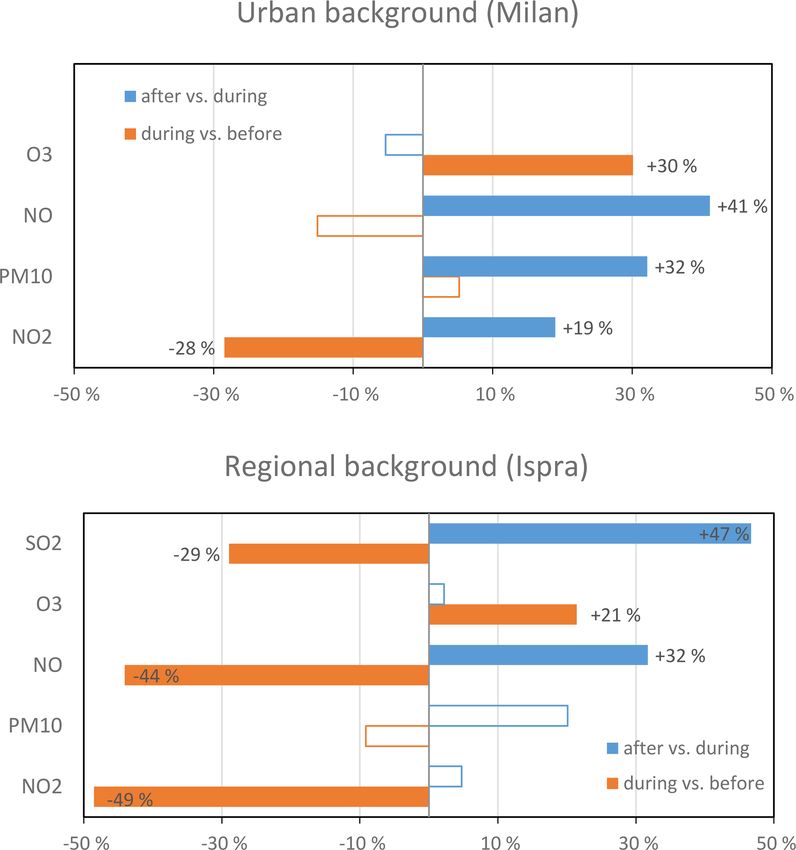
J.-P. Putaud et al.: Impacts of the COVID-19 lockdown on air pollution 7603
Figure 3. Observed (dots) and expected (lines) 2020 concentrations (µg m−3 ) of NO2 , PM10 , NO, O3 and SO2 in Ispra (left-hand side) and
the Milan conurbation (right-hand side). Vertical lines indicate the beginning and end of the lockdown period.
Table 1. Observed/expected concentration ratios for pollutant concentrations and aerosol characteristics before, during and after the lock-
down measures in Ispra (regional background) and Milan (urban background).
Ispra (regional background) Milan (urban background)
Before During During After Before During During After
(> median) (> median)
NO2 1.52 0.89 0.78 0.82 0.83 0.57 0.59 0.73
PM10 0.67 0.60 0.61 0.77 0.77 0.83 0.81 1.20
NO 1.95 1.11 1.09 1.60 0.69 0.70 0.58 0.99
O3 0.79 0.87 0.96 0.98 0.93 1.17 1.22 1.15
SO2 1.19 1.02 0.85 1.59
sub 70 nm % 1.09 0.79 0.75 0.91
AÅE 1.04 1.12 1.14 1.05
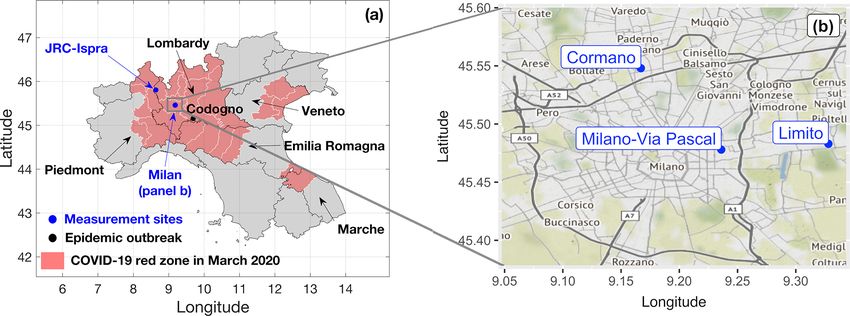
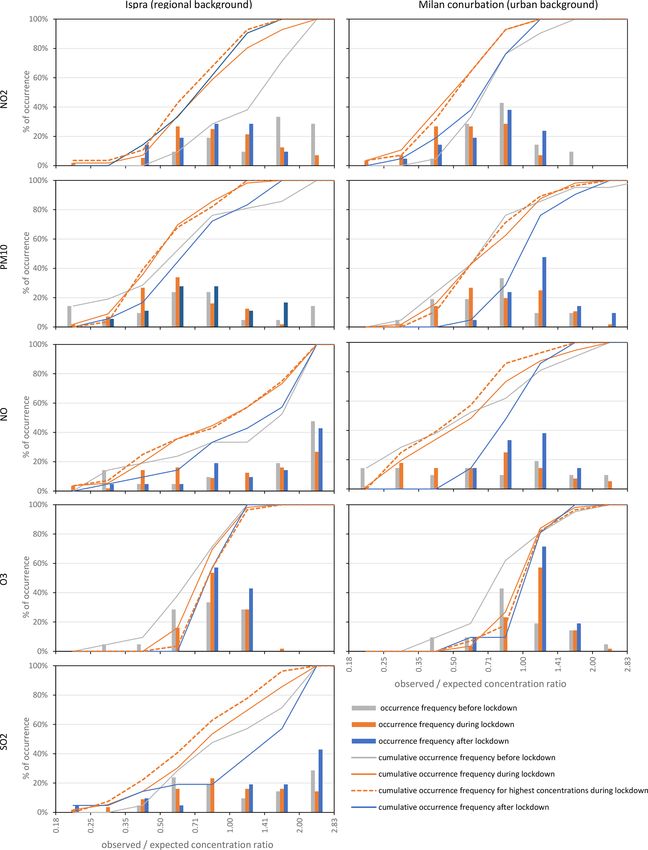
https://doi.org/10.5194/acp-21-7597-2021 Atmos. Chem. Phys., 21, 7597–7609, 20217604 J.-P. Putaud et al.: Impacts of the COVID-19 lockdown on air pollution Figure 4. Occurrence frequency distributions of 2020 observed/expected concentration ratios (Obs2020 / Exp2020 ) for NO2 , PM10 , NO, O3 and SO2 during the lockdown period and during the 3 weeks before and after the lockdown period in Ispra (left) and the Milan conurbation (right). Lines show cumulative frequencies of occurrence. Dashed lines show the cumulative frequency of occurrence of Obs2020 / Exp2020 ratios for the 28 d corresponding to the highest CAMS forecast values. Note: the last bin for NO in Ispra contains all values >2. Atmos. Chem. Phys., 21, 7597–7609, 2021 https://doi.org/10.5194/acp-21-7597-2021
J.-P. Putaud et al.: Impacts of the COVID-19 lockdown on air pollution                                                                7605

Figure 5. Aerosol light absorption Ångström exponent (AÅE) in          Figure 6. Percentage of sub-70 nm particles in 2020 (dots) com-
2020 (dots) compared to its 2017–2019 average (lines). The shaded      pared to 2017–2019 average (line). The shaded area represents ±1
area represents ±1 standard deviation of the average. Vertical lines   standard deviation of the average. Vertical lines indicate the begin-
indicate the beginning and the end of the lockdown period.             ning and the end of the lockdown period.

                                                                       (Table 1). Due to its lifetime of about 1–2 d (Seinfeld and
heating. The ultrafine mode diameters of primary particle
                                                                       Pandis, 2016), NO2 can travel rather long distances. Nitro-
emissions range from 50 to 100 nm for domestic heating (e.g.
                                                                       gen oxides are also emitted by large combustion sources like
Tiwari et al., 2014; Ozgen et al., 2017) and range from 10 to
                                                                       thermal power plants, which also emit SO2 . However, our
90 nm for engines (e.g. Giechaskiel et al., 2019; Giechask-
                                                                       analysis of SO2 data also reveals that sources of SO2 that af-
iel, 2020). Measurements also show that peaks in the number
                                                                       fect concentrations in Ispra decreased due to lockdown mea-
of 15–70 nm particles can result from the growth of nucle-
                                                                       sures (Figs. 3 and 4). The fact that NO2 observed/expected
ation particles in the afternoon. The percentage of 15–70 nm
                                                                       concentration ratios remained as low after as during the lock-
particles generally increased from mid-February till end of
                                                                       down period could be explained by a slower increase in traf-
May in 2017–2019 (Fig. 6). Considering that (1) wood burn-
                                                                       fic on the regional scale as compared to the local scale.
ing combustion for domestic heating did not decrease dur-
                                                                          Regarding secondary pollutants, the highest O3 concentra-
ing the lockdown period, (2) nucleation and growth of sec-
                                                                       tions significantly increased compared to expected concen-
ondary aerosol particles were observed on sunny days during
                                                                       trations during the lockdown period in comparison with the
the lockdown period from 6 April 2020, and (3) that mostly
                                                                       3 weeks before (Figs. 7 and 4). This suggests that O3 peaks
morning peaks in particle number diminished during the
                                                                       are usually diminished by NO titration during this period of
lockdown period especially from 11 March to 13 April 2020,
                                                                       the year in Ispra and that the abatement in NOx emissions
the relative “disappearance” of 15–70 nm particles during the
                                                                       revealed by NO and NO2 data analyses led to a reduction
lockdown period (Fig. 6) can be attributed to a decrease in
                                                                       in this effect. The relaxation of lockdown measures led to
traffic related to lockdown measures. Since the atmospheric
                                                                       a further increase in O3 . Since O3 production is generally
lifetime of 15–70 nm particles is 3–12 h, local to regional
                                                                       VOC-limited in May in Ispra, this increase in O3 is proba-
traffic was concerned. Although it significantly increased af-
                                                                       bly due to an increase in anthropogenic emissions of VOCs
ter 4 May 2020, the percentage of 15–70 nm particles did not
                                                                       from, for example, local traffic. In the case of PM10 , which
get back to the level observed before the lockdown as lock-
                                                                       is mainly composed of secondary particulate species in Is-
down measures were relaxed.
                                                                       pra (Larsen et al., 2012), no significant decrease compared
   The decrease in emissions from local traffic indicated by
                                                                       to expected concentrations could be identified as lockdown
the drop in the percentage of the smallest particles (Fig. 6)
                                                                       measures were implemented (Figs. 3 and 4). This is because
is the most probable cause for the decrease in NO related
                                                                       the decrease in PM10 related to traffic was compensated by
to the lockdown measures in Ispra (Fig. 4). NO daily mean
                                                                       the increase from wood burning for domestic heating, at least
concentrations are indeed dominated by their morning peak
                                                                       during the first half of the lockdown period. In contrast, PM10
corresponding to traffic rush hours (which disappears during
                                                                       significantly but marginally increased as lockdown measures
weekends). During daytime, NO is rapidly converted to NO2 ,
                                                                       were relaxed on 4 May 2020, at a time of the year (from May
and NO concentrations reach very low steady-state values.
                                                                       onwards) when wood burning combustion for domestic heat-
Decreased NO emissions should therefore result in decreases
                                                                       ing is largely reduced.
in NO2 . Such a decrease in NO2 (−40 % on average) actually
occurred in Ispra as a result of the lockdown measures from
9 March 2020 (Fig. 4). In contrast, NO2 did not “recover”
from the lockdown measures, unlike NO, of which concen-
trations increased again in comparison to expected concen-
trations as lockdown measures were relaxed on 4 May 2020

https://doi.org/10.5194/acp-21-7597-2021                                                 Atmos. Chem. Phys., 21, 7597–7609, 2021
7606 J.-P. Putaud et al.: Impacts of the COVID-19 lockdown on air pollution
can be explained by the decrease in O3 titration by NO in a
pollution regime where photochemical O3 production is lim-
ited by the availability of volatile organic compounds. The
relaxation of lockdown measures did not lead to the expected
decrease in O3 (Fig. 4), perhaps because NOx emissions did
not fully recover during the 3 weeks following the end of the
lockdown period.
Again, as in Ispra, no significant change in PM10 could
be detected when lockdown measures were implemented.
This is very likely due to the fact that decreased emissions
of PM10 (and PM10 precursors) were compensated by in-
creases from other sources like domestic heating and en-
hanced formation of secondary PM. In particular, Huang
et al. (2021) reported that increased oxidative capacities of
the atmosphere (e.g. higher O3 concentrations) resulted from
the drastic reductions in NOx emissions following from the
lockdown measures in China, which in turn lead to an in-
crease in the formation rate of nitric acid (HNO3 ). Such a
phenomenon in northern Italy, together with sustained emis-
sions of ammonia from agriculture, which was not affected
by the lockdown (ARPA Lombardia, 2020a), could have re-
sulted in increased formation of particulate ammonium ni-
Figure 7. Changes in observed and expected concentrations for the trate (NH4 NO3 ) and therefore an increase in PM10 concen-
3 weeks before and after the lockdown in comparison with the 28 d trations beyond expected concentrations in the Milan conur-
of lockdown corresponding to the CAMS daily forecasts above the bation. For the 3 weeks following 4 May 2020, the relaxation
median for each pollutant. Filled bars represent statistically signif- of lockdown measures led to a further increase in PM10 in
icant differences. Empty bars represent differences that are not sig- comparison to expected concentrations in Milan. This might
nificantly different from zero.
be attributed to the upturn in traffic and particularly to the
re-suspension of dust from roads that had been little used for
several weeks.
3.2 Urban background (Milan conurbation)
To represent the Milan urban background, we used data from 4 Conclusions
three urban background sites located in Milan’s hinterland
and in Milan’s city centre (Fig. 1). NO2 significantly de- Northern Italy has been an air pollution hotspot for decades.
creased (−30 % on average) compared to expected concen- Northern Italy also hosted the very first clusters of the
trations as lockdown measures were implemented (Figs. 3 COVID-19 epidemic in Europe, and from February 2020,
and 4). NO2 significantly but not totally “recovered” when containment measures were gradually implemented, culmi-
lockdown measures were relaxed (Table 1), which suggests nating in strict lockdown measures in force between 9 March
that not all sources determining NO2 concentrations in Milan and 4 May 2020. We isolated specific impacts of the lock-
were fully reopened. However, the increase in NO after the down measures on air pollution by comparing observed with
end of the lockdown period suggests that local traffic largely expected data at one regional background site (Ispra) and
resumed. Perhaps NOx emissions on a broader scale did not three urban background sites (in the Milan conurbation)
yet reach their usual intensity during the first 3 weeks af- across the period 17 February–24 May 2020. All four stations
ter the end of the lockdown period, as already suggested by were in the COVID-19 “red zone”. Expected pollutant con-
NO2 data from Ispra. Regarding NO, it should be noted that centrations were derived from ENSEMBLE forecasts, which
a significant decrease in comparison to the weeks before the are based on actual meteorological conditions and histori-
lockdown period could only be detected at the city centre sta- cal emissions estimates that ignored the COVID-19 epidemic
tion (Fig. S8). Both sites in the hinterland are much closer to and related lockdown measures. Changes in observed versus
highways and might reflect more NO emissions from heavy- computed expected concentrations for the lockdown period
duty vehicles, whose traffic did not decrease that much, at and the 3 weeks before and after the lockdown period should
least during the first weeks of the lockdown period. therefore directly reflect the impact of lockdown measures
As in Ispra, the implementation of lockdown measures on on air pollution.
9 March 2020 led to increases in O3 in the Milan conurbation We showed that lockdown measures had statistically sig-
compared to expected concentrations (Figs. 3 and 4). This nificant impacts on concentrations of most gaseous pollutants
Atmos. Chem. Phys., 21, 7597–7609, 2021 https://doi.org/10.5194/acp-21-7597-2021J.-P. Putaud et al.: Impacts of the COVID-19 lockdown on air pollution 7607
(Table 1). However, we were not able to highlight systematic Supplement. The supplement related to this article is available on-
significant effects on PM10 concentrations. line at: https://doi.org/10.5194/acp-21-7597-2021-supplement.
Focusing on those days for which the ENSEMBLE model
forecast concentrations were above the median for the lock-
down period (Fig. 7), the following can be said: Author contributions. JPP, EP and LP contributed to conception
and design. SMDS, FL and UDS contributed to acquisition of data.
– NO2 concentrations decreased by about −30 % and JPP, EP, LP, GL and AC contributed to analysis and interpretation
of data. JPP, EP, LP, GL and AC drafted the article.
−50 % at the urban and regional background sites, re-
spectively, as a result of the lockdown implementation
on 9 March 2020. The relaxation of lockdown measures
Competing interests. The authors declare that they have no conflict
on 4 May led to a partial recovery in NO2 concentrations of interest.
in Milan (urban background) but not in Ispra (regional
background).
Acknowledgements. The authors thank the Copernicus Atmosphere
– Unlike NO2 , PM10 concentrations were not signifi- Monitoring Service Information, in particular the Regional Produc-
cantly affected by the lockdown measures. We showed tion Service. Jean-Philippe Putaud, Luca Pozzoli, Enrico Pisoni, Se-
that the decrease in traffic-related PM10 was compen- bastiao Martins Dos Santos and Friedrich Lagler thank their col-
sated by an increase in PM10 associated with wood leagues from JRC for fruitful tele-discussions during the whole
lockdown period and for helpful comments on the manuscript.
burning for domestic heating in Ispra. PM10 concen-
trations in Milan are to a great extent influenced by
PM10 “non-urban” and “non-traffic” sources (Thunis
Financial support. This research has been supported by the Eu-
et al., 2018), including the formation of secondary
ropean Commission, H2020 Research Infrastructures (ACTRIS-2
aerosol. Sustained regional background PM10 concen- (grant no. 654109) and ACTRIS IMP (grant no. 871115)).
trations and a modified HNO3 production regime asso-
ciated with continuing NH3 emissions from agriculture
could explain the lack of decrease in PM10 resulting Review statement. This paper was edited by Rolf Müller and re-
from the lockdown measures in Milan too. In contrast, viewed by S. Fadnavis and one anonymous referee.
the relaxation of lockdown measures led to an increase
in PM10 concentrations at both urban and regional back-
ground sites (+30 % and +20 %, respectively) in May,
when domestic heating is much reduced. References
ARPA Lombardia: Stima preliminare delle emissioni in Lom-
– The lockdown measures led to an increase in the highest bardia durante l’emergenza COVID-19, available at: https:
O3 concentrations at both the urban and regional back- //www.arpalombardia.it/sites/DocumentCenter/Documents/
ground sites. ARIA/report-stima-emissiva-COVID19-lombardia.pdf, last
access: 9 October 2020a.
The sad experience of the COVID-19 epidemic and subse- ARPA Lombardia: Richiesta Dati, available at: https:
quent lockdown measures shows that drastic changes in mo- //www.arpalombardia.it/Pages/Aria/Richiesta-Dati.aspx, last
bility and economic activity can lead to 0 % (insignificant) access: 9 October 2020b.
to −30 % reductions in air pollution in urban background ar- Baldasano, J. M.: COVID-19 lockdown effects on
air quality by NO2 in the cities of Barcelona and
eas. These figures suggest that the abatement of air pollu-
Madrid (Spain), Sci. Total Environ., 741, 140353,
tion down to levels that do not have adverse effects on hu- https://doi.org/10.1016/j.scitotenv.2020.140353, 2020.
man health in northern Italy may require structural changes Copernicus Atmosphere Monitoring Service (CAMS): Quar-
in other sectors, including energy production, domestic heat- terly report on ENSEMBLE NRT productions (daily anal-
ing and agriculture in addition to transport. yses and forecasts) and their verification, at the surface
and above surface March–April–May 2019, available at:
https://atmosphere.copernicus.eu/sites/default/files/2020-02/
Data availability. Observation data from Ispra are available at CAMS50_2018SC1_D5.2-3.1.ENSEMBLE-2019MAM_
https://data.jrc.ec.europa.eu/collection/abcis (European Commis- 201908_NRTProduction_Report_v1_APPROVED_Ver1.pdf
sion, 2021) and https://actris.nilu.no/ (NILU, Norsk Institutt for (last access: 15 January 2021), 2019.
Luftforskning, 2021). Observation data from Milan are available Copernicus Atmosphere Monitoring Service (CAMS): Air
at https://www.arpalombardia.it/Pages/Aria/Richiesta-Dati.aspx quality information confirms reduced activity levels
(ARPA Lombardia, 2020b). Model forecast data for all sites are due to lockdown in Italy, 17 March 2020, available at:
available at https://ads.atmosphere.copernicus.eu/cdsapp#!/dataset/ https://atmosphere.copernicus.eu/air-quality, last access: 9
cams-europe-air-quality-forecasts?tab=form (CAMS, 2020d). October 2020a.
https://doi.org/10.5194/acp-21-7597-2021 Atmos. Chem. Phys., 21, 7597–7609, 20217608 J.-P. Putaud et al.: Impacts of the COVID-19 lockdown on air pollution
Copernicus Atmosphere Monitoring Service (CAMS): Flawed European Commission: Joint Research Centre Data Catalogue,
estimates of the effects of lockdown measures on air quality available at: https://data.jrc.ec.europa.eu/collection/abcis (last
derived from satellite observations, 26 March 2020, available access: 9 October 2020), 2021.
at: https://atmosphere.copernicus.eu/flawed-estimates-effects- European Environment Agency (EEA): Air quality in Europe
lockdown-measures-air-quality-derived-satellite-observations, – 2019 report, European Environment Agency Report No
last access: 9 October 2020b. 10/2019, available at: https://www.eea.europa.eu/publications/
Copernicus Atmosphere Monitoring Service (CAMS): air-quality-in-europe-2019 (last access: 25 March 2020),
Quarterly report on ENSEMBLE NRT productions https://doi.org/10.2800/822355, 2019.
(daily analyses and forecasts) and their verifica- European Environment Agency (EEA): Air quality and COVID-
tion, at the surface and above surface, available at: 19, available at: https://www.eea.europa.eu/themes/air/
https://atmosphere.copernicus.eu/sites/default/files/2020-09/ air-quality-and-covid19/air-quality-and-covid19, last access: 25
CAMS50_2018SC2_D5.2-3.1.ENSEMBLE-2020MAM_ March 2020.
202008_NRTProduction_Report_v1.pdf (last access: 15 January EUROSTAT: Data Browser, available at: https://ec.europa.eu/
2021), 2020c. eurostat/, last access: 9 October 2020.
Copernicus Atmosphere Monitoring Service (CAMS): Galmarini, S., Kioutsioukis, I., Solazzo, E., Alyuz, U., Balzarini,
CAMS European air quality forecasts, available at: A., Bellasio, R., Benedictow, A. M. K., Bianconi, R., Bieser, J.,
https://ads.atmosphere.copernicus.eu/cdsapp#!/dataset/ Brandt, J., Christensen, J. H., Colette, A., Curci, G., Davila, Y.,
cams-europe-air-quality-forecasts?tab=form (last access: Dong, X., Flemming, J., Francis, X., Fraser, A., Fu, J., Henze, D.
15 January 2021), 2020d. K., Hogrefe, C., Im, U., Garcia Vivanco, M., Jiménez-Guerrero,
Decreto del Presidente del Consiglio dei Ministri (DPCM): Ulteri- P., Jonson, J. E., Kitwiroon, N., Manders, A., Mathur, R.,
ori disposizioni attuative del decreto-legge 23 febbraio 2020, n. Palacios-Peña, L., Pirovano, G., Pozzoli, L., Prank, M., Schultz,
6, recante misure urgenti in materia di contenimento e gestione M., Sokhi, R. S., Sudo, K., Tuccella, P., Takemura, T., Sekiya, T.,
dell’emergenza epidemiologica da COVID-19, 8th of March, and Unal, A.: Two-scale multi-model ensemble: is a hybrid en-
2020, (20A01522) (GU Serie Generale n. 59 del 08-03-2020), semble of opportunity telling us more?, Atmos. Chem. Phys., 18,
2020a. 8727–8744, https://doi.org/10.5194/acp-18-8727-2018, 2018.
Decreto del Presidente del Consiglio dei Ministri (DPCM): Ulte- German Aerospace Center (DLR): Despite the influ-
riori disposizioni attuative del decreto-legge 23 febbraio 2020, ence of weather patterns, the effect of the Coron-
n. 6, recante misure urgenti in materia di contenimento e ges- avirus on air quality is now visible, available at:
tione dell’emergenza epidemiologica da COVID-19, applicabili https://www.dlr.de/content/en/articles/news/2020/02/20200505_
sull’intero territorio nazionale, 11th of March 2020, (20A01605) effect-of-the-coronavirus-on-air-quality-is-now-visible.html,
(GU Serie Generale n. 64 del 11-03-2020), 2020b. last access: 9 October 2020.
Decreto del Presidente del Consiglio dei Ministri (DPCM): Ulte- Giechaskiel, B.: Particle Number Emissions of a Diesel Vehicle
riori disposizioni attuative del decreto-legge 23 febbraio 2020, during and between Regeneration Events. Catalysts, 10, 587,
n. 6, recante misure urgenti in materia di contenimento e ges- https://doi.org/10.3390/catal10050587, 2020.
tione dell’emergenza epidemiologica da COVID-19, applicabili Giechaskiel, B., Joshi, A., Ntziachristos, L., and Dilara, P.: Euro-
sull’intero territorio nazionale, 22nd of March 2020, (20A01807) pean Regulatory Framework and Particulate Matter Emissions
(GU Serie Generale n. 76 del 22-03-2020), 2020c. of Gasoline Light-Duty Vehicles: A Review, Catalysts, 9, 586,
Decreto del Presidente del Consiglio dei Ministri (DPCM): Ulte- https://doi.org/10.3390/catal9070586, 2019.
riori disposizioni attuative deldecreto-legge 23 febbraio 2020, Gilardoni, S., Vignati, E., Cavalli, F., Putaud, J. P., Larsen, B.
n. 6, recante misure urgenti in materia di contenimento e ges- R., Karl, M., Stenström, K., Genberg, J., Henne, S., and Den-
tione dell’emergenza epidemiologica da COVID-19,applicabili tener, F.: Better constraints on sources of carbonaceous aerosols
sull’intero territorio nazionale, 26th of April 2020, Pubblicato using a combined 14 C – macro tracer analysis in a European
nella Gazz. Uff. n. 108, 27 aprile 2020, 2020d. rural background site, Atmos. Chem. Phys., 11, 5685–5700,
Decreto Legge (DL): Misure urgenti in materia di contenimento e https://doi.org/10.5194/acp-11-5685-2011, 2011.
gestione dell’emergenza epidemiologica da COVID-19, 23rd of Grange, S. K., Lee, J. D., Drysdale, W. S., Lewis, A. C., Hueglin,
February 2020, n. 6, (20G00020) (GU Serie Generale n. 45 del C., Emmenegger, L., and Carslaw, D. C.: COVID-19 lock-
23-02-2020), 2020a. downs highlight a risk of increasing ozone pollution in Eu-
Decreto Legge (DL): Ulteriori misure urgenti per fronteggiare ropean urban areas, Atmos. Chem. Phys., 21, 4169–4185,
l’emergenza epidemiologica da COVID-19, 16th of May 2020, https://doi.org/10.5194/acp-21-4169-2021, 2021.
n. 33, (20G00051) (GU Serie Generale n. 125 del 16-05-2020), Huang, X., Ding, A., Gao, J., Zheng, B., Zhou, D., Qi, X., Tang,
2020b. R., Wang, J., Ren, C., Nie, W., Chi, X., Xu, Z., Chen, L., Li, Y.,
Denier van der Gon, H. A. C., Bergström, R., Fountoukis, C., Che, F., Pang, N., Wang, H., Tong, D., Qin, W., Cheng, W., Liu,
Johansson, C., Pandis, S. N., Simpson, D., and Visschedijk, W., Fu, Q., Liu, B., Chai, F., Davis, S. J., Zhang, Q., and He, K.:
A. J. H.: Particulate emissions from residential wood com- Enhanced secondary pollution offset reduction of primary emis-
bustion in Europe – revised estimates and an evaluation, At- sions during COVID-19 lockdown in China, Natl. Sci. Rev., 8,
mos. Chem. Phys., 15, 6503–6519, https://doi.org/10.5194/acp- nwaa137, https://doi.org/10.1093/nsr/nwaa137, 2021.
15-6503-2015, 2015. INERIS (Institut national de l’environnement industriel et
des risques): The lockdown and air quality: nitrogen-
dioxide pollution falls in France’s largest cities, available
Atmos. Chem. Phys., 21, 7597–7609, 2021 https://doi.org/10.5194/acp-21-7597-2021J.-P. Putaud et al.: Impacts of the COVID-19 lockdown on air pollution 7609 at: https://www.ineris.fr/en/ineris/news/lockdown-and-air- Ozgen, S., Becagli, S., Bernardoni, V., Caserini, S., Caruso, D., quality-nitrogen-dioxide-pollution-falls-france-largest-cities, Corbella, L., Dell’Acqua, M., Fermo, P., Gonzalez, R., Lonati, last access: 9 October 2020. G., Signorini, S., Tardivo, R., Tosi, E., Valli, G., Vecchi, R., and Istituto Nazionale di Statistica (ISTAT): Principali fattori di pres- Marinovich, M.: Analysis of the chemical composition of ultra- sione sull’ambiente nelle città italiane, available at: https://www. fine particles from two domestic solid biomass fired room heaters istat.it/, last access: 9 October 2020. under simulated real-world use, Atmos. Environ., 150, 87–97, Kuenen, J. J. P., Visschedijk, A. J. H., Jozwicka, M., and De- doi.org/10.1016/j.atmosenv.2016.11.048, 2017. nier van der Gon, H. A. C.: TNO-MACC_II emission inven- Putaud, J. P., Cavalli, F., Martins dos Santos, S., and Dell’Acqua, tory; a multi-year (2003–2009) consistent high-resolution Euro- A.: Long-term trends in aerosol optical characteristics in pean emission inventory for air quality modelling, Atmos. Chem. the Po Valley, Italy, Atmos. Chem. Phys., 14, 9129–9136, Phys., 14, 10963–10976, https://doi.org/10.5194/acp-14-10963- https://doi.org/10.5194/acp-14-9129-2014, 2014. 2014, 2014. Riccio, A., Giunta, G., and Galmarini, S.: Seeking for the rational Larsen, B. R., Gilardoni, S., Stenström, K., Niedzialek, J., Jimenez, basis of the Median Model: the optimal combination of multi- J., and Belis C. A.: Sources for PM air pollution in the Po Plain, model ensemble results, Atmos. Chem. Phys., 7, 6085–6098, Italy: II. Probabilistic uncertainty characterization and sensitivity https://doi.org/10.5194/acp-7-6085-2007, 2007. analysis of secondary and primary sources, Atmos. Environ., 50, Sandradewi, J., Prevot, A. S. H., Szidat, S., Perron, N., Alfarra, M. 203–213, https://doi.org/10.1016/j.atmosenv.2011.12.038, 2012. R., Lanz, V. A., Weingartner, E., and Baltensperger, U.: Using Li, L., Li, Q., Huang, L., Wang, Q., Zhu, A., Xu, J., Liu, aerosol light absorption measurements for the quantitative de- Z., Li, H., Shi, L., Li R., Azari, M., Wang, Y., Zhang, termination of wood burning and traffic emission contributions X., Liu, Z., Zhu Y., Zhang K., Xue S., Chel, M., Ooi, G., to particulate matter, Environ. Sci. Technol., 42, 3316–3323, Zhang, D., and Chan, A.: Air quality changes during the https://doi.org/10.1021/Es702253m, 2008. COVID-19 lockdown over the Yangtze river delta region: An Seinfeld, J. H. and Pandis, S. N., Atmospheric Chemistry and insight into the impact of human activity pattern changes Physics: From Air Pollution to Climate Change, John Wiley & on air pollution variation, Sci. Total Environ., 732, 139282, Sons, Inc., New York, USA, 2016. https://doi.org/10.1016/j.scitotenv.2020.139282, 2020. Thunis, P., Degraeuwe, B., Pisoni, E., Trombetti, M., Pe- Marécal, V., Peuch, V.-H., Andersson, C., Andersson, S., Arteta, duzzi, E., Belis, C. A., Wilson, J., Clappier, A., and Vi- J., Beekmann, M., Benedictow, A., Bergström, R., Bessagnet, gnati, E.: PM2.5 source allocation in European cities: A B., Cansado, A., Chéroux, F., Colette, A., Coman, A., Curier, SHERPA modelling study, Atmos. Environ., 187, 93–106, R. L., Denier van der Gon, H. A. C., Drouin, A., Elbern, H., doi.org/10.1016/j.atmosenv.2018.05.062, 2018. Emili, E., Engelen, R. J., Eskes, H. J., Foret, G., Friese, E., Gauss, Tiwari, M., Sahu, S. K., Bhangare, R. C., Yousaf, A., and Pandit, M., Giannaros, C., Guth, J., Joly, M., Jaumouillé, E., Josse, B., G. G.: Particle size distributions of ultrafine combustion aerosols Kadygrov, N., Kaiser, J. W., Krajsek, K., Kuenen, J., Kumar, generated from household fuels, Atmos. Pollut. Res., 5, 145–150, U., Liora, N., Lopez, E., Malherbe, L., Martinez, I., Melas, D., https://doi.org/10.5094/APR.2014.018, 2014. Meleux, F., Menut, L., Moinat, P., Morales, T., Parmentier, J., Tonnensen, G. S. and Dennis, R. L.: Analysis of radical prop- Piacentini, A., Plu, M., Poupkou, A., Queguiner, S., Robert- agation efficiency to assess ozone sensitivity to hydrocar- son, L., Rouïl, L., Schaap, M., Segers, A., Sofiev, M., Taras- bons and NOx : 2. Long-lived species as indicators of ozone son, L., Thomas, M., Timmer mans, R., Valdebenito, Á., van concentration sensitivity, J. Geophys. Res., 105, 9227–9241, Velthoven, P., van Versendaal, R., Vira, J., and Ung, A.: A re- https://doi.org/10.1029/1999JD900372, 2000. gional air quality forecasting system over Europe: the MACC-II Wiedensohler, A., Wiesner, A., Weinhold, K., Birmili, W., Her- daily ensemble production, Geosci. Model Dev., 8, 2777–2813, mann, M., Merkel, M., Müller, T., Pfeifer, S., Schmidt, A. Tuch, https://doi.org/10.5194/gmd-8-2777-2015, 2015. T., Velarde, F., Quincey, P., Seeger, S., and Nowak, A.: Mo- Nakada, L. Y. K. and Urban, R. C.: COVID-19 pandemic: bility particle size spectrometers: Calibration procedures and Impacts on the air quality during the partial lockdown in measurement uncertainties. Aerosol Sci. Technol. 52, 146–164, São Paulo state, Brazil, Sci. Total Environ., 730, 139087, https://doi.org/10.1080/02786826.2017.1387229, 2018. https://doi.org/10.1016/j.scitotenv.2020.139087, 2020. World Meteorological Organisation Sand and Dust Storm Norsk Institutt for Luftforskning (NILU): ACTRIS Data Centre, Warning Advisory and Assessment System: Dust Fore- available at: https://actris.nilu.no/ (last access: 9 October 2020), casts, available at: https://sds-was.aemet.es/forecast-products/ 2021. dust-forecasts/ensemble-forecast, last access: 15 January 2021. https://doi.org/10.5194/acp-21-7597-2021 Atmos. Chem. Phys., 21, 7597–7609, 2021
You can also read