Conditional probability of distributed surface rupturing during normal-faulting earthquakes - Solid Earth
←
→
Page content transcription
If your browser does not render page correctly, please read the page content below
Solid Earth, 12, 1197–1209, 2021
https://doi.org/10.5194/se-12-1197-2021
© Author(s) 2021. This work is distributed under
the Creative Commons Attribution 4.0 License.

Conditional probability of distributed surface
rupturing during normal-faulting earthquakes
Maria Francesca Ferrario and Franz Livio
Università dell’Insubria, Dipartimento di Scienza e Alta Tecnologia, Como 22100, Italy

Correspondence: Maria Francesca Ferrario (francesca.ferrario@uninsubria.it)

Received: 15 December 2020 – Discussion started: 29 December 2020
Revised: 15 March 2021 – Accepted: 25 April 2021 – Published: 28 May 2021

Abstract. Coseismic surface faulting is a significant source        ing an active fault cannot be avoided (e.g., distributive in-
of hazard for critical plants and distributive infrastructure;      frastructure, pipelines). Moreover, faulting can occur either
it may occur either on the principal fault or as distributed        on the principal fault or on secondary fault strands. Cur-
rupture on nearby faults. Hazard assessment for distributed         rently, a probabilistic approach (i.e., PFDHA – probabilistic
faulting is based on empirical relations which, in the case         fault displacement hazard analysis) is the suggested method
of normal faults, were derived almost 15 years ago using a          to calculate the expected displacement due to surface fault-
dataset of US earthquakes. We collected additional case his-        ing for siting nuclear power plants and critical facilities (e.g.,
tories worldwide, for a total of 21 earthquakes, and calcu-         ANSI/ANS-2.30, 2015). This approach was firstly proposed
lated the conditional probability of distributed faulting as a      by Youngs et al. (2003) for the high-level nuclear waste
function of distance from the principal fault. We found no          repository in the Yucca Mountain, Nevada. The method is
clear dependency on the magnitude nor the time of occur-            directly derived from probabilistic seismic hazard analy-
rence of the earthquakes, but our data consistently show a          sis (PSHA), firstly developed by Cornell (1968), which de-
higher probability of rupture when compared with the scaling        termines the annual rate of earthquakes in which a ground
relations currently adopted in engineering practice. We de-         motion parameter exceeds a specific value, at a given loca-
rive updated empirical regressions and show that the results        tion.
are strongly conditioned by the averaging of earthquakes ef-           The earthquake approach for assessing PFDHA (Youngs
fectively generating distributed faulting at a given distance       et al., 2003) expresses the rate of displacement exceeding a
and those which did not generate faulting; thus, we intro-          given value as a function of (i) the annual rate of occurrence
duce a more conservative scenario that can be included in a         of earthquakes with a given magnitude, (ii) the probability of
logic tree approach to consider the full spectrum of poten-         surface rupture along the principal fault, and (iii) the proba-
tial ruptures. Our results can be applied in the framework of       bility that off-fault rupture at a given distance from the prin-
probabilistic assessment of fault displacement hazard.              cipal fault exceeds a given displacement value.
                                                                       According to Youngs et al. (2003), the attenuation func-
                                                                    tion for fault displacement, i.e., the term (iii) of the general
                                                                    PFDHA function, can be split into two terms (Eq. 1):
1   Introduction
                                                                    Pkn (D > d|m, r) = Pkn (Slip|m, r) × Pkn (D > d|m, r, Slip), (1)
Surface faulting is a significant source of hazard following
moderate to strong earthquakes (i.e., M > ca. 6). The quan-         where k is the position of the site of interest, n is the seis-
tification of fault displacement hazard is critical for the engi-   mogenic source, D is displacement at the site, d is a given
neering design of infrastructure and land use planning close        displacement threshold, m is magnitude, and r is distance
to active faults. The avoidance criterion is usually applied for    from the principal fault to the site.
mitigating fault displacement hazard when a fault strand’s
location is certain; however, there are situations where cross-

Published by Copernicus Publications on behalf of the European Geosciences Union.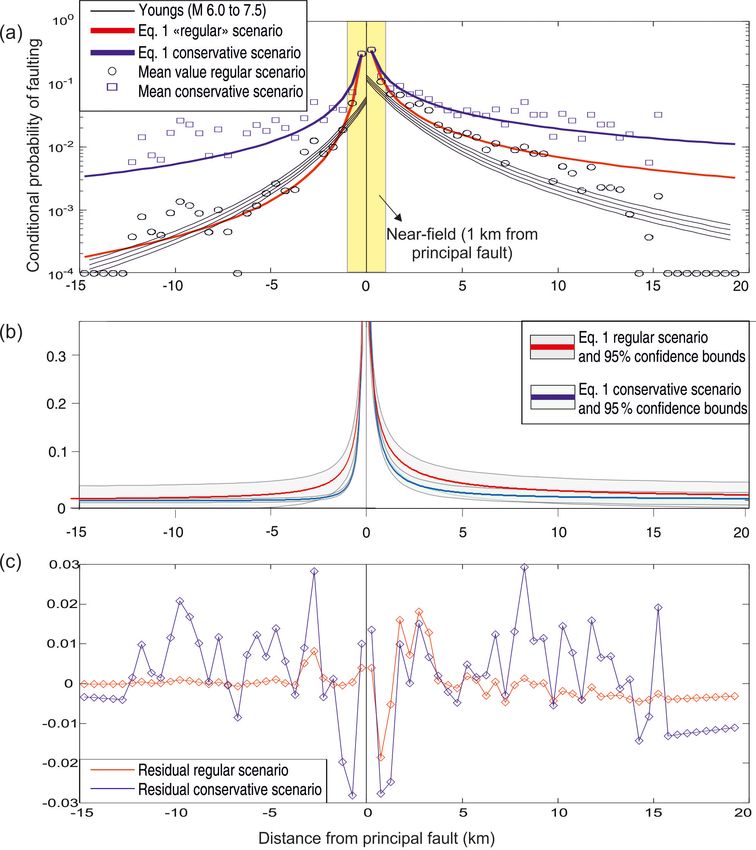
1198 M. F. Ferrario and F. Livio: Conditional probability of distributed surface rupturing
The first term is the conditional probability that some probabilities, that can be handled in a logic tree approach, as
amount of displacement occurs at site k, i.e., it represents the commonly done for PSHA studies.
actual occurrence of distributed faulting (D > 0). The sec-
ond term is the conditional probability of exceeding a given
level of displacement (d). In this paper, we focus exclusively 2 Materials and methods
on the first term in Eq. (1); this choice was driven by the fact
2.1 Dataset
that surface faulting can be an exclusion criterion for some
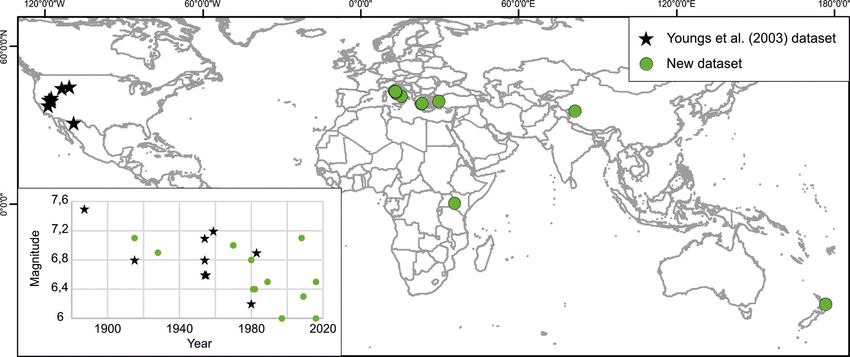
plants (e.g., nuclear power plants). We analyzed 21 events that occurred between 1887 and 2016,
While several efforts have been devoted to describing ranging in magnitude (Mw ) from 6.0 to 7.5. Nine of them
and measuring surface faulting along the main rupture af- are from the western US and have already been analyzed in
ter strong earthquakes (e.g., Wells and Coppersmith, 1994; terms of PFDHA by Youngs et al. (2003), who, in turn, used
Pezzopane and Dawson, 1996; Field et al., 2015), less in- data compiled by Pezzopane and Dawson (1996). Data for
formation is available on distributed faulting. Following the the remaining 12 earthquakes were collected from the scien-
pivotal work of Youngs et al. (2003) on normal faults, the tific literature or available databases (i.e., the SURE Project;
PFDHA approach was applied to strike-slip (Petersen et al., Baize et al., 2019). Table 1 lists the main details and the data
2011) and reverse faults (Moss and Ross, 2011; Boncio et source for each earthquake.
al., 2018; Nurminen et al., 2020). Regional datasets were The considered events occurred in different countries, and
built as well (e.g., Takao et al., 2013, and Inoue et al., 2019, all five continents are represented with at least one case his-
for Japan strike-slip and reverse faults). Slightly different tory: nine earthquakes are from the US, six are from Italy,
methods and procedures were adopted for developing em- two are from Greece, and Kenya, Turkey, New Zealand, and
pirical relations of the probability of faulting. The decrease China are all represented by one event (Fig. 1). The geo-
in the probability of faulting with distance from the princi- graphical distribution of the events reflects either the regional
pal fault was unequivocally identified by all of the studies; seismotectonic setting or the availability and accessibility of
for other driving parameters, a general consensus has still data: the US, Italy, and Greece are frequently hit by normal-
not been achieved – for instance, a magnitude dependency faulting events; other regions, like China, are less represented
was included by Youngs et al. (2003) but not by Petersen et in our database despite strong earthquake activity. For the
al. (2011). The hanging wall and footwall are considered sep- first time, an event from the African continent is included.
arately by most of the authors dealing with dip-slip ruptures We stress that the addition of events from different tectonic
(but not by Takao et al., 2013). provinces and climatic conditions will enable a better charac-
The role of the local structural setting, fault architecture at terization of distributed faulting, resulting in an overall more
depth, and near-surface geology (e.g., cut lithologies, over- reliable scaling relation. In this sense, we follow the recom-
burden load) has been highlighted after the analysis of re- mendation of Baize et al. (2019) and uploaded a shapefile
cent earthquakes, which caused a complex pattern of rupture with the rupture sections for the 13 events not already avail-
at the surface (e.g., Bray et al., 1994; Milliner et al., 2015; able in the SURE database to an online repository (see the
Teran et al., 2015). “Data Availability” section of this paper for further details).
Concerning normal faults, the reference paper for PFDHA The earthquakes’ magnitude and year are plotted in the in-
is still the work by Youngs et al. (2003), which was published set of Fig. 1: the mean magnitude of the events analyzed by
almost 20 years ago and analyzed a dataset of US earth- Youngs et al. (2003) was 6.86, whereas the mean magnitude
quakes. Since then, additional datasets have been acquired of the additional events is 6.58. The additional case histories
(see Baize et al. 2019, for a comprehensive review on the are generally more recent in time with respect to those con-
efforts devoted to building a unified database of fault dis- sidered by Youngs, with the exception of the 1915 Fucino
placement), and a general underestimation of the relations of (Italy) and 1928 Subukia Valley earthquake (Kenya) events.
Youngs et al. (2003) in the far field was recently pointed out Particular effort was devoted to the collection of data on
by Ferrario and Livio (2018). In this work, we present data M < 6.5 earthquakes; they were not adequately represented
and improved regression equations for the conditional prob- in the Youngs’ database but pose a significant threat to so-
ability of off-fault rupture. We supplemented the earthquakes ciety, as they are much more frequent than stronger earth-
already analyzed by Youngs et al. (2003) with additional case quakes (Baize et al., 2019).
histories, for a total of 21 earthquakes. This figure more than
doubled the dataset considered in the original work. 2.2 Methods
We provide an updated version of the conditional proba-
bility of distributed faulting as a function of distance from Our methodological workflow is illustrated in Fig. 2a. The
the principal fault. Our results broadly agree with those of input data are shapefiles mapping the traces of surface rup-
Youngs et al. (2003) but systematically show a probability of tures; these were available in a ready-to-use form (8 events
occurrence higher than expected. Thus, we introduced a con- included in Baize et al., 2019), or were created from georef-
servative scenario, to fully account for the range of observed erencing and digitization of maps published in the scientific
Solid Earth, 12, 1197–1209, 2021 https://doi.org/10.5194/se-12-1197-2021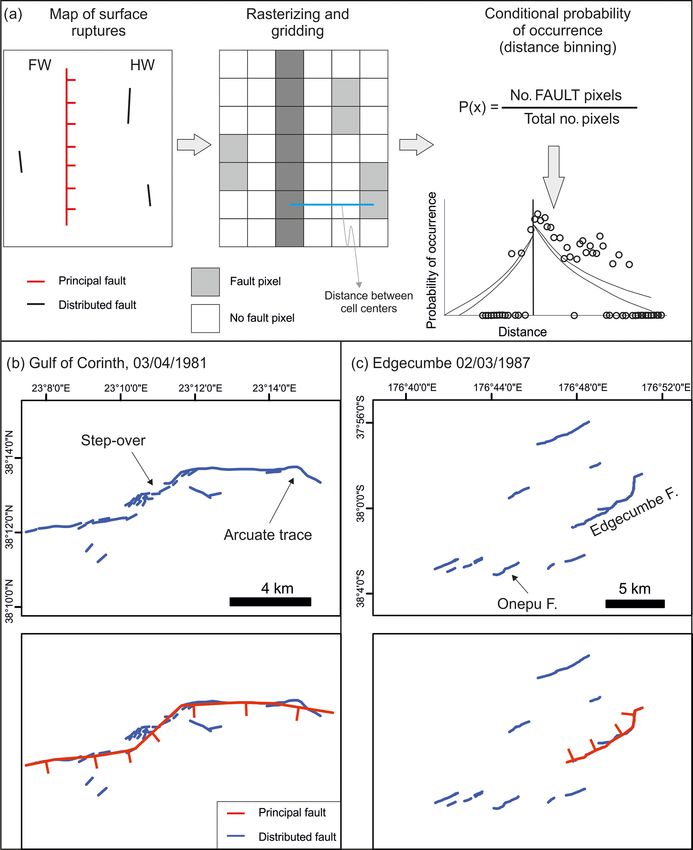
M. F. Ferrario and F. Livio: Conditional probability of distributed surface rupturing                                                   1199

Table 1. Details on the 21 earthquakes analyzed in the present study. The references list the sources for the map of surface ruptures. “∗ ” in
the reference column highlights the events that were included in the work by Youngs et al. (2003).

               ID    Date             Location                      Country           M     Reference
               01    3 May 1887       Sonora Valley                 US               7.5    Baize et al. (2019)∗
               02    13 Jan 1915      Fucino                        Italy            7.1    Amoroso et al. (2016)
               03    3 Oct 1915       Pleasant Valley               US               6.8    Baize et al. (2019)∗
               04    6 Jan 1928       Subukia Valley earthquake     Kenya            6.9    Ambraseys (1991)
               05    6 Jul 1954       Rainbow Mountain              US               6.6    Pezzopane and Dawson (1996)∗
               06    23 Aug 1954      Stillwater                    US               6.8    Pezzopane and Dawson (1996)∗
               07    16 Dec 1954      Fairview Peak                 US               7.1    Baize et al. (2019)∗
               08    16 Dec 1954      Dixie Valley                  US               6.6    Baize et al. (2019)∗
               09    18 Aug 1959      Hebgen Lake                   US               7.2    Baize et al. (2019)∗
               10    28 Mar 1970      Gediz                         Turkey           7.0    Ambraseys and Tchalenko (1972)
               11    25 May 1980      Mammoth Lake                  US               6.2    Baize et al. (2019)∗
               12    23 Nov 1980      Irpinia                       Italy            6.8    Blumetti et al. (2002)
               13    25 Feb 1981      Gulf of Corinth               Greece           6.4    Jackson et al. (1982)
               14    4 Mar 1981       Gulf of Corinth               Greece           6.4    Jackson et al. (1982)
               15    28 Oct 1983      Borah Peak                    US               6.9    Baize et al. (2019)∗
               16    2 Mar 1987       Edgecumbe                     New Zealand      6.5    Beanland et al. (1989)
               17    26 Sep 1997      Colfiorito                    Italy            6.0    Cello et al. (1998)
               18    20 Mar 2008      Yutian                        China            7.1    Xu et al. (2013)
               19    6 Apr 2009       L’Aquila                      Italy            6.3    Baize et al. (2019)
               20    24 Aug 2016      Amatrice                      Italy            6.0    Livio et al. (2016)
               21    30 Oct 2016      Norcia                        Italy            6.5    Civico et al. (2018)

Figure 1. Location of the analyzed events. The inset shows the distribution of the events according to magnitude and time of occurrence.

literature (13 events). We handled the maps with the best pos-           et al., 2003; ANSI/ANS-2.30, 2015). We only discarded rup-
sible accuracy; as a general rule, the digitization of surface           tures explicitly referred to gravitational phenomena, accord-
ruptures was performed at a scale ranging from 1 : 50 000                ing to the reports. Different approaches have been adopted in
to 1 : 10 000, depending on the accuracy of the original maps.           the literature for defining the ruptures to be processed in fur-
   We then divided the ruptures into principal and dis-                  ther analyses – for example, Petersen et al. (2011) discarded
tributed faults. “Principal” faulting shows longer continuity            the “triggered” ruptures (i.e., not structurally connected to
and higher displacement with respect to distributed faults and           the principal fault), whereas Nurminen et al. (2020) ranked
corresponds to the surface expression of the rupture along               ruptures due to reverse earthquakes into different categories
the seismogenic source at depth. Consequently, we classified             (ranked from 1 to 3). We did not attempt to further catego-
all of the ground breaks along structures irrespective of their          rize the distributed ruptures in our database due to the lack
connection to the main fault, which occurred in response to              of reliable information for some of the case histories; more-
principal faulting, as “distributed faults” (DFs; e.g., Youngs           over, from an engineering perspective the occurrence of DFs

https://doi.org/10.5194/se-12-1197-2021                                                                 Solid Earth, 12, 1197–1209, 2021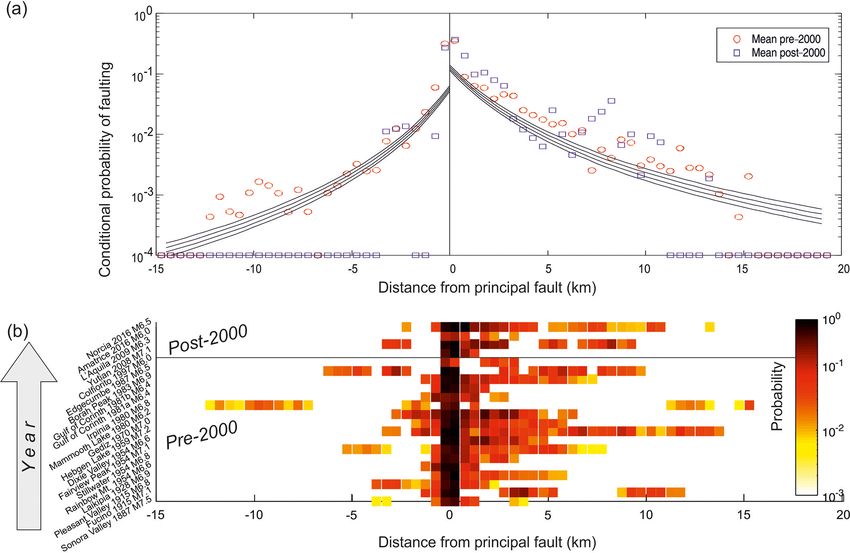
1200                                  M. F. Ferrario and F. Livio: Conditional probability of distributed surface rupturing

Figure 2. (a) Methodology for computing the conditional probability of faulting using the gridding approach. FW denotes footwall, and HW
denotes hanging wall. (b) Example of a complex trace at the surface following the 1981 Gulf of Corinth (Greece) earthquake; ruptures are
digitized from a map published by Jackson et al. (1982). (c) Example of a complex trace at the surface following the 1987 Edgecumbe (New
Zealand) earthquakes; ruptures are from the SURE database (Baize et al., 2019).

is much more relevant than the nature of the triggering pro-          faulting (P ) is defined as the number of pixels containing
cess (e.g., Youngs et al., 2003).                                     distributed faulting divided by the total number of pixels in
   The conditional probability of distributed faulting was            each distance class (Fig. 2a) and was calculated separately
computed following the earthquake approach, as defined by             for the hanging wall and footwall blocks.
Youngs et al. (2003). This was the first work to introduce               Firstly, for each event, we computed the probability of DFs
PFDHA and can be categorized as a gridding approach (Nur-             as a function of distance from the principal rupture – P (x).
minen et al., 2020). We derived a raster of the Euclidean dis-        We also investigated the possible influence of magnitude
tance from the principal fault with a 500 m grid resolution           range and year of occurrence (i.e., historical or modern
and counted the number of pixels for each distance class, up          events), assessing whether to include these parameters in the
to 20 km in the hanging wall and 15 km in the footwall; these         analyses or not (see Sect. 2.3). We then calculated the mean
limits allow one to encompass all of the observed DFs, which          value for each distance class and fitted empirical regression
reached the 15–15.5 km bin in the hanging wall and the 12–            to the dataset. We tested different functional forms, following
12.5 km bin in the footwall. The conditional probability of           those proposed in the literature (i.e., power form – Petersen et

Solid Earth, 12, 1197–1209, 2021                                                          https://doi.org/10.5194/se-12-1197-2021
M. F. Ferrario and F. Livio: Conditional probability of distributed surface rupturing                                          1201

al., 2011; exponential form – Youngs et al., 2003). In the fol-      referred to the fault plane modeled by Beanland et al. (1990),
lowing, we provide the fitting coefficients for Eq. (2), a func-     which defines the Edgecumbe Fault as the main fault rup-
tional form equivalent to that used by Youngs et al. (2003),         ture; the Onepu Fault (see Fig. 2c) lies along-strike of the
which showed better performance in terms of fitting.                 Edgecumbe Fault, but it shows a much smaller displacement
                                                                     (maximum values of 2.5 m and 26 cm, respectively) and is
            e(a+b·(ln(x+c))                                          therefore considered as a secondary rupture.
P (x) =                       ,                               (2)
          1 + e(a+b·(ln(x+c))                                           The issues defined above are not trivial, because the grid-
where x is distance from the principal fault in kilometers, and      ding method implicitly assumes that the mapping data for
a, b, and c are fitting coefficients.                                the ruptures are complete, and results depend on the grid
                                                                     size. The grid size of 500 m is quite coarse in order to com-
2.3   Assumptions and limitations                                    pensate for the possible underestimation due to incomplete
                                                                     mapping (Youngs et al., 2003). Other approaches have been
Overall, PFDHA analysis requires a significant number of             explored in the literature, such as considering different grid
subjective choices, and a common methodology or thorough             sizes (e.g., Petersen et al., 2011). More recently, a “slicing”
comparison of different methods is still lacking. The grid-          approach has been introduced in the analysis of reverse earth-
ding method adopted in the current research is not devoid            quakes (Boncio et al., 2018; Nurminen et al., 2020); this
of limitations, which we address in the following. Neverthe-         method makes no assumptions regarding the completeness
less, our primary goal was to assess the performance of the          of the database and does not depend on the grid size.
only scaling relation available for normal faults and to update         Finally, in case of multiple earthquakes in few
such regression with new case histories. For this reason, we         days/months (e.g., 1981 Gulf of Corinth – Jackson et
basically replicated the work of Youngs et al. (2003).               al., 1982; 2016 central Italy – Brozzetti et al., 2019), it
   An initial issue with respect to the scale is the resolution      may not be possible to attribute each surface rupture to its
and completeness of the original maps and data. Detailed             causative event. Repeated rupture of the same fault strand is
rupture maps are available for all of the selected events; nev-      certainly a theme to be investigated, but we believe that this
ertheless, large variability in the quality of data is present, as   kind of uncertainty does not heavily affect our results.
we investigated events that occurred between 1887 and 2016.
An increasing quality of the reported data for more recent
events could be expected: modern technology and integrated           3     Results
approaches encompassing extensive fieldwork and remote
                                                                     We initially computed the conditional probability of dis-
sensing (e.g., interferometric synthetic-aperture radar, opti-
                                                                     tributed faulting for each single event; we then explored the
cal correlation techniques) can capture ground deformation
                                                                     role of magnitude and year of occurrence as factors affecting
of few centimeters, which could have easily gone undetected
                                                                     this value.
in the past (see Livio et al., 2017, for a more detailed discus-
sion). A working hypothesis is that older events are charac-         3.1    The role of magnitude
terized by a higher epistemic uncertainty due to less reliable
technologies or natural censoring of smaller displacements if        To establish the role of magnitude, we grouped the case
measurements are taken long after the earthquake occurrence          histories into magnitude classes (i.e., M < 6.5; 6.5 ≤ M <
(e.g., Stirling et al., 2002). The variability of modern events      7.0; M ≥ 7.0). Figure 3 shows the conditional probability
should indeed be aleatory. We explored this issue by dividing        of faulting as a function of the distance from the princi-
the dataset in two subsets, namely events that occurred in the       pal fault. Positive values correspond to the hanging wall,
21st century (4 events) and those that occurred before this          whereas negative values refer to the footwall. Each symbol
period (17 events).                                                  represents P (x) at a specific distance for a single earthquake.
   A second issue is related to the definition of the princi-        Points on the x axis indicate that no distributed faulting oc-
pal fault, which subsequently affects the computation of dis-        curred in the given distance class; black asterisks show the
tances. The delineation of the principal fault can be straight-      mean values. The probability of rupture drops off quickly
forward in some rupture sections but can be more complex             with distance away from the main fault, with a steeper de-
in other sections (Petersen et al., 2011), where the surface         crease in the footwall than in the hanging wall. The ratio
rupture is discontinuous or structural complexities (multiple        between the probability of faulting in the 0–500 and 1000–
parallel strands, gaps between ruptures) are present. Figure 2       1500 m classes is 7 : 1 for the hanging wall and 14 : 1 for the
shows examples from the Gulf of Corinth (Greece) and Edge-           footwall, pointing to a fundamental difference between the
cumbe (New Zealand) events. In the first case, the principal         near and far fields. Some peaks in the far field are visible as
fault shows a relatively simple trace at the two ends, while a       well (e.g., in Fig. 3a at distance of 7–8 km in the hanging
complex pattern of ruptures is present in the central part. The      wall).
Edgecumbe event ruptured the Edgecumbe Fault and 10 sec-
ondary segments. In the assessment of the principal fault, we

https://doi.org/10.5194/se-12-1197-2021                                                         Solid Earth, 12, 1197–1209, 2021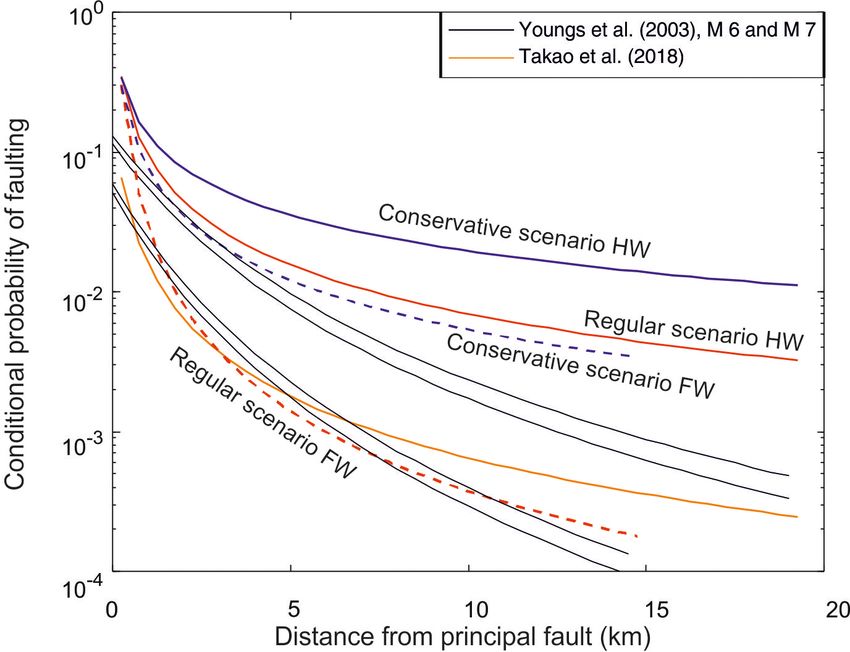
1202 M. F. Ferrario and F. Livio: Conditional probability of distributed surface rupturing
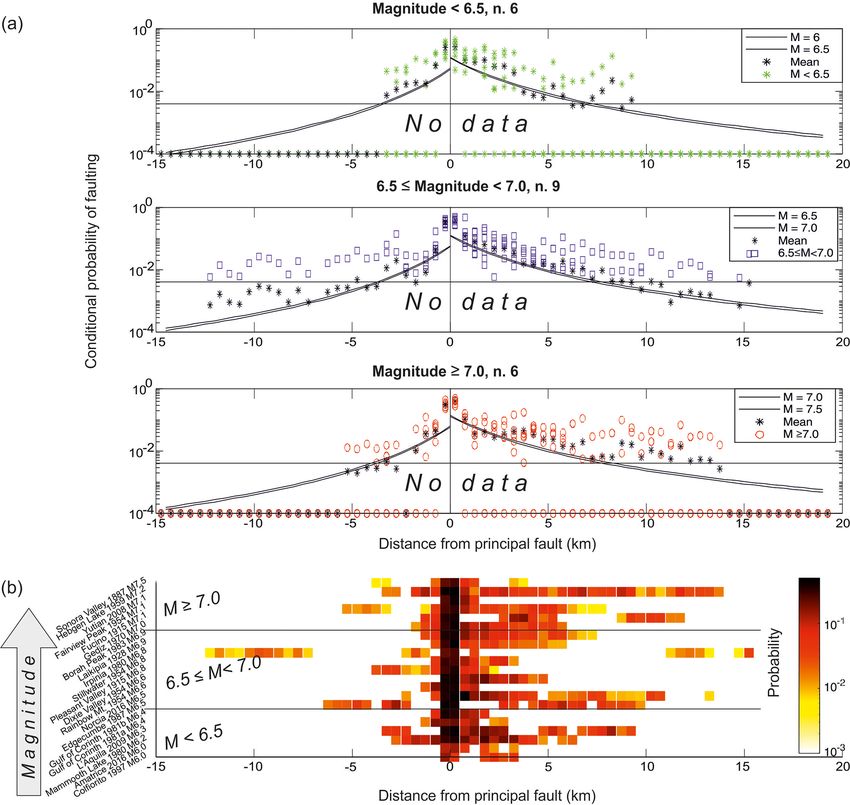
Figure 3. (a) Conditional probability of faulting as a function of distance from the principal fault. Earthquakes are grouped according to
their magnitude (M < 6.5; 6.5 ≤ M < 7.0; M ≥ 7.0); colored symbols represent the values for each earthquake and distance class, and
black asterisks represent the mean values. Black lines are the scaling relations from Youngs et al. (2003; their Eq. 7). The “No data” field
illustrates the region where no empirical observations are present, and probabilities are extrapolated by fitting. (b) Comparison between the
21 earthquakes, ranked according to magnitude; each line represents a single event.
Figure 3b shows the stacked values of conditional prob- The mean values shown in Fig. 3 correspond quite well
ability, with earthquakes ordered according to magnitude; to the scaling relations by Youngs et al. (2003), but we un-
again, it the decrease in P (x) with distance is clear, but no derline that mean values are derived from balancing a di-
clear trend is apparent for increasing magnitude values. Thus, chotomous variable, as distributed rupture can either occur
we do not explicitly include a magnitude term in the scaling or not occur. On the one hand, earthquakes actually produc-
relations in the following analyses; moreover, it is important ing distributed faulting show probabilities much higher than
to highlight the relatively small sample set as well as the fact the mean value; on the other hand, several earthquakes do
that the magnitude determination for the older events (which not produce faulting at all at a certain distance from the prin-
go back to the end of the 19th century) may bear a significant cipal fault. Figure 4 better clarifies this point: we calculated
degree of uncertainty. the percentage of earthquakes generating distributed faulting
for each distance class (“events with no DF” corresponds to
Solid Earth, 12, 1197–1209, 2021 https://doi.org/10.5194/se-12-1197-2021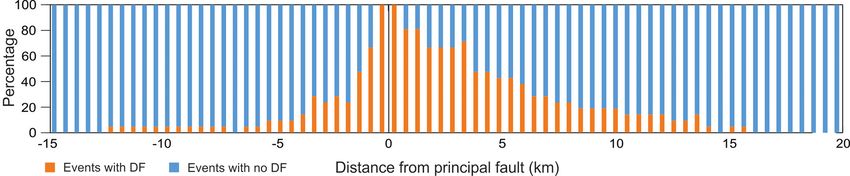
M. F. Ferrario and F. Livio: Conditional probability of distributed surface rupturing                                                    1203

Figure 4. Percentage of earthquakes showing distributed faulting vs. no faulting for each distance class.

Figure 5. (a) Conditional probability of faulting for the 17 events that occurred before the year 2000 and the 4 events that occurred after
2000; colored symbols represent the mean values. Black lines are the scaling relations from Youngs et al. (2003; their Eq. 7). The “No data”
field illustrates the region where no empirical observations are present, and probabilities are extrapolated by fitting. (b) Comparison between
the 21 earthquakes, ranked according to the year of occurrence; each line represents a single event.

the points on the x axis in Fig. 3). Most earthquakes produce             3.2   The role of the dataset age
distributed faulting in the first few kilometers from the prin-
cipal fault, whereas only 30 % generate surface faulting at               To establish the role of the dataset age, we then grouped
7 km in the hanging wall; this value decreases to 3 km in the             the case histories according to the year of occurrence, i.e.,
footwall. Another aspect worth mentioning is that real data               17 earthquakes that occurred before the year 2000 (mean
are constrained down to probabilities as low as ca. 10−2 (see             magnitude: 6.75) and 4 more recent earthquakes (mean mag-
the “No data” field in Fig. 3a); this lower threshold is con-             nitude: 6.47). We tested the hypothesis that older earthquakes
strained by the number of pixels for each distance bin, which             may show a lower probability of distributed faulting due to
in turn depends on the grid size of the analysis and the length           the incompleteness of the dataset or less reliable measures.
of the principal fault. Probabilities lower than this threshold           However, we found no systematic bias between the two sub-
derive from the averaging of the earthquakes producing DFs                sets and no clear pattern arises when stacking the events ac-
with those not producing DFs.                                             cording to the year of occurrence (Fig. 5).

https://doi.org/10.5194/se-12-1197-2021                                                                Solid Earth, 12, 1197–1209, 2021
1204                                    M. F. Ferrario and F. Livio: Conditional probability of distributed surface rupturing

Figure 6. (a) Conditional probability of faulting as a function of distance from the principal fault. Black lines are the scaling relations by
Youngs et al. (2003; their Eq. 7). Colored lines are the equations proposed in the present research (“regular” and “conservative” scenarios).
Panel (b) shows the proposed equations and 95 % confidence bounds (y axis: linear scale). Panel (c) shows the residual plot (observed –
predicted).

3.3    Deriving scaling relations: regular and                           eters are provided in Table 2, and the curves are plotted in
       conservative scenarios                                            Fig. 6. The overall pattern matches the results of Youngs et
                                                                         al. (2003), but we note that observed data are consistently
                                                                         higher than predicted by their equations, in particular in the
In the following, we derive the equations of the conditional
                                                                         hanging wall.
probability of distributed faulting as a function of distance
                                                                            As pointed out earlier, computing the mean value of all
from the principal fault. We calculate the mean probability
                                                                         of the earthquakes for each distance bin results in the av-
values for each class distance and fit the data with Eq. (2).
                                                                         erage of two end-members: events without distributed fault-
When trying to fit all of the data, we found a trade-off be-
                                                                         ing at a given distance and events that generated distributed
tween the near and far field: including the points in the vicin-
                                                                         faulting at that distance. The conditional probability of fault-
ity of the principal fault in the regression gives birth to higher
                                                                         ing is zero for the former category, whereas it is variable,
residuals in the far field. This drawback has already been
                                                                         within a certain range, for the latter; thus, when events that
pointed out by Petersen et al. (2011), who excluded the first
                                                                         generate distributed faulting at that distance occur, the prob-
two off-fault rupture probability measurements. We tested
                                                                         ability of distributed faulting is much higher than the mean
several functional forms, and we selected Eq. (2) because it
                                                                         value. For this reason, we introduced a conservative scenario,
showed the best performance in the different scenarios. The
                                                                         computing the conditional probability only for those data that
obtained regression coefficients and goodness-of-fit param-

Solid Earth, 12, 1197–1209, 2021                                                              https://doi.org/10.5194/se-12-1197-2021
M. F. Ferrario and F. Livio: Conditional probability of distributed surface rupturing 1205
recorded distributed faulting at a given distance. The points
Table 2. Data-fitting and goodness-of-fit parameters for the traditional and conservative scenarios (see Eq. 2); regressed parameters, with 95 % confidence bounds, are indicated. HW
are shown in Fig. 6 along with the curves obtained in the
RMSE
0.006291
0.001922
0.01282
0.01216
same way as for the regular scenario. The relevance of this
conservative scenario lies in the fact that for some projects it
may be necessary to consider the worst-case scenario or a re-
SSE
0.001464
0.005919
0.00399
turn period longer than the norm (Wells and Kulkarni, 2014;
9.969 × 10⁻⁵
Cline et al., 2018).
Between 1 and 5 km from the principal fault, the con-
servative scenario predicts a probability of faulting that is
ca. 3 times the regular scenario, whereas the conservative
scenario is 1 order of magnitude higher than the regular one
Adj. R 2
0.9887
0.9988
0.9534
0.9515
at about 10 km from the principal fault. The residual plots
(observed minus predicted values; Fig. 6c) show that ob-
served values better match with the predicted values for the
0.9890
0.9989
0.9559
0.9548
denotes hanging wall, FW denotes footwall, SSE denotes the sum of squares due to error, and RMSE denotes the root-mean-square error.
regular scenario, with a higher discrepancy at 1–3 km in the
R2
hanging wall; beyond ca. 10 km in the hanging wall, resid-
uals are always negative (i.e., the equation overpredicts the
1.008 × 10⁻⁵ (−0.08461, 0.08463)
1.009 × 10⁻⁵ (−0.1406, 0.1406)
1.006 × 10⁻⁵ (−0.2128, 0.2128)
c
1 × 10⁻⁵
values). The conservative scenario shows a higher dispersion
of the values, resulting in overall higher residuals and lower
goodness-of-fit parameters (Table 2). In the database used to
derive the equations, distributed faulting was observed up to
15 and 12 km from the principal fault in the hanging wall and
footwall, respectively. Due to the limited numbers of obser-
vation points beyond ca. 10 km, extrapolation beyond such
limits should be considered carefully.
4 Discussion
−1.175 (−1.228, −1.122)
−1.903 (−2.255, −1.55)
−0.8802 (−1.05, −0.7099)
−1.181 (−1.62, −0.7428)
b
We compute the conditional probability of distributed fault-
ing for a dataset of 21 normal-faulting earthquakes and pro-
vide updated empirical relations assessing the decrease in
faulting with distance. Our data show a very steep decrease
in the probability of faulting at distances higher than 1 km
from the principal fault, pointing to a fundamental difference
between near and far fields. The pattern of fault rupture in the
near field has been recently explored by several authors using
observation of actual faulting or numerical or analytical mod-
−2.254 (−2.318, −2.189)
−3.459 (−3.638, −3.28)
−1.888 (−2.132, −1.643)
−2.505 (−2.934, −2.076)
a
els (e.g., Fletcher and Spelz, 2009; Teran et al., 2015; Gold
et al., 2015; Loukidis et al., 2009; Treiman, 2010). Several
factors have been pointed out as conditioning the surface ex-
pression of faulting, including type of fault movement, fault
dip, amount of displacement, geometrical complexity of fault
traces, rock type, thickness, and nature of the materials above
bedrock (Bray et al., 1994; Avar and Hudyma, 2019). The
integration of modern field and remote technologies has al-
lowed for the capture of the finer details of surface rupture; a
HW, conservative scenario
FW, conservative scenario
geologically sound interpretation of such data is pivotal to the
understanding of surface rupture, which, in turn, is essential
HW, regular scenario
FW, regular scenario
for engineering design and eventually mitigation measures.
The regressions presented in the current work derive from
a global dataset; we stress that site-specific data should be
properly considered if they are available. For instance, differ-
Model
ent behavior has been identified between Japan and US rup-
tures (Inoue et al., 2018; Petersen and Chen, 2018; Suzuki
https://doi.org/10.5194/se-12-1197-2021 Solid Earth, 12, 1197–1209, 20211206 M. F. Ferrario and F. Livio: Conditional probability of distributed surface rupturing and Annaka, 2018); if such variations are systematic, they formulation by Youngs et al. (2003). The output of the anal- can, to some extent, be predictable and thus help in assessing ysis is strongly influenced by the bins where no distributed the hazard. faulting was observed (i.e., points on the x axis in Figs. 3 From a methodological point of view, the biggest caveat and 5). In order to account for the full spectrum of poten- in our analysis is arguably the 500 m grid size, which is quite tial occurrences, we introduce a conservative scenario, where coarse and possibly smooths differences between events. We conditional probabilities of faulting are computed without adopted this size because we wanted to verify the perfor- the bins with no distributed faulting. This scenario results in mance of the regressions by Youngs et al. (2003). The as- higher expected probabilities, and the residual plot (Fig. 6c) sumption that any distributed faulting in the 500 m × 500 m shows that observed values are lower than expected between cell is the same as the occurrence of rupture at the point of 3 and 7 km in the hanging wall, whereas they are higher than interest leads to an overestimation of the rate of occurrence; expected at distances of 7–12 km. A possible explanation for the large pixel size was chosen by Youngs et al. (2003) as a this behavior may be the structural architecture of normal compromise between this effect and the possible incomplete faults, which commonly show a horst and graben setting: the mapping. 3–7 km sector may correspond to the block that undergoes Beside the grid size, the definition of principal faulting it- lowering and/or tilting, and the 7–12 km sector may corre- self can be tricky. Several earthquakes may occur in a short spond to the location of the antithetic structure. This hypoth- time interval, making it difficult to identify the causative esis can be tested on well-documented case histories, where event for each ground rupture. Discontinuous, subparallel detailed information is available on the structural architecture strands with similar displacement or a complex pattern of of the shallow subsoil. As a first approximation, this pattern faulting are a challenge with respect to defining principal is quite evident for the 1980 Irpinia and 2016 Norcia earth- vs. distributed faulting. The updated empirical regressions quakes, whereas it is more subdued for the 1954 Fairview broadly confirm the results obtained by Youngs et al. (2003), Peak, 1959 Hebgen Lake, 1970 Gediz, and 1987 Edgecumbe highlighting the soundness of their approach and its wide ap- events. The position at the surface of the antithetic structure plicability in different regions worldwide. The addition of is driven by factors such as the change in dip of the principal new case histories only allows for an incremental improve- fault at depth (e.g., Caskey et al., 1996); this points to the pos- ment in the equations. The conditional probability of fault- sibility of introducing deterministic constraints in the estima- ing does not show dependency on magnitude or time of oc- tion of the expected distributed faulting. Thus, we point out currence, thereby allowing for the combination of all of the that the use of elastic dislocation models of deformation (e.g., events in a single dataset to obtain empirical regressions. Okada, 1985) and, in turn, of induced Coulomb stress trans- The lack of dependency on magnitude can be explained by fer on receiving preexisting faults (e.g., Toda et al., 2011) the fact that we analyze a global dataset, whereas Youngs et may be useful for more accurately predicting the probability al. (2003) focused their work on earthquakes that occurred in of DF (e.g., Gürpinar et al., 2017; Livio et al., 2017), espe- the western US. Moreover, it has been shown that the choice cially where the current models show higher residuals (e.g., of the grid size has a much larger effect than the moment at ca. 7–12 km in the hanging wall). magnitude of the events (Suzuki and Annaka, 2018; Takao et We claim that the regular and conservative scenarios can al., 2018). be seen as alternative branches in a logic tree; the relative Concerning the year of occurrence, in a previous analysis weights of the two branches can be tuned according to the de- of Italian Apennines events, we claim that older events and gree of conservatively of the project and to professional judg- maps may be affected by higher epistemic uncertainties (Fer- ment. We argue that the conservative scenario can be particu- rario and Livio, 2018). In the current study, we again tested larly important in the analysis of normal faults, for two main this hypothesis and found no systematic difference between reasons: (i) normal faults have a higher probability of gen- earthquakes that occurred several decades apart; thus, we ar- erating surface faulting along the principal fault when com- gue that the issue of data completeness is not simply a mat- pared to strike-slip and reverse faults (Moss and Ross, 2011; ter of the time of occurrence but is also influenced by other Suzuki and Annaka, 2018; Takao et al., 2018); (ii) the condi- factors like the territorial and climatic setting (e.g., arid vs. tional probability of distributed faulting for normal events is humid climate) and the potential for the preservation of sur- much higher than for strike-slip and reverse earthquakes. The face ruptures. Another possible explanation for the lack of latter point is better illustrated in Fig. 7, where we compare dependency on the year of occurrence is the limited number our regressions for normal faulting with the original formu- of modern case histories (only four events post-2000). The lation of Youngs et al. (2003) and the one proposed by Takao acquisition of future datasets is critical for the assessment of et al. (2018) for strike-slip and reverse Japanese events, de- eventual systematic biases and will allow different grid sizes veloped using the same grid size of 500 m. to be tested. The most striking observation when analyzing the updated regressions is the systematic higher probabilities of faulting, in particular in the hanging wall, with respect to the original Solid Earth, 12, 1197–1209, 2021 https://doi.org/10.5194/se-12-1197-2021
M. F. Ferrario and F. Livio: Conditional probability of distributed surface rupturing                                                     1207

                                                                        ture characteristics. Finally, a critical comparison of different
                                                                        methods and procedures should be pursued and the compa-
                                                                        rability with the original works (e.g., Youngs et al., 2003)
                                                                        should be guaranteed.

                                                                        Data availability. The shapefiles with rupture sections and the
                                                                        trace of the principal fault as well as a table with the conditional
                                                                        probability of faulting as a function of distance are accessible at
                                                                        https://doi.org/10.5281/zenodo.4604635 (Ferrario and Livio, 2021).

                                                                        Author contributions. MFF designed the workflow, analyzed the
                                                                        data, and drafted the paper. FL analyzed the data and reviewed the
                                                                        paper.

Figure 7. Comparison between the conditional probability of fault-      Competing interests. The authors declare that they have no conflict
ing for normal events obtained in this study and those from Youngs      of interest.
et al. (2003; the curves for M6 and 7 are shown as a reference)
and for strike-slip and reverse events in Japan (Takao et al., 2018);
full lines represent the hanging wall, and dashed lines represent the
                                                                        Special issue statement. This article is part of the special issue
footwall.
                                                                        “Tools, data and models for 3-D seismotectonics: Italy as a key nat-
                                                                        ural laboratory”. It is a result of the workshop on “Tools, data and
                                                                        models for 3D seismotectonics: the Italian laboratory over time”,
5   Conclusions                                                         Perugia, Italy, 9–10 July 2019.

We develop an updated regression for the conditional proba-
bility of distributed faulting as a function of distance. We pro-       Acknowledgements. We wish to thank the topical Editor
pose two alternative scenarios to take the wide range of rup-           Rita de Nardis and two anonymous reviewers, whose com-
                                                                        ments improved the quality of the paper.
tures into account: the regular scenario computes the average
value of all of the analyzed events, whereas the second sce-
nario provides a more conservative estimate. We believe that
                                                                        Review statement. This paper was edited by Rita De Nardis and
a periodic update of the database allows for more robust re-
                                                                        reviewed by two anonymous referees.
lations to be derived: for this reason, measures of distributed
faulting and data implementation in a common framework
(e.g., Baize et al., 2019) should be a standard practice follow-
ing every ground-rupturing event. In order to support com-
mon data mining, the shapefiles of ruptures for the new case            References
histories and the table containing conditional probabilities of
                                                                        Ambraseys, N. N.: Earthquake hazard in the Kenya Rift: the
faulting derived in the present research are made available in            Subukia earthquake 1928, Geophys. J. Int., 105, 253–269, 1991.
an open repository (see the “Data Availability” section of this         Ambraseys, N. N. and Tchalenko, J. S.: Seismotectonic aspects of
paper for further details).                                               the Gediz, Turkey, Earthquake of March 1970, Geophys. J. R.
   Here, we focus on the conditional probability of fault-                Astr. Soc., 30, 229–252, 1972.
ing and do not consider the amount of faulting (i.e., we                Amoroso, S., Bernardini, F., Blumetti, A. M., Civico, R., Doglioni,
treat faulting as a binomial yes/no variable). Future research            C., Galadini, F., Galli, P., Graziani, L., Guerrieri, L., Messina, P.,
should also consider the amount of displacement in order to               Michetti, A. M., Potenza, F., Pucci, S., Roberts, G., Serva, L.,
fully implement our results in a PFDHA perspective. PFDHA                 Smedile, A., Smeraglia, L., Tertulliani, A., Tironi, G., Villani, F.,
is a young science relying on empirical data; thus, it still              and Vittori, E.: Quaternary geology and Paleoseismology in the
                                                                          Fucino and L’Aquila basins, in: 6th INQUA, 19–24 April 2015,
holds a significant degree of epistemic uncertainty that can
                                                                          Pescina (AQ) – Fucino basin, Periodico semestrale del Servizio
be reduced by enlarging the dataset of case histories.
                                                                          Geologico d’Italia – ISPRA e della Società Geologica Italiana
   The assessment of uncertainties in PFDHA analyses is                   Geol.F.Trips, Ispra, 88 pp., https://doi.org/10.3301/GFT.2016.02,
not yet fully developed and methodological choices have a                 2016.
substantial effect on the total hazard (Moss and Ross, 2011;            ANSI/ANS-2.30: Criteria for assessing tectonic surface fault rup-
Treiman, 2010; Wells and Kulkarni, 2014; Cline et al., 2018);             ture and deformation at nuclear facilities, American Nuclear So-
logic trees can be used to consider the full distribution of rup-         ciety, La Grange Park, IL, 2015.

https://doi.org/10.5194/se-12-1197-2021                                                               Solid Earth, 12, 1197–1209, 2021
1208 M. F. Ferrario and F. Livio: Conditional probability of distributed surface rupturing
Avar, B. B. and Hudyma, N. W.: Earthquake Surface Rupture: A Ferrario, M. F. and Livio, F.: Characterizing the distributed fault-
Brief Survey on Interdisciplinary Research and Practice from Ge- ing during the 30 October 2016, Central Italy earthquake: A ref-
ology to Geotechnical Engineering, Rock Mech. Rock Eng., 52, erence for fault displacement hazard assessment, Tectonics, 37,
5259–5281, https://doi.org/10.1007/s00603-019-02006-0, 2019. 1256–1273, https://doi.org/10.1029/2017TC004935, 2018.
Baize, S., Nurminen, F., Sarmiento, A., Dawson, T., Takao, Ferrario, M. F. and Livio, F.: Ground ruptures and primary faults
M., Scotti, O., Azuma, T., Boncio, P., Champenois, J., Cinti, following normal faulting earthquakes (Version 1.0) [Data set],
F. R., Civico, R., Costa, C., Guerrieri, L., Marti, E., Mc- Zenodo, https://doi.org/10.5281/zenodo.4604635, 2021.
Calpin, J., Okumura, K., and Villamor, P.: A worldwide and Field, E. H., Biasi, G. P., Bird, P., Dawson, T. E., Felzer, K. R., Jack-
unified database of surface ruptures (SURE) for fault dis- son, D. D., Johnson, K. M., Jordan, T. H., Madden, C., Michael,
placement hazard analyses, Seismol. Res. Lett., 91, 499–520, A. J., Milner, K. R., Page, M. T., Parsons, T., Powers, P. M.,
https://doi.org/10.1785/0220190144, 2019. Shaw, B. E., Thatcher, W. R., Weldon, R., J., and Zeng, Y.: Long-
Beanland, S., Berryman, K. R., and Blick, G. H.: Geological inves- term time-dependent probabilities for the third Uniform Califor-
tigations of the 1987 Edgecumbe earthquake, New Zealand, N. nia Earthquake Rupture Forecast (UCERF3), Bull. Seismol. Soc.
Z. J. Geol. Geophys., 32, 73–91, 1989. Am., 105, 511–543, 2015.
Beanland, S., Blick, G. H., and Marby, D. J.: Normal Faulting in Fletcher, J. M. and Spelz, R. M.: Patterns of Quaternary deformation
a Back Arc Basin: geological and geodetic characteristics of the and rupture propagation associated with an active low-angle nor-
1987 Edgecumbe Earthquake, N. Z. J. Geophys. Res., 95, 4693– mal fault, Laguna Salada, Mexico: evidence of a rolling hinge?,
4707, 1990. Geospher, 5, 385–407, https://doi.org/10.1130/GES00206.1,
Blumetti, A. M., Esposito, E., Ferreli, L., Michetti, A. M., Porfido, 2009.
S., Serva, L., and Vittori, E.: New data and reinterpretation of the Gold, R. D., Reitman, N. G., Briggs, R. W., Barnhart, W. D., Hayes,
November 23, 1980, M6.9 Irpinia-Lucania earthquake (South- G. P., and Wilson, E.: On- and off-fault deformation associated
ern Apennines) coseismic surface effects, Large scale vertical with the September 2013 Mw 7.7 Balochistan earthquake: Im-
movements and related gravitational processes, Studi Geologici plications for geologic slip rate measurements, Tectonophysics,
Camerti Special Issue, 2002, 19–27, 2002. 660, 65–78, 2015.
Boncio, P., Liberi, F., Caldarella, M., and Nurminen, F. C.: Width Gürpinar, A., Serva, L., Livio, F., and Rizzo, P. C.: Earthquake-
of surface rupture zone for thrust earthquakes: implications for induced crustal deformation and consequences for fault displace-
earthquake fault zoning, Nat. Hazards Earth Syst. Sci., 18, 241– ment hazard analysis of nuclear power plants, Nucl. Eng. Design,
256, https://doi.org/10.5194/nhess-18-241-2018, 2018. 311, 69–85, https://doi.org/10.1016/j.nucengdes.2016.11.007,
Bray, J. D., Seed, R. B., and Cluff, L. S.: Earthquake fault rupture 2017.
propagation through soil, J. Geotech. Eng., 120, 543–561, 1994. Inoue, N., Kitada, N., Tonagi, M., and Irikura, K.: Study on the
Brozzetti, F., Boncio, P., Cirillo, D., Ferrarini, F., de Nardis, R., evaluation method for fault displacement: probabilistic approach
Testa, A., Liberi, F., and Lavecchia, G.: High-resolution field based on Japanese earthquake rupture data, IAEA-TECDOC-
mapping and analysis of the August–October 2016 coseismic CD-1833, IAEA, Vienna, ISBN 978-92-0-158917-0, 2018.
surface faulting (central Italy earthquakes): Slip distribution, pa- Inoue, N., Kitada, N., Shibuya, N., Omata, M., Takahama, T.,
rameterization, and comparison with global earthquakes, Tecton- Tonagi, M., and Irikura, K.: Probabilistic Evaluation of Off-Fault
ics, 38, 417–439, https://doi.org/10.1029/2018TC005305, 2019. Displacements of the 2016 Kumamoto Earthquake, Pure Appl.
Caskey, S. J., Wesnousky, S. G., Zhang, P.„ and Slemmons, D. B.: Geophys., 177, 2007–2019, https://doi.org/10.1007/s00024-019-
Surface faulting of the 1954 Fairview Peak (MS 7.2) and Dixie 02345-7, 2019.
Valley (MS 6.8) earthquakes, central Nevada, Bull. Seismol. Soc. Jackson, J. A., Gagnepain, J., Houseman, G., King, G. C. P., Pa-
Am., 86, 761–787, 1996. padimitriou, P., Soufleris, C., and Virieux, J.: Seismicity, nor-
Cello, G., Deiana, G., Mangano, P., Mazzoli, S., Tondi, E., Fer- mal faulting, and the geomorphological development of the Gulf
reli, L., Maschio, L., Michetti, A. M., Serva, L., and Vittori, E.: of Corinth (Greece): the Corinth earthquakes of February and
Evidence for surface faulting during the September 26, 1997, March 1981, Earth Planet. Sc. Lett., 57, 377–397, 1982.
Colfiorito (Central Italy) earthquakes. J. Earthq. Eng., 2, 303– Livio, F., Michetti, A. M., Vittori, E., Gregory, L., Wedmore,
324, https://doi.org/10.1080/13632469809350324, 1998. L., Piccardi, L., Tondi, E., Roberts, G., and the Central Italy
Civico, R., Pucci, S., Villani, F., Pizzimenti, L., De Mar- earthquake working group: Surface faulting during the Au-
tini, P. M., Nappi, R., and the Open EMERGEO Work- gust 24, 2016, central Italy earthquake (Mw 6.0): Preliminary re-
ing Group: Surface ruptures following the 30 October 2016 sults, Ann. Geophys., 59, 1–8, https://doi.org/10.4401/ag-7197,
Mw 6.5 Norcia earthquake, central Italy, J. Maps, 14, 151–160, 2016.
https://doi.org/10.1080/17445647.2018.1441756, 2018. Livio, F., Serva, L., and Gürpinar, A.: Locating distributed faulting:
Cline, K. M., Cline, M. L., Blanco, J., Quittmeyer, R., Kimball, Contributions from InSAR imaging to Probabilistic Fault Dis-
J., Rizzo, P. C., and Bavec, M.: Probabilistic Fault Displace- placement Hazard Analysis (PFDHA), Quatern. Int., 451, 223–
ment Hazard Analysis for Regulatory Decision-Making: A Case 233, 2017.
Study Using State-of-the-Practice Fault Characterization Meth- Loukidis, D., Bouckovalas, G. D., and Papadimitriou, A. G.: Anal-
ods, IAEA-TECDOC-CD-1833, IAEA, Vienna, ISBN 978-92-0- ysis of fault rupture propagation through uniform soil cover, Soil
158917-0, 2018. Dynam. Earthq. Eng., 29, 1389–1404, 2009.
Cornell, C. A.: Engineering seismic risk analysis, Bull. Seismol. Milliner, C. W. D., Dolan, J. F., Hollingsworth, J., Leprince,
Soc. Am., 22, 1583–1606, 1968. S., Ayoub, F., and Sammis, C. G.: Quantifying near-field
and off-fault deformation patterns of the 1992 Mw 7.3 Lan-
Solid Earth, 12, 1197–1209, 2021 https://doi.org/10.5194/se-12-1197-2021M. F. Ferrario and F. Livio: Conditional probability of distributed surface rupturing 1209 ders earthquake, Geochem. Geophy. Geosy., 16, 1577–1598, Teran, O. J., Fletcher, J. M., Oskin, M. E., Rockwell, T. K., Hud- https://doi.org/10.1002/2014GC005693, 2015. nut, K. W., Spelz, R. M., Akciz, S. O., Hernandez-Flores, A. P., Moss, R. E. S. and Ross, Z. E.: Probabilistic fault displacement and Morelan, A. E.: Geologic and structural controls on rupture hazard analysis for reverse faults, Bull. Seismol. Soc. Am., 101, zone fabric: A field-based study of the 2010 Mw 7.2 El Mayor– 1542–1553, https://doi.org/10.1785/0120100248, 2011. Cucapah earthquake surface rupture, Geosphere, 11, 899–920, Nurminen, F., Boncio, P., Visini, F., Pace, B., Valentini, https://doi.org/10.1130/GES01078.1, 2015. A., Baize, S., and Scotti O.: Probability of Occurrence Toda, S., Stein, R. S., Sevilgen, V., and Lin, J.: Coulomb 3.3 and Displacement Regression of Distributed Surface Ruptur- Graphic-rich deformation and stress-change software for earth- ing for Reverse Earthquakes, Front. Earth Sci., 8, 581605, quake, tectonic, and volcano research and teaching – user guide, https://doi.org/10.3389/feart.2020.581605, 2020. US Geological Survey open-file report 1060, US Geological Sur- Okada, Y.: Surface deformation due to shear and tensile faults in a vey, Reston, Virginia, 1–63, 2011. half-space, Bull. Seismol. Soc. Am., 75, 1135–1154, 1985. Treiman, J. A.: Fault Rupture and Surface Deformation: Defining Petersen, M. D. and Chen, R: Empirical fault displacement haz- the Hazard, Environ. Eng. Geosci., 16, 19–30, 2010. ard methods applied in the United States, IAEA-TECDOC-CD- Wells, D. L. and Coppersmith, K. J.: New empirical relationships 1833, IAEA, Vienna, ISBN 978-92-0-158917-0, 2018. among magnitude, rupture length, rupture width, rupture area, Petersen, M. D., Dawson, T. E., Chen, R., Cao, T., Wills, C. J., and surface displacement, Bull. Seismol. Soc. Am., 84, 974– Schwartz, D. P., and Frankel, A. D.: Fault displacement hazard 1002, 1994. for strike-slip faults, Bull. Seismol. Soc. Am., 101, 805–825, Wells, D. L. and Kulkarni, V. S.: Probabilistic Fault Displacement https://doi.org/10.1785/0120100035, 2011. Hazard Analysis – sensitivity analyses and recommended prac- Pezzopane, S. K. and Dawson, T. E.: Fault displacement haz- tices for developing design fault displacements, in: Proceed- ard: a summary of issues and information, in: Seismotectonic ings of the 10th National Conference in Earthquake Engineer- Framework and Characterization of Faulting at Yucca Mountain, ing, Earthquake Engineering Research Institute, Anchorage, AK, Nevada, chap. 9, US Geological Survey Administrative Report 2014. prepared for the US Department of Energy, US Geological Sur- Xu, X., Tan, X., Yu, G., Wu, G., Fang, W., Chen, J., Song, H., vey, Palo Alto, California, p. 160, 1996. and Shen, J.: Normal- and oblique-slip of the 2008 Yutian earth- Stirling, M., Rhoades, D., and Berryman, K.: Comparison of Earth- quake: Evidence for eastward block motion, northern Tibetan quake Scaling Relations Derived from Data of the Instrumental Plateau, Tectonophysics, 584, 152–165, 2013. and Preinstrumental Era, Bull. Seismol. Soc. Am., 92, 812–830, Youngs, R. R., Arabasz, W. J., Anderson, R. E., Ramelli, A. R., 2002. Ake, J. P., Slemmons, D. B., McCalpin, J., Doser, D. I., Fridrich, Suzuki, Y. and Annaka, T.: Probabilistic hazard analysis for C. J., Swan, F. H., Rogers, A. M., Yount, J. C., Anderson, L. secondary fault, IAEA-TECDOC-CD-1833, IAEA, Vienna, W., Smith, K. D., Bruhn, R. L., Knuepfer, P. L. K., Smith, R. ISBN 978-92-0-158917-0, 2018. B., dePolo, C. M., O’Leary, D. W., Coppersmith, K. J., Pez- Takao, M., Annaka, T., and Kurita, T.: Application of probabilis- zopane, S. K., Schwartz, D. P., Whitney, J. W., Olig, S. S., tic fault displacement hazard analysis in Japan, J. Jpn. Assoc. and Toro, G. R.: A methodology for probabilistic fault displace- Earthq. Eng., 13, 17–36, 2013. ment hazard analysis (PFDHA), Earthq. Spectra, 19, 191–219, Takao, M., Annaka, T., and Kurita, T.: Establishment of evalua- https://doi.org/10.1193/1.1542891, 2003. tion formulae for Probabilistic Fault Displacement Hazard anal- ysis (PFDHA) in Japan, IAEA-TECDOC-CD-1833, IAEA, Vi- enna, ISBN 978-92-0-158917-0, 2018. https://doi.org/10.5194/se-12-1197-2021 Solid Earth, 12, 1197–1209, 2021
You can also read