HPO-B: A Large-Scale Reproducible Benchmark for Black-Box HPO based on OpenML
←
→
Page content transcription
If your browser does not render page correctly, please read the page content below
HPO-B: A Large-Scale Reproducible Benchmark
                                                    for Black-Box HPO based on OpenML

                                                       Sebastian Pineda Arango∗                           Hadi S. Jomaa∗
                                                         University of Freiburg                       University of Hildesheim
                                                     pineda@cs.uni-freiburg.de                  hsjomaa@ismll.uni-hildesheim.de
arXiv:2106.06257v2 [cs.LG] 11 Oct 2021

                                                            Martin Wistuba†                             Josif Grabocka
                                                            Amazon Research                           University of Freiburg
                                                         marwistu@amazon.com                     grabocka@cs.uni-freiburg.de

                                                                                           Abstract

                                                     Hyperparameter optimization (HPO) is a core problem for the machine learning
                                                     community and remains largely unsolved due to the significant computational re-
                                                     sources required to evaluate hyperparameter configurations. As a result, a series of
                                                     recent related works have focused on the direction of transfer learning for quickly
                                                     fine-tuning hyperparameters on a dataset. Unfortunately, the community does
                                                     not have a common large-scale benchmark for comparing HPO algorithms. In-
                                                     stead, the de facto practice consists of empirical protocols on arbitrary small-scale
                                                     meta-datasets that vary inconsistently across publications, making reproducibility
                                                     a challenge. To resolve this major bottleneck and enable a fair and fast comparison
                                                     of black-box HPO methods on a level playing field, we propose HPO-B, a new
                                                     large-scale benchmark in the form of a collection of meta-datasets. Our benchmark
                                                     is assembled and preprocessed from the OpenML repository and consists of 176
                                                     search spaces (algorithms) evaluated sparsely on 196 datasets with a total of 6.4
                                                     million hyperparameter evaluations. For ensuring reproducibility on our bench-
                                                     mark, we detail explicit experimental protocols, splits, and evaluation measures for
                                                     comparing methods for both non-transfer, as well as, transfer learning HPO.

                                         1       Introduction

                                         Hyperparameter Optimization (HPO) is arguably the major open challenge for the machine learning
                                         community due to the expensive computational resources demanded to evaluate configurations.
                                         As a result, HPO and its broader umbrella research area, AutoML, have drawn particular interest
                                         over the past decade [2, 18, 30, 31]. Black-box HPO is a specific sub-problem that focuses on
                                         the case where the function to be optimized (e.g. the generalization performance of an algorithm)
                                         is unknown, non-differentiable with respect to the hyperparameters, and intermediate evaluation
                                         proxies are not computable (opposed to gray-box HPO [23] which accesses intermediate performance
                                         measurements).
                                         Although black-box HPO is a core problem, existing solutions based on parametric surrogate models
                                         for estimating the performance of a configuration overfit the limited number of evaluated configu-
                                         rations. As a result, the AutoML community has recently invested efforts in resolving the sample-
                                         inefficiency of parametric surrogates via meta- and transfer-learning [13, 19, 27, 28, 33, 35, 38].
                                             ∗
                                                 Equal contribution
                                             †
                                                 Work done prior joining Amazon Research

                                         35th Conference on Neural Information Processing Systems (NeurIPS 2021) Track on Datasets and Benchmarks.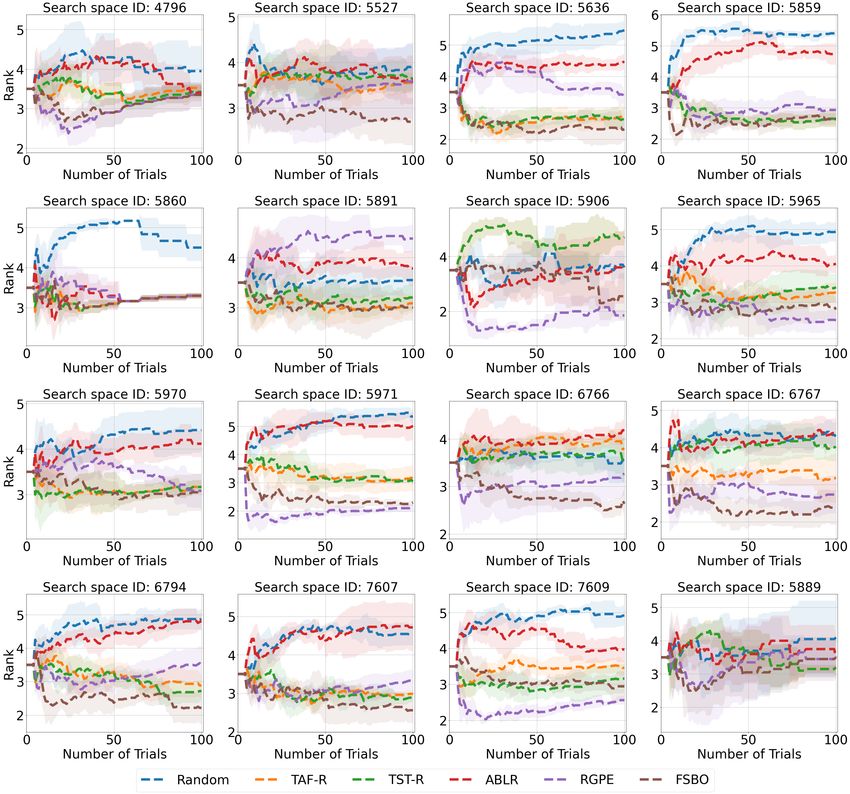
Unfortunately, despite the promising potential of transfer-learning in black-box HPO, the impact of
such algorithms is hindered by their poor experimental reproducibility. Our personal prior research
experience, as well as the feedback from the community, highlight that reproducing and generalizing
the results of transfer-learning HPO methods is challenging. In essence, the problem arises when the
results of a well-performing method in the experimental protocol of a publication either can not be
replicated; or when the method underperforms in a slightly different empirical protocol. We believe
that a way of resolving this negative impasse is to propose a new public large-scale benchmark for
comparing HPO methods, where the exact training/validation/test splits of the meta-datasets, the
exact evaluation protocol, and the performance measures are well-specified. The strategy of adopting
benchmarks is a trend in related areas, such as in computer vision [8], or NAS [9, 40].
In this perspective, we present HPO-B3 , the largest public benchmark of meta-datasets for black-box
HPO containing 6.4M hyperparameter evaluations across 176 search spaces (algorithms) and on 196
datasets in total. The collection is derived from the raw data of OpenML [32], but underwent an
extensive process of cleaning, preprocessing and organization (Section 5). Additionally, we offer
off-the-shelf ready variants of the benchmark that are adapted for both non-transfer, as well as transfer
HPO experiments, together with the respective evaluation protocols (Section 6). This large, diverse,
yet plug-and-play benchmark can significantly boost future research in black-box HPO.

2        Terminology
To help the reader navigate through our paper, we present the compact thesaurus of Table 1 for
defining the vernacular of the HPO community.

    Term               Definition
    Configuration      Specific settings/values of hyperparameters
    Search space       The domain of a configuration: scale and range of each hyperparameter’s values
    Response           The performance of an algorithm given a configuration and dataset
    Surrogate          A (typically parametric) function that approximates the response
    Seed               Set of initial configurations used to fit the initial surrogate model
    Black-box          The response is an unknown and non-differentiable function of a configuration
    Task               An HPO problem given a search space and a dataset
    Evaluation         The measured response of a configuration on a dataset
    Trial              An evaluation on a task during the HPO procedure
    Meta-dataset       Collection of recorded evaluations from different tasks on a search space
    Meta-instance      An evaluation in the meta-dataset for one of the tasks
    Meta-feature       Descriptive attributes of a dataset
    Source tasks       In a meta- or transfer-learning setup refers to the known tasks we train from
    Target tasks       In a meta- or transfer-learning setup refers to the new tasks we test on
    Benchmark          New definition: Collection of meta-datasets from different search spaces
           Table 1:   A thesaurus of the common HPO terminology used throughout this paper

3        Related Work
Non-transfer black-box HPO: The mainstream paradigm in HPO relies on surrogates to estimate the
performance of hyperparameter configurations. For example, [2] were the first to propose Gaussian
Processes (GP) as surrogates. The same authors also propose a Tree Parzen Estimator (TPE) for
computing the non-parametric densities of the hyperparameters given the observed performances.
Both approaches achieve a considerable lift over random [3] and manual search. To address the cubic
run-time complexity of GPs concerning the number of evaluated configurations, DNGO [30] trains
neural networks for generating adaptive basis functions of hyperparameters, in combination with a
Bayesian linear regressor that models uncertainty. Alternatively, SMAC [18] represents the surrogate
as a random forest, and BOHAMIANN [31] employs Bayesian Neural Networks instead of plain
neural networks to estimate the uncertainty of a configuration’s performance. For an extensive study
     3
         The benchmark is publicly available at https://github.com/releaunifreiburg/HPO-B

                                                    2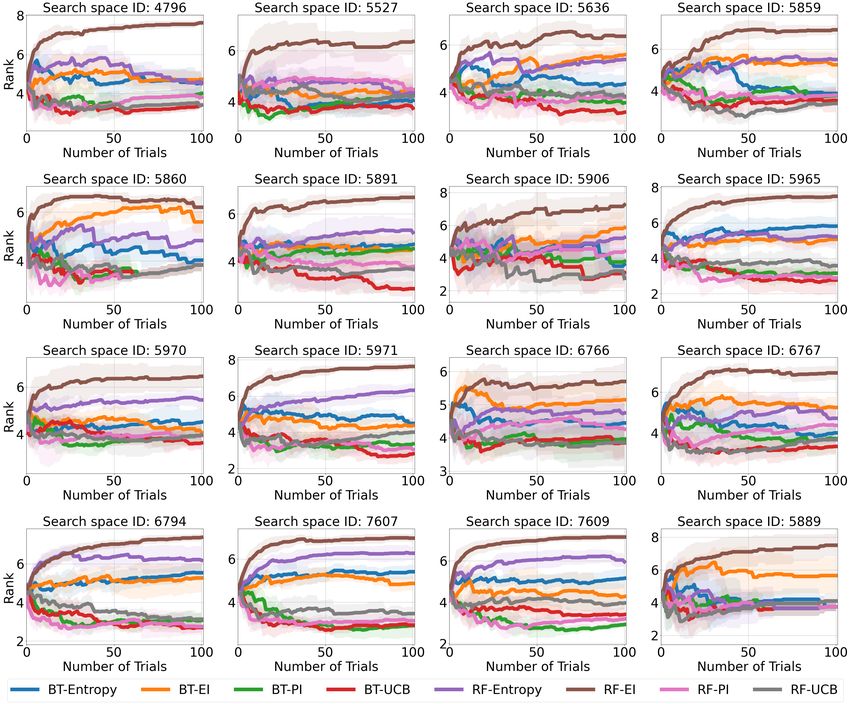
on non-transfer Bayesian Optimization techniques for HPO, we refer the readers to [6, 29] that study
the impact of the underlying assumptions associated with black-box HPO algorithms.
Transfer black-box HPO: To expedite HPO, it is important to leverage information from existing
evaluations of configurations from prior tasks. A common approach is to capture the similarity
between datasets using meta-features (i.e. descriptive dataset characteristics). Meta-features have
been used as a warm-start initialization technique [14, 20], or as part of the surrogate directly [1].
Transfer learning is also explored through the weighted combination of surrogates, such as in TST-
R [38], RGPE [13], and TAF-R [39]. Another direction is learning a shared surrogate across tasks.
ABLR optimizes a shared hyperparameter embedding with separate Bayesian linear regressors per
task [24], while GCP [27] maps the hyperparameter response to a shared distribution with a Gaussian
Copula process. Furthermore, FSBO [35] meta-learns a deep-kernel Gaussian Process surrogate,
whereas DMFBS incorporates the dataset context through end-to-end meta-feature networks [20].
Meta-datasets: The work by Wistuba et al. [37] popularised the usage of meta-dataset benchmarks
with pre-computed evaluations for the hyperparameters of SVM (288 configurations) and Adaboost
(108 configurations) on 50 datasets; a benchmark that inspired multiple follow-up works [13, 34].
Existing attempts to provide HPO benchmarks deal only with the non-transfer black-box HPO
setup [10], or the gray-box HPO setup [12]. As they contain results for one or very few datasets per
search space, they cannot be used for the evaluation of transfer black-box HPO methods. Nevertheless,
there is a trend in using evaluations of search spaces from the OpenML repository [15], which contains
evaluations reported by an open community, as well as large-scale experiments contributed by specific
research labs [4, 22]. However, the choice of OpenML search spaces in publications is ad-hoc: one
related work uses SVM and XGBoost [24], a second uses GLMNet and SVM [35], while a third
paper uses XGBoost, Random Forest and SVM [25]. We assess that the community (i) inconsistently
cherry-picks (assuming bona fides) search spaces, with (ii) arbitrary train/validation/test splits of the
tasks within the meta-dataset, and (iii) inconsistent preprocessing of hyperparameters and responses.
In our experiments, we observed that existing methods do not generalize well on new meta-datasets.
Our Novelty: As a remedy, we propose a novel benchmark derived from OpenML [15], that resolves
the existing reproducibility issues of existing non-transfer and transfer black-box HPO methods, by
ensuring a fairly-reproducible empirical protocol. The contributions of our benchmark are multi-fold.
First of all, we remove the confounding factors induced by different meta-dataset preprocessing
pipelines (e.g. hyperparameter scaling and transformations, missing value imputations, one-hot
encodings, etc.). Secondly, we provide a specified collection of search spaces, with specified datasets
and evaluations. Furthermore, for transfer learning HPO methods, we also provide pre-defined
training/validation/testing splits of tasks. For experiments on the test tasks, we additionally provide
5 seeds (i.e. 5 sets of initial hyperparameters to fit the initial surrogate) with 5 hyperparameter
configurations, each. We also highlight recommended empirical measures for comparing HPO
methods and assessing their statistical significance in Section 6. In that manner, the results of different
papers that use our benchmark can be compared directly without fearing the confounding factors.
Table 2 presents a summary of the descriptive statistics of meta-datasets from prior literature. To the
best of our awareness, the proposed benchmark is also richer (in the number of search spaces and
their dimensionality) and larger (in the number of evaluations) than all the prior protocols.

         Paper               Venue/Year          # Search Spaces      # Datasets     # HPs     # Evals.
           [1]               ICML ’13                   1                 29            2           3K
          [37]               DSAA ’15                    2                 50          2, 4        20K
          [14]               AAAI ’15                    3                 57          4, 5        93K
          [36]            ECML-PKDD ’15                 17                 59          1-7        1.3M
          [24]              NeurIPS ’18                  2                 30         4, 10       655K
          [27]               ICML ’20                    4                 26          6, 9       343K
          [20]              DMKD ’21                     1                120           7         414K
          [35]               ICLR ’21                    3                 80          2, 4       864K
   Our HPO-B-v1               -                   176              196         1-53      6.39M
  Our HPO-B-v2/-v3            -                    16              101         2-18      6.34M
        Table 2: Summary statistics for various meta-datasets considered in prior works.

                                                    3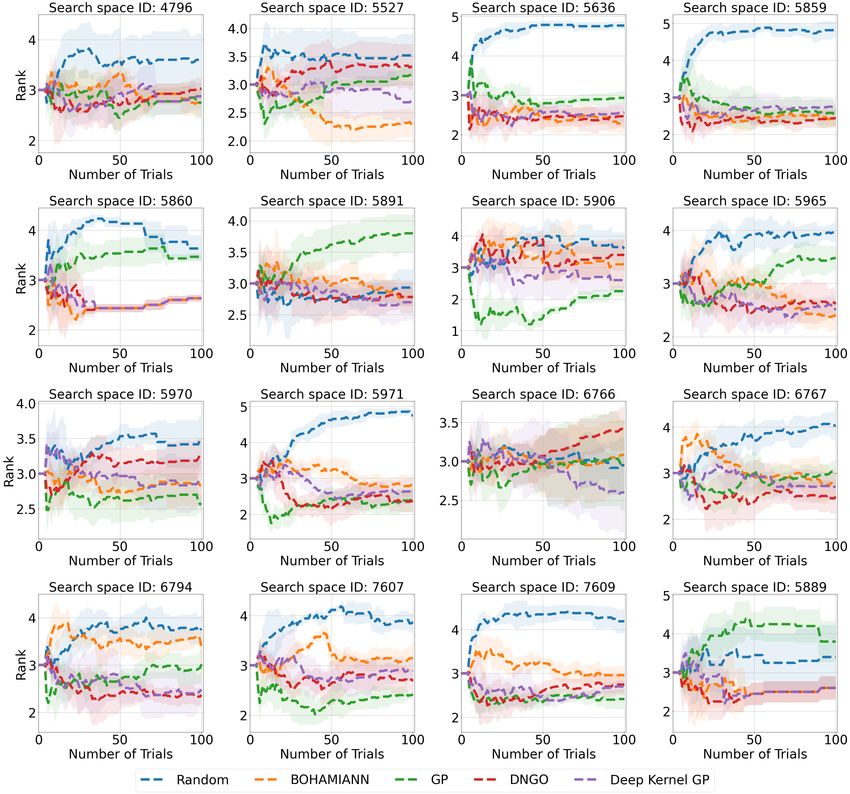
4   A Brief Explanation of Bayesian Optimization Concepts

As we often refer to HPO methods, in this section we present a brief coverage of Bayesian Opti-
mization as the most popular HPO method for black-box optimization. HPO aims at minimizing the
function f : X → R which maps each hyperparameter configuration x ∈ X to the validation loss
obtained when training the machine learning model using x. Bayesian Optimization keeps track of
all evaluated hyperparameter configurations in a history D = {(xi , yi )}i , where yi ∼ N (f (xi ), σn2 )
is the (noisy) response which can be heteroscedastic [17] in real-world problems [6]. A probabilistic
model, the so-called surrogate model, is used to approximate the behavior of the response function.
Gaussian Processes are a common choice for the surrogate model [26, 29]. Bayesian Optimization
is an iterative process that alternates between updating the surrogate model as described above and
selecting the next hyperparameter configuration. The latter is done by finding the configuration which
maximizes an acquisition function, which scores each feasible hyperparameter configuration using
the surrogate model by finding a trade-off between exploration and exploitation. Arguably, the most
popular acquisition function is the Expected Improvement [21]. The efficiency of Bayesian Optimiza-
tion depends on the surrogate model’s ability to approximate the response function. However, this
is a challenging task since every optimization starts with no or little knowledge about the response
function. To overcome this cold-start problem, transfer methods have been proposed, which leverage
information from other tasks of the same search space.

5   Benchmark Description

The benchmark HPO-B is a collection of meta-datasets collected from OpenML [15] with a diverse
set of search spaces. We present three different versions of the benchmark, as follows:

       • HPO-B-v1: The raw benchmark of all 176 meta-datasets;
       • HPO-B-v2: Subset of 16 meta-datasets with the most frequent search spaces;
       • HPO-B-v3: Split of HPO-B-v2 into training, validation and testing.

When assembling the benchmark HPO-B-v1 we noticed that most of the evaluations are reported
for a handful of popular search spaces, in particular, we noticed that 9% of the top meta-datasets
include 99.3% of the evaluations. As a result, we created a second version HPO-B-v2 that includes
only the frequent meta-datasets that have at least 10 datasets with at least 100 evaluations per dataset
(Section 5.1). Furthermore, as we clarified in Section 3 a major reproducibility issue of the related
work on transfer HPO is the lack of clear training, validation, and test splits for the meta-datasets. To
resolve this issue, we additionally created HPO-B-v3 as a derivation of HPO-B-v2 with pre-defined
splits of the training, validation, and testing tasks for every meta-dataset, in addition to providing
initial configurations (seeds) for the test tasks. The three versions were designed to fulfill concrete
purposes with regards to different types of HPO methods. For non-transfer black-box HPO methods,
we recommend using HPO-B-v2 which offers a large pool of HPO tasks. Naturally, for transfer HPO
tasks we recommend using HPO-B-v3 where meta-datasets are split into training, validation, and
testing. We still are releasing the large HPO-B-v1 benchmark to anticipate next-generation methods
for heterogeneous transfer learning techniques that meta-learn surrogates across different search
spaces, where all 176 meta-datasets might be useful despite most of them having few evaluations.
Concretely, HPO-B-v3 contains the set of filtered search spaces of HPO-B-v2, which are specially
split into four sets: meta-train, meta-validation. meta-test and an augmented version of the meta-train
dataset. Every split contains different datasets from the same search space. We distributed the datasets
per search space as 80% of the datasets to meta-train, 10% to meta-validation, and 10% to meta-test,
respectively. A special, augmented version of the meta-train is created by adding all other search
space evaluations from HPO-B-v1 that are not part of HPO-B-v3. On the other hand, in HPO-B-v3
we also provide seeds for initializing the HPO. They are presented as five different sets of five initial
configurations to be used by a particular HPO method. By providing five different seeds we decrease
the random effect of the specific initial configurations. To ease the comparison among HPO methods,
we suggest using the recommended initial configurations for testing. Although, we admit that some
algorithms proposing novel warm-starting strategies might need to bypass the recommended initial
configurations.

                                                   4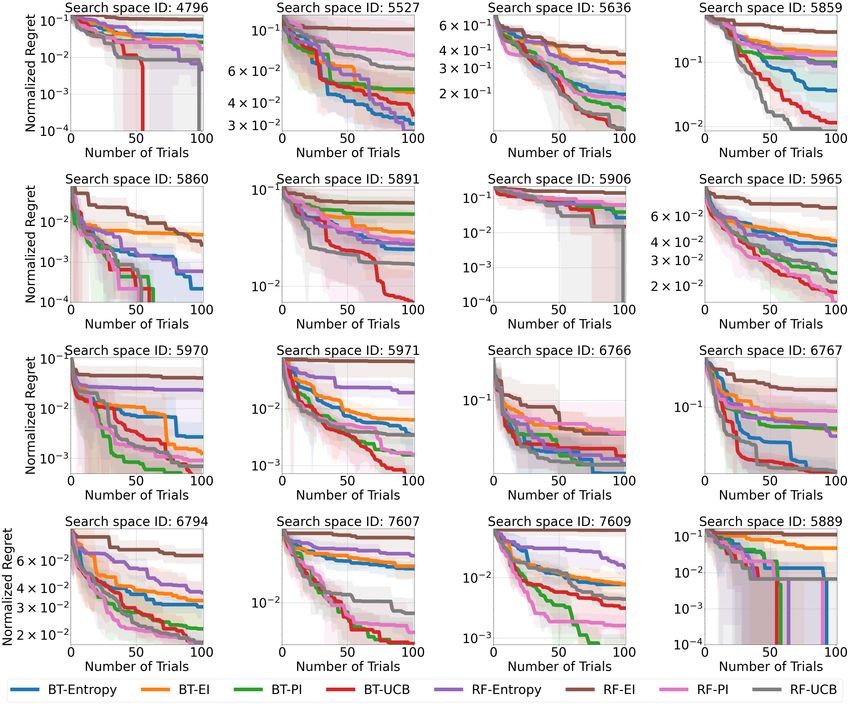
5.1   Benchmark summary

The created benchmark contains 6,394,555 total evaluations across 176 search spaces that are sparsely
evaluated on 196 datasets. By accounting for the search spaces that comply with our filtering criteria
(at least 10 datasets with 100 evaluations), we obtain HPO-B-v2 with 16 different search spaces and
6,347,916 evaluations on 101 datasets. Notice that the benchmark does not include evaluations for
all datasets in every search space. The number of dimensions, datasets, and evaluations per search
space is listed in Table 3. An additional description of the rest of all the search spaces in HPO-B-v1
is presented in the Appendix. In addition, Table 3 shows the description of the meta-dataset splits
according to the HPO-B-v3.

                                           Meta-Train        Meta-Validation        Meta-Test
      Search Space        ID     #HPs
                                          #Evals. #DS        #Evals.   #DS        #Evals. #DS
    rpart.preproc (16) 4796           3     10694     36       1198       4       1200       4
    svm (6)               5527        8 385115        51     196213       6     354316       6
    rpart (29)            5636        6 503439        54     184204       7     339301       6
    rpart (31)            5859        6     58809     56      17248       7      21060       6
    glmnet (4)            5860        2      3100     27         598      3         857      3
    svm (7)               5891        8     44091     51      13008       6      17293       6
    xgboost (4)           5906      16       2289     24         584      3         513      2
    ranger (9)            5965      10 414678         60      73006       7      83597       7
    ranger (5)            5970        2     68300     55      18511       7      19023       6
    xgboost (6)           5971      16      44401     52      11492       6      19637       6
    glmnet (11)           6766        2 599056        51     210298       6     310114       6
    xgboost (9)           6767      18 491497         52     211498       7     299709       6
    ranger (13)           6794      10 591831         52     230100       6     406145       6
    ranger (15)           7607        9     18686     58       4203       7       5028       7
    ranger (16)           7609        9     41631     59       8215       7       9689       7
    ranger (7)            5889        6      1433     20         410      2         598      2
Table 3: Description of the search spaces in HPO-B-v3; "#HPs" stands for the number of hyperpa-
rameters, "#Evals." for the number of evaluations in a search space, while "#DS" for the number of
datasets across which the evaluations are collected. The search spaces are named with the respective
OpenML version number (in parenthesis), and their original names are preceded by mlr.classif.

5.2   Preprocessing

The OpenML-Python API [16] was used to download the experiment data from
OpenML [15]. We have collected all evaluations (referred to as runs in OpenML) tagged
with Verified_Supervised_Classification available until April 15, 2021.
While the hyperparameter configuration was directly available for many evaluations, some
of them had to be parsed from WEKA arguments (e.g. weka.filters.unsupervised.
attribute.RandomProjection -P 16.0 -R 42 -D Sparse1). A small percentage (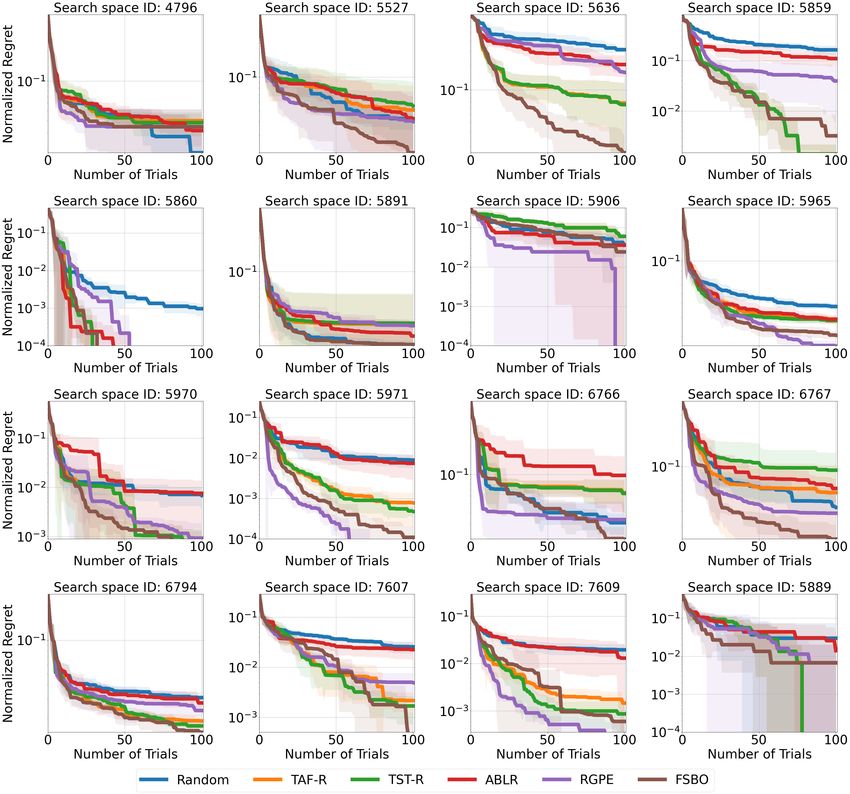
5.3        Benchmark JSON schema

The benchmark is offered as easily accessible JSON files. The first-level key of each JSON schema
corresponds to the search space ID, whereas the second-level key specifies the dataset ID. By
accessing the JSON schema with the search space s and the dataset t, we obtain the meta-dataset
             (s,t) (s,t)    (s,t)
D(s,t) = {(xi , yi )}i , xi       ∈ X (s) . The meta-dataset exhibits the following structure, where
N denotes the number of evaluations available for the specific task:

          {search_space_ID: {dataset_ID:{X:[[x1 ],. . . ,[xN ]], y:[[y1 ],. . . ,[yN ]]}}}

The initialization seeds are similarly provided as a JSON schema, where the third-level subschema
has 5 keys whose values are the indices of the samples to use as initial configurations.

5.4        An additional continuous variant of HPO-B

OpenML [15] offers only discrete evaluations of hyperparameter configurations. Continuous HPO
search methods are not applicable out-of-the-box on the discrete meta-datasets of HPO-B, because
evaluations are not present for every possible configuration in a continuous space. To overcome this
limitation, we release an additional continuous version of HPO-B based on task-specific surrogates.
For every task, we fit an XGBoost [5] regression model with a maximum depth of 6 ańd two cross-
validated hyper-hyperparameters, concretely the learning rate and the number of rounds. We train
the surrogates to approximate the observed response values of the evaluated configurations on each
task. As a result, for any arbitrary configuration in the continuous space, the approximate evaluation
of a configuration’s response is computed through the estimation of the respective task’s surrogate.
Furthermore, a download link to the trained surrogate models is also provided in the repository 4 .

6         Recommended Experimental Protocol
One of the primary purposes of HPO-B is to standardize and facilitate the comparison between HPO
techniques on a level playing field. In this section, we provide two specific recommendations: which
benchmark to use for a type of algorithm and what metrics to use for comparing results.

Evaluation Metrics We define the average normalized regret at trial e (a.k.a. average distance
                                               ∗
                                                        ∗      ∗            (s,t)
to the minimum) as minx∈X (s,t) f (s,t) (x) − ymin   / (ymax − ymin ) with Xe      as the set of hyperpa-
                             e
                                                                           ∗         ∗
rameters that have been selected by a HPO method up to trial e, with ymin     and ymax   as the best and
worst responses, respectively. The average rank represents the mean across tasks of the ranks of
competing methods computed using the test accuracies of the best configuration until the e-th trial.
Results across different search spaces are computed by a simple mean over the search-space-specific
results.

Non-Transfer Black-Box HPO Methods should be compared on all the tasks in HPO-B-v2 and
for each of the five initial configurations. The authors of future papers should report the normalized
regret and the mean ranks for all trials from 1 to 100 (excluding the seeds). We recommend that the
authors show both aggregated and per search-space (possibly moved to the appendix) mean regret
and mean rank curves for trials ranging from 1 to 100. In other words, as many runs as the number of
tasks for given space times the number of initialization seeds. To assess the statistical significance of
methods, we recommend that critical difference diagrams [7] be computed for the ranks of all runs
@25, @50, and @100 trials.

Transfer Black-Box HPO Methods should be compared on the meta-data splits contained in HPO-
B-v3. All competing methods should use exactly the evaluations of the provided meta-train datasets
for meta- and transfer-learning their method, and tune the hyper-hyperparameters on the evaluations
of the provided meta-validation datasets. In the end, the competing methods should be tested on the
provided evaluations of the meta-test tasks. As our benchmark does not have pre-computed responses
for all possible configurations in a space, the authors either (i) need to adapt their HPO acquisitions
and suggest the next configuration only from the set of the pre-computed configurations for each
      4
          https://github.com/releaunifreiburg/HPO-B

                                                   6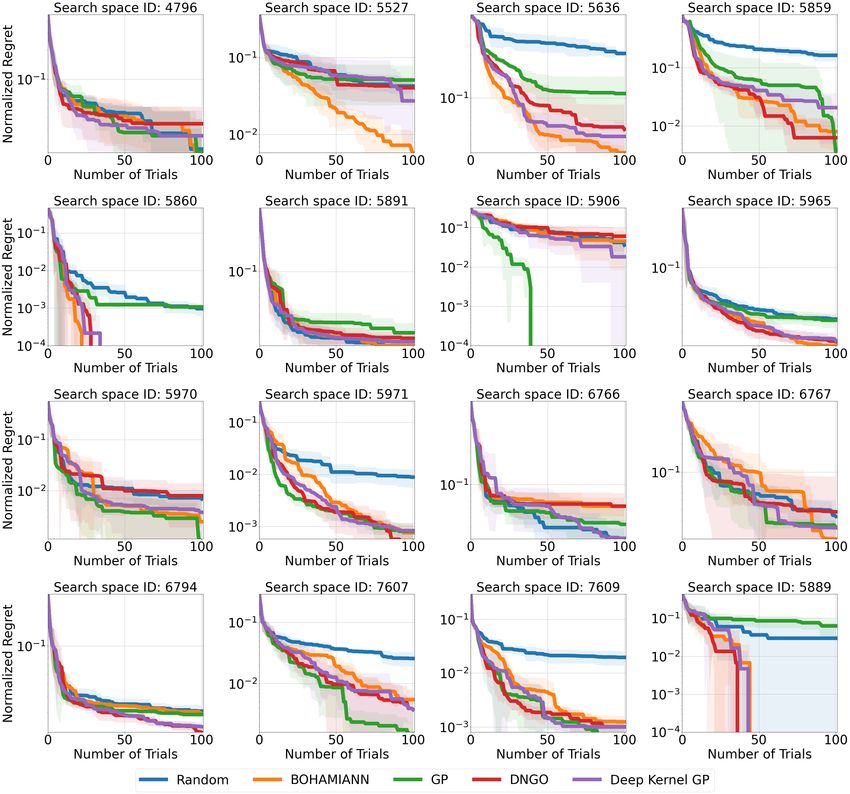
Figure 1: Aggregated comparisons of normalized regret and mean ranks across all search spaces for
the non-transfer HPO methods on HPO-B-v2
specific meta-test task, or (ii) use the continuous variant of HPO-B. Additionally, we recommend
that the authors present (see details in the paragraph above) regret and rank plots, besides the critical
difference diagrams @25, @50, and @100 trials. If a future transfer HPO method proposes a novel
strategy for initializing configurations, for the sake of reproducibility we still recommend showing
additional results with our initial configurations.
7 Experimental Results
The benchmark is intended to serve as a new standard for evaluating non-transfer and transfer
black-box HPO methods. In the following, we will compare different methods according to our
recommended protocol described in Section 6. This is intended to demonstrate the usefulness of our
benchmark, while at the same time serving as an example for the aforementioned recommendations
on comparing baselines and presenting results.
Figure 2: Aggregated comparisons of different surrogates and acquisition functions for transfer
HPO methods on HPO-B-v2; BT stands for Boosted Trees, RF for Random Forests, EI for Expected
Improvement, and UCB for Upper Confidence Bound.
7.1 Non-transfer Black-Box HPO
First, we compare Random Search, DNGO, BOHAMIANN, Gaussian Process (GP) with Matérn 3/2
kernel, and Deep Gaussian Process (FSBO [35] without pre-training) on HPO-B-v2 in the non-transfer
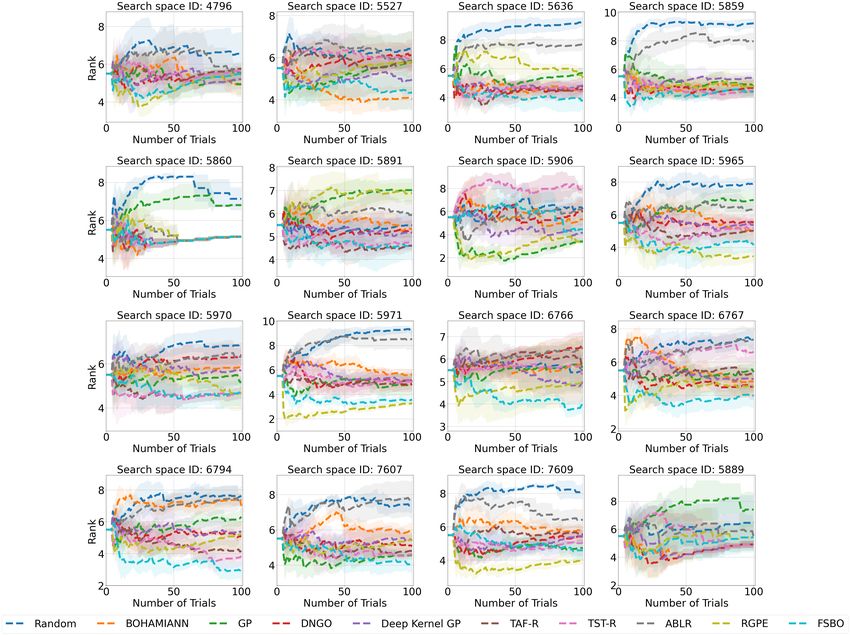
scenario. As recommended by us earlier, in Figure 10 we report aggregated results for normalized
regret, average rank, and critical difference plots. In addition, we report in Figure 1 the aggregated
normalized regret per search space. The values in the figures for the number of trials equal to 0
correspond to the result after the five initialization steps. According to Figure 1, BOHAMIANN and
Deep GP achieve comparable aggregated normalized regret across all search spaces, which suggests
that both methods are equally well-suited for the tasks. The average rank and the critical difference
7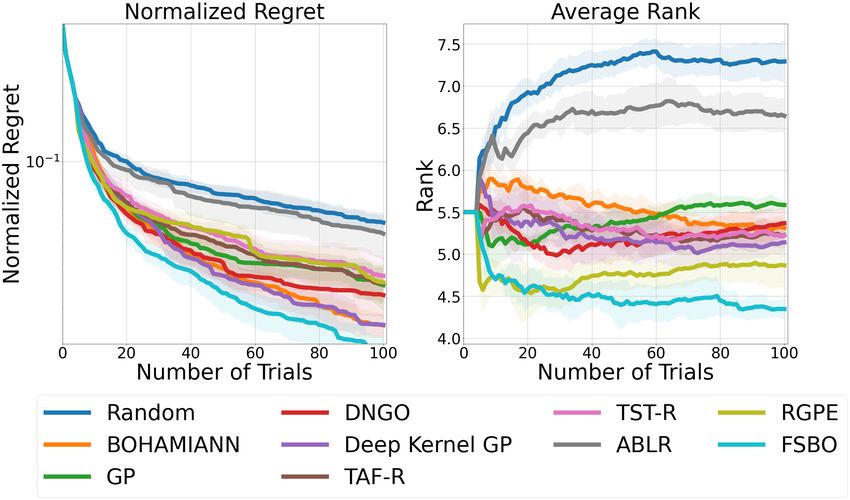
plot paint a different picture, in which Deep GP and DNGO achieve better results. This discrepancy
arises because each metric measures different performance aspects on different tasks, so it’s important
to report both. As can be seen in Figure 11, Deep GP achieves better results than the GP in most
of the tasks, which leads to a better average ranking. However, as we can see in Figure 10, the
regrets are observed at heterogeneous scales that can skew the overall averages. In some cases where
BOHAMIANN outperforms Deep GP (e.g. search spaces 5527, 5859, and 5636), the difference
in normalized regret is evident, due to the nature of the search space, whereas in cases where it is
the other way around, however, the difference is only slightly less evident (e.g. search spaces 4796,
5906, and 7609). An important aspect of HPO is the choice of the surrogate function and acquisition.
Figure 2 presents an ablation of typical combinations and shows the accuracy of the Boosted Tree as
a surrogate.

Figure 3: Aggregated comparisons of normalized regret and mean ranks across all search spaces for
the transfer learning HPO methods on HPO-B-v3

7.2   Transfer Black-Box HPO

Finally, we compare RGPE [13], ABLR [24], TST-R [38], TAF-R [39], and FSBO [35] on HPO-B-v3
in the transfer scenario. All hyper-hyperparameters were optimized on the meta-validation datasets
and we report results aggregated across all test search spaces in terms of normalized regret and
average rank in Figure 3. The results per search space for normalized regret and average rank are
given in Figure 9 and Figure 12, respectively. FSBO shows improvements over all the compared
methods for the normalized regret metric and average rank metric. On the other hand, RGPE is
seemingly performing similar to TST-R and TAF-R for the average regret, but performs significantly
better for the average rank metric. The explanation is the same as for our last experiment and can
mainly be traced back to the strong performance of RGPE in search spaces 5971 and 5906. Such
behaviors strengthen our recommendations of Section 6 for showing results in terms of both the ranks
and the normalized regrets, as well as the ranks’ statistical significance.

7.3   Comparing Non-Transfer vs. Transfer Black-Box HPO

We provide a cumulative comparison of both non-transfer and transfer black-box methods in Figure 4,
for demonstrating the benefit of transfer learning in HPO-B-v3. We see that the transfer methods
(FSBO, RGPE, TST-R, TAF-R) achieve significantly better performances than the non-transfer tech-
niques (GP, DNGO, BOHAMIANN, Deep Kernel GP). On the average rank plot and the associated
Critical Difference diagrams, we notice that FSBO [35] achieves significantly better results than all
baselines, followed by RGPE [13]. A detailed comparison of the ranks per search-space is presented
in the supplementary material. In particular, the direct gain of transfer learning can be observed by
the dominance that FSBO has over Deep Kernel GP, considering that both use exactly the same
surrogate model and the same acquisition function. In comparison, the deep kernel parameters in
FSBO are initialized from the solution of a meta-learning optimization conducted on the meta-train
tasks of HPO-B-v3 (transfer), while the parameters of Deep Kernel GP are initialized randomly (no
transfer).

                                                  8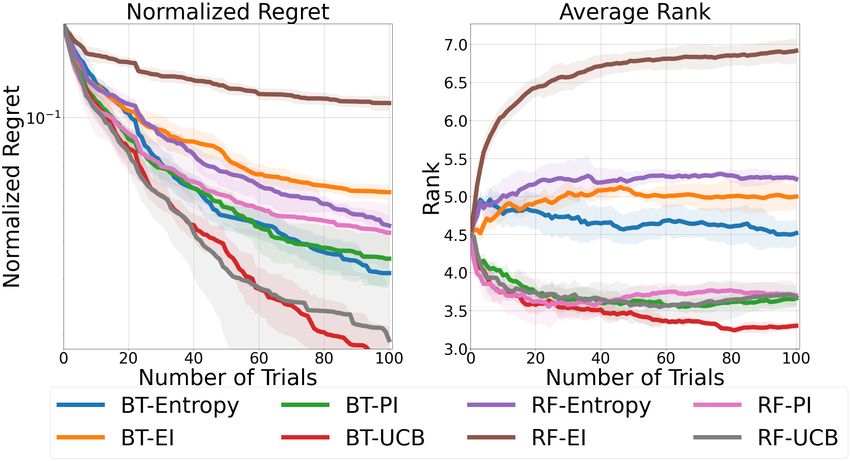
Figure 4: Comparisons of normalized regret and mean ranks across all search spaces for the transfer
learning and non-transfer HPO methods on HPO-B-v3

7.4   Validating the Continuous HPO-B Benchmark

We further show that the surrogate-based continuous variant of HPO-B (Section 5.4) provides a
benchmark where HPO methods achieve similar performances compared to the discrete HPO-B. We
present the results of three typical non-transfer HPO methods (Gaussian Process (GP), Deep Kernel
GP, and Random Search) on the continuous benchmark in Figure 5. The cumulative performance on
the continuous surrogate tasks matches well with the performance of these methods on the discrete
tasks (Figure 2). In particular, we highlight a similar comparative trend of Deep Kernel GP being
marginally better than GP after many trials but significantly superior to Random Search.

Figure 5: Aggregated comparisons of normalized regret and mean ranks across all search spaces for
three typical non-transfer HPO methods on the continuous search spaces of HPO-B-v3

8     Limitations of HPO-B

A limitation of HPO-B is that it only covers black-box HPO tasks, instead of other HPO problems,
such as grey-box/multi-fidelity HPO, online HPO, or pipeline optimization for AutoML libraries.
In addition, HPO-B is restricted by the nature of search spaces found in OpenML, which contains
evaluations for well-established machine learning algorithms for tabular data, but lacks state-of-
the-art deep learning methods, or tasks involving feature-rich data modalities (image, audio, text,
etc.). An additional limitation is the structured bias and noise produced by relying on a surrogate for
constructing continuous search spaces. However, it has been found that tree-based models are able to
model the performance of several machine learning algorithms and produce surrogates that resemble
real-world problems [11]. Other sources of bias and noise might come from the user-oriented data
generation process for the evaluation on discrete search spaces, which might potentially incur in
wrong values or hyperparameters within ranges reflecting prior knowledge or typical human choices.
These risks can be reduced by benchmarking on a large number of search spaces, as we suggested
throughout the paper.

                                                  9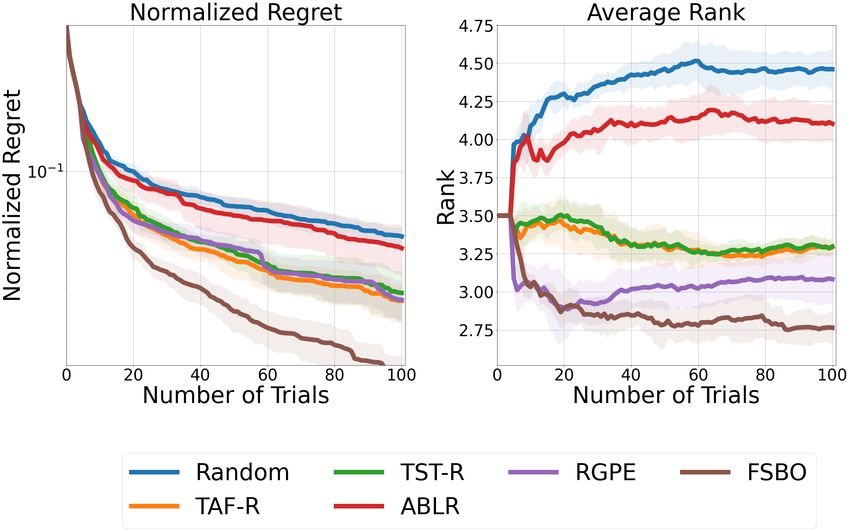
9   Conclusions
Recent HPO and transfer-learning HPO papers inconsistently use different meta-datasets, arbitrary
train/validation/test splits, as well as ad-hoc preprocessing, which makes it hard to reproduce the
published results. To resolve this bottleneck, we propose HPO-B, a novel benchmark based on the
OpenML repository, that contains meta-datasets from 176 search spaces, 196 datasets, and a total of
6.4 million evaluations. For promoting reproducibility at a level playing field we also provide initial
configuration seeds, as well as predefined training, validation and testing splits. Our benchmark
contains pre-processed meta-datasets and a clear set of HPO tasks and exact splits, therefore, it
enables future benchmark results to be directly comparable. We believe our benchmark has the
potential to become the de facto standard for experimentation in the realm of black-box HPO.

Acknowledgements
The research of Hadi S. Jomaa is co-funded by the industry project "IIP-Ecosphere: Next Level
Ecosphere for Intelligent Industrial Production". Prof. Grabocka is also thankful to the Eva Mayr-
Stihl Foundation for their generous research grant, as well as to the Ministry of Science, Research and
the Arts of the German state of Baden-Württemberg, and to the BrainLinks-BrainTools Excellence
Cluster for funding his professorship. In addition, we thank Arlind Kadra for his assistance in
interfacing with the OpenML Python package.

References
 [1] Rémi Bardenet, Mátyás Brendel, Balázs Kégl, and Michele Sebag. Collaborative Hyperparame-
     ter Tuning. In International Conference on Machine Learning, pages 199–207, 2013.

 [2] James Bergstra, Rémi Bardenet, Yoshua Bengio, and Balázs Kégl. Algorithms for hyper-
     parameter optimization. In 25th annual Conference on Neural Information Processing Systems
     (NIPS 2011), volume 24. Neural Information Processing Systems Foundation, 2011.

 [3] James Bergstra and Yoshua Bengio. Random Search for Hyper-parameter Optimization. Journal
     of machine learning research, 13(2), 2012.

 [4] Martin Binder, Florian Pfisterer, and Bernd Bischl. Collecting Empirical Data About Hyper-
     parameters for DataDriven AutoML. In ICML Workshop on Automated Machine Learning,
     2020.

 [5] Tianqi Chen and Carlos Guestrin. XGBoost: A scalable tree boosting system. In Proceedings of
     the 22nd ACM SIGKDD International Conference on Knowledge Discovery and Data Mining,
     KDD ’16, pages 785–794, New York, NY, USA, 2016. ACM.

 [6] Alexander I Cowen-Rivers, Wenlong Lyu, Rasul Tutunov, Zhi Wang, Antoine Grosnit,
     Ryan Rhys Griffiths, Hao Jianye, Jun Wang, and Haitham Bou Ammar. An Empirical Study of
     Assumptions in Bayesian Optimisation. arXiv preprint arXiv:2012.03826, 2020.

 [7] Janez Demsar. Statistical Comparisons of Classifiers over Multiple Data Sets. J. Mach. Learn.
     Res., 7:1–30, 2006.

 [8] Jia Deng, Wei Dong, Richard Socher, Li-Jia Li, Kai Li, and Li Fei-Fei. Imagenet: A Large-scale
     Hierarchical Image Database. In 2009 IEEE Conference on Computer Vision and Pattern
     Recognition, pages 248–255. Ieee, 2009.

 [9] Xuanyi Dong and Yi Yang. NAS-Bench-201: Extending the Scope of Reproducible Neural
     Architecture Search. In International Conference on Learning Representations, 2020.

[10] Katharina Eggensperger, Matthias Feurer, Frank Hutter, James Bergstra, Jasper Snoek, Holger
     Hoos, and Kevin Leyton-Brown. Towards an Empirical Foundation for assessing Bayesian
     Optimization of Hyperparameters. In NIPS workshop on Bayesian Optimization in Theory and
     Practice, volume 10, page 3, 2013.

                                                  10
[11] Katharina Eggensperger, Frank Hutter, Holger H. Hoos, and Kevin Leyton-Brown. Efficient
Benchmarking of Hyperparameter Optimizers via Surrogates. In Blai Bonet and Sven Koenig,
editors, Proceedings of the Twenty-Ninth AAAI Conference on Artificial Intelligence, January
25-30, 2015, Austin, Texas, USA, pages 1114–1120. AAAI Press, 2015.
[12] Katharina Eggensperger, Philipp Müller, Neeratyoy Mallik, Matthias Feurer, René Sass, Aaron
Klein, Noor H. Awad, Marius Lindauer, and Frank Hutter. HPOBench: A Collection of
Reproducible Multi-Fidelity Benchmark problems for HPO. CoRR, abs/2109.06716, 2021.
[13] Matthias Feurer, Benjamin Letham, and Eytan Bakshy. Scalable Meta-learning for Bayesian
Optimization. arXiv preprint arXiv:1802.02219, 2018.
[14] Matthias Feurer, Jost Tobias Springenberg, and Frank Hutter. Initializing Bayesian Hyper-
parameter Optimization via Meta-learning. In Twenty-Ninth AAAI Conference on Artificial
Intelligence, 2015.
[15] Matthias Feurer, Jan N. van Rijn, Arlind Kadra, Pieter Gijsbers, Neeratyoy Mallik, Sahithya
Ravi, Andreas Mueller, Joaquin Vanschoren, and Frank Hutter. Openml-python: an extensible
Python API for OpenML. arXiv, 1911.02490, 2020.
[16] Matthias Feurer, Jan N. van Rijn, Arlind Kadra, Pieter Gijsbers, Neeratyoy Mallik, Sahithya
Ravi, Andreas Müller, Joaquin Vanschoren, and Frank Hutter. OpenML-Python: an extensible
Python API for OpenML. arXiv:1911.02490, 2019.
[17] Ryan-Rhys Griffiths, Miguel Garcia-Ortegon, Alexander A. Aldrick, and Alpha A. Lee. Achiev-
ing Robustness to Aleatoric Uncertainty with Heteroscedastic Bayesian Optimisation. CoRR,
abs/1910.07779, 2019.
[18] Frank Hutter, Holger H Hoos, and Kevin Leyton-Brown. Sequential model-based optimization
for general algorithm configuration. In International conference on learning and intelligent
optimization, pages 507–523. Springer, 2011.
[19] Hadi S Jomaa, Josif Grabocka, and Lars Schmidt-Thieme. Hyp-rl: Hyperparameter Optimization
by Reinforcement Learning. arXiv preprint arXiv:1906.11527, 2019.
[20] Hadi S Jomaa, Lars Schmidt-Thieme, and Josif Grabocka. Dataset2vec: Learning dataset
meta-features. Data Mining and Knowledge Discovery, 35(3):964–985, 2021.
[21] Donald R. Jones, Matthias Schonlau, and William J. Welch. Efficient Global Optimization of
Expensive Black-Box Functions. J. Global Optimization, 13(4):455–492, 1998.
[22] Daniel Kühn, Philipp Probst, Janek Thomas, and Bernd Bischl. Automatic Exploration of
Machine Learning Experiments on OpenML. CoRR, abs/1806.10961, 2018.
[23] Lisha Li, Kevin Jamieson, Giulia DeSalvo, Afshin Rostamizadeh, and Ameet Talwalkar. Hy-
perband: A Novel Bandit-Based approach to Hyperparameter Optimization. The Journal of
Machine Learning Research, 18(1):6765–6816, 2017.
[24] Valerio Perrone, Rodolphe Jenatton, Matthias W Seeger, and Cédric Archambeau. Scalable
Hyperparameter Transfer Learning. In Advances in Neural Information Processing Systems,
pages 6845–6855, 2018.
[25] Valerio Perrone and Huibin Shen. Learning Search Spaces for Bayesian Optimization: Another
View of Hyperparameter Transfer Learning. In Advances in Neural Information Processing
Systems 32: Annual Conference on Neural Information Processing Systems 2019, NeurIPS
2019, December 8-14, 2019, Vancouver, BC, Canada, pages 12751–12761, 2019.
[26] Carl Edward Rasmussen and Christopher K. I. Williams. Gaussian Processes for Machine
Learning. Adaptive Computation and Machine Learning. MIT Press, 2006.
[27] David Salinas, Huibin Shen, and Valerio Perrone. A Quantile-Based approach for Hyperparam-
eter Transfer Learning. In International Conference on Machine Learning, pages 8438–8448.
PMLR, 2020.
11[28] Nicolas Schilling, Martin Wistuba, Lucas Drumond, and Lars Schmidt-Thieme. Hyperparameter
Optimization with Factorized Multilayer Perceptrons. In Joint European Conference on Machine
Learning and Knowledge Discovery in Databases, pages 87–103. Springer, 2015.
[29] Jasper Snoek, Hugo Larochelle, and Ryan P Adams. Practical bayesian optimization of machine
learning algorithms. arXiv preprint arXiv:1206.2944, 2012.
[30] Jasper Snoek, Oren Rippel, Kevin Swersky, Ryan Kiros, Nadathur Satish, Narayanan Sundaram,
Mostofa Patwary, Mr Prabhat, and Ryan Adams. Scalable Bayesian Optimization using Deep
Neural Networks. In International Conference on Machine Learning, pages 2171–2180. PMLR,
2015.
[31] Jost Tobias Springenberg, Aaron Klein, Stefan Falkner, and Frank Hutter. Bayesian optimization
with robust bayesian neural networks. In Proceedings of the 30th International Conference on
Neural Information Processing Systems, pages 4141–4149, 2016.
[32] Joaquin Vanschoren, Jan N. van Rijn, Bernd Bischl, and Luis Torgo. OpenML: Networked
science in machine learning. SIGKDD Explorations, 15(2):49–60, 2013.
[33] Michael Volpp, Lukas P Fröhlich, Kirsten Fischer, Andreas Doerr, Stefan Falkner, Frank Hutter,
and Christian Daniel. Meta-learning Acquisition Functions for Transfer Learning in Bayesian
Optimization. arXiv preprint arXiv:1904.02642, 2019.
[34] Michael Volpp, Lukas P. Fröhlich, Kirsten Fischer, Andreas Doerr, Stefan Falkner, Frank Hutter,
and Christian Daniel. Meta-Learning Acquisition Functions for Transfer Learning in Bayesian
Optimization, 2020.
[35] Martin Wistuba and Josif Grabocka. Few-Shot Bayesian Optimization with Deep Kernel
Surrogates. In International Conference on Learning Representations, 2021.
[36] Martin Wistuba, Nicolas Schilling, and Lars Schmidt-Thieme. Hyperparameter Search Space
Pruning–a new component for Sequential Model-based Hyperparameter Optimization. In Joint
European Conference on Machine Learning and Knowledge Discovery in Databases, pages
104–119. Springer, 2015.
[37] Martin Wistuba, Nicolas Schilling, and Lars Schmidt-Thieme. Learning hyperparameter
optimization initializations. In International Conference on Data Science and Advanced
Analytics, pages 1–10, 2015.
[38] Martin Wistuba, Nicolas Schilling, and Lars Schmidt-Thieme. Two-stage Transfer Surrogate
Model for Automatic Hyperparameter Optimization. In Joint European conference on machine
learning and knowledge discovery in databases, pages 199–214. Springer, 2016.
[39] Martin Wistuba, Nicolas Schilling, and Lars Schmidt-Thieme. Scalable Gaussian Process-Based
Transfer Surrogates for Hyperparameter Optimization. Machine Learning, 107(1):43–78, 2018.
[40] Chris Ying, Aaron Klein, Eric Christiansen, Esteban Real, Kevin Murphy, and Frank Hutter.
NAS-bench-101: Towards reproducible neural architecture search. In Kamalika Chaudhuri and
Ruslan Salakhutdinov, editors, Proceedings of the 36th International Conference on Machine
Learning, volume 97 of Proceedings of Machine Learning Research, pages 7105–7114. PMLR,
09–15 Jun 2019.
12Checklist
The checklist follows the references. Please read the checklist guidelines carefully for information on
how to answer these questions. For each question, change the default [TODO] to [Yes] , [No] , or
[N/A] . You are strongly encouraged to include a justification to your answer, either by referencing
the appropriate section of your paper or providing a brief inline description. For example:
• Did you include the license to the code and datasets? [Yes] See Section
• Did you include the license to the code and datasets? [No] The code and the data are
proprietary.
• Did you include the license to the code and datasets? [N/A]
Please do not modify the questions and only use the provided macros for your answers. Note that the
Checklist section does not count towards the page limit. In your paper, please delete this instructions
block and only keep the Checklist section heading above along with the questions/answers below.
1. For all authors...
(a) Do the main claims made in the abstract and introduction accurately reflect the paper’s
contributions and scope? [Yes]
(b) Did you describe the limitations of your work? [Yes]
(c) Did you discuss any potential negative social impacts of your work? [N/A]
(d) Have you read the ethics review guidelines and ensured that your paper conforms to
them? [Yes]
2. If you are including theoretical results...
(a) Did you state the full set of assumptions of all theoretical results? [N/A]
(b) Did you include complete proofs of all theoretical results? [N/A]
3. If you ran experiments (e.g. for benchmarks)...
(a) Did you include the code, data, and instructions needed to reproduce the main ex-
perimental results (either in the supplemental material or as a URL)? [Yes] See our
repository link in the introduction.
(b) Did you specify all the training details (e.g., data splits, hyperparameters, how they
were chosen)? [No] We used pre-defined configurations from previous work.
(c) Did you report error bars (e.g., concerning the random seed after running experiments
multiple times)? [Yes]
(d) Did you include the total amount of computing and the type of resources used (e.g.,
type of GPUs, internal cluster, or cloud provider)? [No]
4. If you are using existing assets (e.g., code, data, models) or curating/releasing new assets...
(a) If your work uses existing assets, did you cite the creators? [Yes]
(b) Did you mention the license of the assets? [No] They are included in the cited
publications.
(c) Did you include any new assets either in the supplemental material or as a URL? [Yes]
(d) Did you discuss whether and how consent was obtained from people whose data you’re
using/curating? [No] We are using open-sourced assets.
(e) Did you discuss whether the data you are using/curating contains personally identifiable
information or offensive content? [N/A]
5. If you used crowdsourcing or researched with human subjects...
(a) Did you include the full text of instructions given to participants and screenshots, if
applicable? [N/A]
(b) Did you describe any potential participant risks, with links to Institutional Review
Board (IRB) approvals, if applicable? [N/A]
(c) Did you include the estimated hourly wage paid to participants and the total amount
spent on participant compensation? [N/A]
13A Datasheet
A.1 Motivation
• For what purpose was the dataset created? In order to benchmark easily new methods
on HPO and transfer HPO.
• Who create the dataset and on behalf of which entity? The authors of the main paper
work together on behalf of their respective institution.
• Who funded the creation of the dataset? University of Freiburg, University of Hildesheim
and Amazon.
A.2 Composition
• What do the instances that comprises the dataset represent? They represent evaluations
of hyperparameter configurations on diferent tasks.
• How many instances are there in total? Around 6.4 million hyperparameter evaluations.
• Does the dataset contain all possible instances or is it a sample of instances from a
larger set? No, they correspond only to evaluations of supervised classifiers and queried
from OpenML platform.
• What data does each instance consist of? Each instance consist of a hyperparameter
configuration, with their respective values and response.
• Is there a label or target associated with each instance? Yes, the associated accuracy
(validation accuracy).
• Is any information missing from individual instances? No. The missing values have
been imputed.
• Are relationships between individual instances made explicit? No.
• Are there recommended data splits? Yes, we recommend three splits for meta-train,
meta-validation and meta-test.
• Are there any errors, sources of noise or redundancies in the dataset? Yes, the evalua-
tions rely on third parties that may have commited mistakes in reporting the response or
hyperparameter configuration values.
• Is the dataset self-contained or does it link to or otherwise rely on external resources?
For the creation, it relied on data from OpenML.
• Does the dataset contain data that might be considered confidential? No.
• Does the dataset contain data that, if viewed directly, might be offensive, insulting,
threatening or might otherwise cause anxiety? No.
• Does the dataset relate to people? No.
• Does the dataset identify any sub-populations? No.
• Is it possible to identify individuals, either directly or indirectly? No.
• Does the dataset contain data that might be considered sensitive in any way? No.
A.3 Collection process
• How was the data associated with each instance acquired? We queried the existing runs
(evaluations) with tag Verified_Supervised_Classification from OpenML.
• What mechanisms or procedures were used to collect the data? We used the Python
API for fetching the data.
• Who was involved in the data collection process? Only the authors of this paper.
• Over what time frame was the data collected? The existing runs until April 15, 2021.
• Were any ethical review process conducted? No.
• Does the dataset relate to people? No.
14• Did you collect the data from the individuals in question, or obtained it via third
parties or other sources? It was obtained from OpenML website.
• Was any preprocessing/cleaning/labeling of the data done? Yes, it is explain in section
5.
• Was the "raw" data saved in addition to the preprocessed/cleaned/labeled data? No,
but the raw data can be accessed through OpenML platform.
• Is the software used to preprocess/clean/label the instances available? No.
A.4 Uses
• Has the dataset been used for any tasks already? Yes, we provide examples in section 7.
• Is there a repository that links to any or all papers or systems that use the dataset?
Yes, it is available in https://github.com/releaunifreiburg/HPO-B.
• What (other) tasks could the dataset be used for? HPO and transfer HPO.
• Is there anything about the composition of the dataset or the way it was collected and
preprocessed/cleaned/labeled that might impact future uses? No.
• Are there tasks for which the dataset should not be used? No.
A.5 Distribution
• Will the dataset be distributed to third parties outside of the entity? Yes, the dataset is
publicly available.
• How will the dataset be distributed? Through a link hosted in our repository https:
//github.com/releaunifreiburg/HPO-B.
• When will the dataset be distributed? From June 8. 2021.
• Will the dataset be distributed under a copyright or other intellectual property li-
cense? Yes, license CC-BY.
• Have any third parties imposed IP-based or other restrictions on the data associated
with the instances? No.
• Do any export controls or other regulatory restrictions apply to the dataset or to indi-
vidual instances? No.
A.6 Maintenance
• Who will be supporting/hosting/maintaining the dataset? RELEA group from the Uni-
versity of Freiburg.
• How can the owner/curator/manager of the dataset be contacted? Questions can be
sent to pineda@cs.uni-freiburg.de or submit an issue to the Github repository https:
//github.com/releaunifreiburg/HPO-B.
• Is there an erratum? No.
• Will the dataset be updated? No.
• Will older versions of the dataset continue to be supported/hosted/maintained? As
new runs (evaluations) might be available in OpenML, we consider to update it periodically.
• If other want to extend/augment/build on/contributed to the dataset, is there a mech-
anism for them to do so? We might provide this possibility in the future.
B License
The meta-dataset is provided under a license CC-BY.
C Accessibility
The link to access the meta-dataset and recommendations on how to consume it are given in the
following git-hub repository: https://github.com/releaunifreiburg/HPO-B.
15D Maintenance
We are planning to increase the meta-data set, as new search spaces with a considerable amount of
evaluations are available on the platform. We may also add evaluations from third parties that agree
to be part of the meta-dataset. For any suggestion or technical inquiry, we recommend to use the
issue tracker of our repository.
E Additional Meta-dataset Statistics
In this section, we present further descriptive statistics of the meta-dataset. The histogram in Figure 6a
depicts how many search spaces (out of the 176) contain a specific number of evaluations. At the task
level, the histogram shows a similar pattern in Figure 6b. The Figures 6c and 6d show respectively
the percentage of search spaces and tasks with at least a given number of evaluations. As can be seen,
50% of the tasks have at least 20000 evaluations, and at least 30% contain 40.000 evaluations (out of
1907 tasks).
103
30
Frequency
102
20 Frequency
101
10
100
0 0 20000 40000 60000 80000 100000
1 2 3 4 5 6
Number of evaluations (log) Number of evaluations
(a) Frequency of evaluations per search space. (b) Frequency of the number of evaluations per task.
100 100
Percentage of search spaces
80 80
Percentage of tasks
60 60
40 40
20 20
0 0
1 2 3 4 5 6 0 20000 40000 60000 80000 100000
Number of evaluations (log) Number of evaluations
(c) Percentage of search spaces with a given number of (d) Percentage of search spaces with a given number of
evaluations. evaluations.
Figure 6: Descriptors for the number of evaluations.
On another discourse, the distribution of the response per search-space in the meta-test split can be
observed in Figure 7. It is noticeable that the distributions are multi-modal, due to the fact that they
correspond to the aggregated response of aggregated tasks. It shows how every task has its own scale.
A more-detailed insight of the distribution per dataset is shown in the Figure 8.
F Additional Results
Figures 9, 10, 12, 11, and 15 show the results of the average regret and rank, computed per task for
transfer, non-transfer and acquisition methods. Figure 13 provides a comparison between transfer and
non-transfer methods with respect to the average rank. Moreover, Figure 14 presents detailed results
for the average rank with different acquisition functions, which summarized in the main paper.
16Search space ID: 4796 Search space ID: 5527 Search space ID: 5636 Search space ID: 5859
0
10.0 0 0 0
3 10 6
7.5
2
Density
Density
Density
Density
5.0 4
5
1 2.5 2
0 0.0 0 0
0.5 1.0 0.0 0.5 1.0 0.5 1.0 0.50 0.75 1.00
Accuracy Accuracy Accuracy Accuracy
Search space ID: 5860 0
Search space ID: 5891 0
Search space ID: 5906 0
Search space ID: 5965
8
0
6
4 4 6
4
Density
Density
Density
Density
2 4
2 2 2
0 0 0 0
0.50 0.75 1.00 0.5 1.0 0.6 0.8 1.0 0.50 0.75 1.00
Accuracy Accuracy Accuracy Accuracy
Search space ID: 5970 6 Search space ID: 5971 Search space ID: 6766 Search space ID: 6767
4
0 0
10.0 0
6 0
3 4 7.5 4
Density
Density
Density
Density
2 5.0
2 2
1 2.5
0 0 0.0 0
0.0 0.5 1.0 0.0 0.5 1.0 1.5 0.5 1.0 0.0 0.5 1.0
Accuracy Accuracy Accuracy Accuracy
Search space ID: 6794 Search space ID: 7607 Search space ID: 7609 Search space ID: 5889
0
6
0
6
0
6 0
10
4 4 4
Density
Density
Density
Density
5 2 2
2
0 0 0 0
0.5 1.0 0.50 0.75 1.00 0.5 1.0 0.6 0.8 1.0
Accuracy Accuracy Accuracy Accuracy
Figure 7: Density distribution of the response per search-space.
G Further Data-Preprocessing Details
We explain in more details the data-extraction and pre-processing details for the benchmark. Ad-
ditional information can also be obtained from the codebase in our repository. In the following
explanation, a flow refers to a specific algorithm or search space.
• We list all the existing flows under the tag Supervised Verified Classification. Once we get
the flows, we query all the IDs of the runs associated with this flows. As this process may
overcharge the server, we perform it in batches.
• Subsequently, we perform a selection of flows and datasets by considering only those runs
ID from dataset-flow instances (tasks) that contain more than 5 runs in total. This aims to
decrease the number of runs from noisy small tasks.
• We query the actual runs. As this process may overload the servers, we perform it in batches.
From all the information returned by the API in a Python-like dictionary, we just keep the
keys run_id, task_id, flow_name, accuracy and parameter settings. The last one refers to
the specific hyperparameter configuration.
• As the hyperparameter configurations come as strings, we recast the values to either string,
float or integer.
• We eliminate repeated evaluations and filter out tasks with only one evaluation.
• We group all the evaluations from the same flow but different datasets into a single data-
frame. This allows having a single view of all the hyperparameter configurations used across
datasets for the specific flow.
• We one-hot encode the categorical hyperparameters. Afterward, as some hyperparameter
values may be missing for some datasets within a flow, we input missing values by setting
17Search space ID: 4796 1.0
Search space ID: 5527 1.0
Search space ID: 5636 0.95
Search space ID: 5859
0.9
0.90
0.9
0.9
0.8
0.85
0.8
0.8 0.80
0.7
0.7
0.75
0.7
0.6
0.6
0.70
0.65
0.5
0.5 0.6
0.60
0.4
0.4
0.5
0.55
9 8 3 23 064 065 914 804 31 10101 064 804 914 065 101 31 3 31 37 3902 9977 5923
354 391 990 146 146 9 145 146 145 9 146 10 998 12
0.90
Search space ID: 5860 1.0
Search space ID: 5891 0.95
Search space ID: 5906 1.00
Search space ID: 5965
0.95
0.85
0.90
0.9
0.80 0.90
0.8 0.85
0.75
0.85
0.70 0.7
0.80 0.80
0.65
0.75
0.6
0.75
0.60
0.70
0.5
0.55
0.70
0.65
0.50
0.4
5 6 3 9 9 6 0 1 2 1 8 836 914 903 101 889 49 9946
1 496 997 349 988 389 656 998 389 349 997 391 145 9 3 10 9
1.0
Search space ID: 5970 1.0
Search space ID: 5971 1.0
Search space ID: 6766 1.0
Search space ID: 6767
0.9
0.9
0.8
0.8
0.8
0.8
0.6 0.7
0.6
0.7
0.6
0.4 0.4
0.5
0.6
0.4
0.2 0.2
0.5
37 3492 9952 49 4536 4951 93 54 43 4536 9970 6566 3 4 3 4 1
390 14606 14595 14580 3 1010
1 065 804 064 914 9967 31
3 1 100 39 3 146 145 146 9
1.0
Search space ID: 6794 1.00
Search space ID: 7607 1.0
Search space ID: 7609 0.95
Search space ID: 5889
0.95
0.90
0.9 0.9
0.90
0.85
0.85 0.8
0.8
0.80
0.80
0.7
0.7
0.75 0.75
0.70 0.6
0.6
0.70
0.65
0.5
0.65
04 3 065 101 914 31 65 76 96 13 03 46 67 854 903 967 853 537 923 878 1 8
0.5
145
8
146 10 9 149 1459 38 39 39 99 99 145 3 9 145 34 125 145 997 391
Figure 8: Distribution of the response (accuracy) per task in meta-test (Box-plot ranges are between
0 and 1).
them to zero. After imputation, we create an additional indicator variable per hyperparameter
so that it is 1 if the value was imputed for the configuration and zero otherwise.
• We get rid of hyperparameters which only have one value among the whole flow, as they are
not a differential feature useful for assessing the performance.
• We apply the logarithmic transformation to a manually selected group of hyperparameters.
• Finally, we normalize the values per hyperparameter across the whole flow, so that they vary
between 0 and 1. We do not scale the response.
18You can also read