Curbing action potential generation or ATP synthase leads to a decrease in in cell pyruvate dehydrogenase activity in rat cerebrum slices - Nature
←
→
Page content transcription
If your browser does not render page correctly, please read the page content below
www.nature.com/scientificreports
OPEN Curbing action potential
generation or ATP‑synthase leads
to a decrease in in‑cell pyruvate
dehydrogenase activity in rat
cerebrum slices
Benjamin Grieb1,2*, Sivaranjan Uppala1, Gal Sapir1, David Shaul1, J. Moshe Gomori1 &
Rachel Katz‑Brull 1,3*
Direct and real-time monitoring of cerebral metabolism exploiting the drastic increase in sensitivity
of hyperpolarized 13C-labeled metabolites holds the potential to report on neural activity via in-cell
metabolic indicators. Here, we followed the metabolic consequences of curbing action potential
generation and ATP-synthase in rat cerebrum slices, induced by tetrodotoxin and oligomycin,
respectively. The results suggest that pyruvate dehydrogenase (PDH) activity in the cerebrum is 4.4-
fold higher when neuronal firing is unperturbed. The PDH activity was 7.4-fold reduced in the presence
of oligomycin, and served as a pharmacological control for testing the ability to determine changes
to PDH activity in viable cerebrum slices. These findings may open a path towards utilization of PDH
activity, observed by magnetic resonance of hyperpolarized 13C-labeled pyruvate, as a reporter of
neural activity.
Recent advances in brain imaging have suggested that changes in brain energy metabolism could be monitored
rapidly. Wehrl et al. have demonstrated a quick metabolic response in vivo, in a preclinical positron emission
tomography (PET) study, which showed that whisker barrel stimulation resulted in increased 18FDG uptake1. A
recent study by Grist et al. showed, by magnetic resonance (MR), rapid conversions of hyperpolarized [1-13C]
pyruvate into both [1-13C]lactate and [ 13C]bicarbonate in the brains of healthy v olunteers2. In the latter study, the
sensitivity of detecting carbon-13 labeled metabolites was increased through hyperpolarization by a few orders
of magnitude using the dissolution dynamic nuclear polarization (dDNP) technology3. In recent years, dDNP
has been used to drastically improve the temporal and spatial resolution in comparison to thermal equilibrium
nuclear magnetic resonance (NMR) spectroscopy in multiple preparations4–8. Hyperpolarized [1-13C]pyruvate is
the benchmark metabolite used across different experimental dDNP designs including pioneering clinical studies
on brain cancer imaging9–11. Preclinical studies showed a persistence of the hyperpolarized state in both [1-13C]
lactate and [13C]bicarbonate in the brain of anesthetized rodents12–15, and we have previously shown that cerebral
metabolism can also be measured using hyperpolarized [1-13C]pyruvate ex vivo—in perfused cerebral slices4.
Thermal equilibrium NMR studies in rodent brain slices have shown utility in investigating brain metabolism
over the last three decades16–19. In this setup 31P NMR has been used monitor the viability of slices by the pres-
ence of phosphocreatine and ATP signals16,17.
Using hyperpolarized [1-13C]pyruvate, the activities of both lactate dehydrogenase (LDH) and pyruvate dehy-
drogenase (PDH) can be monitored via the production of hyperpolarized [1-13C]lactate and [ 13C]bicarbonate,
respectively. Using a recently developed acquisition approach termed product selective saturating-excitations,
we have recently shown in perfused tissue slices that the activities of these enzymes can be quantified at a few
seconds resolution and that instantaneous changes in apparent reaction rates can be determined without the
use of kinetic modelling8.
1
Department of Radiology, Hadassah Medical Center, The Faculty of Medicine, Hebrew University of Jerusalem,
9112001 Jerusalem, Israel. 2Department of Psychiatry and Psychotherapie I (Weissenau), Ulm University,
ZfP Suedwuerttemberg, Ravensburg, Germany. 3The Wohl Institute for Translational Medicine, Jerusalem,
Israel. *email: benjamin.grieb@zfp-zentrum.de; rkb@hadassah.org.il
Scientific Reports | (2021) 11:10211 | https://doi.org/10.1038/s41598-021-89534-4 1
Vol.:(0123456789)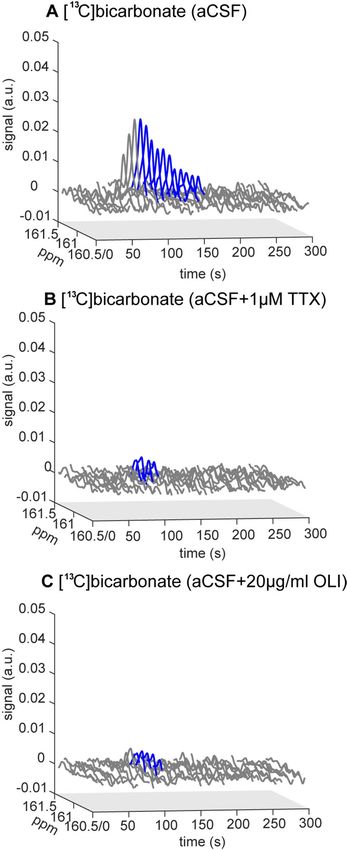
www.nature.com/scientificreports/
Here, we applied the product selective saturating-excitations approach in a study of cerebral slices to inves-
tigate whether changes in neural activity will be reflected in the metabolic activities of hyperpolarized [1-13C]
pyruvate utilization. To this end, we incubated cerebral slices with the canonical voltage-gated sodium-channel
blocker tetrodotoxin (TTX) which is known to either diminish or altogether block action potential generation
at concentrations of 0.2–10 μM20–23. Action potentials of mammalian neurons use sodium influx and potassium
efflux causing a transient change in the resting membrane potential to encode and transmit information. The
ionic gradient changes of this process are restored by the N a+/K+-ATPase pump, requiring metabolic activity
due to the utilization of ATP24. Early studies on neuronal energy metabolism concluded that “the major energy-
consuming function of activated nervous tissue is ion pumping of the sodium pump”19. Modeling of the energy
budget for signaling in the grey matter of rodent brains predicted that the largest proportion of energy (47%) is
consumed by action potentials, followed by postsynaptic glutamate signaling (34%)25. Furthermore, 13C-NMR
spectroscopy revealed that both excitatory glutamatergic and inhibitory GABAergic neurotransmitter cycling and
energy consumption scaled with neuronal activity26. Reverse microdialysis studies on rodent brains showed that
local TTX infusion abolished firing activity of 40–60% of all monitored cells within a tissue sphere of 2 mm22.
Specifically, incubation with 1 μM of TTX blocked the Na+ current in 300–400 µm rat brain slices23. Here we
incubated 350 µm rat cerebral slices with 1 µM TTX to block action potential generation and thus reduce energy
demand significantly. As a control, we have used cerebral slices that have not experienced any insult in the form
of a pharmacological challenge. In addition, the TTX effect was also compared the effect of the antibiotic oligo-
mycin (OLI27), which is an inhibitor of ATP-synthase.
Materials and methods
Preparation of cerebral slices. The joint ethics committee (IACUC) of the Hebrew University and Hadas-
sah Medical Center approved the study protocol for animal welfare (Ethical Protocol No. MD-16-14739-1). The
Hebrew University is an AAALAC International accredited institute. The study was carried out in compliance
with the ARRIVE guidelines28. The authors confirm that all experiments were performed in accordance with rel-
evant guidelines and regulations. Female Sprague–Dawley rats (n = 7, 3–5 months old, 132–160 g) were obtained
from the Hebrew University Authority of Biological and Biomedical Models. Care was taken to minimize pain
and discomfort to the animals. Animals were housed in the animal facilities 3–5 days after delivery for acclima-
tization and fed ad libitum. On the experimental day, animals were transferred to the lab and anesthetized within
one hour of arrival. After induction of deep anesthesia using isoflurane, transcardial perfusion, decapitation, and
rapid brain removal were performed. The cerebellum was separated from the cerebrum and only the cerebrum
was used in the current study. Slicing on a McIlwain tissue slicer to 350 μm thickness followed, and the obtained
cerebral slices were separated into two batches and stored in oxygenated (95/5% O2/CO2) artificial cerebrospinal
fluid (aCSF) at room temperature. This process is demonstrated in Fig. 1, which was modified from Harris et al.4.
Chemicals. N-methyl-D-glucamine (NMDG), oligomycin from Streptomyces diastatochromogenes, and all
other chemicals for solutions were obtained from Sigma-Aldrich (Rehovot, Israel). Tetrodotoxin was obtained
from Alomone labs (Jerusalem, Israel). The OX063 radical (GE Healthcare, UK) was obtained from Oxford
Instruments Molecular Biotools (Oxford, UK). [1-13C]pyruvic acid was purchased from Cambridge Isotope Lab-
oratories (Tewksbury, MA, USA). The anesthetic isoflurane was obtained from the Hebrew University Authority
for Biological and Biomedical Models.
Solutions. To improve the health of acute cerebrum slices obtained from mature adult rats we modified a
slice preparation technique optimized for in vitro electrophysiology in mature adult rat brain slices29,30. Ting
et al.29 showed that the presence of NMDG during a 12 min recovery phase after slicing dramatically improved
the health of acute slices from mature adult rats in electrophysiological recordings. NMDG is used as an extra-
cellular replacer of sodium ions to prevent sodium ion and water influx into cells as the main insult causing cell
death following brain slicing. Furthermore, incubation in HEPES-buffered artificial cerebrospinal fluid (aCSF)
resulted in improved slice health29. Here, altogether six solutions were prepared for each experiment:
Solution 1. The NMDG-aCSF used for the brain perfusion procedure, tissue slicing, and slice recovery con-
tained 93 mM NMDG, 2.5 mM KCl, 1.2 mM N aH2PO4, 26 mM N aHCO3, 20 mM HEPES, 25 mM D-glucose,
10 mM MgCl2, 0.5 mM C
aCl2, 5 mM ascorbic acid, 2 mM thiourea, and 3 mM pyruvic acid in double distilled
water.
Solution 2. The HEPES-holding aCSF contained 84 mM NaCl, 2.5 mM KCl, 1.2 mM NaH2PO4, 30 mM
aHCO3, 20 mM HEPES, 25 mM D-glucose, 2 mM MgCl2, 2 mM CaCl2, 5 mM ascorbic acid, 2 mM thiourea,
N
and 3 mM pyruvic acid in double distilled water.
Solution 3. The aCSF used for perfusion in the NMR spectrometer contained 115 mM NaCl, 2.5 mM KCl,
1.2 mM NaH2PO4, 24 mM NaHCO3, 5 mM HEPES, 10 mM D-glucose, 2 mM M gCl2, and 2 mM C aCl2 in double
distilled water containing 10% D2O.
All three solutions (1–3) were bubbled with 95%/5% O2/CO2 for at least 1 h prior to use and titrated to a pH
of 7.2–7.4 using HCl and/or NaOH. All concentrations were optimized to result in a calculated osmolarity of
310 ± 15 mOsm.
Scientific Reports | (2021) 11:10211 | https://doi.org/10.1038/s41598-021-89534-4 2
Vol:.(1234567890)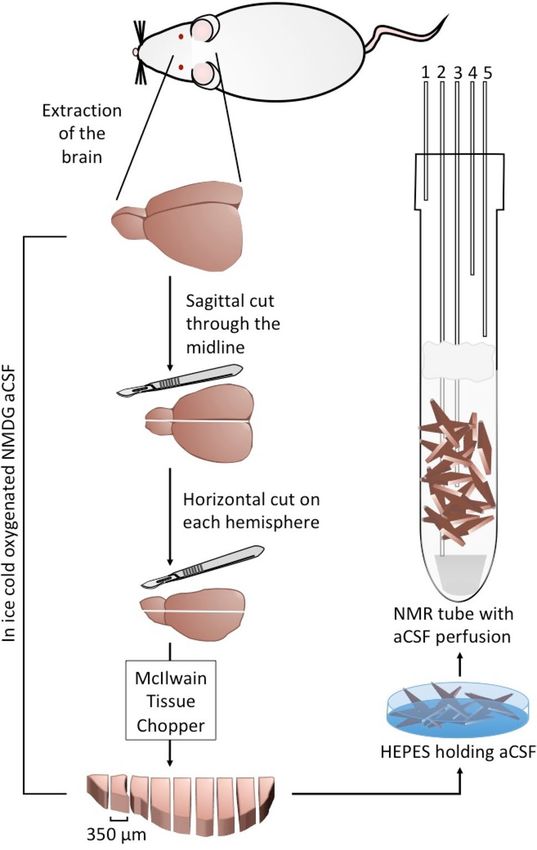
www.nature.com/scientificreports/
Figure 1. Schematic drawing of the surgery and the cerebrum slicing procedure. Following brain extraction,
separation of the cerebellum, slicing of the cerebrum, and recovery period in HEPES-holding aCSF, the cerebral
slices were placed in a 10 mm NMR tube with continuous perfusion of aCSF (Solution 3 below) and bubbled
with 95%/5% O2/CO2 at 37 °C at a rate of 4 L/min. The lines going in and out of the NMR tube are marked as
follows: 1. Humidified 95%/5% O2/CO2 atmosphere; 2. aCSF inflow line; 3. NMR compatible temperature probe;
4. Backup aCSF outflow line; 5. aCSF out-flow line. A filter made of cotton balls (colored gray in the Figure)
was placed a few cm above the slices to prevent suction of the occasional floating slice into the out-flow lines.
The slices were kept at the bottom of the tube at the region visible to the NMR probe due to gravity and possible
inter-slice adhesion and the gentle perfusion generally did not displace them. A spacer made of solid PEEK was
placed at the bottom of the tube prior to placing the slices in the NMR tube. This was done to raise the slices to
the level observed by the NMR probe without the introduction of susceptibility differences at the region of the
probe, thereby optimizing the use of cerebral tissue in each experiment.
Solution 4. The dissolution buffer contained 77 mM NaCl, 2.5 mM KCl, 15.7 mM TRIS, and 50 mM phosphate
buffer and was titrated to reach a pH of 7.2–7.4 upon addition of 43 mM pyruvic acid.
Solution 5. A high solvent solution (6 × concentrated, i.e. 15 mM KCl, 7.2 mM N aH2PO4, 60 mM D-glucose,
12 mM MgCl2, and 12 mM C aCl2) was added to the dissolution buffer after dissolution to bring these solute
concentrations in the hyperpolarized medium administered to the slices as close as possible to their concentra-
tion in Solution 3.
Solution 6. 6 mL of Solution 4 mixed with 2 mL of Solution 5. The solution was placed in a conical tube at the
fringe field of the magnet and was bubbled with 95%/5% O2/CO2 and pre-warmed in a 40 °C water bath.
Solution 6 together with the 4 mL of Solution 4 containing the hyperpolarized [1-13C]pyruvate make the
hyperpolarized medium that was administered to the cerebrum slices.
Surgery and slice handling. The procedure for obtaining rat cerebrum slices and handling them is
depicted schematically in Fig. 1. We induced gaseous anesthesia with 3.5% isoflurane at a flow rate of 440 mL/
min using a gas anesthesia system (Somnosuite, Kent Scientific, Torrington, CT, USA) and maintained deep
Scientific Reports | (2021) 11:10211 | https://doi.org/10.1038/s41598-021-89534-4 3
Vol.:(0123456789)www.nature.com/scientificreports/
anesthesia at 2.8–3.2% isoflurane at the same flow rate. After confirming a deep anesthesia level by a negative
pedal pain reflex, the animals were transcardially perfused using 30 mL of ice-cold NMDG-aCSF (Solution
1). The animals were then sacrificed by decapitation. The brain was rapidly removed and placed in ice-cold
NMDG-aCSF (Solution 1). The cerebellum was separated and the cerebrum was cut into four parts (sagittal
along the hemispheric cleft and horizontally). 350 µm slices were prepared from each block using a McIlwain
tissue chopper (The Mickle Laboratory Engineering Company Ltd., Surrey, UK). Care was taken that the process
of brain extraction, from decapitation till the brain was in the ice-cold aCSF, lasted less than 2 min and the slic-
ing procedure was done in less than 8 min. After cutting, the slices were transferred to 32–34 °C warm NMDG-
aCSF (Solution 1) for 12 min for protective recovery. Then, the slices were transferred to HEPES-holding aCSF
(Solution 2) at ~ 32 °C for 15–30 min incubation before transfer to the NMR spectrometer, where the slices were
perfused with the aCSF of Solution 3. The second batch of cerebrum slices was kept in the HEPES-holding aCSF
(Solution 2) at room temperature (25 °C) for 3–5 h prior to transfer to the NMR spectrometer.
DNP spin polarization and dissolution. Spin polarization and fast dissolution were performed on a
dissolution-DNP spin polarizer (HyperSense, Oxford Instruments Molecular Biotools, Oxford, UK) operating
at 3.35 T. Microwave frequency of 94.110 or 94.114 GHz was applied for the polarization of a [1-13C]pyruvic acid
formulation at 1.5 K. The formulations included 11.1 to 14.0 mM OX063 radical. The amount of [1-13C]pyruvic
acid formulation placed in the polarization cup was 15 ± 0.5 mg which was dissolved in 4 mL of dissolution
buffer (Solution 4). The dissolution was pressure ejected into a conical tube, which contained 6 mL of Solution 4
mixed with 2 mL of Solution 5. The waiting solution in the conical tube was bubbled with 95%/5% O 2/CO2 and
pre-warmed in a 40 °C water bath (Solution 6).
NMR Spectroscopy. 31
P and 13C NMR spectroscopy were performed in a 5.8 T high resolution NMR spec-
trometer (RS2D, Mundolsheim, France) using a 10 mm broad-band NMR probe. Homogeneity optimization
(shim) was performed using the water signal on the 1H channel and using the lock system. To support the latter,
the aCSF was supplemented with 10% D 2O in all of the experiments. 31P spectra were acquired with 1,640 scans
over a total scan time of 30 min with a repetition time of 1.1 s and a flip angle of 50°. 13C spectra of metabolites
in a hyperpolarized state were acquired using product selective saturating-excitation p ulses8, applying 2.5 ms
cardinal sine (sinc) pulses specifically designed to excite hyperpolarized [1- C]lactate and hyperpolarized [13C]
13
bicarbonate at a 90° nutation angle. Selective excitation for [1-13C]lactate and [13C]bicarbonate was done con-
secutively, with 4 s intervals, resulting in an 8 s interval for each metabolite. That is, we measured the accu-
mulated production for both hyperpolarized [1-13C]lactate and [13C]bicarbonate within 8 s. For [1-13C]lactate
detection the pulse was centered on the [1-13C]pyruvate hydrate frequency (179.4 ppm). For [13C]bicarbonate
acquisition, the pulse was centered 214 Hz down-field of the [13C]bicarbonate frequency (161 ppm). The same
acquisition strategy was previously applied for studies on other perfused tissue slices5–7. Hyperpolarized [1-13C]
pyruvate experienced a flip angle of 1.07° and 4.5° in the respective selective excitations of [1-13C]lactate and
[13C]bicarbonate acquisitions. The following parameters were used for the selective RF pulses: sinc shape, 2.5 ms
pulse width, 24% amplitude (an RS2D system specific parameter), 45 dB attenuation power, 10.884 kHz offset for
[1-13C]lactate excitation, and 9.063 kHz offset [ 13C]bicarbonate excitation. The response profile of this RF pulse
can be found in the Supporting Information of Adler-Levi et al.7.
Experimental workflow and setup. The NMR experiments in cerebrum slices were carried out as previ-
ously described4 with a few modifications. The cerebrum slices from the whole cerebrum were pooled together
and then divided into two approximately evenly sized batches. While the first batch (Batch 1) was taken to the
NMR spectrometer after 15–30 min of recovery in HEPES-holding aCSF (Solution 2), the second batch (Batch
2) was stored in the HEPES-holding aCSF for 3–5 h until the NMR experiment. We adopted this scheme because
we found that the volume of the slices resulting from an entire rat cerebrum exceeded the volume visible by the
NMR probe often by two-fold.
Experimental workflow and setup. Cerebrum slices were continuously perfused with aCSF (Solution
3) at a flow rate of 4 mL/min. Two hundred mL of this aCSF solution were cycled between a reservoir bottle
immersed in a 40 °C water bath and the NMR tube. The reservoir was continuously bubbled with humidified
95% O2/5% CO2. Inflow and outflow into/from the NMR tube was delivered via medical grade extension tubes
and pumped in a closed circle with a peristaltic pump (Masterflex L/S Analog Pump Systems, Cole-Parmer, IL,
USA). The inflow and outflow lines were connected to thin polyether ether ketone (PEEK) lines (inner diam-
eter 0.040″, Upchurch Scientific, Inc., Oak Harbor, WA, USA). The magnetic susceptibility of PEEK is similar
to water and therefore can be used during NMR spectroscopy recordings. The inflow line was located directly
above a PEEK spacer, which ensured that the cerebrum slices were held in the sensitive zone of the NMR probe
(Fig. 1). We also fixed an NMR compatible temperature probe (Osensa, BC, Canada) at the center of the probe
to monitor temperature changes. To prevent slices from floating to the upper end of the NMR tube, we attached
a small cotton patch approximately 8 cm above the active zone to the inflow line. Two out-flow lines, a main and
a backup, spaced approximately 10 and 12 cm above the bottom of the probe delivered the out-flow at higher
flow rates than the inflow to avoid overflow of the tube inside the spectrometer (Fig. 1). The temperature in the
NMR tube inside the spectrometer was calibrated to 34–36 °C using the spectrometer’s temperature regulator
(hot air flow).
The administration of hyperpolarized media to the cerebrum slices was done using a bypass constructed
of medical grade tubing and 3-way valves as previously d escribed7, to obtain constant perfusion with oxygen-
ated hyperpolarized media with solute concentrations as close as possible to Solution 3, with the exception of
Scientific Reports | (2021) 11:10211 | https://doi.org/10.1038/s41598-021-89534-4 4
Vol:.(1234567890)www.nature.com/scientificreports/
Batch 1** Batch 2**
Animal no.* Injection 1 Injection 2 Injection 1 Injection 2
1 NA NA aCSF OLI (OLI1)
2 aCSF TTX (TTX1) aCSF OLI (OLI2)
3 aCSF TTX (TTX2) aCSF OLI (OLI3)
4 NA NA aCSF TTX (TTX3)
5 aCSF aCSF (CTL1) aCSF aCSF (CTL2)
6 aCSF aCSF (CTL3) NA NA
7 aCSF aCSF (CTL4) aCSF aCSF (CTL5)
Table 1. Detailed description of hyperpolarized [1-13C]pyruvate injections and the experimental groups.
*The animal number corresponds to the chronological order of the experiments. **Batch 1 and Batch 2 were
obtained from the same animal. Batch 2 was investigated after Batch 1. NA: Data excluded due to technical
difficulties during the experiment. aCSF, no pharmacological challenge. TTX, cerebrum slices incubated with
tetrodotoxin; OLI, cerebrum slices incubated with oligomycin. The identifiers TTX1-3, OLI1-3, and CTL1-5
correspond with the data presented in Tables S1 and S2 in the supporting information.
14 mM of hyperpolarized [1-13C]pyruvate. During regular aCSF perfusion (i.e. the time in between injections),
the bypass was shunted by 3-way valves controlling its in- and out-flows. For injections, the hyperpolarized
dissolution medium (Solution 4 with hyperpolarized [1-13C]pyruvate) was mixed with the concentrated aCSF
solution (Solution 5) which was pre-saturated with humidified 95% O 2/5% CO2 in a conical tube. The mixture
was pressure-injected into the bypass tube using a manifold, thereby ejecting the fluids stored therein into a
bin. The length of the bypass tube was adjusted to allow intake of 10 mL of this mixture. That is, 2 mL of this
solution were ejected into a bin to ensure that the solution, which would be pumped into the NMR tube, was
freshly oxygenated hyperpolarized medium with appropriate solute concentrations. After pressure-filling of
the bypass with hyperpolarized medium, the 3-way valves controlling in-flow from the perfusion system to
the bypass and out-flow from the bypass into the NMR tube were opened. Now, the peristaltic pump was able
to push the hyperpolarized medium out of the bypass and into the NMR tube containing the cerebrum slices
at a constant flow rate of 4 mL/min. We note that this constant perfusion system and the administration of the
hyperpolarized medium using constant perfusion eliminated the slice motion that was associated with bolus
injections described p reviously4.
As summarized in Table 1, we performed 11 paired injections (i.e. 11 first and 11 s injections, in total 22
injections) of hyperpolarized [1-13C]pyruvate in batches obtained from 7 different rats. Five of these paired
injections were performed on Batch 1 and six were performed on Batch 2. Each sample contained slices from
one animal’s cerebrum: A first injection was performed after ~ 45 min of constant aCSF perfusion (n = 11), and
a second injection after ~ 45 min of incubation with either TTX (1 µM, n = 3), OLI (20 µg/ml, n = 3), or regular
aCSF (n = 5). 31P NMR spectra were recorded prior to each injection of hyperpolarized material to confirm the
viability of the slices by the presence of phosphocreatine and ATP signals. 13C spectra were recorded during the
administration of the hyperpolarized medium to the slices as described above.
Data analysis and statistics. Spectral processing was performed using MNova (Mestrelab Research, San-
tiago de Compostela, Spain). Integrated intensities were calculated with MNova.
The significance of the differences between injections (i.e. before and after treatment) were tested using a
paired Student’s t-test.
Apparent metabolic rates and total production calculation. As we have used product selective
saturating-excitation pulses8, the hyperpolarized metabolites were fully sampled (and depolarized) by each
selective pulse, and only newly synthetized hyperpolarized metabolites were detected on the next excitation.
The observed signal was equivalent to the accumulation of the specific metabolite in between two consecutive
pulses5–8 (8 s). To quantify the corresponding metabolite production level, the [1-13C]pyruvate signal was used
as a reference. To ensure appropriate referencing, we selected a temporal window at which the [1-13C]pyruvate
concentration was constant (and known). In this way, the production of [1-13C]lactate and [13C]bicarbonate
could be expressed in nmol/s as previously described5–7 and explained in detail below. The [1-13C]pyruvate
concentration in the NMR tube first increased during the wash-in phase, then reached a plateau at a maximal
concentration of 14 mM for at least 1 min, then decreased– during the wash-out phase. To be able to deter-
mine the temporal window at which the [1-13C]pyruvate concentration was maximal and constant (plateau), the
[1-13C]pyruvate signal was corrected for signal decay due to T 1 relaxation and RF pulsation, using an effective
relaxation constant, Teff. Teff was determined to be 58 s according to its ability to correct the [1-13C]pyruvate decay
curve to display these flow characteristics (wash-in, plateau and wash-out). The corrected [1-13C]pyruvate signal,
SPyr_corr (t), was calculated using Eq. 1,
SPyr (t)
SPyr_corr (t) =
(− T t ) (1)
e eff
Scientific Reports | (2021) 11:10211 | https://doi.org/10.1038/s41598-021-89534-4 5
Vol.:(0123456789)www.nature.com/scientificreports/
Figure 2. A typical example of hyperpolarized [1-13C]pyruvate metabolic conversion in cerebrum slices over
the time course of one recording, shown as a stack plot of 13C NMR spectra. The [1-13C]lactate, [1-13C]pyruvate-
hydrate, and [1-13C]pyruvate signals were obtained with one product selective pulse and the [ 13C]bicarbonate
and [1-13C]pyruvate signals with a consecutive product selective pulse. The two pulses were consecutively
applied throughout the measurement using an interleaved pulse sequence. For demonstrative purpose we
combined the spectra of both interleaved pulses into one stacked 3D plot and omitted the [1-13C]pyruvate signal
from the [ 13C]bicarbonate spectra. The [1-13C]pyruvate and [1-13C]pyruvate-hydrate signals were truncated
to allow dynamic range for visibility of the [13C]bicarbonate signal. The black bar on the right indicates the
duration of constant concentration of hyperpolarized [1-13C]pyruvate in the hyperpolarized media perfusing the
slices.
where SPyr (t) is the measured [1-13C]pyruvate signal. Only the time points within the plateau phase of the cor-
rected [1-13C]pyruvate signal were used for apparent metabolic production rate determinations. These time points
were selected using a criterion of no more than 10% deviation from the first maximum value of the SPyr_corr (t)
curve, as previously d escribed7.
The apparent metabolite production rate was calculated using Eq. 2,
Vm SPro (t) sin(θpyr)
υproduct (t) = Pyr × × ×( ) (2)
TR Spyr (t) sin(θpro)
where υproduct (t) is the apparent production rate of [1-13C]lactate or [ 13C]bicarbonate at each time point , Pyr
13
is the maximal [1- C]pyruvate concentration that could be delivered, which is known to be 14 mM, Vm is the
volume occupied by the medium in the NMR probe sensitive region (estimated to be 0.5 mL), TR is the excita-
tion interval for each metabolite which is 8 s for both [1-13C]lactate and [ 13C]bicarbonate, θpro is the flip angle
of the product (90°), and θpyr is the flip angle of [1-13C]pyruvate (1.07° on [1-13C]lactate acquisitions and 4.5°
on [13C]bicarbonate acquisitions), Spro (t) is the signal of [1-13C]lactate or [ 13C]bicarbonate at each time point,
and Spyr (t) is the [1-13C]pyruvate signal in the same spectrum. We note that in this approach, T1 relaxation
and variations in T1 of the order of the relevant T 1s (substrate and metabolites in this study), do not affect the
observed metabolites formation r ate8.
Total production was calculated point by point, i.e. as the sum of all υproduct (t) calculated from the individual
spectra showing a discernable and quantifiable hyperpolarized metabolite signal multiplied by TR (as opposed
to multiplying the average of υproduct (t) by TR).
Results
A typical example of the measured signals and their time course is presented in Fig. 2. The temporal behavior of
[1-13C]pyruvate metabolism was assessed by calculating the time-dependent production of [1-13C]lactate (LDH
rate) and [ 13C]bicarbonate (PDH rate) for each acquisition. The obtained apparent rates were used for further
analysis only for those time points where the concentration of hyperpolarized [1-13C]pyruvate was constant
(and therefore known) as it was used as a reference for quantification (Methods). The duration at which each
of the metabolite signals was observable within the time frame of constant hyperpolarized [1-13C]pyruvate
Scientific Reports | (2021) 11:10211 | https://doi.org/10.1038/s41598-021-89534-4 6
Vol:.(1234567890)www.nature.com/scientificreports/
Apparent production rate Apparent total production
Injection number (nmol/s) Detection duration (s) (nmol)
a
1 4.82 ± 1.29 56.0 ± 6.7 301.7 ± 93.4
aCSF control
2 4.12 ± 1.00 48.0 ± 4.4 219.9 ± 46.4
1 5.88 ± 1.45 56.0 ± 4.6 388.2 ± 113.3
Tetrodotoxin (1 µM)
2 4.14 ± 0.64 77.3 ± 7.1 359.8 ± 81.6
1 3.07 ± 0.38 58.67 ± 10.67 197.7 ± 14.4
Oligomycin (20 µg/ml)
2 4.31 ± 0.39 50.67 ± 5.33 254.5 ± 39.1
b
1 0.41 ± 0.07 57.6 ± 5.9 26.7 ± 4.2
aCSF control
2 0.26 ± 0.05 65.6 ± 4.7 19.4 ± 3.4
1 0.34 ± 0.02 69.3 ± 5.3 25.8 ± 0.7
Tetrodotoxin (1 µM)
2 0.16 ± 0.02 29.3 ± 2.7 6.0 ± 0.6
1 0.29 ± 0.04 72.0 ± 4.6 23.2 ± 2.5
Oligomycin (20 µg/ml)
2 0.11 ± 0.01 21.3 ± 5.3 3.4 ± 0.8
Table 2. a LDH activity—apparent [1-13C]lactate production rates. b PDH activity—apparent [13C]
bicarbonate production rates. All values are given as mean ± standard error of the mean. For TTX and OLI,
Injection 1 is before incubation and injection 2 is after incubation.
concentration in the medium was determined using a threshold on the respective signal-to-noise ratio. A sum-
mation of the respective apparent rates of production over the observable duration provided the respective total
production. Table 2a and 2b report on LDH and PDH activities, respectively.
This analysis showed that both TTX and OLI incubation resulted in drastic changes to PDH activity. A typical
appearance of these effects is shown in Fig. 3. Figure 4B and Table 2b show that TTX incubation reduced the total
[13C]bicarbonate production 4.4 ± 0.5 fold (n = 3), and OLI incubation reduced the total [13C]bicarbonate produc-
tion 7.6 ± 1.9 fold (n = 3). Both induced reductions of [13C]bicarbonate production were significant (p = 0.004 and
p = 0.015 for TTX and OLI, respectively, injection 1 and 2 are paired). Such changes were not visible in control
aCSF experiments without pharmacological manipulation (a non-significant 1.5 ± 0.2 fold reduction in total [13C]
bicarbonate production, n = 5, p = 0.109, injection 1 and 2 are paired). This decrease in total observed [13C]bicar-
bonate production was due to two contributing changes: 1) the time course of the [13C]bicarbonate signal showed
a much earlier termination of detectable PDH activity after both TTX (2.4 ± 0.4 fold shorter, n = 3, p = 0.038)
and OLI incubation (3.8 ± 0.9 fold shorter, n = 3, p = 0.034). Both durations significantly deviated from the dura-
tions observed in the control regular aCSF incubations (Table 2b, non-paired comparisons done on injections
2, p = 0.0014 for TTX vs. control aCSF experiments, and p = 0.00094 for OLI vs. contral aCSF experiments); 2)
the mean apparent PDH rate averaged over these respective observation durations significantly dropped as well
under TTX (2.1 ± 0.3 fold lower, n = 3, p = 0.033) and under OLI (2.6 ± 0.4 fold lower, n = 3, p = 0.043). Compar-
ing the averaged apparent LDH rates (i.e. the conversion of [1-13C]pyruvate to [1-13C]lactate, Table 2a) for the
three groups did not reveal statistically significant differences for the TTX group (p = 0.3) and the control aCSF
group (p = 0.12), but for the OLI group a slight 1.4 fold increase was significant (p = 0.024). The entire dataset is
provided in the Supporting Information (Note S4).
Regarding OLI incubation, an increase in [1-13C]lactate production was hypothesized due to shifting the cells
away from ATP synthesis due to ATP-synthase inhibition. However, we did not find significant differences in
the mean apparent LDH rate and apparent total production (Fig. 4A, Table 2a). In addition, the duration of the
reliably detected [1-13C]lactate signal (sufficient SNR) did not show significant differences either.
Discussion
We show that the shutdown of action potential generation induced by 45 min incubation with 1 µM TTX
diminishes the ability to produce bicarbonate form exogenous pyruvate. Furthermore, a similar change was also
evident after incubation with the antibiotic OLI. Nevertheless, we show that the activity of LDH is not affected
under both conditions. The production of lactate from pyruvate relies on pyruvate transport into the cell and
activity of the LDH enzyme. However, the production of C O2 (followed by conversion to bicarbonate) requires
an additional transport process, across the mitochondrial inner m embrane23 and the activity of PDH. Because
LDH activity (as determined by hyperpolarized [1-13C]lactate production) was not modified by both conditions
it appears that the transport of pyruvate across the plasma membrane and the activity of LDH in the cytosol were
not affected by these two conditions. These results may suggest that 1) with regards to OLI incubation, LDH
activity is not dependent on ATP-synthase activity for the durations investigated, i.e. that the NADH and NAD+
levels in the cytosol, which are cofactors for this reaction, were not significantly altered; and 2) with regards to
TTX incubation, it appears that the reduced energy demand in the absence of action potentials did not lead to
downregulation of LDH activity.
Reduced bicarbonate production could suggest that either the mitochondrial transport of pyruvate was
affected or that the activity of PDH was affected. Mitochondrial pyruvate carriers facilitate the transport of
pyruvate across the inner mitochondrial membrane. These carriers are symporters that use the proton gradient.
Scientific Reports | (2021) 11:10211 | https://doi.org/10.1038/s41598-021-89534-4 7
Vol.:(0123456789)www.nature.com/scientificreports/
Figure 3. Typical hyperpolarized [13C]bicarbonate signal over time, acquired after incubations with aCSF
(control), TTX, and OLI. (A) Incubation with aCSF (control). (B) Incubation with 1 µM TTX. (C) Incubation
with 20 µg/ml OLI. The part of the spectrum shown in blue color is the [ 13C]bicarbonate signal used for
the analysis of [13C]bicarbonate production (i.e. with sufficient SNR and under a constant [1-13C]pyruvate
concentration). The relative intensities of these signals may be better appreciated with a collapsed time axis
presented in Fig. S1 (Supporting Information).
Scientific Reports | (2021) 11:10211 | https://doi.org/10.1038/s41598-021-89534-4 8
Vol:.(1234567890)www.nature.com/scientificreports/
A [1-13C]lactate B [13C]bicarbonate
700 40
600 35
Total production (nmol)
Total production (nmol)
30
500
25
400
20
300
15
200
10
100 5
0 0
Inj 1 Inj 2 Inj 1 Inj 2
Figure 4. The total apparent production of [1-13C]lactate and [ 13C]bicarbonate prior to and following
incubation with TTX, OLI, and aCSF (control). (A) The total production of [1-13C]lactate. (B) The total
production of [13C]bicarbonate. TTX, tetrodotoxin, solid red lines; OLI, oligomycin, solid blue lines; Control,
regular aCSF, dashed grey lines; Inj1, rates calculated on the first injection following perfusion with regular CSF;
Inj2, rates calculated on the second injection, i.e. following perfusion with aCSF supplemented with TTX, OLI,
or without supplements (Control).
Because OLI incubation will increase rather than decrease the proton gradient across the mitochondrial
membrane31, it appears unlikely that the cause for decreased bicarbonate production under OLI incubation is
reduced transport across the mitochondrial membrane. As regards to TTX incubation, we cannot speculate why
such an incubation could lead to a decrease in pyruvate transport into the mitochondria.
PDH activity is regulated by pyruvate dehydrogenase kinase (PDK). Phosphorylation of PDH by PDK inacti-
vates PDH31. PDK is activated by increased ratios of [ATP]/[ADP] and [NADH]/[NAD+]31. In the following we
will provide potential explanation for reduced PDH activity under both OLI and TTX incubation.
OLI is an inhibitor of ATP-synthase which prevents protons from passing back into the mitochondria leading
to shutdown of the proton pumps as the gradients become too high for their operation. In this way, OLI inhibits
both the conversion of ADP to ATP and the transport of protons into the mitochondria32. NADH remains high
and NAD+ is too low for citric acid cycle operation31. We suggest that the resulting high [NADH]/[NAD+] ratio
likely activated PDK thereby leading to reduced PDH activity explaining the observation of reduced bicarbonate
production activity under OLI incubation.
TTX inhibits the generation of action potentials and therefore the consumption of ATP is likely reduced. This
may have led to an increase in mitochondrial ATP, and therefore the of [ATP]/[ADP] ratio. This could activate
PDK and therefore reduce PDH activity, likely explaining the reduced bicarbonate production activity under
TTX incubation.
Hence, we showed that the changes in pyruvate metabolism following functional manipulation of neurons
are drastic and comparable to the changes induced by blockage of a vital metabolic flux. We do note that since
neuronal firing is dependent on energy supply, metabolism may constrain neuronal firing33. Therefore, although
both agents used here have different targets, we cannot exclude the possibility that a decrease in energy supply
(ATP synthesis) that followed OLI incubation lead to cessation of neuronal firing and therefore in fact both
conditions used here led to the loss of neural electrical activity.
Although TTX effects on metabolism have been researched already in the 1970s and 1 980s20,21, to the best
of our knowledge, its possible effect on PDH activity has not been reported. TTX has been used to modulate
metabolism in several s tudies22,34,35. Nevertheless, it is still not clear whether the dominant energy substrate for
neurons is glucose or lactate, and the relative contributions of glycolysis and oxidative phosphorylation remain
under debate, as well their cellular origin (neurons vs. astrocytes)22. Regardless, here, TTX utilization enabled 1)
differentiation between cerebrum slices with and without action potential generation ability and 2) demonstra-
tion of consequent in-cell changes in PDH activity. Such changes to in-cell enzymatic activities are not amenable
for assessment in brain slices using other methodologies. Moreover, the dDNP-MR technology is translational
and this sets the importance of the current finding of PDH activity as a potential in vivo non-invasive marker of
brain function, subject to the limitations discussed below.
The ex vivo cerebral slices setup for NMR spectroscopy of hyperpolarized metabolites has several advantages
over in vivo preclinical setups for studying the effects of neuronal shutdown on metabolism. First and foremost,
the pharmacological conditions used here may be difficult to implement in vivo because they are likely to lead
to permanent or transient block of nerve activity (TTX) or to acidosis (OLI). Second, a couple of technical
advantages are that 1) the measured products are not contaminated with metabolites produced in the body and
transported to the b rain13; and 2) voxel contamination related to the point-spread-function that results from the
acquisition/processing is avoided. This is because voxels of in vivo brain studies may contain differing amounts of
both blood and brain tissue13 but the ex vivo preparation contains only cerebral tissue. In addition, a confound-
ing factor concerning in vivo rodent experiments involves the blood–brain-barrier (BBB) transport kinetics via
Scientific Reports | (2021) 11:10211 | https://doi.org/10.1038/s41598-021-89534-4 9
Vol.:(0123456789)www.nature.com/scientificreports/
monocarboxylate transporters36 and their dependence on the anesthesia u sed14. Ex vivo, the BBB is severed and
thus the arrival of hyperpolarized pyruvate to the cell is likely faster, as is the case for a disturbed BBB in vivo10.
The technical limitations of the current experimental set-up were described in detail e lsewhere4. Briefly, our
results are limited by the fact that, first, the acute cerebrum slice model arguably involves tissue damage and
certainly suffers from regions of limited viability, despite our efforts to obtain healthy slices, adopting recent
changes in slice preparation guidelines for mature r odents29,30. It is also likely that the lengthy duration of our
two-phase experiments resulted in mild deterioration of slice viability over time, although this process could
not be traced in a statistically significant manner as LDH and PDH activities or ATP and PCr content in control
experiments (Supporting Figs. S2 and S3).
In addition, we note that our ex vivo setup does not inform about cerebral area or tissue type specific changes
in metabolism, as the reported apparent rates were derived from the whole cerebrum. Hence, regional differences
in TTX- or OLI-induced neuronal activity may be diluted by unaffected tissue. In another aspect, although TTX
blocks sodium-channels specifically, the data do not differentiate between neuronal or glial metabolic changes
following this blockage.
In addition, we note the difficulty in performing parallel biochemical / electrophysiological studies in the
same slices. It is important to note that the slices perfused within the NMR tube define of the investigation sys-
tem. One cannot perform classical biochemical assays or electrophysiology measurements within the NMR tube
within the spectrometer. However, the effects of TTX on neural tissues are well s tudied20–23 and OLI is a veteran
ATP-synthase inhibitor31. It may be that the confined space within the NMR tube limits the viability and health
of the slices compared to a single slice that is perfused within a typical electrophysiological setup. Nevertheless,
in practice this cannot be investigated in parallel.
The studies on two batches of cerebral slices taken from the same rat reduce the number of rats used per study
and are in line with the guidelines for current ethical protocols. Unfortunately, due to technical problems with
Batch 1 in animals 1 and 4, all of the OLI experiments were done with batch 2. Although 31P data and hyper-
polarized [1-13C]lactate production data do not hint to any differences between Batch 1 and Batch 2 (p = 0.7,
p = 0.3, and p = 0.2 for [1-13C]lactate production in the TTX, OLI, and control aCSF experiments, respectively),
to make sure that the Batch 2 is not different from the Batch 1, it may also be useful to inspect the slices’ histo-
pathological features after each experiment. Apoptosis/necrosis staining, and a visual inspection of neuronal
cell bodies for signs of swelling or shrinkage may be informative. Unfortunatly this was not done for the current
experimental groups.
Acknowledging these limitations, the results presented here could be a first indication that monitoring the
metabolism of hyperpolarized [1-13C]pyruvate to [13C]bicarbonate could serve as a non-invasive reporter for
inhibition of action potential generation, at very short time scales, potentially with high sensitivity. In an attempt
to speculate on the relevance of the current finding to the clinical setting, the TTX group could be viewed as
a model system for live but inactive (non/low firing) neural tissue. OLI was used here as a tool of metabolic
intervention that is not specific for neurons. We note that previous studies have used OLI as a model for mito-
chondrial respiratory chain d ysfunction37.
The potential ability to detect live but non/low firing neural tissue non-invasively could impact both basic
and clinical neurological sciences. Pending successful translation of the product selective saturating-excitations
acquisition approach to in vivo studies, such a technology could provide biomarkers that are directly related to
electrical activity in the brain with high 3D spatial resolution. This is as opposed to fMRI which relies on the
hemodynamic response that lags a few seconds behind the neural activity event and its relation to this event
is complex, and with likely improved penetration and 3D spatial resolution compared to EEG measurements.
Received: 23 February 2020; Accepted: 19 April 2021
References
1. Wehrl, H. F. et al. Simultaneous PET-MRI reveals brain function in activated and resting state on metabolic, hemodynamic and
multiple temporal scales. Nat. Med. 19, 1184–1189. https://doi.org/10.1038/nm.3290 (2013).
2. Grist, J. et al. Quantifying normal human brain metabolism using hyperpolarized [1–13C]pyruvate and magnetic resonance imag-
ing. Neuroimage 189, 171–179 (2019).
3. Ardenkjaer-Larsen, J. H. et al. Increase in signal-to-noise ratio of > 10,000 times in liquid-state NMR. Proc. Natl. Acad. Sci. U. S.
A. 100, 10158–10163. https://doi.org/10.1073/pnas.1733835100 (2003).
4. Harris, T. et al. Real-time ex-vivo measurement of brain metabolism using hyperpolarized [1-13C] pyruvate. Sci. Rep. 8, 9564 (2018).
5. Lev-Cohain, N. et al. Real-time ALT and LDH activities determined in viable precision-cut mouse liver slices using hyperpolarized
[1-13C]pyruvate—implications for studies on biopsied liver tissues. NMR Biomed. 32, e4043 (2019).
6. Lev-Cohain, N. et al. Differentiation of heterogeneous mouse liver from HCC by hyperpolarized 13C magnetic resonance. Sci 2,
3. https://doi.org/10.3390/sci2010003 (2020).
7. Adler-Levy, Y. et al. In-cell determination of lactate dehydrogenase activity in a luminal breast cancer model - ex vivo investigation
of excised xenograft tumor slices using dDNP hyperpolarized [1–13C]pyruvate. Sensors 19, pii: E2089. https://doi.org/10.3390/
s19092089 (2019).
8. Harris, T. et al. Hyperpolarized product selective saturating-excitations for determination of changes in metabolic reaction rates
in real-time. NMR Biomed. 33, e4189 (2020).
9. Park, I. et al. Development of methods and feasibility of using hyperpolarized carbon-13 imaging data for evaluating brain metabo-
lism in patient studies. Magn. Reson. Med. 80, 864–873. https://doi.org/10.1002/mrm.27077 (2018).
10. Miller, J. J. et al. 13C pyruvate transport across the blood-brain barrier in preclinical hyperpolarised MRI. Sci. Rep. 8, 15082 (2018).
11. Miloushev, V. Z. et al. Metabolic imaging of the human brain with hyperpolarized 13C pyruvate demonstrates 13C lactate produc-
tion in brain tumor patients. Cancer Res. 78, 3755–3760. https://doi.org/10.1158/0008-5472.CAN-18-0221 (2018).
12. Hurd, R. E. et al. Metabolic imaging in the anesthetized rat brain using hyperpolarized [1-13C]pyruvate and [1-13C]ethyl pyruvate.
Magn. Reson. Med. 63, 1137–1143. https://doi.org/10.1002/mrm.22364 (2010).
Scientific Reports | (2021) 11:10211 | https://doi.org/10.1038/s41598-021-89534-4 10
Vol:.(1234567890)www.nature.com/scientificreports/
13. Hurd, R. E. et al. Cerebral dynamics and metabolism of hyperpolarized [1-13C]pyruvate using time-resolved MR spectroscopic
imaging. J. Cereb. Blood Flow Metab. 30, 1734–1741. https://doi.org/10.1038/jcbfm.2010.93 (2010).
14. Marjańska, M., Shestov, A. A., Deelchand, D. K., Kittelson, E. & Henry, P. G. Brain metabolism under different anesthetic condi-
tions using hyperpolarized [1-13C]pyruvate and [2-13C]pyruvate. NMR Biomed. 34, e4012 (2018).
15. Marjańska, M. et al. In vivo 13C spectroscopy in the rat brain using hyperpolarized [1-13C]pyruvate and [2-13C]pyruvate. J. Magn.
Reson. 206, 210–218. https://doi.org/10.1016/j.jmr.2010.07.006 (2010).
16. Christians, U. et al. Alterations in glucose metabolism by cyclosporine in rat brain slices link to oxidative stress: interactions with
mTOR inhibitors. Br. J. Pharmacol. 143, 388–396. https://doi.org/10.1038/sj.bjp.0705939 (2004).
17. Katz-Brull, R., Koudinov, A. R. & Degani, H. Direct detection of brain acetylcholine synthesis by magnetic resonance spectroscopy.
Brain Res. 1048, 202–210 (2005).
18. McKenna, M. C. et al. Glutamate oxidation in astrocytes: roles of glutamate dehydrogenase and aminotransferases. J. Neurosci.
Res. 94, 1561–1571. https://doi.org/10.1002/jnr.23908 (2016).
19. Morris, P. & Bachelard, H. Reflections on the application of C-13-MRS to research on brain metabolism. NMR Biomed. 16, 303–312.
https://doi.org/10.1002/nbm.844 (2003).
20. Benjamin, A. M. & Verjee, Z. H. Control of aerobic glycolysis in the brain in vitro. Neurochem. Res. 5, 921–934. https://doi.org/
10.1007/bf00966133 (1980).
21. Shankar, R. & Quastel, J. H. Effects of tetrodotoxin and anesthetics on brain metabolism and transport during anoxia. Biochem. J.
126, 851. https://doi.org/10.1042/bj1260851 (1972).
22. Ivanov, A. I. et al. Glycolysis and oxidative phosphorylation in neurons and astrocytes during network activity in hippocampal
slices. J. Cereb. Blood Flow Metab. 34, 397–407. https://doi.org/10.1038/jcbfm.2013.222 (2014).
23. McCommis, K. S. & Finck, B. N. Mitochondrial pyruvate transport: a historical perspective and future research directions. Biochem.
J. 466, 443–454. https://doi.org/10.1042/BJ20141171 (2015).
24. Carter, B. C. & Bean, B. P. Sodium entry during action potentials of mammalian neurons: incomplete inactivation and reduced
metabolic efficiency in fast-spiking neurons. Neuron 64, 898–909 (2009).
25. Attwell, D. & Laughlin, S. B. An energy budget for signaling in the grey matter of the brain. J. Cereb. Blood Flow Metab. 21,
1133–1145 (2001).
26. Zar, J. H. Biostatistical Analysis 5th edn, 74–79 (Pearson Education Limited, 2014).
27. Fried, N. T., Moffat, C., Seifert, E. L. & Oshinsky, M. L. Functional mitochondrial analysis in acute brain sections from adult rats
reveals mitochondrial dysfunction in a rat model of migraine. Am. J. Physiol. Cell Physiol. 307, C1017–C1030 (2014).
28. du Sert, N. P. et al. Reporting animal research: explanation and elaboration for the ARRIVE guidelines 2.0. PLoS Biol. 18, e3000411
(2020).
29. Ting, J. T., Daigle, T. L., Chen, Q. & Feng, G. in Patch-Clamp Methods and Protocols 221–242 (Springer, 2014).
30. Ting, J. T. et al. Preparation of acute brain slices using an optimized N-Methyl-D-glucamine protective recovery method. J. Vis.
Exp. 132, e53825. https://doi.org/10.3791/53825 (2018).
31. Lee, O. & O’Brien, P. J. Comprehensive Toxicology 1, 411–445 (2010).
32. Junge, W. & Nelson, N. ATP synthase. Annu. Rev. Biochem. 84, 631–657 (2015).
33. Lutas, A., Birnbaumer, L. & Yellen, G. Metabolism regulates the spontaneous firing of substantia nigra pars reticulata neurons via
K-ATP and nonselective cation channels. J. Neurosci. 34, 16336–16347. https://doi.org/10.1523/jneurosci.1357-14.2014 (2014).
34. Ruminot, I., Schmalzle, J., Leyton, B., Barros, L. F. & Deitmer, J. W. Tight coupling of astrocyte energy metabolism to synaptic
activity revealed by genetically encoded FRET nanosensors in hippocampal tissue. J. Cereb. Blood Flow Metab. 39, 513–523. https://
doi.org/10.1177/0271678x17737012 (2019).
35. Schneider, J. et al. Local oxygen homeostasis during various neuronal network activity states in the mouse hippocampus. J. Cereb.
Blood Flow Metab. 39, 15. https://doi.org/10.1177/0271678x17740091 (2019).
36. Miller, L. P. & Oldendorf, W. H. Regional kinetic constants for blood–brain barrier pyruvic acid transport in conscious rats by the
monocarboxylic acid carrier. J. Neurochem. 46, 1412–1416 (1986).
37. Byrnes, J. et al. Pharmacologic modeling of primary mitochondrial respiratory chain dysfunction in zebrafish. Neurochem. Int.
117, 23–34. https://doi.org/10.1016/j.neuint.2017.07.008 (2018).
Acknowledgements
The authors thank Dr. Talia Harris for assistance with the NMR acquisitions, Mr. Assad Azar for technical assis-
tance with cerebral slices preparation and perfusion, Ms. Atara Nardi-Schreiber for assistance with the perfusion
system and for creating the image in Fig. 1, Dr. Ayelet Gamliel for assistance with preparation of formulations
for hyperpolarization and dissolution buffers, and Prof. Jacob Sosna for resources and support.
Author contributions
B.G. and R.K.B. designed the studies. B.G., S.U., and G.S., performed the studies. B.G. and D.S. analyzed the data.
J.M.G. provided resources and support. RKB provided resources and funding. B.G. and R.K.B. wrote the first
draft of the manuscript. All authors reviewed the manuscript and approved the final version.
Funding
Open Access funding enabled and organized by Projekt DEAL. This project has received funding from the
European Research Council (ERC) under grant agreement No. 338040 and from the European Union’s Horizon
2020 research and innovation program under grant agreement No. 667192.
Competing interests
The authors declare no competing interests.
Additional information
Supplementary Information The online version contains supplementary material available at https://doi.org/
10.1038/s41598-021-89534-4.
Correspondence and requests for materials should be addressed to B.G. or R.K.-B.
Reprints and permissions information is available at www.nature.com/reprints.
Publisher’s note Springer Nature remains neutral with regard to jurisdictional claims in published maps and
institutional affiliations.
Scientific Reports | (2021) 11:10211 | https://doi.org/10.1038/s41598-021-89534-4 11
Vol.:(0123456789)www.nature.com/scientificreports/
Open Access This article is licensed under a Creative Commons Attribution 4.0 International
License, which permits use, sharing, adaptation, distribution and reproduction in any medium or
format, as long as you give appropriate credit to the original author(s) and the source, provide a link to the
Creative Commons licence, and indicate if changes were made. The images or other third party material in this
article are included in the article’s Creative Commons licence, unless indicated otherwise in a credit line to the
material. If material is not included in the article’s Creative Commons licence and your intended use is not
permitted by statutory regulation or exceeds the permitted use, you will need to obtain permission directly from
the copyright holder. To view a copy of this licence, visit http://creativecommons.org/licenses/by/4.0/.
© The Author(s) 2021
Scientific Reports | (2021) 11:10211 | https://doi.org/10.1038/s41598-021-89534-4 12
Vol:.(1234567890)You can also read