Theta resting EEG in the right TPJ is associated with individual differences in implicit intergroup bias
←
→
Page content transcription
If your browser does not render page correctly, please read the page content below
Social Cognitive and Affective Neuroscience, 2019, 1–9

                                                                               doi: 10.1093/scan/nsz007
                                                                               Advance Access Publication Date: 25 January 2019
                                                                               Original article

                                                                                                                                                         Downloaded from https://academic.oup.com/scan/advance-article-abstract/doi/10.1093/scan/nsz007/5301731 by guest on 15 February 2019
Theta resting EEG in the right TPJ is associated with
individual differences in implicit intergroup bias
Bastian Schiller,1,3,4,∗ Lorena R.R. Gianotti,2,3,∗ Thomas Baumgartner,2,3 and
Daria Knoch2,3
1 Department  of Psychology, Laboratory for Biological and Personality Psychology, University of Freiburg,
D-79104, Freiburg, Germany, 2 Institute of Psychology, Department of Social Psychology and Social
Neuroscience, University of Bern, CH-3012, Bern, Switzerland, 3 Department of Psychology, Social and Affective
Neuroscience, University of Basel, CH-4055, Basel, Switzerland, and 4 Freiburg Brain Imaging Center, University
Medical Center, University of Freiburg, D-79104, Freiburg, Germany
Correspondence should be addressed to Bastian Schiller, Department of Psychology, Laboratory for Biological and Personality Psychology, University of
Freiburg, Stefan-Meier-Strasse 8, D-79104 Freiburg i. Br, Germany. E-mail: schiller@psychologie.uni-freiburg.de.
∗ Bastian Schiller and Lorena R.R. Gianotti contributed equally to this work.

Abstract
Why are some people more biased than others in their implicit evaluations during social interaction? The dispositional
determinants of individual differences in implicit intergroup bias are poorly understood. Here, we explored whether such
variability might be explained by stable neural traits. For that purpose, we used the source-localized resting
electroencephalograms of 83 members of naturalistic social groups to explain their bias in an in-/outgroup implicit
association test. Lower levels of resting theta current density in the right temporo-parietal junction (TPJ) were associated
with stronger implicit intergroup bias and explained unique variability in bias beyond relevant personality questionnaires.
These findings demonstrate the added value of the neural trait approach in predicting inter-individual differences in
implicit social cognition. Given that low levels of resting theta current density during wakefulness likely ref lect increased
cortical activation, our results suggest that individuals with an efficiently working right TPJ possess capacities to mediate
specific cognitive processes that predispose them towards stronger implicit intergroup bias. As the human species has
evolved living in distinct social groups, the capacity to quickly differentiate friend from foe became highly adaptive and
might thus constitute an essential part of human nature.

Key words: implicit intergroup bias; resting EEG; right TPJ; individual differences; neural traits

                                                                               favorable or unfavorable evaluations of others (Greenwald et al.,
Introduction
                                                                               2009; Kubota et al., 2013), termed ‘implicit attitudes’ (Eagly, 1998).
People differ in the degree to which their social interactions are             To obtain more complete understanding of why an individual
biased by their counterpart’s group affiliation, for example her               displays more or less intergroup bias, it is therefore crucial to
or his political party, sport club, religion or nation (for reviews            illuminate why an individual possesses more or less biased
see Hewstone et al., 2002; Cikara and Van Bavel, 2014). Such                   implicit intergroup attitudes, i.e. implicit intergroup bias. Of
individual differences in interactions with in- and outgroup                   note, implicit intergroup bias is already observed in children
members are often driven by differences in early, automatically                around age 6 and seems to remain strikingly invariant during

Received: 23 March 2018; Revised: 15 January 2019; Accepted: 21 January 2019

© The Author(s) 2019. Published by Oxford University Press.
This is an Open Access article distributed under the terms of the Creative Commons Attribution Non-Commercial License (http://creativecommons.org/
licenses/by-nc/4.0/), which permits non-commercial re-use, distribution, and reproduction in any medium, provided the original work is properly cited.
For commercial re-use, please contact journals.permissions@oup.com

                                                                                                                                                  1
2 Social Cognitive and Affective Neuroscience, 2019, Vol. 00, No. 00
development (Dunham et al., 2008; Dunham et al., 2013), indi- intergroup bias (Greenwald et al., 1998; see Material and methods).
cating its trait-like character. Surprisingly, given the plethora Given that disrupting activity in the right TPJ and the bilateral
of tests to measure variability in implicit intergroup bias (for aTLs diminishes intergroup bias, we hypothesized that baseline
reviews see De Houwer et al., 2009; Nosek et al., 2011), few studies activation of these regions would relate positively to implicit
have addressed its dispositional determinants (but see Pratto intergroup bias. Given that disrupting activity in prefrontal areas
and Shih, 2000; Cunningham et al., 2004; Rowatt et al., 2005; Bergh raises bias, we hypothesized that baseline activation of pre-
et al., 2012). An ideal way to shed light on this issue is pro- frontal areas would relate negatively to implicit intergroup bias.
vided by neuroscientific methods enabling an individual’s neu- As those studies used disruptive brain stimulation protocols
Downloaded from https://academic.oup.com/scan/advance-article-abstract/doi/10.1093/scan/nsz007/5301731 by guest on 15 February 2019
ral traits to be objectively quantified, which in turn can help known to primarily affect EEG slow-wave oscillations (Wozniak-
illuminate the sources of variability in the construct of interest Kwasniewska et al., 2013), we expected to find correlations
(Hahn et al., 2015a; Nash et al., 2015). Therefore, in the present between baseline activation and bias in the slow-wave EEG
study, we sought to explore whether neural traits—dispositional frequency bands. In addition, we explored whether the baseline
brain-based characteristics—might drive individual differences activation of brain regions in which correlational activation had
in implicit intergroup bias. been observed during intergroup bias (insula, ACC, OFC) would
Measuring an individual’s electroencephalographic activity also relate to implicit intergroup bias.
at rest represents an ideal neural trait measure because it is
stable (Dunki et al., 2000; Napflin et al., 2007; Cannon et al., 2012),
heritable (Smit et al., 2005; Zietsch et al., 2007; de Geus, 2010) and
Materials and methods
unique to the individual (Dunki et al., 2000; Napflin et al., 2007). Participants
Moreover, due to its high temporal resolution, resting electroen-
We recruited 84 right-handed and German-speaking partici-
cephalography (EEG) reveals the brain’s oscillatory activity at rest
pants from the University of Basel, Switzerland. No participant
(for reviews see Buzsaki and Draguhn, 2004; Lopes da Silva, 2013).
had a current or previous history of neurological or psychiatric
To our knowledge, while resting EEG has successfully been used
disorders and alcohol or drug abuse. One participant had to
to explain individual variability in diverse phenotypes in healthy
be excluded from further analysis because of excessive EEG
participants (Harmon-Jones et al., 2010; Knoch et al., 2010;
artifacts, leaving a sample of 83 participants (37 soccer fans: 19
Gianotti et al., 2012; Baumgartner et al., 2013a; Schiller et al.,
females; 46 political supporters: 19 females) with a mean age of
2014b; Hahn et al., 2015b; Gianotti et al., 2018a; Gianotti et al.,
21.9 years (s.d. = 3.0 years, range: 21–48 years). To explore the
2018b), so far, no study has employed it in predicting implicit
sources of individual differences in implicit intergroup bias, we
intergroup bias. Thus, we capitalized here on resting EEG in
used naturally occurring social groups. In an online question-
order to effectively capture dispositional differences in neural
naire, we asked a large sample of students about their interests
baseline activation that can be related to individual differences
in several domains (e.g. arts, music, politics, religion, soccer) in
in implicit intergroup bias.
order to keep participants blind to the purpose of the study
To our knowledge, so far no study has investigated which
before the experiment. Among pre-screened participants, we
regions’ baseline activation relates to implicit intergroup bias.
recruited those participants who had, on a scale from 1 (very
Functional neuroimaging studies have identified brain activa-
weak) to 5 (very strong), at least medium (=3) self-reported inter-
tion during intergroup bias in key regions such as the anterior
est in soccer (N = 37) or in politics (N = 46), because previous stud-
cingulate cortex (ACC), bilateral insula, medial prefrontal
ies using these groups have reported strong intergroup biases
cortex (MPFC), bilateral orbitofrontal cortex (OFC) and bilateral
(Hein et al., 2010; Schiller et al., 2014a). We validated each partic-
temporo-parietal junction (TPJ; Amodio, 2014; Baumgartner
ipant’s strength of identification with his or her favored soccer
et al., 2012; Cikara and Van Bavel, 2014; Kubota et al., 2012;
club or political party by using a modified version of the Sport
Molenberghs, 2013; Strombach et al., 2015). However, functional
Spectator Identification Scale (5-point Likert scale; Wann and
imaging studies, although indispensable, do not permit causal
Branscombe, 1993) that was collected online after the laboratory
inferences about the role of brain regions in intergroup bias,
experiment (see Procedure). On average, participants showed
because the observed neural activations could simply be an
a medium to strong identification with their group (M = 3.39,
epiphenomenon or a consequence, and not necessarily the
s.d. = 0.58). There were no significant differences between soccer
cause of the biased perception, judgment or behavior. In
fans and political supporters (soccer fans: M = 3.50, s.d. = 0.59;
contrast, brain modulation studies interfere non-invasively
political supporters: M = 3.35, s.d. = 0.55; soccer fans vs political
with the activity of specific areas in the human cortex (e.g.
supporters: T(80) = 1.15, P > 0.20). Participants received 30 Swiss
Candidi et al., 2015; Korb et al., 2015) and allow researchers to
francs (CHF 1 = $US) for participation.
draw causal conclusions about the impact of the stimulated
brain region on intergroup bias (Marini et al., 2018). For example,
there is evidence that temporarily disrupting the right TPJ by
means of transcranial magnetic stimulation caused a decrease
Procedure
in behavioral intergroup bias (Baumgartner et al., 2014). Other The study was approved by our local ethics committee and con-
brain modulation studies have directly investigated the effects of ducted according to the Declaration of Helsinki. All procedures
experimentally modulating brain activity on implicit intergroup were carried out with the adequate understanding and informed
bias by targeting the bilateral anterior temporal lobes (aTLs) and consent of the participants. After placement of the EEG elec-
(lateral and medial) prefrontal areas. While disrupting activation trodes, participants were seated comfortably in a dimly lit, quiet
of the aTLs diminished implicit intergroup bias (Gallate et al., room, with intercom connection to the experimenters. They
2011; Wong et al., 2012), disrupting activation of prefrontal areas were instructed that the EEG was to be recorded during resting
raised implicit intergroup bias (Cattaneo et al., 2011). with open or closed eyes. The resting EEG protocol consisted of
In the present study, we registered the task-independent rest- 20-s eyes open followed by 40-s eyes closed, repeated five times.
ing EEGs of 84 participants before they took an implicit associa- Such a protocol guarantees minimal fluctuations in participants’
tion test (IAT) that determined their individual degree of implicit vigilance state. The instructions about eye opening/closing wereB. Schiller et al. 3
given via intercom. Data analysis was based on the 200-s eyes- scoring algorithm (Greenwald et al., 2003). This score is calcu-
closed condition. lated by dividing the RT difference between incongruent and
After the resting EEG recording, participants took the IAT congruent trials by the pooled s.d. in these trials, thus adjust-
(for an analysis of evoked-response data recorded while tak- ing for each subject’s latency variability. Positive D scores indi-
ing the IAT, see Schiller et al., 2016). The resting EEG recording cate a strong association between the ingroup and positive
was always made before participants took the IAT in order valence and/or a strong association between the outgroup and
to minimize variance in cognitive state by standardizing pre- negative valence.
experimental procedure for all participants (van Diessen et al.,
Downloaded from https://academic.oup.com/scan/advance-article-abstract/doi/10.1093/scan/nsz007/5301731 by guest on 15 February 2019
2015). Finally, several weeks after the resting EEG and IAT mea-
surement, we measured personality traits (Social Dominance
Orientation, Jost and Thompson, 2000; Sport Spectator Identifi-
Resting EEG recording and pre-processing
cation Scale, Wann and Branscombe, 1993; Moral Foundations We recorded the EEG during rest with a Biosemi ActiveTwo
Questionnaire, Graham et al., 2011) that have been related to system from 64 Ag-AgCl active electrodes according to the
individual differences in intergroup bias (Pratto and Shih, 2000; 10–10 system montage (Nuwer et al., 1998). The EEG was on-line
Hein et al., 2010; Smith et al., 2014). band-pass filtered between 0.1 and 100 Hz, and the data were
digitalized at a sampling rate of 500 Hz. The signals were refer-
enced on-line to the common mode sense, while driven right leg
IAT served as ground. Horizontal and vertical electro-oculographic
signals were recorded with two additional electrodes at the left
Using the IAT, we measured a participant’s bias in implicit
and right outer canthi and one electrode at the left infraorbital.
intergroup attitudes by determining how strongly participants
Pre-processing was done using Brain Vision Analyzer (Version
automatically associate their in- and outgroup with positive
2.0.1.391; Brain Products GmbH). Eye-movement artifacts were
and negative valence. Participants were required to correctly
corrected using independent component analysis. EEG data
and quickly classify words from four categories: ingroup (e.g.
containing muscle, movement and/or technical artifacts were
names of soccer players on the favored soccer team), outgroup
marked; noisy channels were linearly interpolated. All artifact-
(e.g. names of soccer players on the rival soccer team), positive
free data were parsed into 2-s epochs for analysis. On average,
(e.g. ‘love’) and negative (e.g. ‘death’). For each participant, we
154 s (s.d. = 42) of EEG data were available per participant from
adapted the in- and outgroup words based on his or her preferred
the 200 s of eyes-closed resting condition.
social group (see Schiller et al., 2016 for a complete list of stimuli
A Fast Fourier Transformation (using a square window) was
used for each social group). The words appeared in the middle
applied to each epoch and channel to compute the power spectra
of a PC screen in black letters against a white background, and
with 0.5-Hz resolution. Each channel’s spectra were averaged
participants were to assign the words as fast as possible by
over all epochs for each participant. Absolute power spectra were
pressing one of two response keys with the left and right index
integrated for the following seven independent frequency bands
finger, respectively. The rules of category-response assignments
(Kubicki et al., 1979): delta (1.5–6 Hz), theta (6.5–8 Hz), alpha1
changed from block to block, and the categories were presented
(8.5–10 Hz), alpha2 (10.5–12 Hz), beta1 (12.5–18 Hz), beta2
throughout the block in the upper left and right hand corner
(18.5–21 Hz) and beta3 (21.5–30 Hz). Finally, standardized
of the screen. The IAT contained 10 blocks (364 trials in total).
low-resolution brain electromagnetic tomography (sLORETA;
In the first two blocks (each 10 trials), participants learned to
Pascual-Marqui, 2002) was applied to estimate the intracerebral
classify positive vs negative words and ingroup vs outgroup
electrical sources that generated the scalp-recorded activity,
words, respectively. In the third ‘congruent’ block (76 trials),
separately for each EEG frequency band. The sLORETA method
participants had to press one key when ingroup or positive words
is a properly standardized discrete, 3D-distributed, linear,
appeared, while they had to press another key when outgroup
minimum norm inverse solution. The particular form of
or negative words were shown. In the fourth block response,
standardization used in sLORETA endows the tomography
assignments for positive and negative words were reversed
with the property of exact localization to test point sources,
(10 trials), so that in the fifth ‘incongruent’ block (76 trials),
yielding images of standardized current density with exact
ingroup and negative words shared the same response key, while
localization, albeit with low spatial resolution (i.e. neighboring
outgroup and positive words shared another response key. After
neural sources will be highly correlated). sLORETA has recently
these first five blocks, participants had to do another five-block
been validated in several simultaneous EEG/functional magnetic
IAT, where the order of the congruent and incongruent block
resonance imaging (fMRI) studies (Mobascher et al., 2009a;
was switched. Because we were interested in inter-individual
Mobascher, et al., 2009b) and in an EEG localization study for
differences, we used a fixed order of stimulus presentation for
epilepsy (Rullmann et al., 2009). In the current implementation
all participants (Friese et al., 2007; Raccuia, 2016), thereby keeping
of sLORETA, computations were made in a realistic head
task-switching costs constant (Mierke and Klauer, 2001). In each
model using the MNI152 template (Mazziotta et al., 2001),
trial, the word was presented for 1500 ms, followed by a screen
with the 3D solution space restricted to cortical gray matter,
where only the category labels were shown with a randomly
as determined by the probabilistic Talairach atlas (Lancaster
jittered duration ranging from 2000 to 2200 ms, resulting in a
et al., 2000). The intracerebral volume is partitioned in 6239
mean stimulus onset asynchrony of 3600 ms.
voxels at 5-mm spatial resolution. Thus, sLORETA images
represent the standardized electric activity at each voxel in
neuroanatomic Montreal Neurological Institute (MNI) space as
Analysis of behavioral data the exact magnitude of the estimated current density. Using the
For each subject, we calculated mean reaction time (RT) and automatic regularization method in the sLORETA software, we
accuracy for the incongruent and congruent trials, respectively. chose the transformation matrix with the signal-to-noise ratio
To obtain a measure of the strength of implicit intergroup bias set to 10. To reduce confounds that have no regional specificity,
for each subject, we calculated the D score using the improved for each participant, sLORETA images were normalized to a4 Social Cognitive and Affective Neuroscience, 2019, Vol. 00, No. 00
total power of one and then log-transformed before statistical 95% BCa CI (102.42, 134.02), ETA2 = 0.73]. This RT difference
analyses. resulted in a significantly positive D-score, indicating that
on average, participants possessed biased implicit intergroup
attitudes [M = 0.61; s.d. = 0.36, T(82) = 15.72, P < 0.001, 95% BCa CI
Statistical analyses (0.54, 0.69), ETA2 = 0.75]. We did, however, observe considerable
individual variability in this implicit intergroup bias. According
As a ‘first step’, a voxel-wise correlation approach was taken to
to psychological conventions for effect sizes (Cohen, 1977; see
identify brain regions whose baseline activations correlate with
Nosek and Sriram, 2007, regarding the relationship between
the IAT D score, separately for each EEG frequency band. For our
Downloaded from https://academic.oup.com/scan/advance-article-abstract/doi/10.1093/scan/nsz007/5301731 by guest on 15 February 2019
Cohen’s d and the IAT D score), 11 participants displayed little
voxel-by-voxel Pearson correlation analyses, we created a priori
or no bias (DB. Schiller et al. 5
ated with stronger bias. As baseline theta current density likely
reflects decreased cortical activation (Scheeringa et al., 2008;
Lüchinger et al., 2011; Feige et al., 2017), our findings suggest that
individuals with higher activation of the right TPJ at rest exhibit
stronger implicit intergroup bias. Our main finding held true
for both soccer fans and political supporters, and for both men
and women, demonstrating its generalizability across gender
and distinct social groups. Our interpretation of the functional
Downloaded from https://academic.oup.com/scan/advance-article-abstract/doi/10.1093/scan/nsz007/5301731 by guest on 15 February 2019
significance of theta current density during rest (that is, not
during task execution) is based on the observation that an
increase in slow wave oscillations is typically observed during
lower vigilance stages and increased subjective drowsiness (e.g.
Strijkstra et al., 2003). Moreover, resting EEG-fMRI studies found
negative correlations between theta power and the BOLD signal
in regions close to the TPJ (Scheeringa et al., 2008; Lüchinger et al.,
2011; Feige et al., 2017).
Backed up by a wealth of data from metabolic neuroimaging
and brain modulation studies (for reviews see Decety and
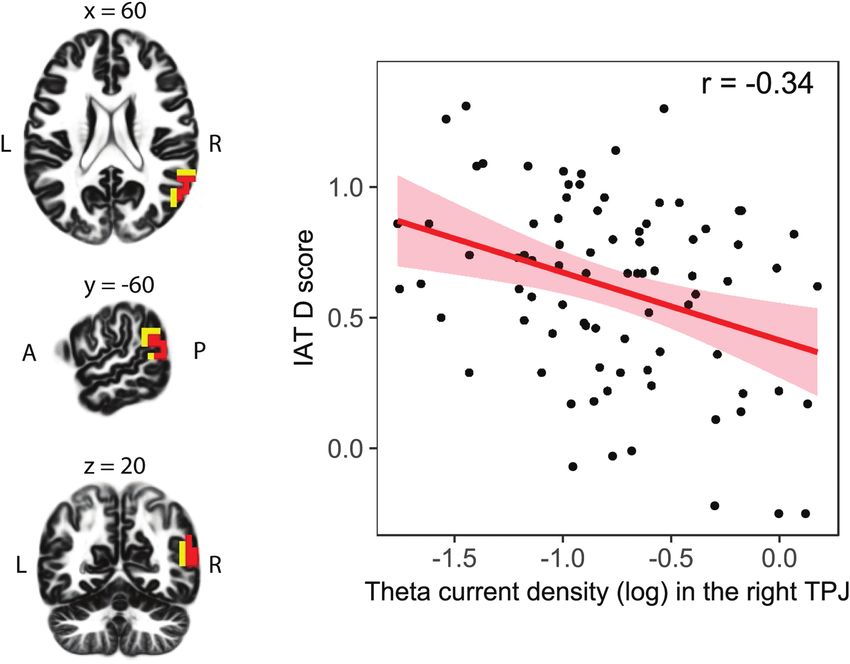
Fig. 1. Relationship between implicit intergroup bias and the baseline theta
Lamm, 2007; Carter and Huettel, 2013), it has been proposed
current density in the right TPJ. On the left, locations of the voxels that showed
that the right TPJ plays a critical role in social cognition
significant correlations are indicated in red (P < 0.05, corrected) and yellow
(P < 0.10, corrected; displayed are MNI coordinates). On the right, the scatter implementing processes like self-other distinction (Uddin et al.,
plot illustrates the relationship between implicit intergroup bias (i.e. the IAT D 2006; Santiesteban et al., 2012; Sowden and Catmur, 2013;
score) and theta current density in the right TPJ (i.e. averaged current density in Sowden and Shah, 2014), detection of social agents (Schultz et al.,
the theta band across all significant voxels of the right TPJ ROI, 5%; corrected, 2005; Tankersley et al., 2007), perspective-taking (Ruby and
unit: A/m2), including regression line in red and confidence intervals (95%). We
Decety, 2003; Aichhorn et al., 2006) and mentalizing (Saxe and
detected a significant negative correlation (r = -0.34, P = 0.002, 95% BCa CI [-0.14 to
Kanwisher, 2003; Van Overwalle, 2009). In our view, categorizing
-0.52]) between current density within the right TPJ in the theta frequency band
and implicit intergroup bias. in- and outgroup stimuli in the IAT does not necessitate
processes such as detecting social agents, perspective-taking
or mentalizing, but it does necessitate distinguishing between
significantly increased the variability in implicit intergroup self-related (ingroup) and other-related (outgroup) stimuli.
bias explained by personality traits alone (personality traits Consequently, the process of self-other distinction appears
as predictors in Model 1: F(8,73) = 3.67, corrected R2 = 0.21, relevant in executing the IAT. One could thus speculate that
P = 0.001; theta current density in right TPJ as additional individuals with high baseline activation of the right TPJ possess
predictor in Model 2: F(9,72) = 4.19, corrected R2 = 0.26, P < 0.001; a high capacity to distinguish between the self and others, which
change in R2 : P = 0.015; for standardized beta-values of all in turn might drive their biased implicit evaluations of in- and
predictors, see Table 1). outgroup stimuli. As our findings also revealed that right TPJ’s
baseline activation is capable of explaining unique variance in
Table 1. Predicting implicit intergroup bias by personality ques- implicit intergroup bias, the capacity to distinguish between the
tionnaires and neural baseline activation. Shown are standardized self and others might represent an additional significant trait in
beta-values and P-values of all predictors in the multiple regression explaining variance in implicit intergroup bias beyond relevant
analyses predicting implicit intergroup bias (IAT D-score). Model 1: personality traits like in-group identification (SSIS; Wann and
personality traits only as predictors. Model 2: theta current density Branscombe, 1993), social dominance orientation (SDO; Jost and
in right TPJ added as additional predictor
Thompson, 2000) and moral foundations (MFQ; Graham et al.,
Model 1 Model 2 2011). Having said that, the literature on TPJ and surrounding
regions in parietal cortex, also shows its role in more general
Predictor β P β P cognitive processes (e.g. attention; Decety and Lamm, 2007).
SSIS 0.34 0.001 0.32 0.002 One could therefore speculate that higher baseline activation
SDO Group-based dominance −0.25 0.089 −0.2 0.156 in the right TPJ might increase capacities in more general
SDO Opposition to equality −0.21 0.151 −0.16 >0.20 cognitive processes not specifically related to social cognition
MFQ Harm/care 0.24 0.07 0.25 0.053 (Marini et al., 2018). To further elucidate this point, future studies
MFQ Fairness/reciprocity −0.43 0.005 −0.38 0.01 should include a control task (see Crescentini et al., 2014), for
MFQ Ingroup/loyalty −0.13 >0.20 −0.11 >0.20 instance an IAT unrelated to implicit intergroup bias.
MFQ Authority/respect 0.35 0.035 0.31 0.058 Our finding that individuals with high baseline activation
MFQ Purity/sanctity −0.12 >0.020 −0.13 >0.020 of the right TPJ show strong implicit intergroup bias is in line
Theta current density in right TPJ −0.25 0.015 with the finding that, if the right TPJ is disrupted by means
of brain modulation, behavioral intergroup bias is reduced
(Baumgartner et al., 2014)—possibly mediated by a reduction
in bias in the implicit evaluations that drive behavioral bias. The
fact that a well-functioning right TPJ is associated with strong
Discussion implicit intergroup bias suggests that biased implicit evaluations
Capitalizing on a neural trait approach, we here demonstrate of others according to their group affiliation might fulfill a
that task-independent baseline current density of the right TPJ necessary function that has developed through evolution. As a
relates to individual differences in implicit intergroup bias: lower social species, individuals have evolved living in different social
levels of theta current density in the right TPJ were associ- groups (Efferson et al., 2008). In encounters with others, it was6 Social Cognitive and Affective Neuroscience, 2019, Vol. 00, No. 00
thus essential for survival to immediately determine whether group behavior in humans—insights from neuroimaging,
someone is friend or foe (Fiske et al., 2007). These evolutionary neuropharmacological modulation, and electroencephalogra-
pressures are reflected in cognitive adaptations that have phy’ to D.K.).
developed to differentially evaluate ingroup and outgroup
members. Along with the cognitive adaptations, evolution has
engineered neural adaptations. Our study suggests that these
neural adaptations have developed in the right TPJ. Acknowledgments
The present study also sheds light on the role of other brain
We thank Y. Egenolf and M. Stein for programming the IAT
Downloaded from https://academic.oup.com/scan/advance-article-abstract/doi/10.1093/scan/nsz007/5301731 by guest on 15 February 2019
regions in driving variability in implicit intergroup bias. Interest-
in E-prime and U. Bircher, D. Chrobot, N. Gross, L. Hoffmann,
ingly, we detect no evidence in our data that the level of baseline
activation of ROIs other than the right TPJ relates to bias. Thus,
E. Meissner, N. Scheurer and K. Stadler for their help in data
although task-dependent analyses have indicated that these collection and processing.
regions are involved in intergroup bias, their task-independent Conf lict of interest. None declared.
neural functioning does not predispose individuals toward less
or more implicit intergroup bias. For example, we found no corre-
lation between baseline activation of the bilateral aTL and bias.
It has been proposed that the aTLs are involved in processing
References
group-related conceptual knowledge in memory (Gallate et al., Aichhorn, M., Perner, J., Kronbichler, M., Staffen, W., Ladurner,
2011; Wong et al., 2012). As disrupting the aTLs reduces implicit G. (2006). Do visual perspective tasks need theory of mind?
intergroup bias, it would appear that processing conceptual Neuroimage, 30(3), 1059–68.
knowledge in memory is involved in this phenomenon. However, Amodio, D.M. (2014). The neuroscience of prejudice and stereo-
this does not necessarily imply that people with a high capacity typing. Nature Reviews Neuroscience, 15(10), 670–82.
to process conceptual knowledge in memory (indicated by high Amodio, D.M., Frith, C.D. (2006). Meeting of minds: the medial
baseline activation of the aTLs) demonstrate a stronger implicit frontal cortex and social cognition. Nature Reviews Neuroscience,
intergroup bias than those with low processing capacity. Only 7(4), 268–77.
by analyzing the relationship between neural baseline activation Baumgartner, T., Gianotti, L.R.R., Knoch, D. (2013a). Who is honest
and bias can this issue be settled. and why: baseline activation in anterior insula predicts inter-
Finally, our findings indicate that at least partly distinct individual differences in deceptive behavior. Biological Psychol-
brain regions are responsible for driving variability in implicit ogy, 94(1), 192–7.
compared to behavioral intergroup bias (for a review see Amodio, Baumgartner, T., Gotte, L., Gugler, R., Fehr, E. (2012). The mental-
2014). The MPFC’s brain volume (another neural trait) and its izing network orchestrates the impact of parochial altruism on
connectivity with the right TPJ have been associated with vari- social norm enforcement. Human Brain Mapping, 33(6), 1452–69.
ability in behavioral intergroup bias (Baumgartner et al., 2013b; Baumgartner, T., Nash, K., Hill, C., Knoch, D. (2015). Neu-
Baumgartner et al., 2015), but here, we identified no association roanatomy of intergroup bias. A white matter microstructure
between baseline MPFC activation and implicit intergroup bias. study of individual differences. Neuroimage, 122, 345–54.
Given its high degree of interconnectivity with diverse brain Baumgartner, T., Schiller, B., Hill, C., Knoch, D. (2013b). Impartial-
regions, the MPFC is in a position to integrate information from ity in humans is predicted by brain structure of dorsomedial
multiple processing streams and is thus capable of executing prefrontal cortex. Neuroimage, 81, 317–24.
high-level, abstract cognitive processes (Amodio and Frith, 2006; Baumgartner, T., Schiller, B., Rieskamp, J., Gianotti, L.R.R., Knoch,
Van Overwalle, 2009). It thus seems plausible that the MPFC is D. (2014). Diminishing parochialism in intergroup conflict by
strongly involved in implementing and regulating actual behav- disrupting the right temporo-parietal junction. Social Cognitive
ior towards in- and outgroup members and less so in rather and Affective Neuroscience, 9(5), 653–60.
perceptual, low-level processes such as implicit evaluations of Bergh, R., Akrami, N., Ekehammar, B. (2012). The personality
in- and outgroup members—which might explain why its pro- underpinnings of explicit and implicit generalized prejudice.
cessing capacity drives variability in behavioral, but not implicit Social Psychological and Personality Science, 3(5), 614–21.
intergroup bias. Buzsaki, G., Draguhn, A. (2004). Neuronal oscillations in cortical
In conclusion, the present study provides evidence that a networks. Science, 304(5679), 1926–9.
neural trait marker—task-independent baseline activation of the Candidi, M., Stienen, B.M.C., Aglioti, S.M., De Gelder, B. (2015).
right TPJ—explains individual differences in implicit intergroup Virtual lesion of right posterior superior temporal sulcus mod-
bias. There was no evidence that the baseline activation of ulates conscious visual perception of fearful expressions in
any other ROI identified in task-dependent analyses of brain faces and bodies. Cortex, 65, 184–94.
regions involved in intergroup bias related to the latter, demon- Cannon, R.L., Baldwin, D.R., Shaw, T.L., et al. (2012). Reliability of
strating that task-independent neural trait analyses can add quantitative EEG (qEEG) measures and LORETA current source
a level of analysis that supplements previous task-dependent density at 30 days. Neuroscience Letters, 518(1), 27–31.
analyses (Nash et al., 2015). Overall, the present study empha- Carter, R.M., Huettel, S.A. (2013). A nexus model of the temporal-
sizes that neural traits are prolific targets of investigation for parietal junction. Trends in Cognitive Sciences, 17(7), 328–36.
illuminating the sources of individual differences in implicit Cattaneo, Z., Mattavelli, G., Platania, E., Papagno, C. (2011). The
social cognition. role of the prefrontal cortex in controlling gender-stereotypical
associations: a TMS investigation. Neuroimage, 56(3), 1839–46.
Cikara, M., Van Bavel, J.J. (2014). The neuroscience of intergroup
relations. An integrative review. Perspectives on Psychological
Funding Science, 9(3), 245–74.
This work was supported by the European Neuroscience Cohen, J. (1977). Statistical Power Analysis for the Behavioral Sciences,
Network NEUREX (Grant ‘The neurobiological basis of inter- New York: Academic Press.B. Schiller et al. 7
Crescentini, C., Aglioti, S.M., Fabbro, F., Urgesi, C. (2014). Virtual ing algorithm. Journal of Personality and Social Psychology, 85(2),
lesions of the inferior parietal cortex induce fast changes of 197–216.
implicit religiousness/spirituality. Cortex, 54, 1–15. Greenwald, A.G., Poehlman, T.A., Uhlmann, E.L., Banaji, M.R.
Cunningham, W.A., Nezlek, J.B., Banaji, M.R. (2004). Implicit and (2009). Understanding and using the implicit association test.
explicit ethnocentrism. Revisiting the ideologies of prejudice. III. Meta-analysis of predictive validity. Journal of Personality and
Personality and Social Psychology Bulletin, 30(10), 1332–46. Social Psychology, 97(1), 17–41.
De Geus, E.J. (2010). From genotype to EEG endophenotype. A Hahn, T., Notebaert, K., Anderl, C., et al. (2015a). Reliance on
route for post-genomic understanding of complex psychiatric functional resting-state network for stable task control pre-
Downloaded from https://academic.oup.com/scan/advance-article-abstract/doi/10.1093/scan/nsz007/5301731 by guest on 15 February 2019
disease? Genome Medicine, 2(9), 63. dicts behavioral tendency for cooperation. Neuroimage, 118,
De Houwer, J., Teige-Mocigemba, S., Spruyt, A., Moors, A. (2009). 231–6.
Implicit measures. A normative analysis and review. Psycholog- Hahn, T., Notebaert, K., Anderl, C., Teckentrup, V., Kassecker, A.,
ical Bulletin, 135(3), 347–68. Windmann, S. (2015b). How to trust a perfect stranger. Pre-
Decety, J., Lamm, C. (2007). The role of the right temporoparietal dicting initial trust behavior from resting-state brain-electrical
junction in social interaction. How low-level computational connectivity. Social Cognitive and Affective Neuroscience, 10(6),
processes contribute to meta-cognition. Neuroscientist, 13(6), 809–13.
580–93. Harmon-Jones, E., Gable, P.A., Peterson, C.K. (2010). The role of
Dunham, Y., Baron, A.S., Banaji, M.R. (2008). The development of asymmetric frontal cortical activity in emotion-related phe-
implicit intergroup cognition. Trends in Cognitive Sciences, 12(7), nomena. A review and update. Biological Psychology, 84(3),
248–53. 451–62.
Dunham, Y., Chen, E.E., Banaji, M.R. (2013). Two signatures of Hayes, A.F. (2013). Introduction to Mediation, Moderation, and Condi-
implicit intergroup attitudes. Developmental invariance and tional Process Analysis, New York: The Guilford Press.
early enculturation. Psychological Science, 24(6), 860–8. Hein, G., Silani, G., Preuschoff, K., Batson, C.D., Singer, T. (2010).
Dunki, R.M., Schmid, G.B., Stassen, H.H. (2000). Intraindividual Neural responses to ingroup and outgroup members’ suffering
specificity and stability of human EEG. Comparing a linear vs predict individual differences in costly helping. Neuron, 68(1),
a nonlinear approach. Methods of Information in Medicine, 39(1), 149–60.
78–82. Hewstone, M., Rubin, M., Willis, H. (2002). Intergroup bias. Annual
Eagly, A.H. (1998). Attitudes and the processing of attitude- Review of Psychology, 53, 575–604.
relevant information. In: Adair, J.G., Bélanger, D., Dion, K.L., Jost, J.T., Thompson, E.P. (2000). Group-based dominance and
editors. Advances in Psychological Science: Social, Personal and opposition to equality as independent predictors of self-
Cultural Aspects, East Sussex: Psychology Press, 185–201. esteem, ethnocentrism, and social policy attitudes among
Efferson, C., Lalive, R., Fehr, E. (2008). The coevolution of cultural African Americans and European Americans. Journal of Experi-
groups and ingroup favoritism. Science, 321(5897), 1844–9. mental Social Psychology, 36(3), 209–32.
Feige, B., Spiegelhalder, K., Kiemen, A., et al. (2017). Distinctive Korb, S., Malsert, J., Rochas, V., et al. (2015). Gender differences
time-lagged resting-state networks revealed by simultaneous in the neural network of facial mimicry of smiles—An rTMS
EEG-fMRI. Neuroimage, 145, 1–10. study. Cortex, 70, 101–14.
Fiske, S.T., Cuddy, A.J., Glick, P. (2007). Universal dimensions of Knoch, D., Gianotti, L.R.R., Baumgartner, T., Fehr, E. (2010). A
social cognition. Warmth and competence. Trends in Cognitive neural marker of costly punishment behavior. Psychological
Sciences, 11(2), 77–83. Science, 21(3), 337–42.
Friese, M., Bluemke, M., Wänke, M. (2007). Predicting voting Kubicki, S., Herrmann, W.M., Fichte, K., Freund, G. (1979). Reflec-
behavior with implicit attitude measures. The 2002 german tions on the topics. EEG frequency bands and regulation of
parliamentary election. Experimental Psychology, 54, 247–55. vigilance. Pharmakopsychiatrie Und Neuropsychopharmakologie,
Gallate, J., Wong, C., Ellwood, S., Chi, R., Snyder, A. (2011). Noninva- 12(2), 237–45.
sive brain stimulation reduces prejudice scores on an implicit Kubota, J.T., Banaji, M.R., Phelps, E.A. (2012). The neuroscience of
association test. Neuropsychology, 25(2), 185–92. race. Nature Neuroscience, 15, 940–8.
Gianotti, L.R.R., Figner, B., Ebstein, R.P., Knoch, D. (2012). Why Kubota, J.T., Li, J., Bar-David, E., Banaji, M.R., Phelps, E.A.
some people discount more than others. Baseline activation (2013). The price of racial bias. intergroup negotiations
in the dorsal PFC mediates the link between COMT genotype in the ultimatum game. Psychological Science, 24(12),
and impatient choice. Frontiers in Neuroscience, 6, 54. 2498–504.
Gianotti, L.R.R., Lobmaier, J.S., Calluso, C., Dahinden, F.M., Knoch, Lancaster, J.L., Woldorff, M.G., Parsons, L.M., et al. (2000). Auto-
D. (2018a). Theta resting EEG in TPJ/pSTS is associated with mated Talairach Atlas labels for functional brain mapping.
individual differences in the feeling of being looked at. Social Human Brain Mapping, 10(3), 120–31.
Cognitive and Affective Neuroscience, 13(2), 216–23. Lopes da Silva, F. (2013). EEG and MEG. Relevance to neuroscience.
Gianotti, L.R.R., Nash, K., Baumgartner, T., Dahinden, F.M., Knoch, Neuron, 80(5), 1112–28.
D. (2018b). Neural signatures of different behavioral types in Lüchinger, R., Michels, L., Martin, E., Brandeis, D. (2011). EEG-
fairness norm compliance. Scientific Reports, 8, 10513. BOLD correlations during (post-)adolescent brain maturation.
Graham, J., Nosek, B.A., Haidt, J., Iyer, R., Koleva, S., Ditto, P.H. Neuroimage, 56(3), 1493–505.
(2011). Mapping the moral domain. Journal of Personality and Marini, M., Banaji, M.R., Pascual-Leone, A. (2018). Studying
Social Psychology, 101(2), 366–85. implicit social cognition with noninvasive brain stimulation.
Greenwald, A.G., McGhee, D.E., Schwartz, J.L.K. (1998). Measur- Trends in Cognitive Sciences, 22(11), 1050–66.
ing individual differences in implicit cognition. The implicit Mazziotta, J., Toga, A., Evans, A., et al. (2001). A probabilis-
association test. Journal of Personality and Social Psychology, 74(6), tic atlas and reference system for the human brain. Inter-
1464–80. national Consortium for Brain Mapping (ICBM). Philosophical
Greenwald, A.G., Nosek, B.A., Banaji, M.R. (2003). Understanding Transactions of the Royal Society B: Biological Sciences, 356(1412),
and using the implicit association test. I. An improved scor- 1293–322.8 Social Cognitive and Affective Neuroscience, 2019, Vol. 00, No. 00
Meng, X., Rosenthal, R., Rubin, D.B. (1992). Comparing cor- Scheeringa, R., Bastiaansen, M.C., Petersson, K.M., Oostenveld,
related correlation coefficients. Psychological Bulletin, 111(1), R., Norris, D.G., Hagoort, P. (2008). Frontal theta EEG activity
172–5. correlates negatively with the default mode network in resting
Mierke, J., Klauer, K.C. (2001). Implicit association measurement state. International Journal of Psychophysiology, 67(3), 242–51.
with the IAT: evidence for effects of executive control pro- Schiller, B., Baumgartner, T., Knoch, D. (2014a). Intergroup bias in
cesses. Experimental Psychology, 48, 107–22. third-party punishment stems from both ingroup favoritism
Mobascher, A., Brinkmeyer, J., Warbrick, T., et al. (2009a). Fluctua- and outgroup discrimination. Evolution and Human Behavior,
tions in electrodermal activity reveal variations in single trial 35(3), 169–75.
Downloaded from https://academic.oup.com/scan/advance-article-abstract/doi/10.1093/scan/nsz007/5301731 by guest on 15 February 2019
brain responses to painful laser stimuli—A fMRI/EEG study. Schiller, B., Gianotti, L.R.R., Baumgartner, T., Nash, K., Koenig,
Neuroimage, 44(3), 1081–92. T., Knoch, D. (2016). Clocking the social mind by identifying
Mobascher, A., Brinkmeyer, J., Warbrick, T., et al. (2009b). mental processes in the IAT with electrical neuroimaging.
Laser-evoked potential P2 single-trial amplitudes covary Proceedings of the National Academy of Sciences of the United States
with the fMRI BOLD response in the medial pain system of America, 113(10), 2786–91.
and interconnected subcortical structures. Neuroimage, 45(3), Schiller, B., Gianotti, L.R.R., Nash, K., Knoch, D. (2014b). Individual
917–26. differences in inhibitory control—relationship between base-
Molenberghs, P. (2013). The neuroscience of in-group bias. Neuro- line activation in lateral PFC and an electrophysiological index
science & Biobehavioral Reviews, 37(8), 1530–6. of response inhibition. Cerebral Cortex, 24(9), 2430–5.
Näpflin, M., Wildi, M., Sarnthein, J. (2007). Test-retest reliability of Schultz, J., Friston, K.J., O’Doherty, J., Wolpert, D.M., Frith, C.D.
resting EEG spectra validates a statistical signature of persons. (2005). Activation in posterior superior temporal sulcus paral-
Clinical Neurophysiology, 118(11), 2519–24. lels parameter inducing the percept of animacy. Neuron, 45(4),
Nash, K., Gianotti, L.R.R., Knoch, D. (2015). A neural trait approach 625–35.
to exploring individual differences in social preferences. Fron- Smit, D.J., Posthuma, D., Boomsma, D.I., Geus, E.J. (2005). Heritabil-
tiers in Behavioral Neuroscience, 8, 458. ity of background EEG across the power spectrum. Psychophys-
Nichols, T.E., Holmes, A.P. (2002). Nonparametric permutation iology, 42(6), 691–7.
tests for functional neuroimaging. A primer with examples. Smith, I.H., Aquino, K., Koleva, S., Graham, J. (2014). The moral ties
Human Brain Mapping, 15(1), 1–25. that bind . . . Even to out-groups. the interactive effect of moral
Nosek, B.A., Hawkins, C.B., Frazier, R.S. (2011). Implicit social identity and the binding moral foundations. Psychological Sci-
cognition: from measures to mechanisms. Trends in Cognitive ence, 25(8), 1554–62.
Sciences, 15(4), 152–9. Sowden, S., Catmur, C. (2013). The role of the right temporopari-
Nosek, B.A., Sriram, N. (2007). Faulty assumptions. A comment etal junction in the control of imitation. Cerebral Cortex, 25(4),
on Blanton, Jaccard, Gonzales, and Christie (2006). Journal of 1107–13.
Experimental Social Psychology, 43(3), 393–8. Sowden, S., Shah, P. (2014). Self-other control: a candidate mech-
Nuwer, M.R., Comi, G., Emerson, R., et al. (1998). IFCN standards anism for social cognitive function. Frontiers in Human Neuro-
for digital recording of clinical EEG. International Federation science, 8, 789.
of Clinical Neurophysiology. Electroencephalography and Clinical Strijkstra, A.M., Beersma, D.G., Drayer, B., Halbesma, N., Daan, S.
Neurophysiology, 106(3), 259–61. (2003). Subjective sleepiness correlates negatively with global
Pascual-Marqui, R.D. (2002). Standardized low-resolution brain alpha (8-12 Hz) and positively with central frontal theta (4–8
electromagnetic tomography (sLORETA). Technical details. Hz) frequencies in the human resting awake electroencephalo-
Methods and Findings in Experimental and Clinical Pharmacology, gram. Neuroscience Letters, 340(1), 17–20.
24(Suppl D), 5–12. Strombach, T., Weber, B., Hangebrauk, Z., et al. (2015). Social
Pratto, F., Shih, M. (2000). Social dominance orientation and group discounting involves modulation of neural value signals
context in implicit group prejudice. Psychological Science, 11(6), by temporoparietal junction. Proceedings of the National
515–8. Academy of Sciences of the United States of America, 112(5),
Raccuia, L. (2016). Single-target implicit association tests (ST-IAT) 1619–24.
predict voting behavior of decided and undecided voters in Tankersley, D., Stowe, C.J., Huettel, S.A. (2007). Altruism is asso-
swiss referendums. PLoS One, 11(10), e0163872 10. ciated with an increased neural response to agency. Nature
Rowatt, W.C., Franklin, L.M., Cotton, M. (2005). Patterns and per- Neuroscience, 10(2), 150–1.
sonality correlates of implicit and explicit attitudes toward Uddin, L.Q., Molnar-Szakacs, I., Zaidel, E., Iacoboni, M. (2006).
Christians and Muslims. Journal for the Scientific Study of Religion, rTMS to the right inferior parietal lobule disrupts self-other
44(1), 29–43. discrimination. Social Cognitive and Affective Neuroscience, 1(1),
Ruby, P., Decety, J. (2003). What you believe versus what you 65–71.
think they believe. A neuroimaging study of conceptual Van Diessen, E., Numan, T., van Dellen, E., et al. (2015). Opportu-
perspective-taking. European Journal of Neuroscience, 17(11), nities and methodological challenges in EEG and MEG resting
2475–80. state functional brain network research. Clinical Neurophysiol-
Rullmann, M., Anwander, A., Dannhauer, M., Warfield, S.K., Duffy, ogy, 126(8), 1468–81.
F.H., Wolters, C.H. (2009). EEG source analysis of epileptiform Van Overwalle, F. (2009). Social cognition and the brain: a meta-
activity using a 1 mm anisotropic hexahedra finite element analysis. Human Brain Mapping, 30(3), 829–58.
head model. Neuroimage, 44(2), 399–410. Wann, D.L., Branscombe, N.R. (1993). Sports fans—measuring
Santiesteban, I., Banissy, M.J., Catmur, C., Bird, G. (2012). Enhanc- degree of identification with their team. International Journal of
ing social ability by stimulating right temporoparietal junction. Sport Psychology, 24(1), 1–17.
Current Biology, 22(23), 2274–7. Wong, C.L., Harris, J.A., Gallate, J.E. (2012). Evidence for a social
Saxe, R., Kanwisher, N. (2003). People thinking about thinking function of the anterior temporal lobes: low-frequency rTMS
people. The role of the temporo-parietal junction in "theory reduces implicit gender stereotypes. Social Neuroscience, 7(1),
of mind". Neuroimage, 19(4), 1835–42. 90–104.B. Schiller et al. 9
Wozniak-Kwasniewska, A., Szekely, D., Aussedat, P., Bougerol, T., Zietsch, B.P., Hansen, J.L., Hansell, N.K., Geffen, G.M., Martin, N.G.,
David, O. (2013). Changes of oscillatory brain activity induced Wright, M.J. (2007). Common and specific genetic influences
by repetitive transcranial magnetic stimulation of the left dor- on EEG power bands delta, theta, alpha, and beta. Biological
solateral prefrontal cortex in healthy subjects. Neuroimage, 88, Psychology, 75(2), 154–64.
91–9.
Downloaded from https://academic.oup.com/scan/advance-article-abstract/doi/10.1093/scan/nsz007/5301731 by guest on 15 February 2019You can also read