Minimum wage submission - 123RF - Australian Council of Social Service
←
→
Page content transcription
If your browser does not render page correctly, please read the page content below

Australian Council
             of Social Service

     Minimum wage submission
    123RF
              2018

1
Who we are

 ACOSS is the peak body of the community services and welfare sector and a national voice for the
 needs of people affected by poverty and inequality.

 Our vision is for a fair, inclusive and sustainable Australia where all individuals and communities can
 participate in and benefit from social and economic life.

 What we do

 ACOSS leads and supports initiatives within the community services and welfare sector and acts as
 an independent non-party political voice.

 By drawing on the direct experiences of people affected by poverty and inequality and the expertise
 of its diverse member base, ACOSS develops and promotes socially and economically responsible
 public policy and action by government, community and business.

First published in 2018 by the
Australian Council of Social Service

Locked Bag 4777
Strawberry Hills, NSW, 2012 Australia
Email: info@acoss.org.au
Website: www.acoss.org.au

ISSN: 1326 7124

© Australian Council of Social Service 2018

This publication is copyright. Apart from fair dealing for the purpose of private study,
research, criticism, or review, as permitted under the Copyright Act, no part may be
reproduced by any process without written permission. Enquiries should be addressed to
the Publications Officer, Australian Council of Social Service. Copies are available from the
address above.

Front cover image © varunalight / 123RF Stock Photo

                                              2
Contents

 Introduction .................................................................................................... 4
 Recent economic and labour market trends ................................................... 7

 Living standards ............................................................................................. 9

 Relationship between minimum wages and social security .......................... 11

 Employment .................................................................................................. 13

 Recommendations ........................................................................................ 17

 ATTACHMENTS
 1             The level and incidence of the national minimum wage ................ 19
     1.1      Current level and trends in national minimum wage over time ............ 19
     1.2      Who relies on minimum wages? ............................................................. 21

 2             Minimum wages and living standards ........................................... 24
     2.1      Possible minimum wage benchmarks ................................................... 24
     2.2      Budget standards .................................................................................... 25
     2.3      Research on poverty in Australia ............................................................ 29
     2.4      International comparisons ...................................................................... 32
     2.5      The living standards of low paid families ............................................... 33
     2.6      Financial stress indicators ...................................................................... 34
     2.7      Housing costs .......................................................................................... 35
     2.8      Minimum wages, income support and work incentives ......................... 36
     2.9      The current income support system for low paid households .............. 36
     2.10     The limits of income support .................................................................. 37
     2.11     Effects of minimum wages on income support payments ..................... 38
     2.12     Income tests and rewards for paid work for low paid employees ......... 40
     2.13     Entry level and ‘regional’ wages ............................................................. 43
     2.14     Young people ........................................................................................... 43
     2.15     Apprentices and trainees ........................................................................ 44
     2.16     People with disabilities ........................................................................... 46

                                                         3
Introduction
ACOSS welcomes the opportunity to make this submission to the 2018-19
Annual Wage Review. ACOSS is an interested party in these proceedings with
expertise in poverty, employment policy and income support policy. Our
long-standing interest in minimum wages stems from their impact on
poverty and inequality in Australia.
The National Minimum Wage (NMW) is currently $695 per week, $18 per
hour, or approximately $36,140 per year. Last year’s minimum wage
increase determined by the Fair Work Commission was a rise of 3.3% ($22
per week).4
The NMW has only increased in real terms by an average of 0.3% per annum
over the last decade as wages determined in the market have risen more
strongly. As a result, the NMW has fallen when compared with the median
fulltime wage (from 55% in 2005 to 50% in 2016, the latest date when figures
were comparable), leaving minimum wage-earners and their families at risk
of falling behind community living standards.
Minimum wage levels affect poverty and inequality in at least three ways:
through their direct effect on the disposable incomes of low paid
workers and their families;
through their indirect effect on the adequacy of social security
payments;
through their effect on employment.
Minimum wage rates, along with the tax-transfer system, have a direct
impact on poverty. The ACOSS/UNSW report, ‘Poverty in Australia 2016’
found that, based on the OECD-preferred measure of poverty (50% of median
income), there were three million people living below the poverty line in
2013-14, of whom 32% came from households where wages were the main
source of income. 5
We are concerned about the impact of weak earnings growth on household
living standards and the growth potential of the economy, especially for
young people who have been the most impacted by the Global Financial
4 Australian Government Fair Work Ombudsman (2017) Minimum Wages.
5 ACOSS/UNSW (2016) Poverty in Australia 2016.
4
Crisis (GFC), the end of the mining boom, and changing patterns of
employment. Since the GFC, young people have been disproportionately
affected by growth in unemployment and under-employment, and when they
do secure the paid working hours they seek, it is more likely to be a low-paid
casual job. 6 A minimum wage increase is especially beneficial for young
people under 25 years, who comprise 41% of employees paid at close to
NMW levels.7 There is a risk that we consign future generations of young
people to poverty if both minimum wages and secure paid working hours are
not lifted substantially.
The minimum wage also impacts poverty indirectly through its relationship
with the social security system. It is appropriate that a gap is maintained
between social security payments and the minimum wage in order to ensure
there is an adequate reward for paid work. There is also a clear need for
social security payments that are well below the poverty line to increase, so
that people without paid work can live with dignity. In our annual budget
submission, ACOSS has called for an increase in single rates of Newstart
and Youth Allowance of $75 per week.8
If the minimum wage were to fall significantly in real terms, the gap between
it and social security payments would narrow. This would reduce the scope
for an increase in social security payments, without lowering financial
rewards for paid work.
Family Tax Benefits supplement paid work, raising the disposable incomes
of low-paid households. However, in recent years governments have reduced
these payments (cutting $12 billion from Family Tax Benefits alone between
2009 and 2016), leaving families with low incomes more reliant on wage
increases. As a result, the real disposable incomes of low paid families have
declined relative to those without children.9 Child poverty is increasing

6 In 2016, 35% of adult employees aged 21-24 years (compared with 11% of those aged 30-49) earned
less than two thirds of the hourly median wage and 39% of these workers were employed as casuals
(compared with 25% of all employees). Among workers aged 16-24 years, 18% were either
unemployed or under-employed. Yuen, et al (2018) Characteristics of workers earning the national
minimum wage rate and of the low paid, Fair Work Commission Research Report 3/2018; Borland J &
Coelli M (2017) Will robots take our jobs?’ AEF seminar series, Swinburne University; ABS (2017)
Employee Earnings and Hours, Australia, May 2016.
7 Yuen, et al (2018), ibid.

8 ACOSS (2018) Budget Priorities Statement, 2017-18.

9 The Commission’s modelling of changes in the disposable incomes of hypothetical single-earner

families with children relying on the NMW indicates that in all cases their real incomes declined during
2016-17. Budget reductions in family payments and income support benefits are likely to be a major
reason for this.

                                                   5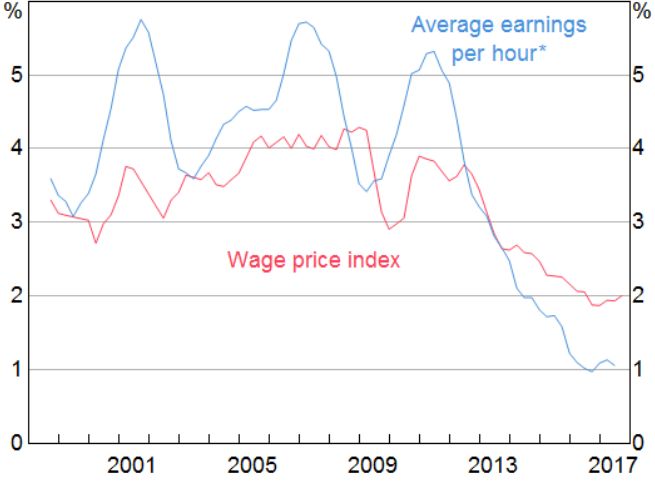
already,10 and will continue to rise if minimum wages and family payments do
not increase in line with wage increases generally.
There is no automatic relationship between minimum wage levels and
overall employment and unemployment levels.11
The inadequate real growth in both minimum wages and working age social
security payment levels (allowances and family payments) is contributing to
the decline in relative living standards for people reliant on these income
sources, when compared with both median and average wages growth over
the last two decades.

Figure 1: Comparison of Newstart Allowance with pensions and wages
($2017)

 ACOSS/UNSW (2016) Poverty in Australia 2016.
10

 Productivity Commission (2015) Workplace Relations Framework, Productivity Commission Inquiry
11

Report Volume 1, page 201

                                               6
Under current economic conditions, there is both more scope and a greater
need to increase minimum wages. There is more scope to do so because the
relationship between wage growth and inflation has changed in recent years
and Australia is well short of ‘full employment’. There is a greater need to do
so because (in addition to wider concerns around poverty and living
standards), wages growth needs to strengthen to lift the economy from its
present low-growth, low-inflation path.
In brief, we recommend that:
FWA increase real minimum wages substantially in order to
significantly reduce the gap between them and median pay levels.
Decisions on the level of minimum wages be informed by regular
comparisons of the living standards of minimum wage-earning
households with benchmark indicators of a ‘decent basic living
standard’ for a single adult, together with the wages needed (along
with relevant social security payments) to ensure that low-paid
families with children are free from poverty.
More detailed evidence and recommendations follow.
Recent economic and labour market trends
The most significant economic development for the purpose of setting
minimum wages is the fact that growth in Gross Domestic Product (GDP),
wages, and consumer spending have been subdued despite very low interest
rates. In the past, the impact of increased wage growth on inflation, and
therefore unemployment, was an abiding concern for policy-makers and
central bankers. A more pressing concern now, almost a decade after the
GFC, is the inability of economies in wealthy nations to break out of a low
growth, low wage growth, low inflation cycle (Figure 2).
7Figure 2: Wages growth has declined despite a recovering economy
Source: Lowe (2017), Some Evolving Questions, presentation to Business
economists , Sydney November 2017.
The Reserve Bank (RBA) recently raised concerns about weak growth in
wages.12 The Wage Price Index grew by just 0.2% in real terms through 2017
and the Mid-Year Economic and Fiscal Outlook forecasts that it will rise by
0.5% through 2018-19 even though real GDP is estimated to grow by 3% and
unemployment to fall to 5.25%.13 The RBA estimates that underlying inflation
will only rise to 2% (the bottom of its target band) by June 2019.14
Under these conditions, higher minimum wages can help strengthen wages
growth and growth in the economy, without risking a break-out in inflation.
12
Lowe (2017), Some Evolving Questions, presentation to Business economists, Sydney November
2017. https://www.rba.gov.au/speeches/2017/pdf/sp‐gov‐2017‐11‐21.pdf
13 Australian Government, Mid-Year Economic and Fiscal Outlook 2017–18.
14 Reserve Bank of Australia (2015): Statement on Monetary Policy, February 2018.
8Living standards
In 2017, as a result of last year’s significant $22 per week increase in the
NMW, its value rose by $9 per week (1.4%) over and above consumer price
inflation.15 It also grew faster than the Wage Price Index. If this trend
continues, it is likely to further reduce the distance between the NMW and
median fulltime earnings.16 Regrettably, a major reason for this was the slow
growth in wages generally.
ACOSS takes a long term view of minimum wage fixation and the needs of
people living on low incomes. Since 2005, the minimum wage has declined
from 57.5% to 53.8% of fulltime median weekly earnings (Figure 3 below).
Over a longer time-frame, the decline has been more pronounced. All things
equal, this implies that low paid workers have fallen well behind growth in
community living standards.
While minimum wages cannot target poverty as precisely as social security
payments, they are mainly paid to the lowest 50% of people of working age.
Recent research undertaken by the Commission found that 44% of minimum
wage earners were in the lowest three deciles of household income for
households where at least one member was employed.17 In 2016, 38% of low
paid adult workers (earning below two thirds of the hourly median wage) who
were partnered were either the sole or primary earners in the household.18
Research published by ACOSS and the UNSW Social Policy Research Centre
found that in 2014, almost one third of people living in poverty were in
households where wages were the main source of income:
Using the OECD-preferred 50% of median disposable income poverty
line, a total of 959,800 people in households for which wages were the
main source of income lived in poverty in 2014. This comprised 32% of
all people in poverty.19
Using the European Union-preferred poverty line of 60% of median
disposable, a total of 1,048,900 people in households for which wages
15 ABS, Consumer Price Index, Australia, Dec 2017,
16 The NMW rose from 53.4% to 53.8% of median fulltime earnings in 2016 (ABS, Employee Earnings,
Benefits and Trade Union Membership, Australia).
17 Jiminez and Rozenbes (2017), Award reliant workers in the household income distribution. Fair Work
Commission.
18 Yuen, et al (2018), ibid.
19 ACOSS 2016, Op.Cit.
9were the main source of income lived in poverty. This comprised 34%
of all people in poverty.
Households living below these poverty lines mainly comprised families
with children (53% of households living below the 50% poverty line and
50% of those below the 60% poverty line).20
A hypothetical comparison by the Commission of disposable incomes for
families receiving the NMW with the 60% of median income poverty line in
September 2017 found that single parents employed part time (half of
fulltime hours), and single earner couples with or without children, had
disposable incomes below that poverty line, unless they also received
Newstart Allowance.21
The Commission’s research indicates that in 2015, 31% of low-paid
employee households, twice the share of all employee households (16%),
experienced financial stress.22
One likely reason for this is the rising cost of housing, which is a major part
of the budgets of low paid households. The Commission’s research found
that in 2016, 52% of low paid working households (those where the primary
earner received less than two thirds of median hourly wages) were renting
privately.23 From the March quarter 2002 to December quarter 2016, home
prices rose by 66.6% in nominal terms and rents increased by 64.2%,
compared with increases of 44.5% in the CPI and 62.5% in wages.24 In June
2017, the median rent for a two bedroom flat in Sydney was $550 per week
and $410 a week in Melbourne.25
20 ibid
21 Fair Work Commission (2018), Statistical report – annual wage review.
22
Fair Work Commission (2017), Statistical report – annual wage review.
23 Yuen, et al (2017), op cit.
24 Australian Bureau of Statistics (2017) Consumer Price Index, Australia, Dec 2016, Cat no 6401.0 and
Wage Price Index, Australia, Dec 2016, Cat no. 6345.0
25 Housing NSW (2017) Rent and Sales Report No 118. Available:
https://www.housing.nsw.gov.au/__data/assets/pdf_file/0005/428576/R-and-S-Report-No-120.pdf ;
Department of Human Services Victoria (2017) Rental Report, June Quarter 2016 Available:
https://dhhs.vic.gov.au/sites/default/files/documents/201709/DHHS%20Rental%20Report%20June%2
0quarter%202017.docxn
10Relationship between minimum wages and social security
The social security system impacts the living standards of minimum wage-
earning households through ‘in-work’ payments such as Family Tax Benefit.
At the same time, minimum wages impact on social security payments for
people of working age by making room for those payments to be set at
adequate levels while maintaining reasonable rewards for paid work.
Since child endowment was introduced in the 1940s, family payments have
supplemented minimum wages to help with the costs of raising children and
reduce child poverty. In recent years, this social compact between workers,
employers and governments has begun to break down.
When account is taken of income tax and social security payments, the real
disposable incomes of all eight hypothetical single-earner families with
children modelled by the Commission (receiving the NMW and no other
private income) fell in 2016-17.26 The largest decline was $14 per week or 2%
in nominal terms, for a sole parent with two children employed part time (on
half fulltime pay). Among the likely reasons for this decline in incomes
among families at high risk of poverty is the ongoing reductions in the real
value of Family Tax Benefits and the abolition of the Schoolkids Bonus
(without replacing this with higher FTB payments).
Taking a longer view, since 2009, budget cuts totalling over $12 billion have
been made to payments for families with low incomes, including:
The removal of indexation of Family Tax Benefit (Part A) for low-
income families to wage movements in 2009, reducing the maximum
payment for a school-age child by at least $20 per week;
The freezing of the income test free areas for Family Tax Benefit from
2009 to 2020;
The transfer of 80,000 sole parent families from Parenting Payment
Single to the lower Newstart Allowance in 2013, at the time reducing
payments for a sole parent with school-age children by at least $60 a
week;
The abolition of the ‘Schoolkids Bonus’ ($4.30 to $8.60 per child per
week) for primary and secondary school-age children in 2016.
26Fair Work Commission (2018), Op.Cit; Australian government (2017), op cit. The Commission
modelled changes in nominal household disposable incomes (including social security payments).
According to the Mid-Year Economic and Fiscal Outlook (MYEFO), the CPI rose by 1.9% over 2016-17.
11 The freezing of maximum rates of Family Tax Benefit (Part A) for low-
income families in nominal terms from 2017 to 2019.
‘The freezing of the income test free areas for Parenting Payment and
Newstart Allowance for three years from 2017.
The experience of the last nine years indicates that governments cannot be
consistently relied upon to supplement low pay for families with children,
leaving them vulnerable to poverty in the absence of substantial increases in
the NMW.
Minimum wages also impact on poverty indirectly, though their influence on
social security settings. There is a consistent long term relationship between
minimum wages and unemployment benefits. Between 1994 and 2013,
unemployment benefits for a single adult with no dependent children fell
between 40-45% of the fulltime minimum wage, before tax. Currently it sits
at 39% of the minimum wage.27 The constancy of this relationship is not
surprising given official concerns about the effect of income support
payments on work incentives. This historical link between minimum wages
and social security payments helps explain why higher minimum wages are
associated in international comparisons with lower levels of child poverty,
even though only a minority of poor households in most OECD countries
benefit directly from minimum wages.
Minimum wages also play an important role in reducing the gender pay gap,
which is caused by a combination of unequal sharing of caring roles, the
over-representation of women in relatively low paid caring occupations
(including in the community services sector), and discrimination against
women in hiring and promotions. In 2016, the gap between median adult
hourly ordinary time earnings among men and women was $6 per week, or
14% of the average male rate.28 Minimum wage increases from 1995 to 2005
were estimated to reduce the gender pay gap by 1.2 percentage points.29
27 Department of Human Services (2018) A Guide to Australian Government Payments and History of
National Increases
28Fair Work Commission (2018), Statistical report – annual wage review.
29Austen et al (2008), Gender pay differentials in low paid employment, Women in social and economic
research, commissioned by the Australian Fair Pay Commission.
12Employment
Employment growth was strong during 2017, rising by 400,000 or 3.3%. This
was similar to the employment growth rate at the peak of the mining boom in
2007. Yet, as indicated, wage growth and inflation remain low. The
unemployment rate fell from 5.7% to 5.5% notwithstanding a rise in the
participation rate from 79.8% to 80.9%.
The Treasury and RBA point to a recent change in the relationship between
unemployment and inflation (Figure 2).30 Similar changes in other wealthy
nations have led economists to question whether further reductions in
unemployment are constrained by the risk of a break-out in inflation (the
NAIRU or structural unemployment constraint).31 Under present conditions,
unemployment could fall well below the RBA’s most recent estimate for the
NAIRU (5%) without adverse economic consequences.32 This brings one
obvious benefit - unemployment has declined and can continue to fall - but it
raises questions about the level of growth in general living standards that
can be achieved over the next few years.
30 Bishop & Cassidy (2017) Insights into Low Wage Growth in Australia RBA Bulletin March 2017;
Treasury (2017) Analysis of wage growth
31 Blanchard (2017), Should We Reject the Natural Rate Hypothesis?, Peterson Institute for
International Economics Working Paper 17:14
32 Cusbert (2017), Estimating the NAIRU and the Unemployment Gap, RBA Bulletin, June 2017.
13Figure 3: The relationship between unemployment and wage growth
has changed
WPI, tty
4.5
Sep-98 to Mar-12
3.5
2.5
Jun-12 to Jun-17
Unemployment rate, annual average
1.5
4 5 6 7 8
Source: Treasury (2017) op cit
One likely reason for the lack of a pick-up in wages and inflation is the high
rate of under-employment, suggesting that there is more slack in the labour
market than the headline unemployment rate suggests. Another explanation
is that structural change in the labour market is suppressing wages growth.
While most employees are in permanent jobs, and we are sceptical of
arguments that a large proportion of jobs will be lost to technological
change, young people in particular find themselves in a more precarious
position in the labour market than in the past.33 Of all young people (under 25
years) in the labour force, 18% are unemployed or under-employed (Figure 4
below).34 In addition to the challenges they face in securing the paid working
hours they seek, one third of 21-24 year old adults have low hourly wage
rates (below two thirds of the median), and almost 40% are employed as
33 Borland J & Coelli M (2017) op.cit.
34 Borland J & Coelli M (2017) ibid
14casuals.35 Further, 22% of low paid workers were ‘non dependent children’
living with their parents, consistent with concerns that many young people
cannot afford to leave the parental home until they reach their thirties.36
Figure 4: Labour under-utilisation (unemployment + under-employment):
young people are most affected
Source: Borland & Coelli (2016) Labour market inequality in Australia. Economic Record, Vol
92, no. 299, December 2016
Further, recent declines in collective bargaining coverage appear to have
reduced the bargaining power of workers generally. The share of non-
managerial employees covered by collective agreements fell from 43% in
2010 to 37% in 2016. At the same time, a growing share (up from 15% to
25%) rely on awards.37 This means that more workers and their families rely
on minimum wage decisions to improve their living standards.
There is an emerging view in the international labour economics literature
that large employers in some labour markets are in a monopsony position
35 In 2016, 35% of adult employees aged 21-24 years earned less than two thirds of the hourly median
wage, while over four in ten low-paid employees (those with hourly wages lower than this benchmark)
were aged 21-29 years. (Yuen, et al (2018), op cit). In 2017, 39% of all employees aged 21-24 and 52% of
all employees under 25 years were casuals, compared with 25% of all employees. (ABS (2017), op cit).
36 Yuen (2017), ibid.
37 ABS, Employee Earnings and Hours, Australia.
15(and therefore able to exert downward pressure on wages.38 We are not able
to assess whether the Australian labour market (or sub-markets) operate in
this way, but in that event higher minimum wages are likely to increase
rather than reduce employment.39
Another factor that is likely to suppress employment and wages among low
skilled workers (especially in manual occupations) is the ongoing structural
shift in the labour market from low and middle to high skilled jobs (Figure 5
). A concerted policy effort is needed to reduce inequalities in the education
system and update the skills of low skilled workers.
Figure 5: Share of employment by skill (Australia, 1986-2016)
Source: Borland & Coelli (2017), op cit
As the peak organisation in the non-government community services sector,
ACOSS has a particular interest in employment issues in community
38 Sandford J (2017), ‘The resurgence of gig work: Historical and theoretical perspectives.’ The
Economic and Labour Relations Review 1–20.; President’s Council of Economic Advisors (2016), Labor
market monopsony: trends consequences and policy responses, White House, Washington DC, at:
https://obamawhitehouse.archives.gov/sites/default/files/page/files/20161025_monopsony_labor_mrk
t_cea.pdf
39 Ashenfelter O, et al (2010) Modern Models of Monopsony in Labor Markets: A Brief Survey IZA
Discussion Paper No. 4915
16services. The community sector’s capacity to provide quality services
depends on the availability of suitably skilled employees, many of whom rely
on the award system for their wages.
In 2016, 440,000 employees (28.8% of all employees) in health care and
social assistance were award-reliant (up from 17.1% in 2010), making this
one of four major industries with a high share of award-reliant workers; the
others being retail; accommodation and food services; and administrative
and support services.40
The vast majority of employees in the community services sector (82%) are
women. The undervaluation of their work, together with the erosion of real
minimum wages over time and a succession of flat rate minimum wage
increases, has depressed their rates of pay despite the highly skilled nature
of much of their work. Substantial pay rises are needed over time to improve
the quality of community services by helping avert shortages of skilled
workers.
Recommendations
We recommend that the NMW be increased consistently and substantially to
reduce the gap between the NMW and the median wage. While we do not
recommend specific increases in minimum wages, the rest of our
recommendations focus on how the needs of people on low pay can best be
assessed, and the respective roles of wages and social security in sustaining
a decent standard of living. Our starting point is that the NMW should be
designed to at least provide a decent living standard, well above poverty
levels, for a single adult; and that the tax-transfer system should meet the
basic costs of raising children in a low income family.
The NMW should not be directly designed to cover the costs of children
because that role is best performed by the social security system. However,
in assessing the living standards of low paid workers and their families, the
Commission should take account of changes in social security settings,
especially reductions in the value of Family Tax Benefits and other relevant
social security payments in recent years. It is vital that the NMW and family
payments together are sufficient to prevent a family from falling into poverty.
The minimum wage itself should be set well above poverty levels, in keeping
40 Fair Work Commission (2018) Op. Cit.
17with Australian public policy tradition, and the need to maintain a gap
between maximum social security payments and minimum wages to
maintain rewards for paid work.
We do not propose that minimum wages be tied to a single benchmark of
income adequacy such as a poverty line or budget standard. Fair Work
Australia needs the flexibility to take account of the other factors including
the state of the economy, work incentives and employment. Further, it is
unlikely that a consensus would be reached around a single benchmark.
Nevertheless, without reference to benchmarks grounded in thorough
independent research on living standards, the adequacy of minimum wages
cannot be objectively assessed. ACOSS welcomes the Commission’s use of
updated poverty lines and financial stress indicators and expenditure
patterns of low paid workers in the Annual Wage Review Statistical Reports.
We recommend that:
FWA should increase real minimum wages substantially in order to
significantly reduce the gap between them and median pay levels.
Decisions on the level of minimum wages should be informed by
benchmark estimates of the cost of attaining a ‘decent basic living
standard’ for a single adult according to contemporary Australian
standards.
The combined effect of the minimum wage and family payments on
the extent of poverty among families, including recent significant cuts
in family payments, should also be expressly considered in setting
minimum wages.
FWA should continue to commission research and hold consultations
with stakeholders to develop and update a robust set of indicators of a
minimum adequate living standard for people in low paid work. It
should regularly assess the living standards of individuals and
households receiving minimum wages against median household
disposable incomes, poverty lines, budget standards and deprivation
indicators, including financial stress indicators (See Attachment 2).
Minimum wage rates for young people, apprentices and trainees, and
people with disability under the Supported Wage System, should
continue to be increased in line with the rise in the NMW. (See
Attachment 3)
18ATTACHMENTS
1 The level and incidence of the national minimum
wage
1.1 Current level and trends in national minimum wage over time
The National Minimum Wage (NMW) is currently $695 per week, $18 per
hour, or approximately $36,140 per year. Last year’s minimum wage
increase determined by the Fair Work Commission was a rise of 3.3% ($22
per week).41
The minimum wage fell in real terms over the 1980s and early 1990s, and
returned its previous level in the mid-2000s. Increases above inflation have
been modest since then. As a result, its real value is only slightly higher now
than over 25 years ago (see graph below).
Figure 1: Real minimum wage 2018 ($A per week)
Sources: Dawkins (2000) The labour market, in Reserve Bank, The Australian economy in the
1990s; ABS, Consumer Price Index; Australian Industrial Relations Commission, Safety net
adjustment decisions; Australian Fair Pay Commission, Wage setting decisions; Fair Work
Australia, Annual wage review decisions.
41 Fair Work Commission (2018) Minimum Wages
19Since 2005, the minimum wage has declined from 57.5% to 53.8% of fulltime
median weekly earnings (see graph below). This has contributed to a rise in
earnings inequality over this period.42 The relationship between the NMW and
median full time ordinary time wages has been steady since the GFC, mainly
because growth in wages generally has been weak.
Figure 2: Minimum wage as a % of fulltime median earnings
Sources: Australian Industrial Relations Commission, Safety net adjustment decisions;
Australian Fair Pay Commission, Wage setting decisions; Australian Fair Pay
Commission, Statistical report – annual wage review 2016-17.
Note: Weekly fulltime minimum wages as a proportion of fulltime median wages for
non-managerial staff.
42Data on earnings and wider income inequality is presented in our ‘Inequality Report’ at
http://acoss.wpengine.com/wp-content/uploads/2015/06/Inequality_in_Australia_FINAL.pdf
201.2 Who relies on minimum wages?
Estimates of the number of low paid workers and their profile vary according
to how low pay is defined, the data source used, and whether part time
employees and young people are included.
(1) The incidence of award reliance
The Commission estimates that the proportion of employees whose wages
were directly determined by awards was 25% in 2016.43
Previous research commissioned by Fair Work Australia profiled employees
earning between 100% and 120% of the NMW, finding that:
51% of low paid employees (those earning below, at, or just above
minimum wage) were women, compared with 47% of the total
workforce;
58% of low paid workers were partnered, and approximately half of
these had dependent children;
5% of those paid below or at the minimum wage were sole parents
with dependent child/ren;
14% of those paid below or at the minimum wage worked part-time
(less than 30 hours a week);
11% of those paid below, at or just above minimum wage worked in
the health care and social assistance industries;
The industries which had most employees earning below, at, or just
above the minimum wage were accommodation and food services;
health care and social assistance; and retail trades.
Occupations with the most employees earning below, at, or just above
the minimum wage were labourers; community and personal service
workers; sales workers; and technicians and trade workers. 44
(2) Award reliance in the community services sector
As the peak organisation in the non-government community services sector,
ACOSS has a special interest in employment issues in community services.
43Fair Work Commission (2018) Op. Cit.
44Nelms, L; Nicholson, P; Wheatley, T 2011, Employees earning below the federal minimum wage:
review of data, characteristics and potential explanatory factors Minimum Wages and Research
Branch, Fair Work Australia
21The community sector’s capacity to provide quality services depends on the
availability of suitably skilled employees, many of whom rely on the award
system for their wages.
In 2016, health and community services had the fourth-highest share of
award reliant employees (28.8%) after retail; hospitality and food services;
and administrative and support services.45 A major reason for this is that
Government funding contracts often provide no scope for employers to offer
above-award rates of pay notwithstanding the qualifications and skills
required of their employees and labour shortages in the sector.
The vast majority of employees in the community services sector (84%) are
women.46 A high proportion of employees in community services work part
time, often due to restrictions in funding rather than personal preference. In
health and community services overall, 43% of employees were part time in
2008, compared with a national average of 29%. Limitations on paid working
hours exacerbate the low hourly rates of pay across the sector.47
Low pay in community services makes it difficult for employers to recruit
skilled staff, a problem likely to worsen if minimum rates of pay in Awards
are adjusted in flat dollar amounts, reducing rewards for skill in the sector.
48
(3) The household incomes of minimum wage earners
When comparing the household incomes of minimum wage earners with
other households for wage-setting purposes, the most appropriate
benchmark is the disposable incomes of households with members in the
labour force (excluding, for example, retirees).
On this basis, minimum wages are mainly earned by people living in low-
income households. The Commission’s study of award-reliant workers in the
household income distribution found that, in 2015:
45 Fair Work Commission (2018): Op. Cit.
46 Australian Bureau of Statistics (2011) Australian Social Trends, September 2011: Community Service
Workers Available:
http://www.abs.gov.au/AUSSTATS/abs@.nsf/Lookup/4102.0Main+Features30Sep+2011
47
Australian Services Union (2007) Building social inclusion in Australia: priorities for the social and
community services sector workforce.
48 Colmar Brunton Social Research (2008) Health and community services industry profile,
commissioned by the AFPC.
22 44% of award-reliant households were in the lowest 30% of the
employee household income distribution;
67% were in the lower half of that distribution49.
Figure 3: Distribution of award reliance across household income for all
households and employee households 50
Jiminez and Rozenbes (2017), Award reliant workers in the household income distribution. Fair Work
49
Commission.
50 Ibid
232 Minimum wages and living standards
2.1 Possible minimum wage benchmarks
An adequate ‘safety net’ for low paid employees and their families requires
an objective assessment of their basic income needs. Ideally, this should be
informed by a set of ‘basic income’ benchmarks. This does not mean that
minimum wages should target a single benchmark, since other factors
(including employment impacts) must be considered. It is also unlikely that a
consensus will be forged over a single benchmark. Instead, a set of basic
income benchmarks should be used as a guide in assessing the adequacy of
minimum wages.
There are three issues to resolve in setting benchmarks for the adequacy of
incomes.
The first issue is the type of family to be used as the ‘benchmark’ family.
ACOSS considers that for the purpose of fixing minimum wages, the basic
income needs of a single adult living alone is the appropriate reference point
since:
it is not feasible for wages to take account of the size of an employee’s
family;
for this and other reasons, Australia developed a national system of
child endowment (now Family Tax Benefit) to meet the minimum costs
of raising children in low income families;
it is generally accepted today that women are income earners in their
own right rather than dependents of their partners. This is reflected in
the ‘equal pay’ decision of the AIRC in the early 1970s, and in the
payment of income support separately to men and women in married
couples (though the income of the partner is taken into account).
The second issue is the level of living standard that a person should be able
to attain on a full time minimum wage. For many years, Australia has set
minimum wages well above poverty levels. This reflects:
a strong consensus in the community that minimum wages should be
sufficient for people to live in dignity, not well below the living
standards of the rest of the community;
24 a pragmatic judgement that, if wages were set around poverty levels,
work incentives for jobless social security recipients would be
weakened.51
ACOSS believes that minimum wages should be sufficient for a single adult
to achieve a ‘decent’ basic living standard, well clear of poverty levels, in
accordance with community expectations. This living standard would lie
somewhere between a ‘poverty’ standard of living and that of the median full
time wage earner. It is likely to rise over time along with standards in the
community generally.
The third issue is how to measure this living standard. There are three main
approaches to setting ‘basic income’ benchmarks:
1. The ‘budget standards’ approach in which experts draft standardised
household budgets encompassing the minimum expenditure
requirements for different types of families.
2. Direct measurement of the living standards of households on low
incomes, on the basis of access to a set of essential goods and
services. This requires a degree of consensus over what comprises
essential goods and services in Australia today.
3. Poverty lines - income levels below which it is considered that
households face a high risk of failing to achieve a ‘basic’ minimum
living standard. These may be expressed as a proportion of overall
average or median household income, or they may be set with
reference to the other two methods above.
2.2 Budget standards
Budget Standards were adopted by the first Australian industrial
commission in developing the ‘Harvester standard’ or ‘basic wage’ early last
century. They were used in a landmark 1996 study by the Social Policy
Research Centre (SPRC), commissioned by the former Department of Social
Security, to assist in the assessment of the adequacy of social security
payments.52 The method adopted was to draft budgets for different types of
household based on a lists of goods and services approved by a panel of
experts. In the SPRC study there were two Budget Standards – a ‘low cost’
standard which is a poverty standard, and a ‘modest but adequate’ standard
51 This assumes that these payments should be sufficient to keep their recipients out of poverty.
52 SPRC (1997) Indicative budget standards for Australia. Dept of Social Security.
25which is a basic or modest standard of living set above poverty levels. These
budgets were then costed using information supplied by retailers and other
sources.
The main advantages of this approach are its transparency (the budgets and
the items comprising them are readily understood) and adaptability (the
budgets can easily be changed in the event of disagreement over any item).
The main problems include reliance on the judgement of experts as to which
items should be included, and the need to update them from time to time to
reflect changes in what constitutes a ‘basic’ living standard. While it is
possible to update these budgets using the CPI, this does not take account of
changes in community living standards and expectations, effectively
‘freezing’ the budget standards at the level of living that applied in the year in
which the field research (such as consultations with experts such as
nutritionists, supermarket visits, and focus groups with consumers) is
conducted.
Last year, the SPRC published a revised set of budget standards for low paid
and unemployed households, based on a ‘healthy living standard’ and
replacing the Modest but Adequate standard with a lower one for ‘low paid
families’.53
Importantly, these budgets were based on more up to date household
spending patterns, from fieldwork conducted in 2016.
The budgets for low paid families are detailed in Table 1. Note that these are
expressed in 2016 values.
53Saunders & Bedford (2017), New Minimum Income for Healthy Living Budget Standards for Low-
Paid and Unemployed Australians, Social Policy Research Centre UNSW Sydney. The healthy living
standard was defined as one that allows ‘each individual to lead a fully healthy life in all of its
dimensions, in their roles as family members, workers and consumers.’ Saunders & Bedford (2017),
New Budget Standards for Low-Paid and Unemployed Australians: Summary Report, p4
26Table 1: SPRC Budget standards for low paid families (2016)
BUDGET SINGLE COUPLE, COUPLE COUPLE SOLE
CATEGORY ADULT NO WITH ONE WITH 2 PARENT,
CHILDREN CHILD CHILDREN 1 CHILD
Food 61.80 123.60 156.22 200.91 89.49
Clothing & footwear
10.81 15.77 23.72 33.20 18.78
Household goods & 79.23 99.59 112.72 139.10 90.46
services
Transport 77.71 120.725 144.72 144.72 100.39
Health 7.33 14.45 19.51 24.36 13.61
Personal Care 15.59 27.04 31.03 35.34 21.52
Recreation 29.04 39.54 62.06 76.99 50.64
Education 0.00 0.00 27.43 61.26 50.31
Total (excluding 281.51 440.74 577.40 715.88 435.20
housing)
Housing costs (rent) 315.80 392.50 392.50 457.50 392.50
Total (grossed-up, 597.31 833.24 969.90 1,173.38 827.70
including housing)
Source: Saunders & Bedford (2017), ibid
A major challenge in developing budget standards is the treatment of
housing costs, which vary widely across the country, and also by dwelling
type, size and tenure. In this research, the SPRC used median rents for
capital cities for dwellings considered suitable for different types of
households. The national figure used was the average of results for Sydney,
Melbourne and Brisbane (which comprised a majority of rental properties).
The new budgets are more stringent than the previous version. The authors
note that: ‘They are extremely tight and leave no room for even the most
modest of special treats.’ For example, in the low paid families budgets are
calculated on the basis of:
• no allowance for saving
• buying generic brands of food and clothing (with a 5% discount for
‘shopping around’ for food),
• no allowance for one-off costs (eg. rental bonds)
• no allowance for repairs of household items
• an assumption of good health
• low child care budgets due to the ages of children in hypothetical
families (school age)
27• very small recreation budgets, with no tobacco and little alcohol.
Thus, the new budgets would support only a very frugal living standard,
arguably below that which the National Minimum Wage should support, and
significantly below that of the previous ‘Modest but Adequate’ budget
standard. For example, many households with preschool age-children or
poor health would not be able to live within these budgets. Table 2 shows
that the Low Paid Family budget was 17% below the updated Modest but
Adequate budget for a single adult female living alone.
Table 2: New ‘Low Paid’ budget standard compared with up-dated
‘Modest but Adequate’ standard (Single female, 2016)
New low- Updated New Updated LC
paid MIHL MBA unemployed standard
standard standard MIHL
standard
Food 56.87 86.72 54.03 66.76
Clothing & footwear 10.83 23.99 4.9 18.10
Household goods & 79.23 44.72 68.37 37.77
services
Transport 78.30 103.34 44.88 68.63
Health 8.55 9.43 6.41 6.75
Personal Care 17.88 36.33 14.23 11.18
Recreation 29.04 33.94 15.00 25.20
Education 0.00 0.00 0.00 0.00
Total 280.69 338.49 207.89 234.41
Source: Saunders & Bedford (2017), ibid
Table 3 compares the budgets (with housing rents included, as outlined
above) with ‘safety net incomes’. In the case of low paid families, this
comprises a single full-time NMW, relevant social security payments, and
any income tax paid.
28Table 3: SPRC Budget standards for low paid families compared with
safety net incomes (2016)
LOW-PAID UNEMPLOYED
Family type Grossed- Safety (2) minus Grossed- Safety (2)
up Budget Net (1) up Budget Net minus
Standard Income Standard Income (1)
(1) (2) (1) (2)
56.87 86.72 54.03 66.76
10.83 23.99 4.9 18.10
79.23 44.72 68.37 37.77
78.30 103.34 44.88 68.63
8.55 9.43 6.41 6.75
Source: Saunders & Bedford (2017), ibid
The table indicates that the safety net incomes for single adults without
children and sole parents with one child were above the relevant budget
standard (by $62 a week and $45 per week respectively) while those for
couples without children, or with one or two children were below the
relevant budget standards (by $39, $9 and $89 respectively).
Income support payments fall substantially below the budget standards in all
cases, reflecting the very low level of the Newstart Allowance in particular.
2.3 Research on poverty in Australia
Although poverty lines do not tell the whole story of deprivation, they are a
widely accepted benchmark for measuring disadvantage. While the risk of
income poverty (living below a poverty line) is low for full time minimum
wage earners in Australia today, a much higher proportion of income-poor
families includes at least one wage earner. The reason for this is that wage
earning households outnumber those out of paid work.
The main poverty lines commonly used in Australia are based on 50% or 60%
of median household incomes or the ‘Henderson Poverty Lines’ updated by
the Melbourne Institute.
29In 2016 ACOSS and the SPRC published an updated report on Poverty in
Australia54. The data source is the Australian Bureau of Statistics (ABS)
Income and Expenditure surveys for 2013-14 and previous years.
This report analyses the risk and profile of poverty amongst a range of
household types using the international standard benchmarks of 50% and
60% of median income. It differs from the OECD methodology (and poverty
estimates published by the Commission) by taking into account people’s
housing costs as well as their incomes. This is important because people
who have low housing costs (such as those who own their homes outright)
are able to achieve a higher standard of living on the same income than
those with higher housing costs (for example, tenants and mortgagers).
In the report, housing costs (rent, mortgage payments and rates) are
deducted from income before calculating the median income on which the
poverty lines are based (reducing the poverty lines) and each household’s
housing costs are then deducted from their income (reducing household
incomes). In this way, the research compares different households’ ability to
meet their basic living costs apart from housing55. The report also includes
updated data on deprivation-based measures of financial hardship
(discussed later)56.
This study found that in 2013-14:
When a poverty line of 50% of median disposable income was used (a
relatively low poverty benchmark used by the OECD), a total of 959,800
people in households for which wages were the main source of
income, comprising 32% of all people in poverty, lived below this
poverty line.
When the higher poverty line of 60% of median disposable income
(used in European Union countries) was used, a total of 1,560,800
people in households for which wages were the main source of
income, comprising 34% of all people in poverty, lived below this
poverty line.
54 ACOSS/SPRC 2016 Op.Cit,
55 Note that estimates of numbers of poverty in this report are adjusted for the exclusion of the self-employed and
people with zero or negative income.
56 Part 14 of the new report. See also ACOSS (2012) Who is missing out: Material deprivation and income support
payments, ACOSS Paper 187
30 Around half the households living below these poverty lines comprised
families with children (52.5% of households living below the 50%
poverty line and 49.5% of those below the 60% poverty line).57
Table 2: People living below poverty lines in 2013-14
Profile of poverty (%) Proportion of different groups
living in poverty (%)
By main income source58 50% of median 60% of 50% of median 60% of
income (%) median income median
income (%) income
Wages 32.1 34.4 6.0 9.7
Social security payment 57.3 57.3 36.1 54.7
Other 10.6 8.3 18.4 21.9
All people 100 100 13.3 20.1
By labour force status59 50% of median 60% of 50% of median 60% of
income (%) median income median
income (%) income
Employed (full time) 20.8 23.2 4.7 7.9
Employed (part time) 13.8 14.2 15.5 24.1
Unemployed 9.7 7.5 63.2 73.6
Not in labour force 16.0 21.2 14.4 28.8
(retired)
Not in labour force 39.6 34.0 43.9 57.1
(other)
All people 100 100 13.3 20.1
Source: ACOSS/SPRC (2016) Op.Cit.
57
ACOSS/SPRC 2016, Op.Cit.
58
Of the household in which people live.
59
Refers to household reference person.
31Profile of poverty (number in poverty)
By main income source 50% of median income (%) 60% of median income (%)
Wages 959,800 1,560,800
Social security payment 1,714,100 2,596,400
Other 316,400 377,500
All people 2,990,300 4,534,700
By labour force status 50% of median income (%) 60% of median income (%)
Employed (full time) 622,700 1,051,100
Employed (part time) 412,900 643,100
Unemployed 291,000 338,700
Not in labour force 497,700 961,300
(retired)
Not in labour force 1,184,000 1,540,500
(other)
All people 2,990,300 4,534,700
Source: ACOSS (2016) Op.Cit.
2.4 International comparisons
International evidence suggests that there is a link between levels of low pay
and income poverty across nations. Broadly speaking, the greater the
incidence of low pay (typically defined as employees earning less than two
thirds of the median wage) the greater the incidence of income poverty
(typically defined as income below a fixed percentage of median disposable
household income).
As discussed above, it is not inevitable that the two indicators will be linked
in this way, since low pay is a measure of individual income and income
poverty is a measure of household income. The graph below uses data from
32the OECD statistical database to chart the relationship between income
poverty across the whole population and the incidence of low pay.
Figure 4: Low pay and poverty (2012)
30
25
20
15
10
5
0
Poverty rates Incidence of low pay
Source: OECD 2017, http://data.oecd.org/inequality/poverty-rate.htm and https://data.oecd.org/earnwage/wage-levels.htm
Note: "Low pay" refers to the % of full-time workers on wages less than 2/3 of the median wage.
"Poverty" refers to the % of all people living on less than half median equivalent household disposable
income.
2.5 The living standards of low paid families
Income poverty is only an indicative measure of family living standards, since
families may have different expenditure needs (for example, health care) and
different assets at their disposal (for example, owning a home).
Nevertheless, with some exceptions, income poverty data adjusted for
housing costs provides a reasonable indicator of the risk of financial
hardship.60
An alternative approach is to measure living standards directly. A number of
‘deprivation’ studies have been conducted by the SPRC in collaboration with
ACOSS and other agencies. National surveys were conducted to asks
respondents what they considered to be ‘essentials’, whether or not they had
60
ACOSS 2003, The bare necessities. The main exceptions are low income self employed people and low
income retirees with substantial assets.
33them, and whether or not they lacked them due to lack of resources. These
studies were not specifically designed to assess the levels of deprivation
among households with people in paid work, though the method could be
adapted to that purpose.61
One deprivation study by Masterman-Smith et al using focus groups of low
wage earners sheds more light on the lived experience of low paid workers.
This study indicated that families reliant on low pay must budget very
carefully to avoid financial hardship, foregoing things most Australians take
for granted such as dental care, annual holidays, a car, eating out with
friends, and buying a home.62
2.6 Financial stress indicators
A further source of data on the living standards of Australian households is
financial stress indicators such as those found in the Melbourne Institute’s
HILDA survey and ABS Household Expenditure Surveys.
The Commission’s research, based on HILDA data, indicates that in 2015,
31.2% of low-paid employee households experienced financial stress,
compared with 15.8% of all employee households.63
As might be expected, these data indicate that lower incomes generally, and
low pay specifically, are associated with higher levels of financial stress
including, for example, not being able to raise $2,000 in an emergency, not
being able to heat one’s home, and not being able to pay bills on time.64
The results are consistent with a previous Melbourne Institute study which
found that in 2011, 33% of low paid employees experienced financial stress
compared with 17% of all employees. In that study, 17% of low paid
employees experienced moderate to high financial stress compared to 5% of
61
Saunders & Naidoo 2007, Towards new indicators of disadvantage, Social Policy Research Centre.
62 Masterman-Smith, May, & Pocock (2006) Living Low Paid: Some Experiences of Australian Childcare
Workers and Cleaners.
63 Fair Work Commission (2017), Statistical report – annual wage review. ‘Low paid’ refers to
households in the bottom quintile of the distribution of employee households.
64 One problem with financial stress indicators is that different respondents to surveys have different
perceptions of the meaning of the questions used: Hahn & Wilkins (2008) A multidimensional approach
to investigation of the living standards of the low paid. Melbourne Institute. Data cited are for individuals
reporting two or more financial stress indicators.
34You can also read