B3010: a boosted TSI 3010 condensation particle counter for airborne studies - Atmos. Meas. Tech
←
→
Page content transcription
If your browser does not render page correctly, please read the page content below
Atmos. Meas. Tech., 12, 2531–2543, 2019
https://doi.org/10.5194/amt-12-2531-2019
© Author(s) 2019. This work is distributed under
the Creative Commons Attribution 4.0 License.

B3010: a boosted TSI 3010 condensation particle counter for
airborne studies
David Picard1 , Michel Attoui2 , and Karine Sellegri1
1 LaMP,   CNRS, Université Clermont Auvergne, Clermont-Ferrand, France
2 LISA,   CNRS, Université Paris Est à Créteil, Créteil, France

Correspondence: David Picard (d.picard@opgc.univ-bpclermont.fr)

Received: 20 July 2018 – Discussion started: 14 September 2018
Revised: 28 March 2019 – Accepted: 8 April 2019 – Published: 26 April 2019

Abstract. In the present paper, we expose how we boosted           nanoparticle clusters (as opposed to the process of condensa-
the performance of a commercial condensation particle              tion onto preexisting particles). Triggered by photochemical
counter (CPC) model TSI 3010 to detect particles as small as       processes, oxidized lower-volatility products are formed, of
1.5 nm while preserving the robustness and reliability of the      which some have the properties of nucleating into new par-
original instrument. The TSI 3010 was selected because of          ticulate clusters. Once particle clusters are formed by nucle-
our deep knowledge of its internal workings and its large in-      ation, they may be lost on preexisting particles via coagula-
corporated butanol reservoir that allows continuous operation      tion if they do not rapidly grow to larger sizes by condensa-
for several hours without refill, which is well suited to air-     tion of less volatile but more abundant species. The processes
borne operation. Aside from this, it is still pretty easy to buy   of nucleation and early growth lead to the occurrence of new
instruments from the TSI 3010 family from companies that           particle formation (NPF) in the atmosphere. NPF occurs over
specialize in used scientific instrument retail. The CPC de-       several hours and is considered responsible for generation
scribed in this study is called B3010 hereafter, where the “B”     of a large number of aerosols at the global scale (Spracklen
stands for boosted. We provide an evaluation of its perfor-        et al., 2006). With the development of instruments detecting
mances down to 1 nm using standard calibration methods and         particles of nanometric size, NPF events have been observed
comparisons with ultrafine CPCs (TSI 3025 and TSI 3776),           in a growing number of environments (Kulmala et al., 2004).
as well as with its original version. One important application        In particular, at high altitudes, NPF events have been
of the B3010 is for high-altitude measurement stations and         recorded with a high frequency in the French Massif Central
airborne studies, the instrument’s detection efficiency was        (Venzac et al., 2007; Boulon et al., 2011), the Alps (Boulon
quantified for various inlet flow rates and pressures.             et al., 2010), the Himalayas (Venzac et al., 2008) and the Bo-
                                                                   livian Andes at 5200 m a.s.l., where the frequency of NPF
                                                                   events are among the highest in the world (Rose et al., 2015).
                                                                   It is important to characterize the mechanisms and gas-phase
1     Introduction                                                 precursors to NPF specific to high altitudes because parti-
                                                                   cles have a longer lifetime in this part of the atmosphere and
1.1    Scientific background                                       they are in direct interaction with the environmental condi-
                                                                   tions conducive to cloud formation. The chemical species re-
It is now widely acknowledged that atmospheric particles           sponsible for the formation of embryos and those responsible
have an impact on climate and health. Their concentration in       for their growth to larger sizes may be different. Therefore,
the atmosphere is largely determined by their sources, which       in order to understand nucleation processes, it is essential to
can be primary (mechanically emitted) or secondary (from           detect the embryos of particles before they are lost or grown
a gas-to-particle conversion process within the atmosphere).       to larger sizes. It is estimated that the first embryos of stable
Among the formation pathways of secondary aerosols, nu-            particles in the atmosphere have a size of 1 nm.
cleation is the process responsible for the formation of new

Published by Copernicus Publications on behalf of the European Geosciences Union.
2532                                                                             D. Picard et al.: B3010: a boosted TSI 3010

   Diurnal conditions are necessary for the study of nucle-         The TSI 3760 controls the sample flow with a critical ori-
ation because they determine the presence of photochemi-         fice and needs a vacuum pump to operate. In order to further
cal processes at the origin of nanoparticle precursor gases.     reduce the risk of contamination, a second critical orifice is
High-altitude stations, however, are frequently influenced by    used to flush the air from the inner volume of the CPC hous-
uplifted air masses during the day, due to forced convection     ing. This is called the purge flow. The slight under-pressure in
on mountainous slopes or natural heat convection. There-         the housing causes any particle to be evacuated to the vacuum
fore, it is relatively rare to meet the appropriate conditions   pump. In addition, the purge flow helps cool the electronics.
for the study of the nucleation process taking place above          Back in 1988, all butanol-fueled CPCs had a sample flow
the atmospheric boundary layer from ground measurement           rate of 0.3 L min−1 starting with the TSI 3020. TSI later in-
stations. Airborne measurements offer a much higher poten-       troduced the TSI 3022, featuring a 1.2 L min−1 bypass flow
tial, not only for overcoming artifacts related to the topog-    and the same 0.3 L min−1 flow rate in the optical detector.
raphy of ground stations but also for evaluating the spatial     The bypass flow, called “make-up air,” reduces diffusion
(horizontal and vertical) extension of the process and reach-    losses. Those 1.5 L min−1 CPCs were called “high flow”,
ing specific aerosol plumes (e.g., desert dust or volcanic ash   while the legacy models were called “low flow”.
in which the nucleation process could be favored). In the           Keady’s TSI 3760 does not have such a bypass. It oper-
past, instrumentation embedded in an aircraft has been able      ates with a sample flow rate of 1.415 L min−1 and a purge
to detect newly formed particles in a size range between 5       flow rate of 1.4 L min−1 , making up 2.8 L min−1 , about
and 10 nm (Rose et al., 2015) showing that the frequency         0.1 ft3 min−1 .
of occurrence of ultrafine particles was at its maximum in          The minimum size of the particles that can act as conden-
the 2000–3000 m altitude range. There is a need to measure       sation nuclei depends on the supersaturation ratio of the va-
nanoparticle concentrations with a controlled inlet flow rate    por of the working fluid in the cooled condenser. The smaller
and well-characterized low-pressure performances both for        the particle, the higher the supersaturation ratio required to
mountaintop and aircraft-based measurements.                     initiate the vapor-to-droplet conversion (nucleation). The su-
                                                                 persaturation profile in the condenser depends on the flow
                                                                 rate, the vapor-saturated air thermodynamic properties and
1.2    Technical background
                                                                 condenser temperature TC . The supersaturation ratio peaks
                                                                 at a distance past the entrance of the condenser that depends
The TSI 3010 condensation particle counter (CPC) is a later      on the parameters listed above. This is where particles acti-
version of the TSI 3760, which was designed by Keady             vate. The remainder of the condenser beyond the maximum
(1988) and targeted at particle concentration monitoring in      supersaturation point is simply used to grow the droplets to a
clean rooms, as can be found in the pharmaceutical and elec-     detectable size (ca. 1 µm).
tronics industries. The TSI 3760 and other models of the            The higher the flow rate, the farther the supersaturation
same product line (TSI 3762 and TSI 3762A) are all based         peak from the entrance of the condenser. Keady’s design
on the same compact and clean room compatible design. The        (Keady, 1988) keeps this distance short without increasing
saturator is a reservoir for the working fluid and allows sev-   the length of the condenser, by splitting the sample flow into
eral days of continuous operation. The condenser is cooled       eight short tubes. The flow rate in each tube is 0.177 L min−1 ,
by a thermoelectric cooler (TEC) sandwiched between the          resulting in a total sample flow rate of 1.415 L min−1 . The
condenser and a heat sink. The heat sink evacuates the heat      upside of the multi-tube design is a very compact instrument.
from the hot side of the TEC and channels it to the saturator.   The downside, due to the small flow rate, is higher particle
The TEC thus cools the condenser and heats the saturator at      losses (diffusion for the smaller and transport for the bigger).
the same time. The operating temperature TS of the saturator     Finally, with these settings, the cutoff diameter at 50 % de-
is typically a few degrees above the ambient temperature. In     tection efficiency, denoted as DP 50 , is 11 nm.
order to prevent contamination of the ambient air (foremost         The optical detector features a 180◦ layout, where the laser
specification in clean rooms), the instrument has no moving      diode faces the photodetector. This design is tailored for
parts (neither fan nor pump). Unlike most other CPCs, the        “clean room” environments with ultra low particle concen-
temperatures of the condenser TC and the saturator TS are not    trations. Nevertheless, it performs well up to concentrations
controlled independently. Instead, the temperature difference    of 104 # cm−3 .
1T between the condenser and the saturator is maintained            The optical detector was made to count single particles.
at a constant level. The thermal design was particularly well    When a particle crosses a laser beam, light is scattered and
thought out and ensures that TS is within a adequate range       sensed by the photodetector, which in turn generates an elec-
to saturate the sample flow with butanol vapor under a wide      trical pulse. The pulse is conditioned, then captured by a digi-
range of operating conditions. The optical detector block is     tal counter. As the flow rate is constant, it is easy to calculate
in thermal contact with the heat sink, which keeps it warm       the particle number concentration. At high concentrations,
enough to prevent the butanol vapor from condensing on the       the probability for two particles or more to overlap as they
lenses.                                                          cross the beam increases. Then, only one pulse is generated

Atmos. Meas. Tech., 12, 2531–2543, 2019                                             www.atmos-meas-tech.net/12/2531/2019/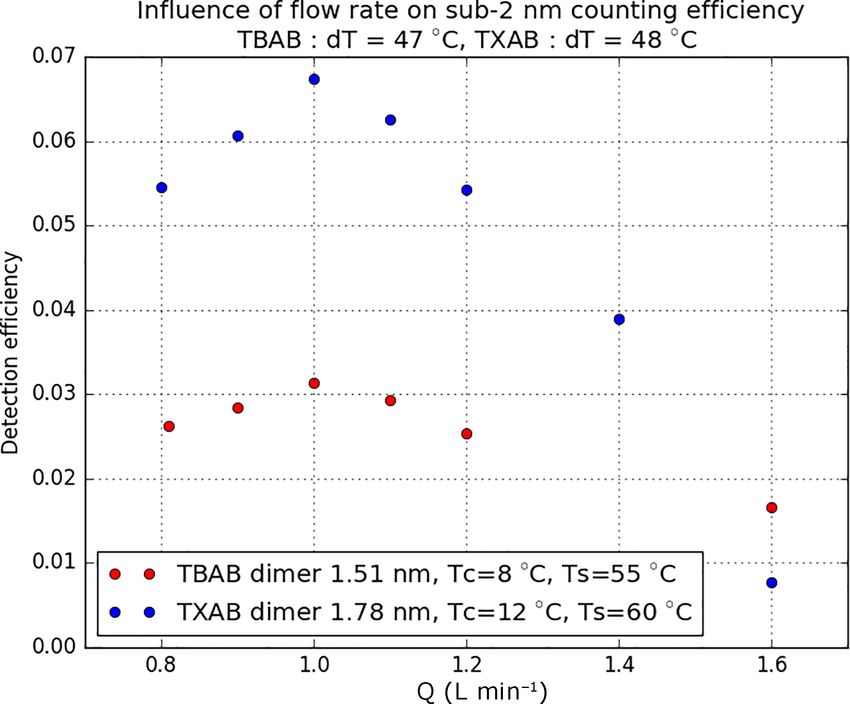
D. Picard et al.: B3010: a boosted TSI 3010                                                                                 2533

as several particles traverse the detector. This phenomenon,       where vapor condenses on the particles that play the role of
known as coincidence, results in undercounting. A correc-          condensation sites or seeds. In contrast, homogeneous nu-
tion method based on Poisson’s equation (Pisani and Thom-          cleation forms droplets without a seed particle. This latter
son, 1971; Gebhart, 2001) is implemented by the following          process is an unwanted side effect that must be avoided. The
equation:                                                          onset of homogeneous nucleation imposes the maximum 1T
                                                                   for a given flow rate in a given saturator–condenser geome-
                                                                   try.
Na = Ni · eNa ·Q·t ,                                        (1)
                                                                      Mertes et al. (1995) measured the cutoff diameter for dif-
where Na is the actual concentration (# cm−3 ), Ni is the indi-    ferent temperature gradients 1T varying from 17 to 25 ◦ C
cated or measured concentration (# cm−3 ), Q is the flow rate      down to 5 nm. We note that the cutoff diameter of the
(cm3 s−1 ) and t is the effective time each particle resides in    TSI 3025, a sheathed CPC, is 2.7 nm with a sample flow rate
the viewing volume. The Na in the exponent can be approx-          of only 0.3 L min−1 (Kesten et al., 1991). With a custom-
imated by Ni . In the first TSI 3760, Q = 1.4 L min−1 and          built TSI 3010-like CPC with a heating mat on the satu-
t = 0.25 µs, resulting in a coincidence error of only 6 % at       rator, an additional TEC on the condenser and a modified
104 # cm−3 .                                                       EEPROM (nonvolatile memory integrated circuit), Russell
   Although the TSI 3760 was designed for the clean rooms          et al. (1996) were able to independently reach TS = 38 and
market, the good performance and affordable price helped           TC = 2 ◦ C, respectively (1T = 36 ◦ C). They measured the
make it popular in a wide range of applications, including         detection efficiency with aerosols of salt (NaCl) and silver as
atmospheric research (Ström and Ohlsson, 1998; Woo et al.,         small as 4.5 nm. No homogeneous nucleation was detected
2001). Following this success, TSI introduced the now well-        with a 1 L min−1 particle-free air stream at 1T = 36 ◦ C.
known TSI 3010. This model boasts significant improve-             During an intercomparison study of the size dependent de-
ments, such as a tighter temperature control and, most im-         tection efficiency of 26 CPCs, Wiedensohler et al. (1997)
portantly, the ability to drive a differential mobility analyzer   showed that for the TSI 3010 operating at 1T = 36 ◦ C
(DMA, Knutson and Whitby, 1975) in a scanning mobility             and Q = 1 L min−1 , the cutoff diameter of silver particles
particle sizer (SMPS) system (Wang and Flagan, 1990). In-          is 3.75 nm, without homogeneous nucleation. Finally, it was
deed, the TSI 3010 embeds a DAC (digital-to-analog con-            found that for a given temperature gradient 1T , the detection
verter), the voltage of which can be set by a command sent         efficiency is higher if the condenser temperature TC is lower
to the RS-232 serial port interface. The TSI 3010 is based         (Barmpounis et al., 2018).
on the same concept as the TSI 3760. It has a larger liq-
uid reservoir. But the main change is the sample flow rate,
1.0 L min−1 , compared to 1.4 L min−1 in the TSI 3760. This        2   Design of the B3010
affects the dimensions of the tubes in the condenser, in order
to maintain the same cutoff diameter (DP 50 ) around 10 nm.        CPCs can be separated in two main categories: non-sheathed
   Thanks to its 10 nm cutoff diameter and low price com-          sample flow (Bricard et al., 1976; Keady, 1988) and sheathed
pared to an ultrafine sheathed CPC, the TSI 3010 was soon          sample flow (Stolzenburg and McMurry, 1991). The former
widely adopted in SMPS systems, covering many fields,              are more robust and cheaper, while the latter boast a higher
including laboratory experiments and field measurements            detection efficiency of sub-10 nm particles and a lower prob-
(O’Dowd et al., 1998; Schröder and Ström, 1997; O’Dowd             ability of coincidence at high particle concentrations. Indeed,
et al., 2009; O’Dowd et al., 2007). Equivalent models includ-      as noticed in Wiedensohler et al. (1994), the very low aerosol
ing TSI 3760A and TSI 3762 also became very popular for            flow rate in sheathed CPCs, such as the TSI 3025 may lead
the same reasons. Bricard’s work at the Puy de Dôme station        to systematic deviations and statistical uncertainties in low-
(1465 m a.s.l.), France, leveraging the first continuous flow      concentration situations. The instrument described here be-
CPC (Bricard et al., 1972; El Golli et al., 1975), shed light      longs to the first category of non-sheathed CPCs.
on the need to measure aerosol number concentrations on               The goal of this development, encouraged by a recent
mountaintops or in research aircrafts. The TSI 3010 played a       study by Kangasluoma et al. (2015) that demonstrated the
key role in this field as well (Seifert et al., 2004).             possibility of detecting sub-3 nm particles by merely chang-
   The TSI 3010 is marketed with a cutoff diameter of 10 nm,       ing the temperatures in a standard TSI 3772 (successor of the
when operated at the default temperature gradient 1T = TS –        TSI 3010), is to approach the performances of an ultrafine
TC = 17 ◦ C. The user can change 1T by issuing a com-              CPC (UCPC) while sticking to a simple and robust design.
mand on the RS-232 interface. The detection efficiency can            As we target airborne measurements, aircraft safety rules
thus be improved easily by increasing 1T without modify-           and specific constraints made the design process somewhat
ing the CPC. However, 1T is coerced to a safe range in the         more complex. Airborne requirements include the ban of ex-
firmware, so as to protect the TEC and prevent homogeneous         ternal butanol fill bottles and the need for all instruments to
nucleation of the butanol vapor to occur. The principle of         connect to common inlets and exhaust lines in order to avoid
operation of the CPC is based on heterogeneous nucleation,         a critical cabin pressure drop. In other words, the inner flow

www.atmos-meas-tech.net/12/2531/2019/                                               Atmos. Meas. Tech., 12, 2531–2543, 2019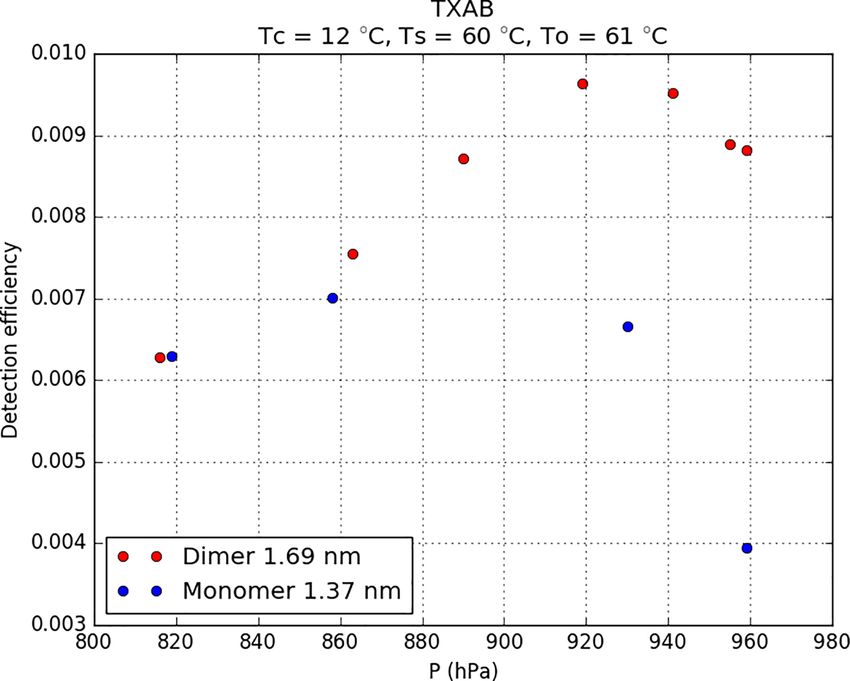
2534                                                                              D. Picard et al.: B3010: a boosted TSI 3010

paths of the instruments are at the outside ambient pressure,         The electronic boards of the CPC were redesigned from
while the rest of the instruments are at cabin pressure. Aside     scratch. The power supply board was designed to operate off
from this, the power supplies found in aircrafts can produce       aircrafts’ 28 V DC board with special care taken to stand re-
large voltage transients, possibly causing permanent damage        verse polarity and load dumps. The power supply can stand
to electronic devices.                                             ±80 V overvoltages and features overcurrent protection (cur-
   In order to reduce the development time, our design reuses      rent limiting). A second board is used to control the current
the saturator, condenser and optics of an original TSI 3010.       in the TECs with fast, high-power metal-oxide semiconduc-
Everything else was redesigned, involving 3-D CAD mod-             tor field-effect transistors (MOSFETs) in a half bridge. Fi-
eling, electronics and software design. The saturator taken        nally a sensor board with an 8-bit microcontroller measures
from the TSI 3010 is also a reservoir that can hold more           pressure, temperature, flow rate, counts the pulses from the
working fluid (butanol) than needed for a standard flight of 4     optics and generates 300 kHz waveforms to drive the TEC
to 6 h, thus eliminating the need for an external fill bottle.     power supply MOSFETs.
   The key parameters that govern the cutoff diameter of a            The system is controlled by a credit card sized computer
CPC are the volume flow rate and the temperature gradient          board powered by an ARM processor. The operating system
between the saturator and the condenser. In order to gain          is a custom-made Linux system, built from scratch with the
full control over the supersaturation process, it was neces-       Buildroot framework. The computer runs advanced software
sary to control each of them separately. Indeed, the original      algorithms (Landau, 1993) to achieve a tight control on the
TSI 3010 uses a thermoelectric cooler (TEC) to pump the            flow rate (±0.02 L min−1 ) and temperature (±0.1 ◦ C). The
heat out of the condenser and into the saturator, thus acting as   B3010 features a TSI-compatible serial port command set, a
a cooler and a heater at the same time. The temperature gra-       BNC pulse output connector, data recording capability and a
dient is kept constant but without control on the condenser        9.7 cm touchscreen. An Ethernet port allows remote access
absolute temperature. Aside from this, the flow rate is set by     while the software is running, due to the multitasking nature
a critical orifice and is not measured. The flow rate cannot be    of Linux. The software is written in C++ with the Qt open
changed unless the orifice is replaced.                            source library.
   For our purpose, we had to break the thermal bond be-
tween the hot side of the TEC and the saturator block. The
tall heat sink was replaced by a smaller one but with forced       3     Calibration bench
convection. The TEC was replaced by two TECs connected
in series. Resistive heaters were stuck on the saturator block.    3.1    Experimental setup
In addition, in order to prevent the butanol from condensing
on the optics, a heater was added on the optical block. The        The experimental setup given in Fig. 2 is the classical setup
optical block temperature is kept above ca. 40 ◦ C. Finally, we    and method used during the last few decades for the gen-
added the option to switch easily between the critical orifice     eration of sub-10 nm and detection-efficiency measurements
and a small rotary vane pump to suit all use cases. The pump       with a high particle size resolution. It has been widely docu-
allows to adjust the flow rate at will and removes the need for    mented in the literature (Heim et al., 2010; Jiang et al., 2011;
a bulky external vacuum pump.                                      Kangasluoma et al., 2015; Hering et al., 2016; Kangasluoma
   We measure the flow rate with a laminar flow element cor-       et al., 2017; Barmpounis et al., 2018).
rected for absolute pressure. The absolute pressure is mea-           The differential mobility analyzer (DMA) used in this
sured by a miniature sensor connected to the optical chamber       study is called a Herrmann-type DMA and has been de-
with a capillary tube. The pressure intake is centrally located,   scribed in detail in Kangasluoma et al. (2016). DMAs are op-
between the saturator–condenser block and the laminar flow         erated with two flows: Qa , the aerosol (or sample) flow and
element. The volume flow rate is calculated from the differ-       Qs , a filtered, aerosol-free sheath flow. The size resolution of
ential pressure measured by a 50 Pa miniature sensor across a      a DMA is given by the ratio Qa /Qs . Typical DMAs are oper-
laminar flow element and compensated for absolute pressure.        ated at Qa = 1–4 and Qs = 5–20 L min−1 . The Herrmann-
The volume flow rate was calibrated with a DryCal Gilibrator       type DMA used in this study is operated at Qa = 10 and
bubble volume flowmeter for a number of absolute pressures.        Qs = 250–1500 L min−1 . The much higher Qa /Qs ratio is
The volume flow rate is a key measurement, since it is used        the key parameter for selecting aerosol particles with a high
to calculate the particle number concentration. The concen-        resolution. A high-resolution DMA is needed because the
tration C is calculated from the number of particle counts, N,     particles used to measure the detection efficiency are in a
accumulated during, TS , at a volume flow rate, QV , accord-       very narrow size range. With Fig. 3, we can calculate the
ing to Eq. (2).                                                    resolution of the DMA, defined by the full width at half max-
                                                                   imum of the peak (FWHM) over the central size of the peak
                                                                   (Kangasluoma et al., 2016). The FWHM of 0.1 nm over the
        N                                                          monomer size 1.47 nm gives a resolution of 0.07 (dimension-
C=                                                          (2)    less number) in the conditions of the experiments.
       QV · TS

Atmos. Meas. Tech., 12, 2531–2543, 2019                                              www.atmos-meas-tech.net/12/2531/2019/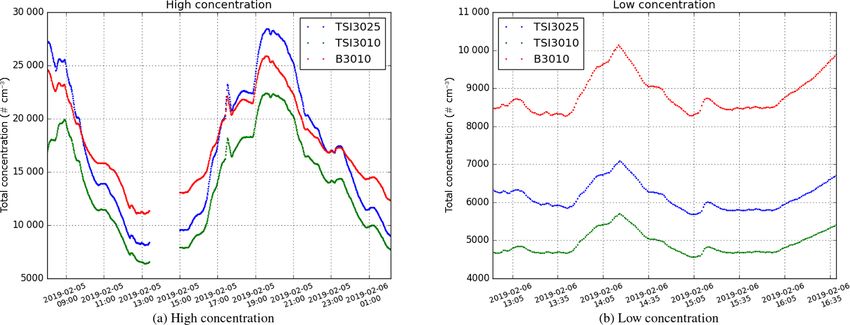
D. Picard et al.: B3010: a boosted TSI 3010                                                                                 2535

Figure 1. B3010 (a) and TSI 3010 (b) diagrams.

                                                                       Nitrogen is used as a carrier gas for the wire generator
                                                                    and electrospray source to push the particles into the Her-
                                                                    rmann DMA at a flow rate of 6 L min−1 . Indeed, the trans-
                                                                    mission in the DMA is higher in sub-3 nm particles when
                                                                    the aerosol flow rate is higher than 5 L min−1 (Kangasluoma
                                                                    et al., 2016).
                                                                       The monodisperse aerosol flow exiting the DMA is dis-
                                                                    tributed via a three-port flow splitter to the device being
                                                                    tested (B3010), the Keithley 6517B reference aerosol elec-
                                                                    trometer (AEM) and an exhaust line for the excess air. Con-
                                                                    ductive soft tubes of equal lengths are used to connect the
                                                                    splitter to the B3010 and the AEM in order to level off the
                                                                    deposition losses in both lines.
Figure 2. Experimental setup.                                          The flow rate in the loop of the DMA is constant but is
                                                                    neither measured nor known. The flow control uses the ac-
                                                                    tual speed output of the high-flow blower to control the flow
   However, this high resolution comes at a price: the small        rate. Tetraheptylammonium bromide is used as a standard to
particle size range. Indeed, at such a high sheath flow rate, the   calibrate the flow rate of the DMA at the beginning of the
voltage required for selecting particles bigger than 5–6 nm         experiments and to check the stability of the system after-
produces electric arcs in the DMA and thus sets the upper           wards. Then, a different type of aerosol can be injected into
limit. Aside from this, the principle of linking the DMA volt-      the DMA because the parameters of the DMA don’t change
age and actual particle size is based on the DMA voltage at         as long as the flow rates are kept constant. The calibration
which the peaks of a molecular standard of known size are re-       factor k, determined by calibration, is needed to relate the
solved (Ude and Fernandez De La Mora, 2005). The relation-          particle mobility Z to the measured voltage V. The factor k
ship between voltage and size is established in the conditions      is then given by the following expression:
of the experiment and remains valid provided the conditions
do not change. Reducing the sheath flow rate would allow for
                                                                         Z·V
selecting bigger particles, but their size would be unknown.        k=       = Z · V = cst,                                    (3)
   Two different types of aerosols are used in this study to              Q
test the response of the B3010 in the sub-3 nm range. Mo-
bility standard ions generated with an electrospray source          where k is constant if Q is constant. Q is the total flow rate
for organic and metal oxides produced with a glowing wire           in the DMA, which in our case can be approximated to the
generator for hydrophobic particles are used sequentially as        sheath flow rate. Q is assumed to be constant hereafter. Z is
the sources of polydisperse aerosols in front of the high-          the mobility diameter and V the voltage in the DMA. The
resolution Herrmann-type DMA (Kangasluoma et al., 2016).            mobility diameter Zs of the monomer THA+ is selected by
The DMA is run in a closed loop arrangement. Both methods           the DMA for a voltage Vs . Zs = 1/1.03 cm2 V−1 s−1 is given
produce their own single-charged aerosol particles.                 by Ude and Fernandez De La Mora (2005).

www.atmos-meas-tech.net/12/2531/2019/                                                Atmos. Meas. Tech., 12, 2531–2543, 2019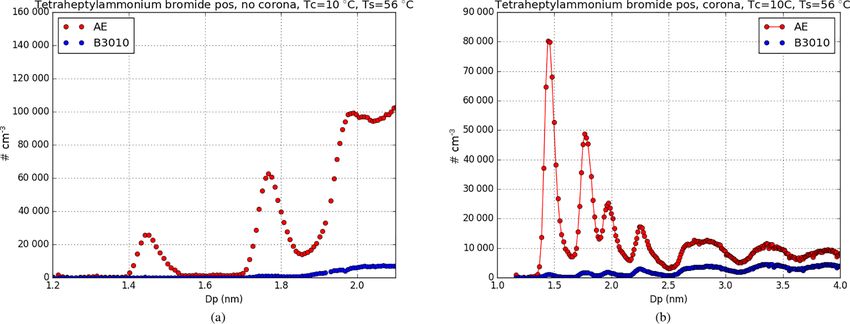
2536 D. Picard et al.: B3010: a boosted TSI 3010
Table 1. Molecular standards dissolved in ethanol by at least an order of magnitude. As a result, the CPC detec-
tion efficiency is underestimated for these particles.
Abbr. Formula Name Soluble Traditionally, molecular standards have mostly been used
in water up to about 2 nm. But in order to measure the ability of the
TBAB C16 H36 BrN Tetra-n-butylammonium no B3010 to detect molecular standard ions at sizes larger than
bromide 2 nm, we insert a small corona discharge device, operated at
TXAB C24 H52 BrN Tetrahexylammonium yes a DC voltage of about 3 kV. The sign of the voltage is the
bromide opposite of that of the charge of the particles selected in the
THAB C28 H60 BrN Tetraheptylammonium no DMA. The benefit of the corona discharge can be seen in
bromide Fig. 3.
3.3 Glowing wire generator
As k is a constant, we can write:
In the second set of experiments, we use hydrophobic oxide
k = Vs · Zs = V · Z, (4) particles produced by a glowing wire generator, as described
in Peineke et al. (2006) and Kangasluoma et al. (2013). The
where V is the voltage required for selecting particles of mo- metal wire is heated resistively with a DC current of sev-
bility Z with the DMA. eral amps. When it reaches a high enough temperature, the
Equation (4) is then used to transform the horizontal axis wire starts to glow like the filament of a light bulb. It is in-
of the measured distribution concentration versus voltage stalled in a stainless steel ISO KF NW40-flanged cross: the
given by the scanning ramp of the inner electrode of the gas inlet faces the gas outlet,and a view port faces the wire
DMA to the distribution concentration mobility. mount. The wire is flushed with a 10 L min−1 nitrogen stream
The mobility diameter of the measured mobility distribu- to carry the produced material towards the DMA and to keep
tion is then converted to mobility diameter using the Stokes– the temperature of the wire well bellow the melting point.
Cunningham equation (Friedlander, 2000): The wire is the hottest point of the generator. The volatile
material condenses by homogeneous nucleation as soon as it
−C drifts from the hot wire surface to form self-charged positive
1 + Kn · (A + B · e Kn )
ZSc = n · e · and negative particles from a few nanometers to a few tens
3·pr · µ · dz (5) of nanometers.
λg µ π · Mg In this study, we use a tungsten oxide alloy (WOX) ∅1.0×
Kn = 2 λg = ,
dz ρg 2 · R · T
100 mm wire.
where dz (noted d in the rest of the paper) is the mobility
diameter, µ is the dynamic viscosity, n is the number of el- 4 Experimental results and discussion
ementary charges e born by the ion or particle, Kn is the
Knudsen number, λg is the mean free path of the molecules 4.1 Laboratory calibration
of the carrier gas, ρg its density and T its temperature. The
constants A, B and C are taken from Friedlander (2000). The detection efficiency is the most representative character-
istic of a CPC and is what we focus on in this section. The
3.2 Molecular standards detection efficiency η of the CPC is defined as the ratio be-
tween the particle concentration measured by the CPC, NCPC
We use the molecular standards listed in Table 1 to generate
to the particle concentration given by the aerosol electrome-
particles in the nanometer range with the electrospray source.
ter, NAE , for different diameters, signs or 1T , according to
The standards are dissolved in ethanol at a concentration of
Eq. (6).
1 mmol L−1 , according to the method described in Ude and
Fernandez De La Mora (2005). The dissolved compounds
can qualify as standards because (1) they produce individ- NCPC
ual molecules, the size of which is stable and known and η= (6)
NAE
(2) because the DMA resolution is high enough to separate
the peaks of the individual molecules from each other. We measured the detection efficiency of the B3010 for
The monomer and dimer of the molecular standards are three molecular standards, including positively and nega-
so small that they can only bear a single electric charge. tively charged particles for a 1T of 46 ◦ C and TC of 10 ◦ C
But most particles larger than about 1.8 nm carry multiple (Fig. 4). The sign of the charge of the particles depends on
charges and hence generate a much higher current in the elec- the sign of the voltage applied to the electrospray generator.
trometer than if they all had borne a single charge. Thus, the The B3010 exhibits the same cutoff diameter of about 3 nm
electrometer overestimates the particle number concentration for all three standards, soluble or not, demonstrating the rel-
Atmos. Meas. Tech., 12, 2531–2543, 2019 www.atmos-meas-tech.net/12/2531/2019/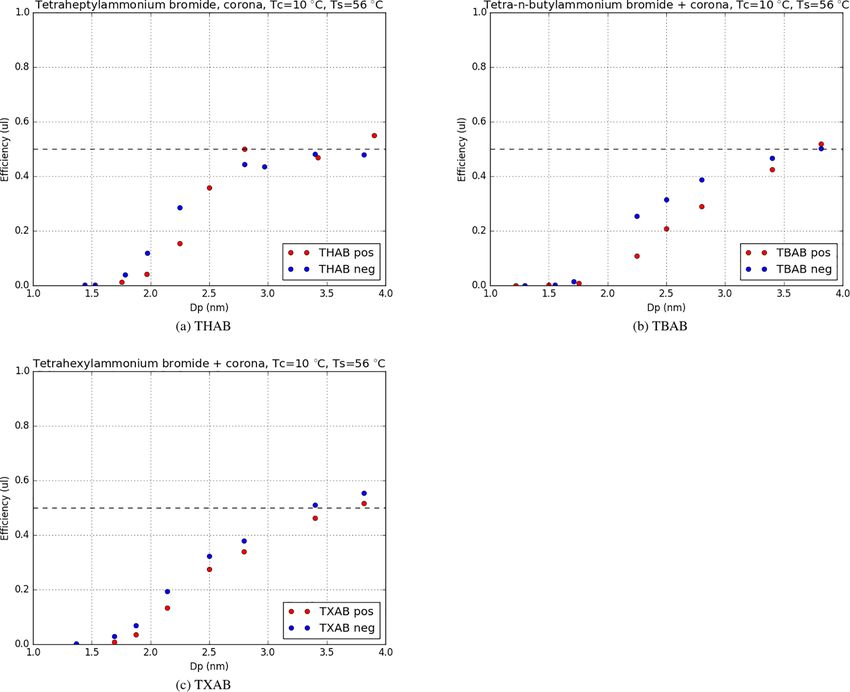
D. Picard et al.: B3010: a boosted TSI 3010                                                                                              2537

Figure 3. Effect of the corona discharge. When the corona discharge is off (a), the signal of the aerosol electrometer (AE) rises sharply above
2 nm. When the corona discharge is on (b), the DMA can resolve up to the fourth peak.

Figure 4. Detection efficiency curves measured for various laboratory-generated aerosols.

www.atmos-meas-tech.net/12/2531/2019/                                                        Atmos. Meas. Tech., 12, 2531–2543, 2019
2538                                                                                 D. Picard et al.: B3010: a boosted TSI 3010

                                                                     Figure 6. B3010 detection efficiency as a function of inlet pressure
Figure 5. B3010 detection efficiency as a function of flow rate in
                                                                     for two fixed-sized standards: TXAB monomer and dimer.
the sub-2 nm range.

ative insensitivity of butanol to the chemical composition of
particles (Kangasluoma et al., 2014).
   However, we can see in Fig. 4 that the detection efficiency
is higher for negative particles, compared to positive parti-
cles. This phenomenon is known as “sign preference” and
has been observed by a number of studies before this one.
More than a century ago, Wilson (1897, 1899) reported that
more fog is formed in an expansion chamber when negative
ions are present compared to positive ions. Also, more fog
forms in the presence of bipolar ions compared to no ions at
all. Wilson is cited by McMurry (2000). More recent stud-
ies (Winkler et al., 2008; Kangasluoma et al., 2013) reported
the same thing. This observation is thus in accordance with
previous studies.
   The efficiency should only increase with increasing parti-
cle diameter. However, the curves in Fig. 4 reach a plateau.
Despite the corona discharge, the efficiency is clearly under-       Figure 7. B3010 detection efficiency as a function of temperature
                                                                     gradient for TXAB monomer.
estimated for particles bigger than about 3 to 4 nm for the
reasons detailed earlier.
   Figure 5 illustrates the dependence of the B3010 detection
efficiency on the sample flow rate for two different 1T . We         detection efficiency peaks at 1 L min−1 , which is exactly the
observe that the efficiency does not vary monotonically with         nominal flow rate of the TSI 3010. We can notice here that
respect to the flow rate. As reported by Kuang et al. (2012)         increasing 1T from 17 to 47–48 ◦ C does not shift the opti-
and Kangasluoma et al. (2015), this is the evidence of a com-        mum flow rate value.
petition between diffusion losses and the time spent in the             In order to study the effect of pressure on the detection ef-
supersaturated flow. At low flow rates, the diffusion losses         ficiency, we inserted a pinched tube section in the setup of
are higher, but the particles have more time to activate and         Fig. 2, between the DMA and the flow splitter. We favor a
grow to a detectable size. At higher flow rates, the diffusion       pinched tube over a needle valve since it features lower par-
losses are smaller, but the residence time is too short for the      ticle losses. By reducing this variable tube section, we are
droplets to grow to a detectable size. Indeed, when the flow         able to reduce the pressure in both the aerosol electrometer
rate increases, the saturation profile develops further down         and the B3010. A pinched tube has a greater penetration ef-
the condenser tubes, thus contributing to decrease the resi-         ficiency than a needle valve. The effect of the inlet pressure
dence time of the particles in supersaturated conditions. The        on the B3010 detection efficiency is illustrated in Fig. 6.

Atmos. Meas. Tech., 12, 2531–2543, 2019                                                 www.atmos-meas-tech.net/12/2531/2019/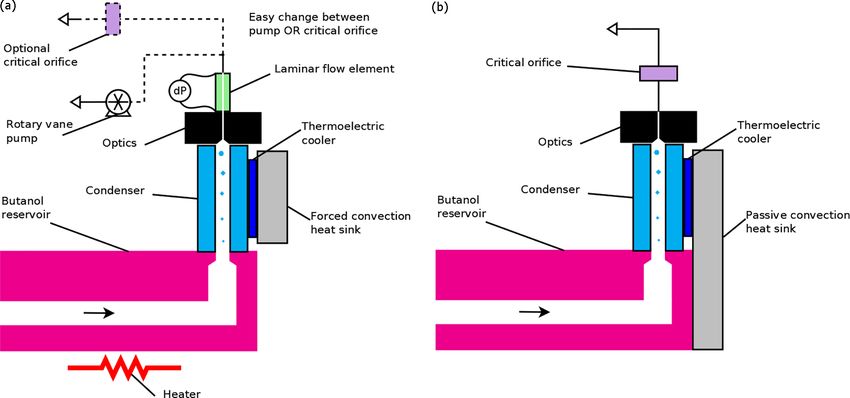
D. Picard et al.: B3010: a boosted TSI 3010 2539
where η is the detection efficiency; x is the particle size; and
y0 , x0 , and k are the coefficients of the fit. This type of fit
is commonly used in the community (Wiedensohler et al.,
1997). We can calculate DP 50 by evaluating the inverse fit
function for a detection efficiency η = 0.5. The associated
error is given by Eq. (8), where R is the resolution of the
DMA calculated in Sect. 3.1. The 0.5 factor comes from the
fact that R is calculated from FWHM. We can thus tell that
DP 50 = 2.5 ± 0.1 nm.
DP 50 · R
= (8)
2
The response time of our CPC was measured in Enroth
et al. (2018). It was found that the B3010 has a response time
similar to that of the TSI 3010, i.e., about 2.3 s. This is not
surprising, since both models share the same geometry.
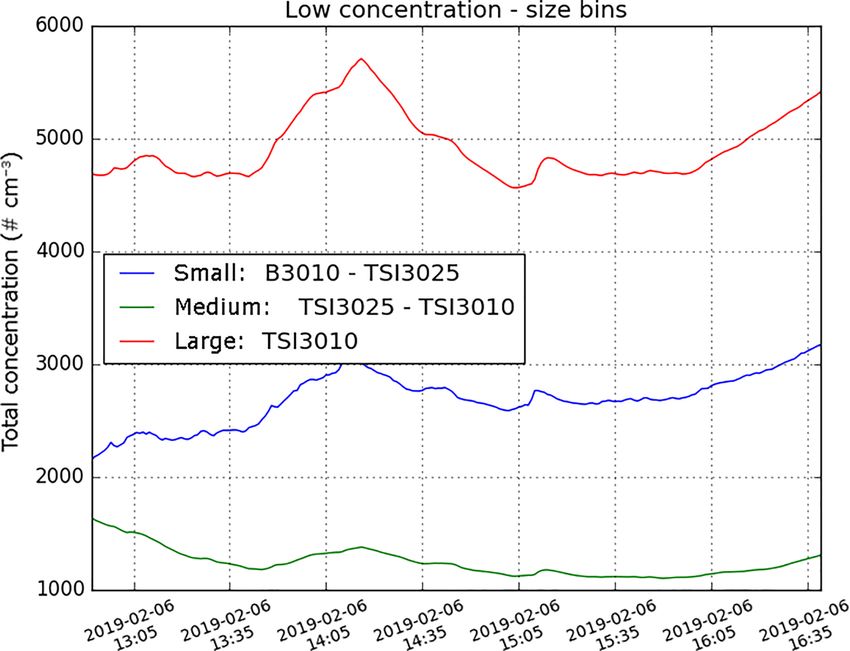
Figure 8. Influence of temperatures on detection efficiency of tung-
4.2 Ambient measurements
sten oxide particles. The black lines are the typical curves of ul-
trafine CPCs TSI 3025 (DP 50 = 3.0 nm) and TSI 3776 (DP 50 =
Finally, we had the B3010 measure ambient air in a sub-
2.5 nm). urban location close to Clermont-Ferrand (France), along-
side a TSI 3025 and a TSI 3010 for 3 d. The settings were
Tc = 10 ◦ C, Ts = 56 ◦ C and Q = 1.0 L min−1 . The B3010
is corrected for coincidence with Eq. (1).
As the pressure decreases in the condenser, the mean free The maximum particle counting rate is limited by the
path of the particles increases as well. The probability for coincidence in the optics. The higher the number of par-
them to hit the walls is greater. This leads to an increase in ticles flowing through the optics, the higher the probabil-
diffusion losses, especially for the smaller, more mobile par- ity of coincidence. In the TSI 3025, only a fraction of the
ticles. intake air is sampled, the rest being used to make filtered
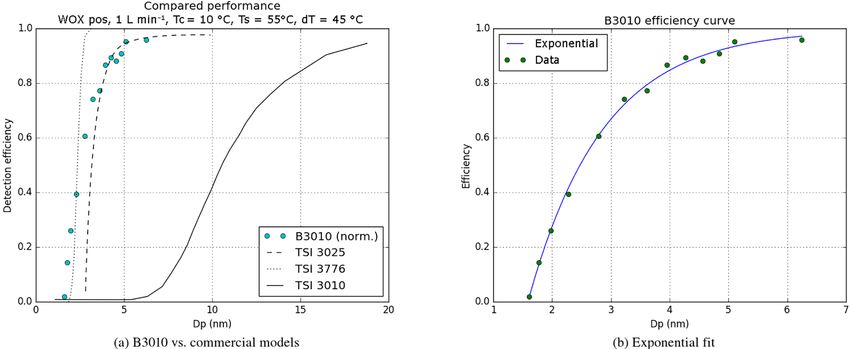
Figure 8 shows how the detection efficiency increases sheath air. Thus, this dilution reduces the number of parti-
when the temperature gradient 1T = Ts – Tc increases. For cles flowing through the optics and hence the coincidence
a 1T of 40 ◦ C, the cutoff diameter is 3 nm, while for a 1T phenomenon. According to the manual, it can count up to
of 45 ◦ C the cutoff diameter is 2.5 nm. Homogeneous nucle- 105 # cm−3 without coincidence. On the other hand, in the
ation was never observed under our experimental conditions. TSI 3010 the sample air is not diluted and the maximum mea-
We also observe, as already reported by Barmpounis et al. surable concentration without coincidence is 104 # cm−3 . As
(2018), that the amplitude of the temperature gradient not the B3010 has the same design and optics as the TSI 3010,
only impacts the detection efficiency but also the shift of we expect a similar concentration range. Figure 10a fo-
this “temperature window” in the temperature domain. The cuses on a high-concentration episode, when the concentra-
B3010 thus has the same detection efficiency if 1T = 48 ◦ C tion peaks above 104 # cm−3 . The B3010 curve crosses the
at Tc = 12 ◦ C or if 1T = 47 ◦ C at Tc = 8 ◦ C. The effi- TSI 3025’s at about 1.7 × 10⁴ # cm−3 . Figure 10b shows a
ciency curves of two ultrafine CPCs, taken from the product low-concentration episode, when the concentration was be-
specification sheets, are plotted alongside the B3010 calibra- low 104 # cm−3 at all times. In these conditions where the
tion data in Fig. 8 for comparison. comparison is fairer, the concentration of the B3010 is sig-
The increase in performance achieved in this development nificantly higher than that of the TSI 3025, which is in accor-
is shown in Fig. 9. The B3010, a “boosted” version of the dance with Fig. 9a.
TSI 3010 competes almost with ultrafine CPCs. Again, as In Fig. 11, we show an example application of the B3010
the flow path was not optimized for sub-10 nm particles, the to retrieve the size distribution at the lower particle diame-
curve is not as steep as those of ultrafine CPCs. ters, like in Kangasluoma et al. (2014). We plot three particle
The cutoff diameter is defined as the particle size at 50 % size bins, obtained by the difference of the concentrations N
efficiency and is abbreviated DP 50 . We applied the exponen- reported by CPCs pairs.
tial fit of Eq. (7) to the data in Fig. 9.
– Small – B3010 minus TSI 3025, 2.5 < N < 3.0 nm
– Medium – TSI 3025 minus TSI 3010, 3.0 < N < 10 nm
x0 −x
η = y0 − e k , (7) – Large – TSI 3010, N > 10 nm
www.atmos-meas-tech.net/12/2531/2019/ Atmos. Meas. Tech., 12, 2531–2543, 20192540 D. Picard et al.: B3010: a boosted TSI 3010
Figure 9. Gain in performance. Tungsten oxide particles. The data from TSI CPCs are taken from product brochures (a). The B3010 efficiency
is fit with an exponential curve (b) to retrieve the cutoff diameter. The data from the B3010 are normalized.
Figure 10. Comparing B3010 with TSI 3025 and TSI 3010 during a high-concentration episode (a) and a low-concentration episode (b).
In this example, one can see that particles in the range 2.5–
3.0 nm account for about a third of the total particle concen-
tration.
5 Conclusions
In this project, we demonstrate that a CPC with a simple,
proven design such as the TSI 3010’s can be slightly modi-
fied to bring the detection efficiency close to that of ultrafine,
sheathed CPCs. Both laboratory and ambient measurements
confirm this result. However, as emphasized in the ambient
measurements section, the maximum measurable concentra-
tion is definitely limited by the design of the flow path and
the optics.
In light of the results presented here, a few guidelines for
CPC designers and users can be drawn. Still today, design-
Figure 11. The B3010 in a CPC battery.
ers could reasonably imagine non-sheathed, yet performing
CPC geometries, as long as the total concentration in the tar-
geted application is not too high. Aside from this, owners
Atmos. Meas. Tech., 12, 2531–2543, 2019 www.atmos-meas-tech.net/12/2531/2019/D. Picard et al.: B3010: a boosted TSI 3010 2541
of non-sheathed CPCs can dramatically reduce the cutoff di- El Golli, S., Madelaine, G., Turpin, P., and Bricard, J.: Recent ad-
ameter of their devices by simply adjusting the saturator and vances in photoelectric aerosol measurements, Water Air Soil
condenser temperatures. This simple tweak, when allowed Pollut., 5, 11–38, 1975.
by commercial CPC firmware, can potentially help save the Enroth, J., Kangasluoma, J., Korhonen, F., Hering, S., Pi-
extra cost of an ultrafine CPC. card, D., Lewis, G., Attoui, M., and Petäjä, T.: On
the time response determination of condensation par-
ticle counters, Aerosol Sci. Tech., 52, 1521–7388,
https://doi.org/10.1080/02786826.2018.1460458, 2018.
Data availability. Data are available upon request.
Friedlander, S. K.: Smoke, Dust, and Haze, Oxford University
Press, 2nd edition edn., available at: http://www.oupcanada.com/
catalog/9780195129991.html (last access: 3 September 2018),
Author contributions. DP wrote the first draft and ran the ambient 2000.
measurements. MA provided the laboratory calibration facility. DP, Gebhart, J.: Optical direct-reading techniques: light intensity sys-
MA and KS participated in laboratory tests, data analysis and edit- tems, Aerosol Measurement, 419–454, 2001.
ing of the paper. Heim, M., Attoui, M., and Kasper, G.: The efficiency of diffu-
sional particle collection onto wire grids in the mobility equiv-
alent size range of 1.2–8 nm, J. Aerosol Sci., 41, 207–222,
Competing interests. The authors declare that they have no conflict https://doi.org/10.1016/j.jaerosci.2009.10.002, 2010.
of interest. Hering, S. V., Lewis, G. S., Spielman, S. R., Eiguren-Fernandez,
A., Kreisberg, N. M., Kuang, C., and Attoui, M.: Detec-
tion near 1-nm with a Laminar-Flow, Water-Based Conden-
Acknowledgements. This work was funded by the ClerVolc project sation Particle Counter, Aerosol Science Tech., 51, 354–362,
– Program 1 “Detection and characterization of volcanic plumes https://doi.org/10.1080/02786826.2016.1262531, 2016.
and ash clouds” funded by the French government’s “Laboratory of Jiang, J., Attoui, M., Heim, M., Brunelli, N. A., Mc-
Excellence” initiative. Murry, P., Kasper, G., Flagan, Richard C.and Giaspis,
K., and Mouret, G.: Transfer Functions and Penetrations
of Five Differential Mobility Analyzers for Sub-2 nm
Review statement. This paper was edited by Szymon Malinowski Particle Classification, Aerosol Sci. Tech., 45, 480–492,
and reviewed by four anonymous referees. https://doi.org/10.1080/02786826.2010.546819, 2011.
Kangasluoma, J., Junninen, H., Lehtipalo, K., Mikkilä, J., Van-
hanen, J., Attoui, M., Sipilä, M., Worsnop, D., Kulmala, M., and
Petäjä, T.: Remarks on Ion Generation for CPC Detection Effi-
ciency Studies in Sub-3-nm Size Range, Aerosol Sci. Tech., 47,
556–563, https://doi.org/10.1080/02786826.2013.773393, 2013.
References Kangasluoma, J., Kuang, C., Wimmer, D., Rissanen, M. P., Lehti-
palo, K., Ehn, M., Worsnop, D. R., Wang, J., Kulmala, M., and
Barmpounis, K., Ranjithkumar, A., Schmidt, A.-O., Attoui, M., and Petäjä, T.: Sub-3 nm particle size and composition dependent re-
Biskos, G.: Enhancing the detection efficiency of condensation sponse of a nano-CPC battery, Atmos. Meas. Tech., 7, 689–700,
particle counters for sub-2 nm particles, J. Aerosol Sci., 117, 44– https://doi.org/10.5194/amt-7-689-2014, 2014.
53, https://doi.org/10.1016/j.jaerosci.2017.12.005, 2018. Kangasluoma, J., Ahonen, L., ATTOUI, M., Vuollekoski, H.,
Boulon, J., Sellegri, K., Venzac, H., Picard, D., Weingartner, E., Kulmala, M., and Petäjä, T.: Sub-3 nm particle detection
Wehrle, G., Collaud Coen, M., Bütikofer, R., Flückiger, E., with commercial TSI 3772 and Airmodus A20 fine conden-
Baltensperger, U., and Laj, P.: New particle formation and ul- sation particle counters, Aerosol Sci. Tech., 49, 674–681,
trafine charged aerosol climatology at a high altitude site in https://doi.org/10.1080/02786826.2015.1058481, 2015.
the Alps (Jungfraujoch, 3580 m a.s.l., Switzerland), Atmos. Kangasluoma, J., Attoui, M., Korhonen, F., Ahonen, L., Siivola, E.,
Chem. Phys., 10, 9333–9349, https://doi.org/10.5194/acp-10- and Petäjäa, T.: Characterization of a Herrmann-type highresolu-
9333-2010, 2010. tion differential mobility analyzer, Aerosol Sci. Tech., 50, 222–
Boulon, J., Sellegri, K., Hervo, M., Picard, D., Pichon, J.-M., 229, https://doi.org/10.1080/02786826.2016.1142065, 2016.
Fréville, P., and Laj, P.: Investigation of nucleation events ver- Kangasluoma, J., Hering, S., Picard, D., Lewis, G., Enroth, J., Ko-
tical extent: a long term study at two different altitude sites, At- rhonen, F., Kulmala, M., Sellegri, K., Attoui, M., and Petäjä,
mos. Chem. Phys., 11, 5625–5639, https://doi.org/10.5194/acp- T.: Characterization of three new condensation particle counters
11-5625-2011, 2011. for sub-3 nm particle detection during the Helsinki CPC work-
Bricard, J., Cazes, P., Reiss, P., and Turpin, P.-Y.: Contribution shop: the ADI versatile water CPC, TSI 3777 nano enhancer
à l’étude de l’aérosol atmosphérique dans le domaine submi- and boosted TSI 3010, Atmos. Meas. Tech., 10, 2271–2281,
cronique à l’aide de méthodes photoélectriques, Academie des https://doi.org/10.5194/amt-10-2271-2017, 2017.
Sciences Paris Comptes Rendus Serie B Sciences Physiques, Keady, P. B.: Condensation Nucleus Counter US Patent
275, 263–266, 1972. US4790650A, 1988.
Bricard, J., Delattre, P., Madelaine, G., and Pourprix, M.: Detection Kesten, J., Reineking, A., and Porstendörfer, J.: Cal-
of ultra-fine particles by means of a continuous flux condensation ibration of a TSI Model 3025 Ultrafine Condensa-
nuclei counter, Academic Press, 1976.
www.atmos-meas-tech.net/12/2531/2019/ Atmos. Meas. Tech., 12, 2531–2543, 20192542 D. Picard et al.: B3010: a boosted TSI 3010 tion Particle Counter, Aerosol Sci. Tech., 15, 107–111, posphere and tropopause region, Atmos. Res., 44, 333–356, https://doi.org/10.1080/02786829108959517, 1991. https://doi.org/10.1016/S0169-8095(96)00034-8, 1997. Knutson, E. and Whitby, K.: Aerosol classification by electric mo- Seifert, M., Tiede, R., Schnaiter, M., Linke, C., Möhler, bility: apparatus, theory, and applications, J. Aerosol Sci., 6, O., Schurath, U., and Ström, J.: Operation and perfor- 443–451, https://doi.org/10.1016/0021-8502(75)90060-9, 1975. mance of a differential mobility particle sizer and a TSI Kuang, C., Chen, M., McMurry, P. H., and Wang, J.: Mod- 3010 condensation particle counter at stratospheric tem- ification of Laminar Flow Ultrafine Condensation Par- peratures and pressures, J. Aerosol Sci., 35, 981–993, ticle Counters for the Enhanced Detection of 1 nm https://doi.org/10.1016/j.jaerosci.2004.03.002, 2004. Condensation Nuclei, Aerosol Sci. Tech., 46, 309–315, Spracklen, D. V., Carslaw, K. S., Kulmala, M., Kerminen, V.-M., https://doi.org/10.1080/02786826.2011.626815, 2012. Mann, G. W., and Sihto, S.-L.: The contribution of boundary Kulmala, M., Vehkamäki, H., Petäjä, T., Dal Maso, M., Lauri, layer nucleation events to total particle concentrations on re- A., Kerminen, V.-M., Birmili, W., and McMurry, P.: For- gional and global scales, Atmos. Chem. Phys., 6, 5631–5648, mation and growth rates of ultrafine atmospheric parti- https://doi.org/10.5194/acp-6-5631-2006, 2006. cles: a review of observations, Aerosol Sci., 35, 143–176, Stolzenburg, M. and McMurry, P.: An Ultrafine Aerosol Condensa- https://doi.org/10.1016/j.jaerosci.2003.10.003, 2004. tion Nucleus Counter, Aerosol Sci. Tech., 14, 48–65, 1991. Landau, I. D.: Identification et commande des systèmes, Hermès Ström, J. and Ohlsson, S.: In situ measurements of enhanced Science Publications, 2nd edition edn., 1993. crystal number densities in cirrus clouds caused by air- McMurry, P. H.: The History of Condensation Nu- craft exhaust, J. Geophys. Res.-Atmos., 103, 11355–11361, cleus Counters, Aerosol Sci. Tech., 33, 297–322, https://doi.org/10.1029/98JD00807, 1998. https://doi.org/10.1080/02786820050121512, 2000. Ude, S. and Fernandez De La Mora, J.: Molecular monodisperse Mertes, S., Schröder, F., and Wiedensohler, A.: The Particle De- mobility and mass standards from electrosprays of tetra-alkyl tection Efficiency Curve of the TSI3010 CPC as a Function of ammonium halides, J. Aerosol Sci., 36, 1224–1237, 2005. the Temperature Difference between Saturator and Condenser, Venzac, H., Sellegri, K., and Laj, P.: Nucleation events detected Aerosol Sci. Tech., 23, 257–261, 1995. at the high altitude site of the Puy de Dôme Research Station, O’Dowd, C. D., Geever, M., Hill, M. K., Smith, M. H., and Jen- France, Boreal Environ. Res., 12, 345–359, 2007. nings, S. G.: New particle formation: Nucleation rates and spatial Venzac, H., Sellegri, K., Laj, P., Villani, P., Bonasoni, P., scales in the clean marine coastal environment, Geophys. Res. Marinoni, A., Cristofanelli, P., Calzolari, F., Fuzzi, S., Lett., 25, 1661–1664, https://doi.org/10.1029/98GL01005, 1998. Decesari, S., Facchini, M.-C., Vuillermoz, E., and Verza, O’Dowd, C. D., Yoon, Y. J., Junkerman, W., Aalto, P., Kulmala, G. P.: High Frequency New Particle Formation in the M., Lihavainen, H., and Viisanen, Y.: Airborne measurements of Himalayas, P. Natl. Acad. Sci. USA, 105, 15666–15671, nucleation mode particles I: coastal nucleation and growth rates, https://doi.org/10.1073/pnas.0801355105, 2008. Atmos. Chem. Phys., 7, 1491–1501, https://doi.org/10.5194/acp- Wang, S. C. and Flagan, R. C.: Scanning Electrical Mo- 7-1491-2007, 2007. bility Spectrometer, Aerosol Sci. Tech., 13, 230–240, O’Dowd, C. D., Yoon, Y. J., Junkermann, W., Aalto, P., Kulmala, https://doi.org/10.1080/02786829008959441, 1990. M., Lihavainen, H., and Viisanen, Y.: Airborne measurements Wiedensohler, A., Aalto, P., Heintzenberg, J., and McMurry, of nucleation mode particles II: boreal forest nucleation events, P. H.: Intercomparison of Four Methods to Determine Atmos. Chem. Phys., 9, 937–944, https://doi.org/10.5194/acp-9- Size Distributions of Low-Concentration (ca. 100 1/cm), 937-2009, 2009. Ultrafine Aerosols (3 < Dp < 10 nm) with Illustrative Peineke, C., Attoui, M., and Schmitt-Ott, A.: Using a glowing wire Data from the Arctic, Aerosol Sci. Tech., 2, 95–109, generator for production of charged, uniformly sized nanopar- https://doi.org/10.1080/02786829408959700, 1994. ticles at high concentrations, J. Aerosol Sci., 37, 1651–1661, Wiedensohler, A., Orsini, D., Covert, D. S., Coffmann, D., Cantrell, https://doi.org/10.1016/j.jaerosci.2006.06.006, 2006. W., Havlicek, M., Brechtel, F. J., Russell, L. M., Weber, Pisani, J. F. and Thomson, G. H.: Coincidence errors R. J., Gras, J., Hudson, J. G., and Litchy, M.: Intercomparison in automatic particle counters, J. Phys., 4, 359–361, Study of the Size-Dependent Counting Efficiency of 26 Con- https://doi.org/10.1088/0022-3735/4/5/006, 1971. densation Particle Counters, Aerosol Sci. Tech., 27, 224–242, Rose, C., Sellegri, K., Freney, E., Dupuy, R., Colomb, A., Pichon, https://doi.org/10.1080/02786829708965469, 1997. J.-M., Ribeiro, M., Bourianne, T., Burnet, F., and Schwarzen- Wilson, C. T. R.: Condensation of Water Vapour in the Presence of boeck, A.: Airborne measurements of new particle formation Dust-Free Air and other Gases, Philos. T. Roy. Soc. Lond., 189, in the free troposphere above the Mediterranean Sea during the 265–307, 1897. HYMEX campaign, Atmos. Chem. Phys., 15, 10203–10218, Wilson, C. T. R.: On the condensation nuclei produced in gases by https://doi.org/10.5194/acp-15-10203-2015, 2015. the action of röntgen rays, uranium rays, ultra-violet light, and Russell, L. M., Zhang, S.-H., Flagan, R. C., Seinfeld, J. H., Stolzen- other agents, Philos. T. Roy. Soc. Lond., 192, 403–453, 1899. burg, M. R., and Caldow, R.: Radially Classified Aerosol Detec- Winkler, P. M., Steiner, G., Vrtala, A., Vehkamäki, H., Noppel, M., tor for Aircraft-Based Submicron Aerosol Measurements, J. At- Lehtinen, K. E. J., Reischl, G. P., Wagner, P. E., and Kulmala, M.: mos. Ocean. Tech., 13, 598–609, https://doi.org/10.1175/1520- Heterogeneous Nucleation Experiments Bridging the Scale from 0426(1996)0132.0.CO;2, 1996. Molecular Ion Clusters to Nanoparticles, Science, 319, 1374– Schröder, F. and Ström, J.: Aircraft measurements of sub mi- 1377, https://doi.org/10.1126/science.1149034, 2008. crometer aerosol particles (> 7 nm) in the midlatitude free tro- Atmos. Meas. Tech., 12, 2531–2543, 2019 www.atmos-meas-tech.net/12/2531/2019/
D. Picard et al.: B3010: a boosted TSI 3010                                                             2543

Woo, K. S., Chen, D. R., Pui, D. Y. H., and McMurry, P. H.:
 Measurement of Atlanta Aerosol Size Distributions: Observa-
 tions of Ultrafine Particle Events, Aerosol Sci. Tech., 34, 75–87,
 https://doi.org/10.1080/02786820120056, 2001.

www.atmos-meas-tech.net/12/2531/2019/                                 Atmos. Meas. Tech., 12, 2531–2543, 2019
You can also read