Identification of intima to media signals for flow induced vascular remodeling using correlative gene expression analysis
←
→
Page content transcription
If your browser does not render page correctly, please read the page content below
www.nature.com/scientificreports
OPEN Identification of intima‑to‑media
signals for flow‑induced vascular
remodeling using correlative gene
expression analysis
John Kolega1,2*, Kerry E. Poppenberg1,3, Hee‑Woong Lim4, Liza C. Gutierrez1,3,
Sricharan S. Veeturi1,5, Adnan H. Siddiqui1,3, Hamidreza Rajabzadeh‑Oghaz1,3 &
Vincent M. Tutino1,2,3,5
Changes in blood flow can induce arterial remodeling. Intimal cells sense flow and send signals to
the media to initiate remodeling. However, the nature of such intima-media signaling is not fully
understood. To identify potential signals, New Zealand white rabbits underwent bilateral carotid
ligation to increase flow in the basilar artery or sham surgery (n = 2 ligated, n = 2 sham). Flow
was measured by transcranial Doppler ultrasonography, vessel geometry was determined by 3D
angiography, and hemodynamics were quantified by computational fluid dynamics. 24 h post-surgery,
the basilar artery and terminus were embedded for sectioning. Intima and media were separately
microdissected from the sections, and whole transcriptomes were obtained by RNA-seq. Correlation
analysis of expression across all possible intima-media gene pairs revealed potential remodeling
signals. Carotid ligation increased flow in the basilar artery and terminus and caused differential
expression of 194 intimal genes and 529 medial genes. 29,777 intima-media gene pairs exhibited
correlated expression. 18 intimal genes had > 200 medial correlates and coded for extracellular
products. Gene ontology of the medial correlates showed enrichment of organonitrogen metabolism,
leukocyte activation/immune response, and secretion/exocytosis processes. This demonstrates
correlative expression analysis of intimal and medial genes can reveal novel signals that may regulate
flow-induced arterial remodeling.
Blood flow exerts fluid shear stress on the endothelial lining of arteries. When flow changes, the associated
changes in shear stress elicit endothelial responses that alter the vessel wall to accommodate the new flow1–3.
Although it is endothelial cells (ECs) that directly experience the shear stress, most of the changes in vessel archi-
tecture result from activities of the underlying vascular smooth muscle cells (VSMCs). During transient changes
in flow, such as the increase that occurs during exercise, ECs respond to the altered shear stress within s econds4,
sending signals that modulate VSMC contractility to produce vasodilation. The vessel enlarges, but the change is
temporary and subsides over the course of several minutes to ~ 2 h when the stimulus is r emoved5. In contrast,
sustained changes in shear stress cause long-term structural remodeling of the vessel wall involving changes in
cell number and matrix architecture. Flow-sensitive EC signals that regulate VSMC contractility are well char-
acterized, but long-term remodeling appears to be mediated by different m echanisms6 and is less understood.
Remodeling requires degradation and synthesis of extracellular matrix (ECM), and thus local production of
matrix metalloproteases7,8. In some vessel expansion, at least a portion of this matrix turnover can be attributed
to inflammatory cells, such as macrophages, invading the vessel wall in response to cytokines and adhesion
molecules produced by E Cs9,10 Inflammatory infiltrates contribute to the degradation and synthesis of extracel-
lular matrix (ECM) and secrete factors promoting growth, proliferation, and/or apoptosis of VMSCs11,12. How-
ever, removal of endothelium, which would give circulating macrophages direct access to the media, inhibits
1
Canon Stroke and Vascular Research Center, University at Buffalo, Buffalo, NY, USA. 2Department of
Pathology and Anatomical Sciences, University at Buffalo, 955 Main Street, Room 4102, Buffalo, NY 14203,
USA. 3Department of Neurosurgery, University at Buffalo, Buffalo, NY, USA. 4Division of Biomedical Informatics,
Department of Pediatrics, Cincinnati Children’s Hospital Medical Center, University of Cincinnati College of
Medicine, Cincinnati, OH, USA. 5Department of Mechanical and Aerospace Engineering, University at Buffalo,
Buffalo, NY, USA. *email: kolega@buffalo.edu
Scientific Reports | (2021) 11:16142 | https://doi.org/10.1038/s41598-021-95403-x 1
Vol.:(0123456789)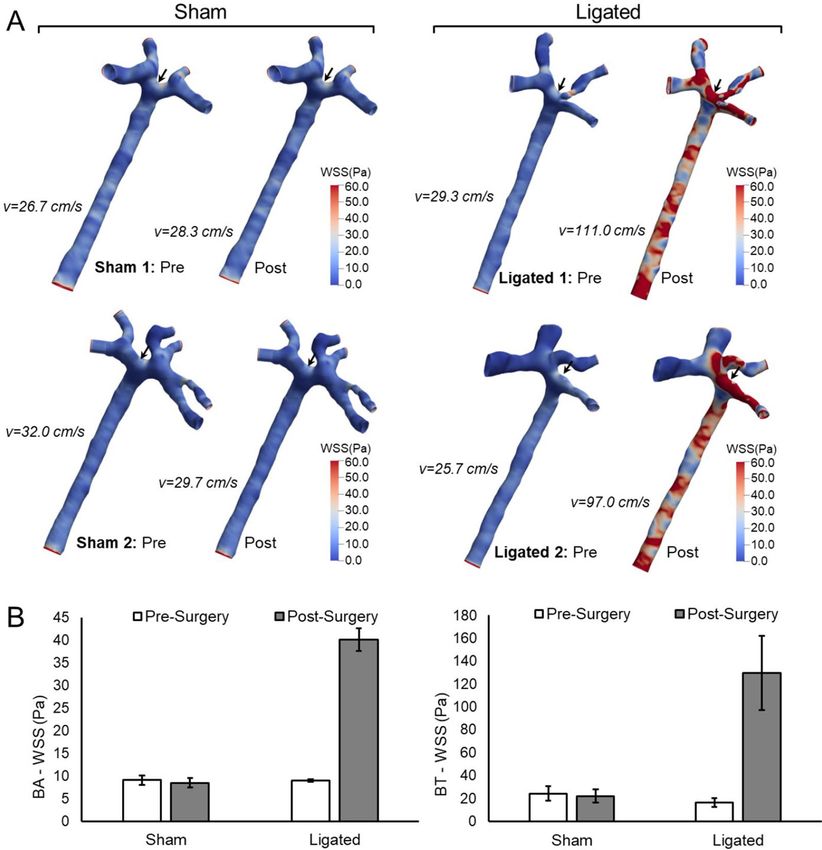
www.nature.com/scientificreports/
remodeling both in the case of expansive remodeling under chronic high flow (in response to arteriovenous
fistula13), and when vessels reduce their diameter under chronic low flow (after partial o
cclusion14). Furthermore,
we have shown that when flow is elevated in rabbit basilar arteries (BAs), VSMCs upregulate inflammatory mark-
ers and metalloproteases, even before any infiltrating cell populations can be detected15,16. These observations
suggest that EC signals can directly trigger flow-induced remodeling behavior in resident VSMCs.
Studies have shown that shear stress modulates EC expression of many diffusible signals, including V EGF17,
18,19 20 21 22,23
PDGF , TGF-β , a variety of c ytokines , and nitric o xide , each of which can stimulate remodeling-related
behaviors in VSMCs, such as migration, proliferation, and extracellular matrix production. PDGF expression
ow24; genetic knockout of TGF-β receptor in VSMCs
correlates with constrictive remodeling in response to low fl
inhibited constrictive remodeling in mouse carotid arteries25; and both growth factors contribute to recruit-
ment and maturation of mural cells during vessel development26. Nitric oxide has been strongly implicated
in stimulating arterial enlargement, with several groups showing that disruption of its production prevents or
diminishes expansive remodeling under elevated fl ow27–31. However, despite the existing catalog of pathways
for EC-to-VSMC communication, the specific molecular events that link stimulation of the intima by flow to
structure-altering responses in the media remain sparsely characterized.
In the present study, we demonstrate a strategy for identifying potential molecular signals between endothe-
lium and smooth muscle during flow-induced arterial remodeling. Specifically, we performed transcriptome
profiling in the intima and media of rabbit BAs subjected to various flow conditions, and then looked for parallel
changes in intimal and medial gene expression that are consistent with a signal-response relationship. We found
multiple intimal genes that encode transmittable signals and whose expression correlated with flow-induced
changes in medial genes that are involved in arterial remodeling. This correlative approach identified novel
potential avenues for crosstalk between ECs and VSMCs related to flow-induced arterial remodeling. The results
suggest that vessel structure may be regulated by multiple flow-sensitive signals, and demonstrate that correlative
analysis of intimal and medial gene expression is a powerful tool for further dissection of the complex control
of arterial structure.
Results
Flow environments. Flow in the basilar arteries (BAs) of rabbits was modulated by surgically ligating both
common carotid arteries for 24 h4,5,53. This resulted in a sustained increase in flow in the BA, as determined by
transcranial Doppler (TCD) measurements (Supplemental Fig. 1). Wall shear stress (WSS) in the BA and at the
basilar terminus (BT) was computed from the flow velocity and vessel geometry (determined by 3D angiogra-
phy) using computational fluid dynamics (CFD). Figure 1A,B show that WSS is slightly higher at the BT than in
the BA, and that the increased flow after ligation was accompanied by increased WSS throughout the BA (aver-
age WSS = 40 Pa in ligated rabbits vs. 10 Pa pre-ligation or in sham animals) and an even larger increase at the
BT (from ~ 20 Pa in unligated animals to ~ 130 Pa after ligation). We also calculated oscillating flow index, cross
flow index, WSS gradient in the direction of flow and transverse WSS at each location (Supplemental Fig. 2).
Ligation produced no consistent changes in oscillating flow index or cross flow index, while both longitudinal
and transverse gradients in WSS tended to increase in parallel with higher WSS, as would be expected.
Separation of intimal and medial tissue from discrete flow environments. Tissue was harvested
for analysis of gene expression 24 h after ligation, which is well past the window for activating vasodilation or
constriction. Apoptosis, matrix degradation, and medial thinning are evident by 48 h after ligation15, so gene
expression persisting after 24 h represents sustained responses that may contribute to long-term remodeling.
In order to examine gene expression in ECs and VSMCs at locations subjected to different WSS, we performed
RNA-seq on intima and media from four different flow environments: (1) the straight portion of the BA in ani-
mals with normal flow, (2) the regions flanking the apex of the BT in animals with normal flow, where WSS is
slightly higher than in the BA, (3) the BA after carotid ligation, where WSS is elevated, and (4) the BT after liga-
tion, where the highest levels of WSS were found (Fig. 1). The tissues were obtained by cutting frozen sections of
the arteries and using laser microdissection to collect the desired regions. BA tissue was collected in longitudinal
strips distributed over the full length of the straight portion of the artery proximal to the BT, and BT tissue was
collected from the wall flanking the bifurcation apex, extending 400–500 µm downstream into the branches on
each side (Supplemental Fig. 3). The dissected materials correspond to the regions over which WSS is averaged
for the graphs in Fig. 1B, and for later comparisons of gene expression relative to local WSS.
Note that laser microdissection allowed us to obtain separate samples from the intima and from the media
at each location. Thus, 16 samples were obtained: from the intima and media of the BA and BT of two rabbits
with ligated carotid arteries and from the same locations in two un-ligated rabbits. cDNA libraries were then
constructed from each sample. Based on RNA-seq performed at a depth of > 5 × 50 reads, we found that in each
sample > 70% of reads aligned to exons. Expression of the endothelial markers, PECAM1, VWF, and CDH5 was
minimal or undetectable in medial samples and abundant in the intimal samples. PECAM1 expression was on
average 34-fold higher in the intima; VWF expression 12-fold higher, and CHD5 at least 7-fold higher (CHD5
was undetectable in two media samples and so “infinitely more abundant” in the corresponding intima). Because
the intima is very thin and extremely close to the media, it was impossible to collect the full thickness of the
endothelial layer without obtaining some smooth muscle during laser microdissection. Thus, there was a greater
proportion of medial “contamination” in the intimal samples. In the intima, average levels of the smooth-muscle
markers, DES, ACTA2, and MYH11, were 18%, 37%, and 43% of the levels in the media, respectively. Relative
expression of the endothelial and smooth-muscle markers for each pair of intima-media tissues are shown in
Supplemental Fig. 4. Principal component analysis of gene expression levels in the 16 samples showed separation
Scientific Reports | (2021) 11:16142 | https://doi.org/10.1038/s41598-021-95403-x 2
Vol:.(1234567890)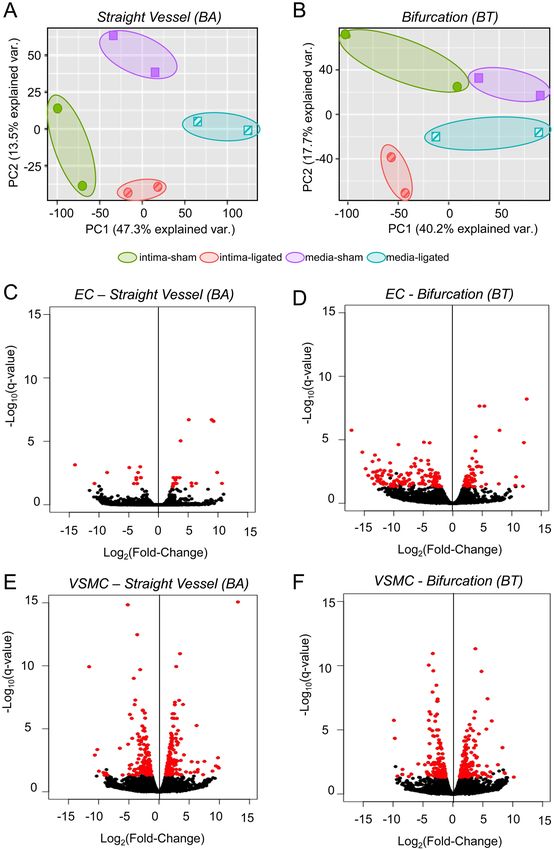
www.nature.com/scientificreports/
Figure 1. WSS at the BA and BT before and after carotid ligation. (A) 3D renderings showing the distribution
of WSS at the luminal surface of the BA and BT. WSS was calculated by CFD as described in Materials and
Methods based on the indicated flow rates, which were measured by TCD sonography. (B) Average WSS values
are shown for each location and condition. WSS in the BA was averaged over the length of the vessel, the value
for the BT was averaged over the vessel surface within a 1 mm diameter sphere centered at the apex of the
bifurcation (arrow). WSS is higher at the BT than the BA, and is increased at both locations after ligation, while
sham surgery had no effect.
of intimal from medial samples at both locations, as well as separation between samples exposed to normal versus
high flow (Fig. 2A,B; Supplemental Fig. 5).
We also found no detectable expression of the genes encoding CD14, 16, 19, 64 or 68, cell surface markers
found on monocyte, macrophages, and B- and T-cells in the transcriptomes of ligated or unligated animals. This
supports our previous reports that there is little or no infiltration of the artery wall by inflammatory cells during
the early stages of flow-induced r emodeling15,16, and is consistent with endothelial and smooth muscle cells being
the dominant contributors to our intimal and medial transcriptomes.
Differential gene expression in the intima under high flow. Comparison of RNA-seq data for tis-
sues from ligated versus unligated animals revealed numerous genes in both the intima and media whose expres-
sion was detectable, i.e. genes with maximum average expression > 1 reads per kilobase of transcript per million
mapped reads (RPKM) in each group. We defined differentially expressed genes (DEGs) as those that had a false
discovery rate corrected p-value (q-value) < 0.05 for any comparison (Fig. 2C–F). In the intima, there were 31
DEGs in the straight BA segment (19 with increased expression, 12 with decreased expression) and 180 DEGs at
the BT bifurcation (54 with increased expression, 126 with decreased expression) (Fig. 2C,D). These include 21
genes that were differentially expressed at both locations.
Examination of the gene ontologies associated with these expression changes revealed patterns consistent
with production of signals for transmission to VSMCs in the media (Supplemental Table 1). Intimal DEGs that
Scientific Reports | (2021) 11:16142 | https://doi.org/10.1038/s41598-021-95403-x 3
Vol.:(0123456789)www.nature.com/scientificreports/
Figure 2. Principal component analysis of gene expression levels in the 16 samples, and differential expression analysis. (A,
B). Principal component analysis was performed on the gene expression levels for all genes that had a count sum > 0 across
all samples. The first two principal components for the collective gene expression in each sample are plotted for samples
from (A) straight vessel segments and (B) bifurcations. In both cases, intima samples (circles) are spatially separated form
media samples (squares). In addition, sham tissues (solid symbols) are distinguished from tissues taken from ligated animals
(hatched symbols). Colored ellipses indicate paired duplicates from 2 different rabbits. (C–F) Gene expression in tissues from
ligated and unligated rabbits was compared by RNA-seq. Volcano plots show fold change and p-value for comparisons at BA
intima (C), BT intima (D), BA media (E), and BT media (F). Each dot represents one gene, and red dots indicate DEGs, i.e.
detectable genes with q-value < 0.05.
Scientific Reports | (2021) 11:16142 | https://doi.org/10.1038/s41598-021-95403-x 4
Vol:.(1234567890)www.nature.com/scientificreports/
were upregulated in straight vessels after ligation were enriched in terms associated with hormone regulation,
secretion/export, and hydrogen peroxide production. Hydrogen peroxide is a known vasoregulator of cerebral
and mesenteric arteries32–35. Hormone regulation was also the most significant biological process returned by
gene ontology of upregulated genes at the BT. Upregulated intimal genes at the BT were additionally associated
with inflammatory response, regulation of fluid and coagulation, and numerous processes related to cell move-
ment, possibly reflecting a wound-type response. Meanwhile, DEGs that were downregulated by increased flow
were enriched for keratan sulfate catabolism in the intima of straight-vessels, and, in the intima at bifurcations,
downregulated DEGs were enriched for biological processes involved in regulation of hydrolase and peptidase
activities and chemotaxis, again suggesting a wound-like phenotype.
Differential gene expression in the media under high flow. Comparison of gene expression in the
media of ligated versus unligated animals revealed 334 genes that were differentially expressed in the BA (190
with increased expression, 144 with decreased expression) and 303 genes at the BT (159 with increased expres-
sion, 144 with decreased expression) (Fig. 2E,F). 113 genes were differentially expressed at both locations. Gene
ontologies of the DEGs in the media were indicative of extensive nuclear re-organization as well as re-structur-
ing at the whole-cell level (Supplemental Table 2). In straight vessel segments, DEGs that were upregulated by
increased flow were associated with biological processes related to DNA synthesis and telomere maintenance,
and RNA/protein localization in Cajal bodies and the nucleus, reflecting altered nuclear structure. Biological
processes involved in cell and tissue rearrangement were also overrepresented, including multiple terms for
extracellular matrix and integrin signaling; development and remodeling; and cell migration and localization.
Finally, the ontologies returned significant terms for leukocyte activation, cytokines, and responses to stress and
chemical/organic substances, possibly reflecting pathways that recruit other local and systemic cells for remod-
eling responses. Significant terms associated with DEGs that had decreased expression were related to ECM
organization and cell adhesion.
At the BT bifurcation, flow-increased DEGs in the media were associated with wound healing, locomotion,
and remodeling, and with immune cell activity and responses to chemical and organic substances, as was found in
straight segments. In addition, coagulation, hemostasis and secretion/exocytosis were overrepresented biological
processes at the BT, consistent with extracellular remodeling events. Terms associated with down-regulated DEGs
included matrix/structure organization, hydrolase activity, adhesion, and muscle development. Such changes
may reflect VSMCs de-differentiating from the so-called contractile state to a more synthetic phenotype, which
occurs during vascular r emodeling15,16,36.
Potential intimal signals for medial remodeling. When flow increases in a vessel, ECs in the intima
are exposed to increased WSS. In order for this to elicit remodeling behaviors by the VSMCs in the media, ECs
presumably express and release transmittable signal(s). Of the 194 flow-modulated intimal DEGs, 49 code for
extracellular products (Table 1). The expression of 10 of these extracellularly-expressed DEGs were significantly
affected by increased flow in straight vessels (3 were upregulated and 7 were downregulated), and 44 exhibited
significant changes at bifurcations (11 upregulated and 33 downregulated). To examine whether the products
encoded by these intimal genes were likely to be affecting VSMCs in the media, we looked for correlations
between intimal and medial gene expression.
For each intimal DEG, we compared its expression across the eight sample locations (BA and BT in two
ligated and two unligated animals) with the expression of each individual medial DEG at the same location.
We found 14,286 positively correlating gene pairs (Pearson correlation coefficient > 0.9; p < 0.0001), and 15,491
gene pairs that correlated negatively (Pearson correlation coefficient < − 0.9; p < 0.0001). For each of the 194
intimal DEGs, expression levels correlated with between 6 and 301 different genes in the media (Supplemental
Table 3). The 49 intimal DEGs that encode extracellular products correlated with 6 to 287 medial genes, with 18
extracellular-encoding intimal DEGs having > 200 medial correlates (Table 2). We focused further analysis on
these 18 highly correlated intimal DEGs.
Gene ontologies of medial genes that correlate with flow‑sensitive intimal genes. To deter-
mine what responses the 18 most-correlated, extracellular product-encoding, intimal DEGs might signal in
VSMCs, we performed gene ontology enrichment analysis on the correlating medial genes. Six of the 18 genes
of interest exhibited increased expression in response to ligation both in bifurcations and in straight vessels,
and the remaining 12 had decreased expression at both sites. Although all six upregulated genes displayed
higher expression at both locations in ligated animals, in the BA the difference was statistically significant only
for GLIPR, TIMP1, and SERPINE1 (all except GLIPR1 were significantly upregulated by flow at the BT). This
may reflect the much higher post-ligation WSS experienced at the BT. For each of the six upregulated genes,
we examined gene ontologies of the positively correlating medial genes in g:Profiler. All significantly enriched
ontologies (q-value < 0.05) from the six gene sets were pooled and ranked by occurrence, and the rankings were
used to reduce and summarize the biological process gene ontologies to facilitate identification of the most
important regulated ontologies. As illustrated in Fig. 3A, the most prominent biological process was organoni-
trogen compound metabolism, consistent with previous reports of an important role for nitrous oxide in regulat-
ing arteriogenesis27–31. In addition, two groups of multiple terms were related to leukocyte activation/immune
responses (red ontologies in Fig. 3A) and secretion/exocytosis (shown in green in Fig. 3A), consistent with
the pro-inflammatory environment and accompanying release of cytokines, proteases, and matrix proteins that
occur during vascular r emodeling9,10,37–40. Wound healing and positive regulation of cell migration were also
significantly associated with the up-regulated gene sets. The same analysis applied to the negatively correlating
medial genes did not yield any significantly enriched biological processes.
Scientific Reports | (2021) 11:16142 | https://doi.org/10.1038/s41598-021-95403-x 5
Vol.:(0123456789)www.nature.com/scientificreports/
Bifurcation Straight vessel
DEG Product class Log2(F-C) q-value Log2(F-C) q-value
Up-regulated genes
CHI3L2 Enzyme 11.88 0.0469a 0.00 1.0000
SERPINA6 Other 10.72 0.0084a 5.06 0.4320
HBEGF GF 4.80 0.0014a 1.08 1.0000
TIMP1 Cytokine 4.52 0.0000a 3.74 0.0000a
ADAMTS9 Peptidase 4.08 0.0013 a
2.70 0.1782
SERPINE1 Other 3.91 0.0000a 2.49 0.0216a
SEMA3F Other 3.39 0.0022a 2.12 0.3327
BMP2 GF 3.35 0.0497a 0.34 1.0000
IL15 Cytokine 3.11 0.0142a 1.79 0.6464
PLAT Peptidase 2.77 0.0261a 1.35 0.8802
ADAMTS6 Peptidase 2.63 0.0456a 1.74 0.6622
GLIPR1 Other 1.06 0.5043 2.42 0.0340a
Down-regulated genes
PTN Growth factor − 17.17 0.0000a − 7.86 0.2483
PROS1 Other − 14.76 0.0019a − 1.58 1.0000
MFAP5 Other − 12.86 0.0030a − 9.54 0.1498
VIT Other − 12.80 0.0030a 1.44 1.0000
CST6 Other − 12.76 0.0107a − 8.97 0.3702
C1QA Other − 12.48 0.0186a − 0.78 1.0000
TTR Transporter − 12.18 0.0275a − 7.27 0.7186
C2 Peptidase − 11.60 0.0265a − 2.14 1.0000
CXCL10 Cytokine − 11.55 0.0027a 3.42 0.7338
NID2 Other − 10.86 0.0056a − 0.75 1.0000
C1QTNF7 Other − 10.64 0.0007a − 8.63 0.0029a
CXCL11 Cytokine − 10.15 0.0322 a
− 0.88 1.0000
BMP3 Growth factor − 9.57 0.0045a − 0.12 1.0000
HP Peptidase − 9.10 0.0080a − 1.54 1.0000
C1QC Other − 8.76 0.0056a − 1.71 1.0000
ITIH2 Other − 8.61 0.0206a 1.24 1.0000
IGF1 Growth factor − 8.54 0.0339a 0.80 1.0000
PLA2G7 Enzyme − 8.30 0.0112a − 3.68 0.7504
LYPD6 Other − 7.78 0.0182a − 9.65 0.0609
RSPO3 Kinase − 6.86 0.0664 5.41 0.9693
ANGPTL4 Other − 6.76 0.0253a − 2.53 0.9693
NDP Growth factor − 6.71 0.0583 − 10.76 0.0216a
SPP1 Cytokine − 5.39 0.0004a − 4.13 0.0216a
IGFBP2 Other − 5.12 0.0286 a
− 2.92 0.6982
OGN Growth factor − 4.91 0.0000a − 2.19 0.3549
SERPINF1 Other − 4.70 0.0322a 1.87 0.9852
CYTL1 Cytokine − 4.14 0.0008a − 3.74 0.0073a
LUM Other − 4.07 0.2310 − 14.04 0.0007a
OMD Other − 3.91 0.0000 a
− 2.94 0.0073a
ISG15 Other − 3.56 0.0024 a
0.01 1.0000
LCAT Enzyme − 3.52 0.0417a − 1.14 1.0000
ABI3BP Other − 3.21 0.0196a − 3.57 0.0216a
CYR61 Other − 3.12 0.0126a − 1.61 0.7504
SELENOP Other − 2.83 0.0040a − 1.84 0.3549
COL14A1 Other − 2.82 0.0117a − 0.79 1.0000
IGFBP6 Other − 2.81 0.0042a − 0.52 1.000
SAMD9L Other − 2.41 0.0483a 0.92 1.000
Table 1. Intimal DEGs encoding extracellular products. All genes whose expression was significantly different
between ligated and unligated animals in the intima of bifurcations (BT) or straight vessels (BA) and whose
product was classified as extracellular in the Ingenuity Pathway Analysis database are listed. DEG differentially
expressed gene, F-C fold-change. a Significantly different expression between ligated and unligated.
Scientific Reports | (2021) 11:16142 | https://doi.org/10.1038/s41598-021-95403-x 6
Vol:.(1234567890)www.nature.com/scientificreports/
Intimal gene # of medial correlates # of positive correlates # of negative correlates Gene product
Up-regulated by flow
SERPINA6 287 182 105 Serpin A6
GLIPR1 257 153 104 Glioma pathogenesis-related protein 1
SERPINE1 255 152 103 Serpin E1
A disintegrin and metalloprotease with
ADAMTS9 235 132 103
thrombospondin motifs 9
TIMP1 224 123 101 Tissue inhibitor of metalloprotease 1
IL15 219 112 97 Interleukin 15
Down-regulated by flow
CYTL1 283 106 177 Cytokine-like protein 1
NDP 281 104 171 Norrin
SPP1 269 89 180 Osteopontin
C1q and tumor necrosis factor-related
C1QTNF7 267 104 163
protein 7
LYPD6 254 84 170 Ly6/PLAUR domain-containing 6
LUM 251 95 156 Lumican
CYR61 250 93 157 Cell communication network factor 1
ABI3BP 239 95 144 ABI family member 3 binding protein
CST6 233 74 159 Cystatin E/M
PLA2G7 215 76 139 Phospholipase A2 group VII
OMD 204 100 104 Osteomodulin
MFAP5 202 61 141 Microfibril associated protein 5
Table 2. Highly correlated intimal DEGs with extracellular products. For each Intimal DEG encoding an
extracellular product, the number of medial DEGs whose expression significantly correlated was determined.
The intimal DEGs with > 200 medial correlates are listed. The upper portion of the table shows genes that were
upregulated by increased flow (at both the BA and BT) and the bottom genes were decreased by flow (at both
the BA and BT).
Analysis of the 12 highly correlating intimal genes (> 200 medial correlates) that were down-regulated by
increased flow revealed similar medial responses. Again, most genes changed significantly at the BT, where WSS
was higher (all but NDP and LUM were significantly lower in ligated animals), and fewer genes at the BA exhib-
ited differences that were statistically significant (NDP, LUM, C1QTNF7, SPP1, CYTL1, and OMD were lower
post-ligation, but q values were > 0.05 when comparing ligated and unligated animals). The medial genes that
were positively correlated with the 12 down-regulated intimal genes (i.e., medial genes that would also be down-
regulated under increased flow), did not yield significant gene ontologies. However, the negatively correlating
genes (which are up-regulated under increased flow) were associated with organonitrogen compound metabolism
(Fig. 3B), leukocyte activation/immune responses (shown in red) and secretion/exocytosis (in green) like the
positive correlates of upregulated intimal genes. In addition, terms related to cell migration and wound heal-
ing, and tissue remodeling and tissue development, were among the significant biological processes associated
with negative correlates. Thus, down-regulation of the respective intimal genes is predicted to produce medial
responses that are similar to those elicited by the intimal genes that are up-regulated under the same conditions.
WSS dose response of gene expression. To examine more closely the relationship between blood flow
and the expression of potential remodeling signals, gene expression levels for the 18 intimal genes with > 200
media correlates were plotted as a function of local WSS. In each animal and at each location for which expres-
sion was measured, the local WSS was calculated as the average WSS over the surface from which the tissue
was microdissected. The expression levels for 5 of the 18 genes (ADAMTS9, IL15, SERPINA6, SERPINE1, and
TIMP1) had strong positive correlations with average WSS that were well-described by a linear relationship
(r > 0.8) (Fig. 4A–E). GLIPR1 trended similarly, with expression generally higher at higher WSS, but expression
plateaued at intermediate WSS levels and the dose–response did not fit a linear curve (Fig. 4F). The remaining
12 genes were down-regulated in response to elevated flow, with markedly non-linear responses (Fig. 4G–I). For
each of these 12 genes, the highest levels of expression were observed between ~ 10 and ~ 30 Pa, and minimal or
no expression was detected in tissues experiencing WSS > 50 Pa.
Discussion
These experiments investigated the earliest changes in gene expression during flow-induced arterial remodeling
described to date. Moreover, by using laser microdissection to separate the intima and media, the responses of
the endothelial layer in the intima, which is the direct sensor of WSS (the mechanical driver of remodeling),
are separated from downstream effects on cells in the media, where most of the actual remodeling occurs. This
reveals potential signaling mechanisms between the endothelial sensor of flow (i.e. ECs) and the primary effec-
tors of remodeling within the vessel wall (VSMCs) that have not been previously identified.
Scientific Reports | (2021) 11:16142 | https://doi.org/10.1038/s41598-021-95403-x 7
Vol.:(0123456789)www.nature.com/scientificreports/
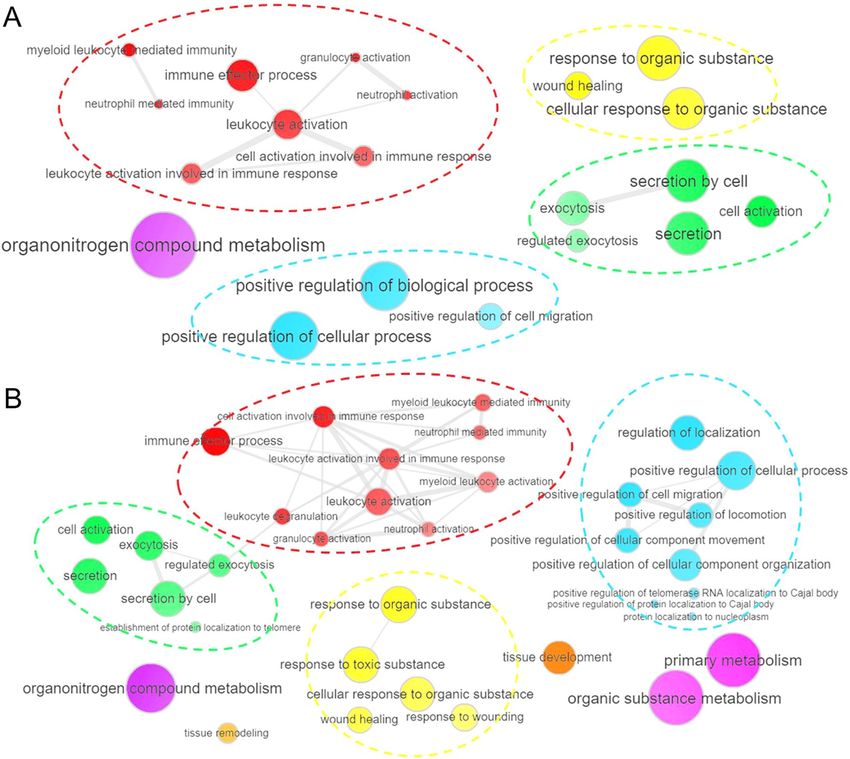
Figure 3. Biological processes associated with medial correlates of flow-sensitive intimal genes. For all the
medial genes whose expression correlated with the 18 flow-sensitive, extracellular-coding intimal genes that had
> 200 medial correlates, significantly (q-value < 0.05) over-represented GOs were identified using g:Profiler. The
diagrams summarize the biological processes terms that were present in > 50% of GOs enriched in (A) genes
positively correlated with intimal genes exhibiting higher expression in ligated animals compared to sham, and
(B) genes negatively correlated with intimal genes exhibiting lower expression in ligated animals than in sham.
Symbol sizes represent the frequency of the ontology term, and lines between symbols indicate relationships.
Groups of closely related terms are denoted by matching color and dashed ellipses. Note that organonitrogen
compound metabolism is the largest symbol in (A), and one of the largest in (B). Both diagrams show multiple
terms associated with leukocyte activation/immune responses (red) and secretion/exocytosis (green). Terms
related to wound healing and cell movement are also present in both summaries.
Flow-induced changes in expression of intimal genes that code for extracellular products represent a possible
mechanism for EC signaling to the media. Changes in the expression of signaling genes should elicit changes
in the target cells, and by examining gene expression in both the signaling and target tissues across a variety of
conditions, we identified over 29,000 gene pairs whose expression levels were significantly positively or negatively
correlated. Most notably, 18 of the intimal genes that encode extracellular products each had over 200 correlating
genes in the media consistent with a signal-response relationship. Furthermore, several of these 18 genes have
previously been implicated as effector molecules in vascular remodeling in mice. For example, the products of
CYR61 (also known as CCN1) and CYTL1 stimulate, and lumican (encoded by LUM) inhibits, angiogenesis in
tumor, skin pouch, and in vitro assays41–44; NDP acting via Fz4/Lrp receptors regulates retinal vascularization45;
and SSP1 codes for the cytokine osteopontin, which is required for post-ischemic neovascularization in a femoral
artery ligation model46. In rats, IL15, which encodes the pro-inflammatory cytokine interleukin 15, is highly
Scientific Reports | (2021) 11:16142 | https://doi.org/10.1038/s41598-021-95403-x 8
Vol:.(1234567890)www.nature.com/scientificreports/
Figure 4. Gene expression as a function of local WSS. The expression levels for the 18 intimal genes with > 200
medial correlates (as determined by RNA-seq) are shown as a function of the WSS at the sample’s location (as
determined by CFD). Expression levels of SERPINE6 (A), SERPINE1 (B), ADAMTS9 (C), TIMP1 (D), and
IL15 (E) were all positively correlated with WSS over the full range of observed values (Pearson r > 0.9). GLIPR1
(F) increased with increasing WSS, but plateaued at WSS > 40. The remaining genes displayed very non-linear
“dose–response” curves, shown in (G) CYTL1, (H) LUM, CST6, SSP1, CYR61, ABI38P and OMD, and (I). NDP,
C1QTNF7, LYPD6, PLA2G7, and MFAP5. The maximal expression values for these 12 genes are all at WSS
below 40 Pa, and expression is dramatically lower at WSS > 50 Pa.
expressed in the ductus arteriosus during development, but its expression declines dramatically after birth when
the ductus shrinks and closes47,48.
For most of the intimal genes that were upregulated by WSS, expression was proportional to WSS over a
wide range of magnitudes. This is consistent with the behavior of signals that function to induce remodeling
aimed at reducing WSS; i.e., more severe hemodynamic stress should elicit a stronger signal in order to cause
more rapid and extensive remodeling. In contrast, intimal genes that were down-regulated by WSS displayed
a dramatic decline in expression when WSS exceeded a range of 10–50 Pa. These down-regulated genes might
be involved in maintaining structural homeostasis under normal flow. Loss of maintenance signals that are
otherwise constitutively expressed could permit VSMCs to revert to a “dedifferentiated” state that is migratory
and pro-inflammatory11,12.
The number of flow-sensitive intimal genes that code for extracellular products and whose expression cor-
relates with many medial genes may reflect a complex and sensitive regulatory mechanism for flow-induced
remodeling, in which different aspects of medial responses are controlled by different signals. For example,
molecules like adamts9, lumican, phospholipase A2, serpins A6 and E1, and tissue inhibitor of metalloprotease
(which are encoded by ADAMTS9, LUM, PLA2G7, SERPINA6, SERPINE1, and TIMP1, respectively) may drive
remodeling of extracellular matrix, while cytokines like C1qTNF, interleukin 15, norrin, osteomodulin, and
osteopontin (encoded by C1QTNF, IL15, NDP, OMD, and SSP1), may primarily modulate cell proliferation
and migration. Alternatively, VSMCs may regulate remodeling behaviors based on integration of multiple sig-
nals in order to provide graded responses to different levels of flow stimuli. Such an arrangement would allow
more diverse and more nuanced behaviors than binary on–off regulation by one or two signaling molecules.
We predict that characteristic signal profiles will be observed for different remodeling scenarios. For example,
short-term elevation of flow elicits transient and reversible dilation, whereas sustained high WSS induces tissue
growth and matrix restructuring. Thus, the signal profile expressed in ECs may change over time as cells inure to
persistent mechanical stimulus. Similarly, high WSS can stimulate robust enlargement of the vessel wall, but in
other instances will trigger destructive remodeling that leads to wall thinning and aneurysm f ormation47,48. The
molecular basis for such selective initiation of constructive versus destructive remodeling is currently unknown,
but it could involve differences in the regulatory signals elicited in the ECs.
Our study has several limitations. First, the small number of biological replicates limits the statistical con-
fidence of gene expression values, and consequently may reduce the number of DEGs identified. Nonetheless,
these preliminary data show the technical feasibility of locally correlating intimal and medial gene expression, and
demonstrate the power of this approach for generating novel insights into possible regulatory pathways. Second,
Scientific Reports | (2021) 11:16142 | https://doi.org/10.1038/s41598-021-95403-x 9
Vol.:(0123456789)www.nature.com/scientificreports/
we only examined RNA expression. It is important that future work determine if the observed changes in RNA
expression for putative signaling proteins in the intima are reflected in protein production, and that the protein
products reach their expected targets. Similarly, it will be necessary to confirm whether the expression of cor-
related genes in the media result in protein production. We also plan to investigate whether the medial responses
are primarily the result of expression changes in VSMCs, or if other cell types contribute. Third, examination of
more animals and additional locations and hemodynamic conditions will be needed to establish which expres-
sion changes contribute to particular aspects of the flow response. More diverse hemodynamic conditions will
likely provide insight into the specific role of different signals in the remodeling process. For example, studying
gene expression during long- versus short-term stimulation may help define the mechanism for the transition
between transient dilation and permanent structural remodeling. Likewise, comparison of expression profiles
during the onset of constructive vessel expansion versus the beginning of destructive remodeling such as occurs
during aneurysm i nitiation9,10,15,49, could identify discriminating signals. Mapping gene expression during aneu-
rysm initiation will likely require more detailed calculation of hemodynamics and higher resolution tissue isola-
tion. This is particularly important near bifurcations, where flow patterns are complex. Some of the differences
between BA and BT gene expression may represent responses to other hemodynamic forces. For example, it has
been shown that spatial gradients in WSS are an important factor in triggering aneurysm formation47,48,50, and
gradients superimposed on high WSS elicit different responses from endothelial cells in culture than uniform
high WSS of the same magnitudes51,52. Spatial gradients in WSS add to the shear force on the luminal surface
of endothelial cells and may augment their responses to flow. WSS gradient was higher at the BT after ligation
in the present study, as was transverse WSS, which would also add to the mechanical stress experienced by the
endothelium. These extra forces should be considered as potential contributors to the mechanical triggers for
differential remodeling responses. Lastly, it will be necessary to manipulate putative signaling molecules in
order to test whether they are necessary and sufficient for particular remodeling behaviors. Ideally this would
be accomplished with conditional mutants of the genes of interest. Given the limited molecular engineering in
rabbits, such studies might be better conducted in mice or rats.
In conclusion, flow-dependent arterial remodeling likely involves the induction of multiple intimal genes for
signals that elicit remodeling responses in the media. Correlation analysis is a powerful approach for identifying
potential signals for such intercellular regulatory communication, and laser microdissection allows examination
of that communication with intra-tissue resolution. Our analysis suggests multiple novel signaling molecules
and the potential for complex signal-response profiles for regulating diverse arterial remodeling behaviors.
Methods
Animal model. Female New Zealand white rabbits (4–5 kg) underwent bilateral common carotid artery
ligation surgery (n = 2) or a sham surgery (n = 2), as previously described53. Bilateral ligation of the common
carotid artery increases flow through the BA and causes destructive remodeling at the BT. Before surgery, all
rabbits were imaged by rotational angiography to capture the 3D geometry of the BA and the BT, and all were
subjected to TCD ultrasonography to measure blood flow rates in the BA. 24 h after surgery, the rabbits were
again subjected to imaging and TCD. They were then euthanized by intravenous injection of 100 mg/kg sodium
pentobarbital. All procedures were approved by the Institutional Animal Care and Use Committee of the Uni-
versity at Buffalo. The University at Buffalo’s Laboratory Animal Facility was certified at the highest level by the
American Association for the Assessment and Accreditation of Laboratory Animal Care International and met
or exceeded the guidelines of the United States Department of Agriculture. Results from this study are reported
in accordance with the ARRIVE (Animals in Research: Reporting In Vivo Experiments) g uidelines54.
Flow analysis at the BA and BT. To determine the hemodynamic environment at the BT and BA, we
performed CFD simulations. In brief, the 3D geometries from angiography were segmented using Vascular
Modeling Toolkit (www.vmtk.org), then cropped and refined to include just the BA, BT, and bifurcating ves-
sels. The segmented models were converted to volumetric meshes using ICEM-CFD (ANSYS, Inc.) and the
flow-governing Navier–Stokes equations were solved using an open-source software, OpenFOAM (www.openf
oam.org) under steady-state conditions. A uniform inlet boundary condition at the BA was defined using the
time-averaged velocity obtained by TCD, and the outlet boundary conditions were assumed to split by obeying
Murray’s law. For each rabbit, two CFD simulations were performed on the baseline geometry, using the initial
and the post-surgery flow rates. Post-processing was performed in Paraview to obtain average WSS; at the BT
bifurcation zone, the average was taken over the surface within a 1 mm diameter sphere centered at the apex of
the bifurcation, and in the BA, WSS was averaged over the entire vessel segment.
Tissue collection and laser microdissection. Immediately following euthanasia, animals were perfused
with 1 U/mL heparin in 0.9% saline solution for 10 min. Then, the brain was removed, and the most posterior
cerebral arteries, from the vertebral arteries to the posterior cerebral arteries and superior cerebellar arteries,
were surgically excised. The BA with the BT and short portions of the downstream branches was placed in
optimal cutting temperature compound and flash frozen in liquid nitrogen. Longitudinal sections of the BA and
coronal sections through the BT were cut at 8 µm thickness, adhered to nuclease-free Foil Membrane Slides for
use with the Leica laser microdissection system and stored at − 80 °C until laser microdissection. Immediately
prior to microdissection, sections were fixed for 2 min with ice-cold 70% ethanol, washed twice for 60 s with ice-
cold RNase-free water to remove residual embedding media, and dehydrated by one 2-min wash in 95% ethanol
and two 2-min washes in 100% ethanol, then air dried for 1 h in a vacuum desiccator at room temperature.
Dehydrated sections were micro-dissected on a Leica LMD6000 system (Leica Microsystems): ~ 10 μm wide
strips were cut from the intimal layer (containing ECs) and separate strips were cut through the full thickness of
Scientific Reports | (2021) 11:16142 | https://doi.org/10.1038/s41598-021-95403-x 10
Vol:.(1234567890)www.nature.com/scientificreports/
the remaining medial layer (containing VSMCs). Intimal and medial tissue fragments from the BA and from a
region extending ~ 100 µm distally from the apex of the BT were collected separately into dry microfuge tubes
and held at − 80 °C until RNA extraction. To increase RNA yield, tissue from ~ 10 sections was combined for
each sample.
RNA extraction and sequencing. Total RNA was extracted and amplified from each sample tube using
SMART-Seq v4 Ultra Low Input RNA Kits (Takara Bio). To check the quality of extraction and amplification, an
aliquot of the end product was examined by electrophoresis using an Agilent 2100 BioAnalyzer RNA 6000 Pico
Chip (Agilent, Las Vegas, NV). RNA samples to be sequenced had concentrations of 3.5–40 ng/µl and a broad
molecular-weight distribution spanning 100–6000 bp and peaking at 800–2000 bp. RNA quality and sequencing
metrics for each sample are provided in Supplemental Table 4.
cDNA libraries were prepared using Nextera DNA Library Preparation Kits (Illumina, San Diego, CA) and
subjected to 75-cycle, single-read sequencing on an Illumina NextSeq500. For all data, per-cycle base-call (BCL)
files generated by the NextSeq were converted to per-read FASTQ files using bcl2fastq v.2.20.0.422 using default
parameters. The quality of the sequencing was reviewed using FastQC v.0.11.5. Detection of potential contami-
nation was done using FastQ Screen v.0.11.1. FastQC and FastQ Screen quality reports were summarized using
MultiQC v.1.5. No adapter sequences were detected, so no trimming was performed. Sequencing reads were
aligned to rabbit genome, oryCun2, using STAR a ligner55 Only uniquely mapped reads were retained for down-
stream analysis. Read counts were measured according to Ensembl gene annotation. Sequence alignments were
compressed and sorted into binary alignment map (BAM) files using samtools v.1.9. Counting of mapped reads
for genomic features was performed using Subread featureCounts v.1.6.2 using the parameters -s 2 –g gene_id
–t exon –Q 60 -C, the annotation file specified with the -a parameter was the Ensembl reference OryCun2.0
(GCA_000003625.1). Aggregate quality control data (i.e. alignment statistics and feature assignment statistics)
were again summarized using MultiQC.
Gene expression analysis. We visualized how well intimal and medial samples separated at the two loca-
tions (BA, BT) using principal component analysis. Genes with a count sum > 0 across all samples were log
transformed to use as input. Principal component analysis was created using the prcomp function in R. We then
performed differential expression analysis using RPKM data from RNA-seq to investigate the effect of increased
flow as induced by ligation on expression in the intima and media. The Bioconductor package edgeR (version
3.30.3)56,57 was used to perform four differential expression analyses: normal versus high flow in the intima at a
bifurcation (BT), in the intima in a straight vessel (BA), in the media at a bifurcation (BT), and in the media in
a straight vessel (BA). After estimating dispersion, edgeR identified DEGs by using a negative binomial distribu-
tion with generalized linear models and a quasi-likelihood F-test to identify DEGs56,57. Genes with maximum
average expression > 1 RPKM in each group were used as input. Multiple hypothesis testing correction was
performed using Benjamini–Hochberg false discovery rate correction. A gene was considered to be differentially
expressed if the false discovery rate corrected p-value (q-value) < 0.05.
Expression correlation analysis. To predict potential signals between intima and media, we looked for
correlations between the expression patterns of intimal and medial genes. All genes with maximum expression
> 1 RPKM and a q-value < 0.05 in any pair of comparisons within endothelial samples or within smooth muscle
samples were included in the correlation analysis. For every possible intima-media gene pair, a Pearson correla-
tion coefficient was calculated in R based on all of the available expression values (i.e., from the BA and BT of two
ligated and two unligated animals for a total of 8 independent intimal measurements and eight matched medial
measurement). Gene pairs with absolute correlation coefficient > 0.9 and p-value < 0.0001 were considered to
have correlated expression.
Gene ontology enrichment analysis. To examine the biological processes associated with different
flow-induced patterns of gene expression in the intima, we separated DEGs into those with increased expres-
sion and those with decreased expression, in response to ligation-induced flow increase. Each set of DEGs was
analyzed via the g:GOSt application of gProfiler58 to identify ontologies that were significantly overrepresented
in each gene set (q-value < 0.05).
To characterize gene ontology enrichment among medial genes whose expression correlated with the expres-
sion of flow-sensitive intimal genes, it was necessary to first consider whether a medial gene correlated with an
intimal gene that was up-regulated by increased flow or down-regulated by increased flow, and then to further
separate medial genes that were positively correlated with the intimal gene’s expression from those that were
negatively correlated. Thus, for each intimal gene of interest, all the positively correlating medial genes were
input to identify one set of significantly enriched ontologies, and enriched ontologies for negatively correlating
genes were determined separately.
In order to integrate the gene ontology information across all the different sets of medial genes that correlated
with the many different flow-sensitive intimal genes, all the significant ontologies returned by g:Profiler for a
given analysis (e.g., the positive medial correlates of intimal genes that increased in response to ligation) were
pooled and ranked by occurrence. Terms that occurred in > 50% of collective ontologies were then summarized
using the REduce and VIsualize Gene Ontology (REVIGO) t ool59 to map relationships between ontologies and
the associated rankings, with a semantic similarity cutoff of C = 0.90.
Scientific Reports | (2021) 11:16142 | https://doi.org/10.1038/s41598-021-95403-x 11
Vol.:(0123456789)www.nature.com/scientificreports/
Data availability
Raw RNA-seq data files and tables of processed gene expression levels for all 16 samples from the n = 4 rabbits
described in this publication can be found at NCBI’s GEO (accession number GSE169276).
Received: 18 March 2021; Accepted: 26 July 2021
References
1. Gibbons, G. H. & Dzau, V. J. The emerging concept of vascular remodeling. N. Engl. J. Med. 330, 1431–1438 (1994).
2. Korshunov, V. A., Schwartz, S. M. & Berk, B. C. Vascular remodeling: Hemodynamic and biochemical mechanisms underlying
Glagov’s phenomenon. Arteioscler Thromb. Vasc. Biol. 27, 1722–1728 (2007).
3. Baeyens, N. & Schwartz, M. A. Biomechanics of vascular mechanosensation and remodeling. Mol. Biol. Cell 27, 7–11 (2016).
4. Roux, E., Bougaran, P., Dufourcq, P. & Couffinhal, T. Fluid shear stress sensing by the endothelial layer. Front. Physiol. https://doi.
org/10.3389/fphys.2020.00861 (2020).
5. Halliwill, J. R., Buck, T. M., Lacewell, A. N. & Romero, S. A. Postexercise hypotension and sustained postexercise vasodilatation:
What happens after we exercise?. Exp. Physiol. 98, 7–18. https://doi.org/10.1113/expphysiol.2011.058065 (2013).
6. De Mey, J. G., Schiffers, P. M., Hilgers, R. H. & Sanders, M. M. Toward functional genomics of flow-induced outward remodeling
of resistance arteries. Am. J. Physiol. Heart Circ. Physiol. 288, H1022–H1027 (2005).
7. Sho, E. et al. Arterial enlargement in response to high flow requires early expression of matrix metalloproteinases to degrade
extracellular matrix. Exp. Mol. Pathol. 73, 142–153. https://doi.org/10.1006/exmp.2002.2457 (2002).
8. Abbruzzese, T. A. et al. Matrix metalloproteinase inhibition limits arterial enlargements in a rodent arteriovenous fistula model.
Surgery 124, 326–334 (1998).
9. Frösen, J., Cebral, J., Robertson, A. M. & Aoki, T. Flow-induced, inflammation-mediated arterial wall remodeling in the formation
and progression of intracranial aneurysms. Neurosurg. Focus 47, E21 (2019).
10. Nuki, Y. et al. Roles of macrophages in flow-induced outward vascular remodeling. J. Cereb. Blood Flow Metab. 29, 495–503 (2009).
11. Petsophonsakul, P. et al. Role of vascular smooth muscle cell phenotypic switching and calcification in aortic aneurysm formation.
Arterioscler. Thromb. Vasc. Biol. 39, 1351–1368. https://doi.org/10.1161/ATVBAHA.119.312787 (2019).
12. Sorokin, V. et al. Role of vascular smooth muscle cell plasticity and interactions in vessel wall inflammation. Front. Immunol.
https://doi.org/10.3389/fimmu.2020.599415 (2020).
13. Masuda, H., Kawamura, K., Sugiyama, T. & Kamiya, A. Effects of endothelial denudation in flow-induced arterial dilatation. Front.
Med. Biol. Eng. 5, 57–62 (1993).
14. Langille, B. L. & O’Donnell, F. Reductions in arterial diameter produced by chronic decreases in blood flow are endothelium-
dependent. Science 231(4736), 405–407. https://doi.org/10.1126/science.3941904 (1986).
15. Kolega, J. et al. Cellular and molecular responses of the basilar terminus to hemodynamics during intracranial aneurysm initiation
in a rabbit model. J. Vasc. Res. 48, 429–442 (2011).
16. Mandelbaum, M., Kolega, J., Dolan, J. M., Siddiqui, A. H. & Meng, H. A critical role for proinflammatory behavior of smooth
muscle cells in hemodynamic initiation of intracranial aneurysm. PLoS ONE 8, e74357 (2013).
17. Sho, E. et al. High flow drives vascular endothelial cell proliferation during flow-induced arterial remodeling associated with the
expression of vascular endothelial growth factor. Exp. Mol. Pathol. 75, 1–11. https://d oi.o
rg/1 0.1 016/s 0014-4 800(03)0 0032-7 (2003).
18. Mitsumara, M., Fishel, R. S., Nerem, R. M., Alexander, R. W. & Berk, B. C. Fluid shear stress stimulates platelet-derived growth
factor expression in endothelial cells. Am J. Physiol. 265, H3-8 (1993).
19. Malek, A. M., Gibbons, G. H., Dzau, V. J. & Izumo, S. Fluid shear stress differentially modulates expression of genes encoding basic
fibroblast growth factor and platelet-derived growth factor B chain in vascular endothelium. J. Clin. Invest. 92, 2013–2021 (1993).
20. Ohno, M., Cooke, J. P., Dzau, V. J. & Gibbons, G. H. Fluid shear stress induces endothelial transforming growth factor beta-1
transcription and production. Modulation by potassium channel blockade. J. Clin. Invest. 95, 1363–1369 (1995).
21. Urschel, K., Cicha, I., Daniel, W. G. & Garlichs, C. D. Shear stress patterns affect the secreted chemokine profile in endothelial
cells. Clin. Hemorheol. Microcirc. 50, 143–152. https://doi.org/10.3233/CH-2011-1450 (2012).
22. Noris, M. et al. Nitric oxide synthesis by cultured endothelial cells is modulated by flow conditions. Circ. Res. 76, 536–543 (1995).
23. Uematsu, M. et al. Regulation of endothelial cell nitric oxide synthase mRNA expression by shear stress. Am. J. Physiol. 269,
C1371-1378 (1995).
24. Mondy, J. S. et al. Platelet-derived growth factor ligand and receptor expression in response to altered blood flow in vivo. Circ. Res.
81, 320–327 (1997).
25. Gao, F. et al. Disruption of TGF-β signaling in smooth muscle cell prevents flow-induced vascular remodeling. Biochem. Biophys.
Res. Commun. 454, 245–250 (2014).
26. Gaengel, K., Genové, G., Armulik, A. & Betsholtz, C. Endothelial-mural cell signaling in vascular development and angiogenesis.
Arterioscler. Thromb. Vasc. Biol. 29, 630–638 (2009).
27. Tronc, F. et al. Role of NO in flow induced remodeling of the rabbit common carotid artery. Arterioscler. Thromb. Vasc. Biol. 16,
1256–1262 (1996).
28. Guzman, R. J., Abe, K. & Zarins, C. K. Flow-induced arterial enlargement is inhibited by suppression of nitric oxide synthase
activity in vivo. Surgery 122, 273–280 (1997).
29. Tuttle, J. L. et al. Shear level influences resistance artery remodeling: Wall dimensions, cell density, and eNOS expression. Am. J.
Physiol. Heart Circ. Physiol. 281, H1380–H1389 (2001).
30. Rudic, R. D. et al. Direct evidence for the importance of endothelium-derived nitric oxide in vascular remodeling. J. Clin. Invest.
101, 731–736 (1998).
31. Dumont, O., Loufrani, L. & Henrion, D. Key role of the NO-pathway and matrix metalloprotease-9 in high blood flow-induced
remodeling of rat resistance arteries. Arterioscler. Thromb. Vasc. Biol. 27, 317–324 (2007).
32. Wei, E. P., Kontos, H. A. & Beckman, J. S. Mechanisms of cerebral vasodilation by superoxide, hydrogen peroxide, and peroxynitrite.
Am. J. Physiol. 271, H1262–H1266 (1996).
33. Fujimoto, S. et al. Mechanisms of hydrogen peroxide-induced relaxation in rabbit mesenteric small artery. Eur. J. Pharmacol. 412,
291–300. https://doi.org/10.1016/S0014-2999(00)00940-7 (2001).
34. Cai, H. Hydrogen peroxide regulation of endothelial function: Origins, mechanisms, and consequences. Cardiovasc. Res. 68, 26–36.
https://doi.org/10.1016/j.cardiores.2005.06.021 (2005).
35. Breton-Romero, R. & Lama, S. Hydrogen peroxide signaling in vascular endothelial cells. Redox Biol. 2, 529–534. https://doi.org/
10.1016/j.redox.2014.02.005 (2014).
36. Liaw, N., Dolan, J. M., Siddiqui, A. H., Meng, H. & Kolega, J. Endothelial nitric oxide synthase and superoxide mediate hemody-
namic initiation of intracranial anerusysms. PLoS ONE 9, e101721 (2014).
37. Scholz, D. et al. Ultrastructure and molecular histology of rabbit hind-limb collateral artery growth (arteriogenesis). Virchows
Arch. 436, 257–270 (2000).
Scientific Reports | (2021) 11:16142 | https://doi.org/10.1038/s41598-021-95403-x 12
Vol:.(1234567890)You can also read