Transcriptome analysis of gravitational effects on mouse skeletal muscles under microgravity and artificial 1 g onboard environment - Nature
←
→
Page content transcription
If your browser does not render page correctly, please read the page content below
www.nature.com/scientificreports
OPEN Transcriptome analysis
of gravitational effects
on mouse skeletal muscles
under microgravity and artificial 1 g
onboard environment
Risa Okada1,2, Shin‑ichiro Fujita3,4, Riku Suzuki5,6, Takuto Hayashi3,5, Hirona Tsubouchi5,
Chihiro Kato5,7, Shunya Sadaki5, Maho Kanai5,6, Sayaka Fuseya3,5, Yuri Inoue3,5,
Hyojung Jeon5, Michito Hamada5, Akihiro Kuno5,6, Akiko Ishii8, Akira Tamaoka8,
Jun Tanihata9, Naoki Ito10, Dai Shiba1,2, Masaki Shirakawa1,2, Masafumi Muratani1,4,
Takashi Kudo1,5* & Satoru Takahashi1,5*
Spaceflight causes a decrease in skeletal muscle mass and strength. We set two murine experimental
groups in orbit for 35 days aboard the International Space Station, under artificial earth-gravity
(artificial 1 g; AG) and microgravity (μg; MG), to investigate whether artificial 1 g exposure prevents
muscle atrophy at the molecular level. Our main findings indicated that AG onboard environment
prevented changes under microgravity in soleus muscle not only in muscle mass and fiber type
composition but also in the alteration of gene expression profiles. In particular, transcriptome
analysis suggested that AG condition could prevent the alterations of some atrophy-related genes.
We further screened novel candidate genes to reveal the muscle atrophy mechanism from these gene
expression profiles. We suggest the potential role of Cacng1 in the atrophy of myotubes using in vitro
and in vivo gene transductions. This critical project may accelerate the elucidation of muscle atrophy
mechanisms.
Gravity is the most constant factor affecting the entire process of evolution of organisms on Earth. As adapting
to a changing environment is key for any organism’s survival, the constant mechanical stimulus of gravitational
force has been shared by all organisms on Earth through e volution1. To elucidate how mammals respond to
gravity, space experiments with mice are quintessential; however, they require specialized habitats applicable to
the space environment.
Skeletal muscle is one of the most robustly plastic tissues that can adapt its structure and metabolism in
response to various c onditions2,3. Under disuse conditions such as prolonged time in bed, skeletal muscles
undergo atrophy due to decreased protein synthesis and increased protein degradation4. Spaceflight is well-
known to induce muscle atrophy and weakness in rats5,6 and mice7. In humans8–10, muscle atrophy during
1
Mouse Epigenetics Project, ISS/Kibo Experiment, Japan Aerospace Exploration Agency (JAXA), Ibaraki 305‑8505,
Japan. 2JEM Utilization Center, Human Spaceflight Technology Directorate, JAXA, Ibaraki 305‑8505,
Japan. 3Doctoral Program in Biomedical Sciences, Graduate School of Comprehensive Human Sciences,
University of Tsukuba, Ibaraki 305‑8575, Japan. 4Department of Genome Biology, Faculty of Medicine, University
of Tsukuba, Ibaraki 305‑8575, Japan. 5Laboratory Animal Resource Center in Transborder Medical Research
Center, Department of Anatomy and Embryology, Faculty of Medicine, University of Tsukuba, Ibaraki 305‑8575,
Japan. 6Ph.D. Program in Human Biology, School of Integrative and Global Majors, University of Tsukuba,
Ibaraki 305‑8575, Japan. 7Master’s Program in Medical Sciences, Graduate School of Comprehensive Human
Sciences, University of Tsukuba, Ibaraki 305‑8575, Japan. 8Department of Neurology, Faculty of Medicine,
University of Tsukuba, Ibaraki 305‑8575, Japan. 9Department of Cell Physiology, The Jikei University School of
Medicine, Tokyo 105‑8461, Japan. 10Laboratory of Molecular Life Science, Institute of Biomedical Research and
Innovation, Foundation for Biomedical Research and Innovation at Kobe (FBRI), Kobe 650‑0047, Japan. *email:
t-kudo@md.tsukuba.ac.jp; satoruta@md.tsukuba.ac.jp
Scientific Reports | (2021) 11:9168 | https://doi.org/10.1038/s41598-021-88392-4 1
Vol.:(0123456789)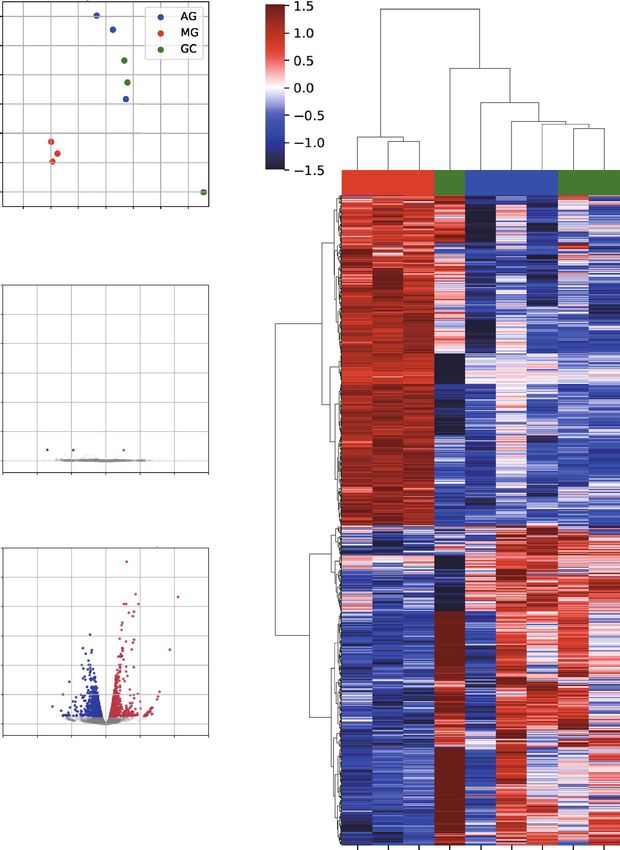
www.nature.com/scientificreports/
spaceflight can cause severe medical problems to astronauts upon return to Earth. Previous studies have shown
that muscle atrophy and partial shift of muscle fibers from oxidative toward a more glycolytic phenotype were
induced in space-flown rats and mice, as well as humans11. Therefore, there is a critical need for a deeper under-
standing of the molecular mechanisms responsible for muscle atrophy under microgravity and partial gravity
(less than 1 g).
The effect of spaceflight on skeletal muscles has been examined in rats and mice, comparing a spaceflight
group with a ground control group6,12,13. However, such studies did not consider various conditions, including
space radiation, the microbial environment, lack of convection, and shock during the launch and return phases
that differ between spaceflight and conventional control experiments. Comparing between the two control groups
was needed to rule out the confounding factors originating from different housing conditions, such as the effect of
short-term gravitational changes during launch and landing in spaceflight. Therefore, we developed the multiple
artificial-gravity research system (MARS) and succeeded in housing mice under microgravity and an artificial 1 g
onboard environment to study the effect of gravity on mammals14–16. In the first Mouse Habitat Unit-1 (MHU-1)
mission, 12 mice were housed in the International Space Station (ISS) using MARS under either microgravity or
artificial 1 g for 35 days in 2016. Each male mouse was reared in an individual cage to avoid unexpected fighting
between mice, and all mice returned to the Earth alive. We set an artificial 1 g onboard environment induced by
centrifuging cages as the novel control. This is because artificial 1 g onboard was a novel experimental group, we
employed a comprehensive assessment against the effects of microgravity and artificial 1 g. Our findings from
the MHU-1 mission were as follows; retinal apoptosis caused by spaceflight was prevented in artificial 1 g17;
downregulation of transcription factors GATA1 and Tal1 (regulator of erythropoiesis) in the immune system
was observed in m icrogravity18; and the physiological functions of the male reproductive organs, such as sperm
function and offspring viability, were maintained in m icrogravity19.
In this study, we aimed to elucidate the effect of an artificial 1 g onboard environment on skeletal muscles at
the molecular level. We investigated the histological characterization of muscle fibers and gene expression from
the JAXA mission (MHU-1). We found that an artificial 1 g onboard environment prevented not only decreased
muscle mass and change in fiber type composition but also the alteration of gene expression profiles in soleus
muscle during spaceflight. Transcriptome analysis also suggested that AG condition could prevent the alterations
of well-known atrophy-related genes. We further screened the candidate genes associated with muscle atrophy
using these gene profiles. We identified Cacng1 that could play a functional role in myotubes atrophy by in vitro
and in vivo gene transductions. Therefore, our project demonstrates the utility of spaceflight datasets using an
artificial 1 g onboard environment for elucidating the basis of muscular adaptation during spaceflight.
Results and discussion
An artificial 1 g onboard environment prevents changes in muscle mass and the fiber type
composition of the soleus muscle under microgravity. Twelve mice were housed onboard the ISS for
35 days. Half of them were housed under microgravity (MG), whereas the other 6 mice were housed under an
artificial 1 g onboard environment (AG) induced by centrifuging (Fig. 1A). Since previous studies using ground
control group did not distinguish the effect of microgravity from other various conditions such as space radia-
tion and lack of convection, we examined whether artificial 1 g exposure prevents the reduction in muscle mass
induced by spaceflight in mice. To compare the effects of microgravity and an artificial 1 g onboard environment
on skeletal muscle, we measured the wet muscle mass of hindlimb skeletal muscles, namely soleus, gastrocne-
mius, plantaris, tibialis anterior (TA), and extensor digitorum longus (EDL) (Fig. 1B). The muscle weights were
normalized using the body weight of each mouse. Previously, we reported that AG completely inhibited the
effect of microgravity on soleus, which is the main postural muscle of hindlimb and gastrocnemius muscles,
compared with MG and ground control (GC), which was housed on the ground for the same duration using
similar cages and processed with the same method as spaceflight mice14. The weight of the plantaris muscle in
MG was also significantly decreased compared with that of GC, although the weight of the plantaris muscle in
MG tended to decrease compared with AG. The weight of the TA and EDL muscles showed no significant dif-
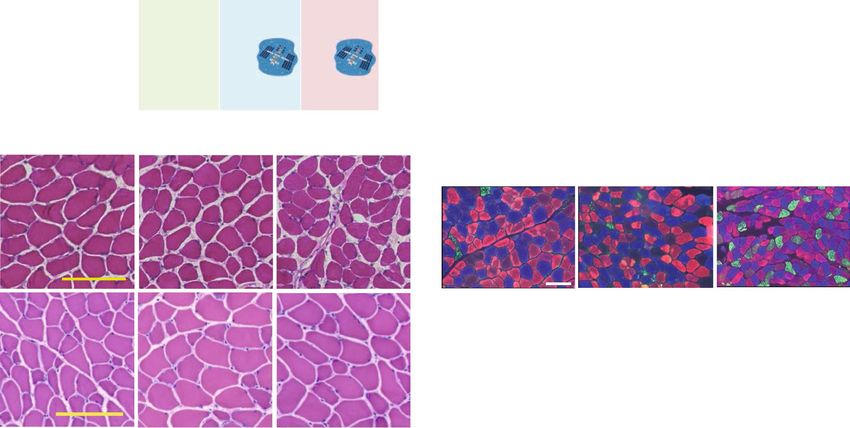
ferences among the three groups. Hematoxylin–eosin (HE) staining of freshly-embedded soleus (predominantly
slow-twitch fibers) and EDL (predominantly fast-twitch fibers) muscle sections, which are composed of different
types of muscle fibers, showed the absence of major pathological anomalies, such as central nuclei, immune cell
infiltration, and myofiber degeneration in all analyzed muscles from each experimental group: GC, AG, and MG
(Fig. 1C). The previous studies have shown that the change in muscle fiber type composition in both type I and
type II is observed in the soleus muscle after spaceflight in mice, rats, and h umans11,20. Additionally, atrophy is
reportedly more pronounced in type I than in type II fibers of the soleus muscle. Therefore, immunofluorescence
staining of the different myosin heavy chain (MyHC) isoforms (i.e., types I, IIa, IIb) was performed for evaluat-
ing whether microgravity or artificial 1 g exposure in space affected muscle fiber type composition in the soleus
muscle (Fig. 1D). The type IIx fibers were identified by the absence of immunoreaction during triple immu-
nostaining. We quantified the fiber type frequency and cross-sectional area (CSA) of the myofibers by immuno-
fluorescence staining of the soleus muscle (Fig. 1E, F). The ratio of type IIa fibers was reduced, while that of type
IIb fibers increased in the soleus muscle under MG compared to that of under GC. The decrease of type IIa fibers
ratio and the increase of type IIb fibers ratio were completely prevented in AG, implying that the change in fiber
type composition induced by spaceflight was mainly caused by unloading due to microgravity. Additionally, the
CSA significantly decreased in type I and type IIa fibers in MG compared with those in GC. These reductions
in fibers were not significant when comparing GC and AG (Fig. 1F), suggesting that AG tends to prevent the
reduction of CSA during spaceflight. These inflight 1 g control results suggested that an artificial 1 g onboard
environment using centrifuge could prevent change in the fiber type composition and muscle atrophy during
spaceflight in both the fast- and slow-twitch fibers of the soleus muscle. In contrast, no changes in the CSAs of
Scientific Reports | (2021) 11:9168 | https://doi.org/10.1038/s41598-021-88392-4 2
Vol:.(1234567890)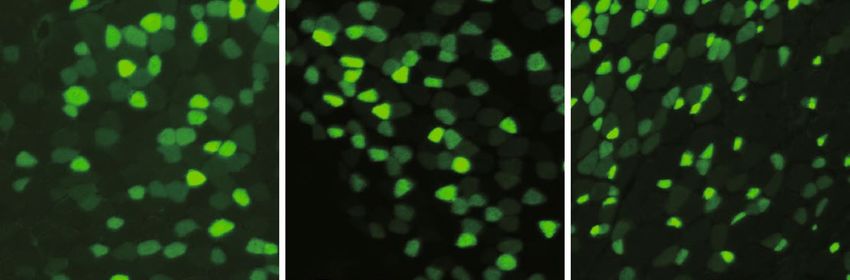
www.nature.com/scientificreports/

                                  Figure 1.  Characterization of the hindlimb muscles among three experimental groups: GC, AG, and MG. (A)
                                  Overview of the MHU-1 study. Twelve male mice were launched by SpaceX-9 from the Kennedy Space Center in
                                  Florida on July 18, 2016. After arrival at the ISS, six of the mice were housed in HCU under microgravity (MG)
                                  for approximately 34.6 days, while the other six mice were housed in an artificial 1 g onboard environment (AG)
                                  induced by centrifugation for approximately 34.1 days during the approximate 37-day berthing period. After
                                  approximately 35 days of habitation on the ISS, all 12 mice were loaded into the Dragon capsule and kept under
                                  microgravity for approximately 1.3 days before undocking. The capsule subsequently splashed down in the Pacific
                                  Ocean near Southern California on August 26, 2016. The mice were then transported to a laboratory for behavioral
                                  tests and other analyses after approximately 2 days of undocking. Graphical representations of the study design using
                                  the multiple artificial-gravity research system (MARS). Three experimental groups, namely, ground control (GC),
                                  artificial 1 g onboard environment (AG), and microgravity (MG) in the ISS, are color-coded as green, blue, and red,
                                  respectively, in the following bar graphs. (B) Quantification of the change in individual skeletal muscle weights: soleus
                                  (Sol), gastrocnemius (Gas), plantaris (Pla), tibialis anterior (TA), and extensor digitorum longus (EDL), among GC
                                  (n = 6), AG (n = 5), and MG (n = 4) groups, normalized by body weight and graphed in the Tukey boxplot. P-value
                                  from Tukey’s test is indicated as follows: *P < 0.05 and **P < 0.01. (C) Hematoxylin–eosin staining of soleus and EDL
                                  sections. Scale bars indicate 100 μm. (D) Immunostaining of the myosin heavy chain using muscle fiber-specific
                                  antibodies (type I; blue, type IIa; red, type IIb; green) in the soleus muscle. The unstained fibers were predicted to be
                                  of type IIx fibers (black). Scale bars indicate 100 μm. (E, F) Frequency (E) and cross-sectional areas (CSA) (F) of each
                                  fiber type in the soleus muscles of the GC (n = 3), AG (n = 3), and MG (n = 3). P-value from Student’s t-test is indicated
                                  as follows: *P < 0.05 and **P < 0.01.

Scientific Reports |   (2021) 11:9168 |                 https://doi.org/10.1038/s41598-021-88392-4                                                         3

                                                                                                                                                      Vol.:(0123456789)
www.nature.com/scientificreports/
EDL muscles were observed among the three groups (Supplementary Fig. 1). These results demonstrated that the
postural muscles of lower limbs were highly responsive to microgravity. Our histological data supported previ-
ous findings of fiber composition change exclusively observed in the soleus muscle exposed to microgravity for
30 days using BION-M113. In addition, change in fiber type composition was observed in the soleus muscle, but
not the EDL muscle, of mice housed onboard for as long as 91 days (MDS mission, 2009)12. Our findings showed
that an artificial 1 g onboard environment is sufficient to prevent change in the fiber type composition, and has
a potential to partially prevent muscle atrophy in the soleus muscle during spaceflight.
Artificial 1 g onboard environment prevents the alteration of gene expression under micro‑
gravity. The previous studies have compared the global gene expression profile of the soleus muscle follow-
ing microgravity exposure with that of the ground control group using microarray13 and RNA-seq21 techniques.
However, as inflight 1 g exposed control groups have not been used in these studies, it remains to be elucidated
whether the loading gravity is sufficient for maintaining the altered gene expression in the soleus muscle during
spaceflight. A previous study demonstrated that the largest number of differentially expressed genes (DEGs) is
found in the soleus muscle among nine different tissues in mice housed in the ISS for 37 d ays22. Therefore, in
order to investigate skeletal muscle adaptation during spaceflight using the MARS platform, we focused on the
soleus muscle, which is one of the representative antigravitational muscles. To investigate the comprehensive
impact of gene expressions due to microgravity and artificial 1 g exposure in spaceflight, we performed tran-
scriptome analysis of the soleus muscles from MG, AG, and GC mice (GC: n = 3; AG: n = 3; MG: n = 3). Principal
component analysis (PCA) showed that MG mice’s gene expression profiles considerably differed from those of
AG and GC mice (Fig. 2A). In addition, the gene expression profiles between AG and GC are relatively similar
with the exception for one GC mouse (Fig. 2A). These results suggested that gravitational change could affect
the muscle’s gene expression profile in mice under spaceflight for 35 days rather than other events, such as space
radiation. Indeed, comparing the two control groups (i.e., GC and AG), only three genes, namely Nr4a3, Sfrp4,
and Gm21541, were differentially regulated in the soleus muscle (Fig. 2B and Supplementary Table 1). The slight
difference between these two control groups could be caused by different environmental factors, such as the
effect of short-term gravitational changes during launch and landing in spaceflight. Comparing AG and MG,
1,720 genes were differentially regulated in the soleus muscle with 874 upregulated and 846 downregulated genes
(Fig. 2C), although 1,992 genes were differentially regulated in the soleus muscle with 810 upregulated genes and
1,182 downregulated genes by comparing GC and MG (Supplementary Fig. 2). These results suggested micro-
gravity may contribute to the change of comprehensive gene expressions. In other words, our results suggested
that an artificial 1 g onboard environment ensured by centrifuging the cages prevented the alteration of gene
expression under microgravity in the soleus muscle. We next focused on the subsequent analysis of genes dif-
ferentially regulated in MG compared with AG. Hierarchical clustering was performed on DEGs of 1,720 genes
(AG vs. MG) with all samples for GC, AG, and MG. The result could also confirm the similarity of gene expres-
sion profiles of the two control groups (GC and AG), compared with MG (Fig. 2D).
In summary, we demonstrated that an artificial 1 g onboard environment could prevent gene expression
changes observed under microgravity, which suggested that gravitational change rather than other events such
as space radiation largely affected the gene expression changes in the soleus muscle under spaceflight for 35 days.
Besides, the GC experiment using the same cage unit as spaceflight conditions is acceptable for analyzing micro-
gravity’s effect on mice’s muscles in spaceflight.
An artificial 1 g onboard environment could block alteration of atrogene expressions under
microgravity. Muscle atrophy is mediated by transcription-dependent regulation of atrogenes (atrophy-
related genes), whose expression is coordinately upregulated or downregulated in muscles during systemic wast-
ing states, such as fasting, cancer cachexia, renal failure, and d iabetes23. In particular, a previous study dem-
onstrated that the E3 ubiquitin ligase MuRF1 (Trim63) null (KO) mice showed protection in ground-based
models of muscle atrophy under multiple conditions, including denervation and i mmobilization24. However, the
deletion of MuRF1 in mice did not prevent muscle atrophy during spaceflight, suggesting that muscle atrophy
occurs through different mechanisms during spaceflight compared with those observed in ground-based models
of atrophy21.
Hence, to elucidate the effects of microgravity and an artificial 1 g onboard environment on the gene expres-
sion profile of atrogenes, we identified genes under the regulation of microgravity by cross-referencing the list
of atrogenes25–28. RNAseq analysis confirmed the differentially regulated atrogenes in MG compared with GC
and/or AG (Fig. 3A, B). Consistent with muscle morphology, gene expressions involved in protein degradation
mainly by the ubiquitin–proteasome system were significantly upregulated in MG (Fig. 3A). This finding includes
the genes encoding for various subunits of the 26S proteasome, such as subunits of the 19S complex (Psmc4,
Psmc2, Psmd11/Rpn6, Psmd8/Rpn12, and Psmd3), 20S core particle (Psma1, and Psmb3), de-ubiquitinating gene
(Usp14), ubiquitin-fusion protein (Rps27a), and the ubiquitin E3 ligase complexes, Trim63 (MuRF1), Socs3, and
F-box/WD repeat-containing protein 11 (Fbxw11). Although little is known about the substrates and functions of
these E3 ligases in skeletal muscles, Fbxw11 (also known as β-TrCP2) plays a role in targeting IkBα for ubiquitin-
dependent degradation29. In addition, autophagy-related target genes (P62/Sqstm1 and Gabarapl1), which are
involved in protein degradation through the lysosomal/autophagy pathway, were upregulated in MG. In contrast,
some of the atrogenes such as Atrogin-1/MAFbx (Fbxo32), Specific of Muscle Atrophy and Regulated by Tran-
scription (SMART; Foxo21)28, splA/ryanodine receptor domain and SOCS box (Spsb1)26 were downregulated
in MG compared with AG as shown in Fig. 3B.
P311/Nrep, which is involved in smooth muscle differentiation30 and reported to be downregulated in skeletal
muscle after denervation31, was downregulated in MG compared with AG and GC (Fig. 3B). Eif4ebp1, which
Scientific Reports | (2021) 11:9168 | https://doi.org/10.1038/s41598-021-88392-4 4
Vol:.(1234567890)www.nature.com/scientificreports/
Figure 2. Gene expression profiling in the soleus muscle of GC, AG, and MG. (A) PCA of DEGs in at least
one comparison among the soleus muscle of GC (n = 3; green), AG (n = 3; blue), and MG (n = 3; red). (B, C)
Volcano plots showing DEGs in the soleus muscle of AG and GC (B), and MG and AG (C). (D) Heat map and
hierarchical clustering of the gene expression data in the soleus muscle of GC, AG, and MG showing 1,720
DEGs in AG and MG.
inhibits translation initiation factors, was upregulated in MG compared with AG and could indicate a reduction
in translation in muscle25. A decrease in mRNAs for ECM proteins, Col1a1, was also observed in MG compared
with AG. The transcription factor Atf4, which promotes the expression of oxidative stress-responsive genes
Scientific Reports | (2021) 11:9168 | https://doi.org/10.1038/s41598-021-88392-4 5
Vol.:(0123456789)www.nature.com/scientificreports/
Figure 3. Differentially expressed genes of atrogenes in the soleus muscle of GC, AG, and MG. Bar diagrams
showing the gene expression of atrogenes (atrophy-related genes) as significantly upregulated (A) and
downregulated (B) in MG compared with GC and/or AG. FDR-corrected P-value from statistical test is
indicated as follows: *FDR-corrected P < 0.05 and **FDR-corrected P < 0.01. GC (Green), AG (Blue), and MG
(Red).
Scientific Reports | (2021) 11:9168 | https://doi.org/10.1038/s41598-021-88392-4 6
Vol:.(1234567890)www.nature.com/scientificreports/
and is induced during muscle a trophy32, was induced in MG. Thioredoxin-like protein and Metallothionein-1
(Mt1), which is upregulated during rodent s arcopenia33, were significantly upregulated in MG compared with
AG and GC.
Egr1 was significantly elevated in MG compared with GC, whose induction was significantly blocked in AG.
However, the gene expression involved in ATP synthesis was not significantly changed among the three groups
(Supplementary Table 2). Myogenin (Myog) is a muscle-specific transcriptional factor that is highly induced fol-
lowing muscle denervation22 and contributes to neurogenic muscle a trophy34. Myog was significantly increased
in MG as compared with AG and GC. Foxo1 and Maf were significantly decreased in MG as compared with AG
and GC. Although the Kruppel-like factor 15 (Klf15) mediates the inhibition of mTOR in glucocorticoid-induced
muscle atrophy through the induction upregulation of branched-chain amino acid transaminase 2 (Bcat2)35, the
expression of Klf15 and Bcat2 was downregulated in MG compared with AG. The increase of Klf15 was observed
in AG compared with MG, despite no significant differences between GC and MG. This increased expression in
AG compared with MG was also observed in Atrogin-1 (Fbxo 32), known as the target genes of Klf15.
In summary, the expressions of a set of atrogene were significantly changed in the soleus muscle under MG,
and these altered expressions were blocked in that under AG. Atrogenes are known to be tightly and rapidly
controlled, upregulated during atrophy, and returned to normal levels during r ecovery36. However, these results
indicated that the expression of atrogenes was sustained in MG, although mice in MG were exposed to 1 g after
returning to Earth. Conversely, some atrogenes such as Klf15 were significantly increased in AG compared with
MG, although the expression in MG was comparable to that in GC. It is possible that short-term exposure of
AG mice to microgravity during the return phase might affect the gene expression. In addition, the expression
of autophagy-related gene Gabarapl1is known to increase transiently both during atrophy and recovery follow-
ing disuse muscle atrophy37. Moreover, activation of protein degradation such as ubiquitin–proteasome system
was also observed in soleus muscle during early reloading stages (18 h.) after disuse muscle atrophy in rats38. It
is still possible that the genes upregulated in MG have comprised recovery-related genes. Taken together, these
results indicated that a set of atrogene expressions previously reported by ground experiments was changed
under microgravity for 35 days, and that an artificial 1 g onboard environment could prevent the alteration of
most atrogene expressions during spaceflight.
Novel candidate genes associated with muscle atrophy were screened from gene expression
profiles under spaceflight. Novel candidate genes associated with muscle atrophy were detected through
a combination of comparative and in silico approach. Among the 1,992 genes differentially regulated in GC and
MG (810 upregulated and 1,182 downregulated) and the 1,720 genes differentially regulated in AG and MG
(874 upregulated and 846 downregulated), 455 genes were upregulated and 478 genes were downregulated, as
shown in the overlapping region between the two comparisons, GC vs. MG and AG vs. MG in the Venn dia-
grams (Fig. 4A). To identify the functional gene clusters, we performed enrichment analysis for 455 upregulated
genes and 478 downregulated genes in MG compared with GC and AG in the overlapping region between these
two comparisons. The upregulated genes in MG were enriched in the pathways of the proteasome, ribosome
biogenesis, RNA transport, MAPK signaling, mineral absorption, DNA replication, and lysosome (Fig. 4B). In
contrast, downregulated genes in MG were enriched in the pathways of ECM-receptor interaction, focal adhe-
sion, PI3K-Akt signaling, AMPK signaling, and TGF-β signaling. Consistent with this, downregulation of TGF-
β1 was reported in the soleus muscle of mice on the ISS39. Also, decreased PI3K-Akt signaling was observed in
the short-term spaceflight response in the gastrocnemius muscle in a previous s tudy40. The upregulation of the
proteasome pathway and the downregulation of the PI3K-Akt signaling pathway, which are involved in protein
degradation and protein synthesis, respectively, were observed during muscle atrophy in MG.
Since AG was the new research condition under an artificial 1 g onboard environment, we screened the
potential candidate genes involved in muscle atrophy under microgravity by focusing on genes differentially
regulated between AG and MG. A total of 418 upregulated genes were significantly changed only specifically
in the comparison between AG and MG, but not in that between GC and MG. The previous studies investigat-
ing the research on skeletal muscles by comparing spaceflight groups with ground control g roups6,12,13 could
not validate the effect of various factors during spaceflight, such as space radiation. The comparison between
spaceflight and inflight control groups, instead of conventional control experiments, may provide new insights
into understanding the mechanism of muscle atrophy during spaceflight. As the regulatory genes that induce
muscular atrophy were found in upregulated genes in the previous r eports24, we focused on the genes that were
upregulated for identifying the novel molecule(s) that are involved in muscular atrophy under microgravity.
Upregulated genes were distributed into the tissue expression profiles provided by the enrichment analysis
(Fig. 4C). Thirteen skeletal muscle-related genes listed in Fig. 4D were significantly regulated in MG compared
to AG in the soleus muscle. The functions of eight of the thirteen genes identified herein have been reported in
muscle as follows: muscle development (Actn2), fiber type (Myh4), regeneration (Nfat5), dystrophy (Ldb3), and
muscle atrophy (Myf6, Trim63, Smyd1, and Rack1). Pdlim3 and Smpx were known not to affect the muscle when
deficient (Pdlim3) or overexpressed in muscle (Smpx). Actn2, Ldb3 and Pdlim3 were known to be significantly
upregulated in the cutaneous muscle of mice housed in the ISS for 91 d ays41, suggesting the potential role in
diverse muscles during spaceflight. Myh4 is one of the fast specific genes coding for MyHC type IIb. Upregulation
of Myh4 mRNA is consistent with the result that an increase in the ratio of type IIb fibers in MG was completely
prevented in AG in the soleus muscle from MyHC staining, which is also reported in the soleus muscle of mice
exposed to microgravity for 30 days on BION-M113. NFAT5 has a role in both myoblast migration and differ-
entiation during skeletal muscle m yogenesis42, suggesting muscle regeneration in response to recovery after a
return. Although Myf6 is involved in differentiation as demonstrated by the temporal pattern of expression in
embryos43,44, the role of Myf6 in adult skeletal muscle is still elusive. Myf6 was upregulated in both the soleus
Scientific Reports | (2021) 11:9168 | https://doi.org/10.1038/s41598-021-88392-4 7
Vol.:(0123456789)www.nature.com/scientificreports/
Figure 4. Pathway analysis of changed genes between MG and GC, and MG and AG, and identifying novel
candidate genes involved in muscle atrophy. (A) Venn diagram showing the number of upregulated (upper) and
downregulated (lower) DEGs in each comparison between MG, GC, and AG. (B) Pathway analysis of upregulated
(upper) and downregulated (lower) DEGs in the overlapping region of MG compared with GC and AG. (C) Tissue
expression profiles of 418 upregulated DEGs in MG compared with AG. (D) The gene list showing skeletal muscle-
related genes from Fig. 4C.
Scientific Reports | (2021) 11:9168 | https://doi.org/10.1038/s41598-021-88392-4 8
Vol:.(1234567890)www.nature.com/scientificreports/
muscles of space-flown mice of the BION-M1 experiment13. Previous studies suggested that Myf6 is involved
in the gene expression reprogramming in denervated and regenerating m uscle45,46. Therefore, Myf6 could have
a role in the response to muscle atrophy during spaceflight and/or recovery from microgravity. In addition,
MuRF1 (Trim63) was increased and screened from this study. Although MuRF1 was upregulated in various
ground-based models of muscle atrophy, muscle atrophy during spaceflight was not prevented in soleus muscle
of MuRF1 KO mice in the previous s tudy21.
On the other hand, the function of Cacng1 remains unclear in skeletal muscle. Cacng1 encodes γ1 subunit
of the L-type Ca2+ channel, consisting of five subunits (α1S, α2, β, γ and δ) and is known as the dihydropyridine
receptor (DHPR)47,48. DHPR is predominantly located in T-tables and interacts with the type 1 ryanodine sensi-
tive Ca2+ release channel, RyR1, to release Ca2+ stored in the terminal cisternae of the sarcoplasmic reticulum for
the initiation of c ontraction49. However, the biological significance of the DHPR is still u nknown50. Therefore,
we further validated whether Cacng1 implicates muscle atrophy in vitro.
Cacng1 induces a decrease in muscle fiber size in vitro and in vivo. Based on in silico analyses,
we identified Cacng1 as a novel candidate gene associated with muscle atrophy. Therefore, we further exam-
ined whether Cacng1 induces muscle atrophy in vitro. C2C12 myotubes were infected with adenoviral vectors
expressing Cacng1 4 days after differentiation when the myotubes are of constant size, and myoblast fusion no
longer occurs51 (Fig. 5A). Morphological examination of the cells expressing Cacng1 for 48 h. demonstrated a
15.2% reduction in mean myotube diameter and a leftward shift in myotube distribution compared with those
expressing only EGFP control (Fig. 5B, C). Furthermore, when the myotubes were infected with a constitutively
active mutant of FoxO3 (T32A, S252A, and S314A), FoxO3a (CA), a master regulator of muscle a trophy52, there
was a 27.5% decrease in mean myotube diameter and a leftward shift in myotube distribution compared with
those expressing only EGFP control (Fig. 5B, C). These findings demonstrate that the increased expression of
Cacng1 has a key role in the atrophy of myotubes in vitro.
To determine whether the induction of Cacng1 expression influences fiber size in vivo, as it did in cultured
myotubes, we conducted the gene transduction of Cacng1 in neonatal mice’s skeletal muscle. Fiber sizes were
measured 5 days after the Cacng1-expressing adenovirus vector was injected into neonatal mice’s TA muscle.
Muscle fibers expressing FoxO3a (CA) shown in Fig. 5D were much smaller than those expressing only EGFP
control. Mean CSA was markedly reduced in three individual experiments. Cacng1 overexpression was reduced
by 13.9% compared with the EGFP control, and FoxO3a overexpression was reduced by 32.2% compared with
the EGFP control (Fig. 5D, E). These results suggested that Cacng1 increased the distribution of thinner myotubes
in the muscles, probably independent of the fiber type, since the increased Cacng1 induces atrophy even in the
fast-twitch TA muscle. Of note, the overexpression of Atrogin-1, a well-known atrogene involved in protein
degradation, alone does not cause myotube or muscle atrophy52. Therefore, our findings suggest that Cacng1
induces a pathway such as protein degradation and other atrophy-related changes that lead to pathways neces-
sary to account for such marked fiber shrinkage.
In our study, we observed that Cacng1 expression was significantly upregulated in mice exposed to micro-
gravity compared with those exposed to an artificial 1 g onboard environment. We have shown that Cacng1
induced muscle atrophy in both C2C12 cells and mouse neonatal skeletal muscles. These experiments in this
study are the first to implicate the role of the excessive expression of γ1 subunit of the L-type calcium channel
in the control of muscle fiber size.
Prolonged muscle inactivity during bed rest, hindlimb unloading, immobilization, microgravity, or dener-
vation result in significant muscle atrophy53–56. It is also known that direct electrical stimulation preserved or
restored almost normal properties in denervated muscle fiber likely triggered by action potentials or prompted
by the contracted f unction57,58. A previous report showed that the downregulation of α1S subunit of DHPR in
adult skeletal muscle by RNAi underwent massive atrophy, and that decreasing α1S induced redistribution of
the neuronal nitric oxide synthase (nNOS), activation of FoxO3A, increased expression of atrogenes, and initi-
ated autophagosome f ormation50. Given that γ1 subunit of DHPR is supposed to exhibit an endogenous ligand
similar to Ca2+ antagonists and minimize Ca2+ entry and Ca2+ release from the previous study49, increased
expression of γ1 subunit could induce muscle atrophy through similar mechanisms to the downregulation of
α1S subunit. Further studies to reveal the mechanisms of increased expression of Cacng1 to induce decreased
fiber size are required to understand the contribution of Cacng1 in muscle atrophy during spaceflight and other
muscle atrophy on the ground.
In summary, an important asset of our experimental design is the comprehensive comparison of mice housed
under microgravity or an artificial 1 g onboard environment, as an ideal control group to minimize any housing
conditions-related bias, other than gravitational change during spaceflight. In previous studies, the antigravi-
tational soleus muscle has often been studied in ground-experimental models of unloading to investigate the
signaling pathways involved in skeletal muscle atrophy59,60 and microgravity effects on skeletal muscle12,20 due
to its known susceptibility to unloading and disuse. However, further studies were required to understand the
functional role of these genes by the effect of actual microgravity. Our results demonstrated that an artificial 1
g onboard environment in the ISS could prevent morphological changes and the alteration of gene expression
under microgravity in mammals for the first time. Although CSA tend to decrease in AG compared with GC,
the gene expression profile and expression of atrogene indicates that the muscle property of AG is similar to that
of GC, consistent with the maintained muscle mass. These results suggested that loading of 1 g could be effective
for maintaining muscle during spaceflight for at least 35 days. In particular, to the best of our knowledge, this
is the first study in which soleus muscles collected from space-flown mice under microgravity and an artificial
1 g onboard environment were analyzed using RNAseq. These gene profiles could provide a novel and compre-
hensive overview of the effect of gravity loss on the global gene expression in space-flown mice’s soleus muscles.
Scientific Reports | (2021) 11:9168 | https://doi.org/10.1038/s41598-021-88392-4 9
Vol.:(0123456789)www.nature.com/scientificreports/
Figure 5. Functional validation of candidate genes using culture cell and neonatal mice muscle. (A)
Construction of adenovirus vectors, only EGFP, Cacng1-IRES-EGFP, and FoxO3a (constitutive active; CA)-
IRES-EGFP. (B) Quantification of the myotube diameters of C2C12 myotubes expressing EGFP, Cacng1-
IRES-EGFP, and FoxO3a(CA)-IRES-EGFP. P-value from Student’s t-test is indicated as follows: *P < 0.05 and
**P < 0.01. (C) Frequency distribution of myotube diameters in C2C12 myotubes expressing EGFP, Cacng1-
IRES-EGFP, or FoxO3a(CA)-IRES-EGFP. (D) Representative cross-sectional areas of TA muscles expressing
EGFP (Green) after the transfection of EGFP, Cacng1-IRES-EGFP, or FoxO3a(CA)-IRES-EGFP. Scale bars
indicate 50 μm. (E) Bar diagrams showing the cross-sectional area of TA muscles expressing EGFP. P-value from
Student’s t-test is indicated as follows: * P < 0.05. Three independent infections were performed in three mice.
Therefore, we emphasized that the use of an artificial 1 g onboard environment can serve as a novel approach
for identifying gene clusters that could be regulated by microgravity or other various environmental factors
during spaceflight, such as space radiation. Furthermore, this study demonstrated that Cacng1 is upregulated
in atrophied soleus muscle during spaceflight, and the increased expression of Cacng1 decreased the diameter
of the myotube in vitro and in vivo. These results suggested that Cacng1 might have a potential role in muscle
atrophy during spaceflight.
However, our study has several limitations. First, it is necessary to consider the various possible conditions,
such as the exposure against microgravity until splashdown and the post-landing effect of reloading due to
the return of live animals. For example, given that AG mice were exposed to microgravity before splashdown
for approximately 1.3 days because there was no centrifuge inside the rocket, it is possible that the short-term
exposure of microgravity resulted in a significant increase in the gene expression of Klf15 and its target gene
Scientific Reports | (2021) 11:9168 | https://doi.org/10.1038/s41598-021-88392-4 10
Vol:.(1234567890)www.nature.com/scientificreports/
Atrogin-1 (Fbxo 32) in the soleus muscle of AG mice compared with that of MG mice (Fig. 3). Apart from the
short-term microgravity exposure of the AG mice before splashdown, the post-landing effect of reloading on the
MG mice, which lasted for approximately 2 days, should also be considered in explaining the differences in the
gene expression profiles of the soleus muscle in AG and MG mice. Second, although we demonstrated that the
gene expression profiles between AG and GC are relatively similar in the soleus muscle, this study only reflects
that spaceflight for 35 days has a larger effect on mice under microgravity than other events such as space radia-
tion. Future studies may need to study different time points, such as longer periods using the MARS platform
to elucidate the space radiation effects in mammals. Third, our study has not determined whether disuse or
microgravity contributed mainly to muscle atrophy under spaceflight.
Taken together, we could gain a foothold in accelerating the estimation of muscle atrophy mechanisms by
these gene profiles. Although the current study was made possible by state-of-the-art devices that implement
an artificial 1 g onboard environment in the ISS, future studies of mammals will validate the effect of long-term
habitation under gravitational forces weaker than 1 g, which is meant to simulate the gravity of the Moon and
Mars, known as partial gravity. As experiment methods for space biology continue to develop, future studies may
more conclusively identify the underlying causes and offer strategies to prevent muscle atrophy.
Materials and methods
Mice. All experiments were approved by the Institutional Animal Care and Use Committee of the University
of Tsukuba (No. 16-048), JAXA (Protocol Number: 016-014B), Explora Biolabs (Study Number: EB15-010A),
and NASA (Protocol Number: NAS-15-004-Y1) and were conducted according to the guidelines and applica-
ble laws in Japan and the United States of America and the ARRIVE guidelines. Mice were maintained under
specific pathogen-free conditions throughout the space experiment. The JAXA mission, MHU-1, was described
previously14. In brief, C57BL/6 J male mice (Stock #000,664) were purchased from Jackson Laboratories (USA)
for the space experiment and Charles River Laboratories (Japan) for the ground experiment. The SpaceX Falcon
9 rocket (SpX9) was launched on June 18, 2016 (EDT) from the Kennedy Space Center (KSC). Inside the ISS,
12 mice (8 weeks old) were divided into two groups: artificial 1 g (AG) and microgravity (μg; MG) and housed
for 34.6 days in Habitat Cage Units (HCUs) under μg conditions and for 34.1 days and under 1 g during the
approximate 37-day berthing period. They were housed for 35 days in HCUs and then returned to Earth in spe-
cific pathogen-free conditions. All mice splashed down in the Pacific Ocean near the West Coast on August 26,
2016 and were then transported to the Explore Biolabs laboratory (San Diego) for behavioral observation and
dissection 2 days later. The GC experiment that replicated the housing conditions of the flight experiment was
conducted at the JAXA Tsukuba Space Center (TKSC) in Japan from August 27 to November 3, 2016. All mice
were euthanized by inhalation of 2% isoflurane, and then dissected to collect tissue samples.
Histological staining of HE and immunostaining of the different muscle fiber types. The soleus
muscles were immediately frozen in isopentane cooled with liquid nitrogen. Frozen tissues (8 μm in thickness)
were mounted on glass slides and subjected to hematoxylin–eosin staining. Immunohistochemical analysis of
the different muscle fiber types was performed using fiber type-specific antibodies (Type I; BA-D5, Type IIa;
SC-71, Type IIb; BF-F8, the Developmental Studies Hybridoma Bank (DSHB)). The tissue sections were treated
with a Mouse on Mouse (M.O.M.) fluorescein kit (Vector Laboratories) to block mouse IgG background. Immu-
nodetection was performed using Alexa Fluor-conjugated secondary antibodies (Alexa Fluor 350 conjugated
anti-mouse IgG2b, Alexa Fluor 488 conjugated anti-mouse IgG1, Alexa Fluor 555 conjugated anti-mouse IgM,
Thermo Fisher). Images were captured and analyzed using a BIOREVO BZ-X800 microscope system (Keyence,
Osaka, Japan). The number of immunoreactive muscle fibers and CSAs were determined using the hybrid cell
count software by Keyence.
RNA sequencing. RNAseq was employed for transcriptome analysis. RNA was extracted from the soleus
muscles of 3 mice in each group: AG, MG, and GC. Briefly, total RNA was isolated using the TRIZOL reagent
(Thermo Fisher Scientific). RNA quality was controlled using an RNA 6000 Pico kit (Agilent, Santa Clara, CA,
USA) from 100 frozen sections (8 μm in thickness) of the soleus muscle. A total amount of 50 ng total RNA was
used for RNAseq library preparation using the NEBNext rRNA Depletion Kit and NEBNext Ultra Directional
RNA Library Prep Kit (New England Biolabs, Ipswich, MA, USA); 2 × 36 base paired-end sequencing was per-
formed using NextSeq500 (Illumina, San Diego, CA) by Tsukuba i-Laboratory LLP (Tsukuba, Ibaraki, Japan).
Sequence reads were mapped into the mouse genome (mm10) and quantified for annotated genes using the CLC
Genomics Workbench (Version 11.0.2; Qiagen, Redwood City, CA, USA). The expression levels were calculated
in transcripts per million (TPM)61. We excluded genes with less than 10 read counts in any sample. After filter-
ing, the differential gene expression was calculated between conditions (GC vs. MG, AG vs. MG, GC vs. AG)
with the FDR-corrected P < 0.05 and a 1.5-fold change cutoff using the empirical analysis of DGE tool (EdgeR)
on the CLC Genomics Workbench software.
Enrichment analysis process. DAVID Bioinformatics Resources 6.862 was used for pathway analysis and
for enrichment analysis of the tissue specificity database (UniProt; UP-Tissue) with P-value < 0.05.
Generation of the adenoviral vector. Three recombinant adenoviruses encoding the EGFP alone,
mouse Cacng1 or FoxO3a (CA), a constitutively active (CA) form of mouse FoxO3a, fused with the IRES-
EGFP cassette expressing the green fluorescent protein were generated by in vitro recombination techniques.
Briefly, the IRES-EGFP cDNA was amplified from the pIRES2-EGFP vector (BD Biosciences Clontech) using
the following primers: forward, 5′-CCCACTCGAGGCCCCTCTCCCTCC-3′; reverse, 5′-GGGTGATATCTTA
Scientific Reports | (2021) 11:9168 | https://doi.org/10.1038/s41598-021-88392-4 11
Vol.:(0123456789)www.nature.com/scientificreports/
CTTGTACAGCTC-3′. Xho I and EcoRV restriction sites are underlined. The amplified fragment was inserted
at the Xho I-EcoRV of the pENTR3C entry vector to generate the pENTR3C-IRES-EGFP entry vector. Cacng1
cDNA was cloned by RT–PCR from mouse soleus muscle using the following primers: forward, 5′-CCCAGGA
TCCGCCACCATGTCACAGACC-3′; reverse, 5′-GGGTCTCGAGCTAGTGCTCTGGCTC-3′. BamHI and
Xho I restriction sites are underlined. The amplified fragment was inserted at the BamHI and Xho I sites of
the pENTR3C-IRES-EGFP entry vector to generate the pENTR3C-Cacng1-IRES-EGFP vector. pcDNA3-Flag-
mouse FoxO3a was a generous gift of Prof. A. Fukamizu (University of Tsukuba). The expression vectors for
FoxO3a(CA) mutated at the three AKT phosphorylation sites (T32A, S252A, S314A) were constructed by intro-
ducing the mutations by PCR-based site-directed mutagenesis. Flag-FoxO3a-CA was cloned by RT–PCR from
mouse soleus muscle using the following primers: forward, 5′-CCCCGAATCCGCCACCATGGATTATAAG
GAC-3′; reverse, 5′-GAGGGGCAAACAACAGATGG-3′. EcoRI restriction sites are underlined. The amplified
fragment was inserted at the EcoRI sites of the pENTR3C-IRES-EGFP entry vector to generate pENTR3C-Flag-
FoxO3a(CA)-IRES-EGFP vector. Then, these inserts were transferred into the pAd/CMV/V5-DEST (Thermo
Fisher Scientific) adenoviral expression vector using the ViraPower Adenoviral Gateway Expression Kit (Life
Technologies, Carlsbad, CA) according to the manufacturer’s instructions. All constructs were sequenced to
confirm their identity. The recombinant plasmids obtained, pAd-EGFP, pAd-Cacng1-IRES-EGFP, and pAd-
Flag-FoxO3a(CA)-IRES-EGFP, were linearized with Pac I (New England Biolabs Japan Inc., Tokyo, Japan)
restriction enzyme, and ethanol-precipitated. They were then used for the transfection of 293A cells with Lipo-
fectamine 2000 (Invitrogen, Carlsbad, CA, USA) in Opti-MEM medium (Invitrogen) on collagen type I-coated
dishes (Thermo Fisher Scientific) to produce the recombinant adenoviral vectors. 4–6 h. after incubation at
37 °C, the medium with the transfection mix was removed, and the growth medium was added. The transfected
cells were monitored for EGFP expression and collected 7–14 days after transfection by scraping cells off the
dishes and pelleting them along with any floating cells in the culture. After three cycles of freezing in liquid
nitrogen and rapid thawing at 37 °C, the viral lysate was used to infect the new cells. One to two days later, the
viruses were harvested as described above. This process was repeated 5 times; then, the viruses were purified by
cesium chloride (CsCl) gradient ultracentrifugation followed by dialysis with three changes of buffer containing
sodium chloride and magnesium chloride to remove CsCl. Viral titers were determined by a plaque-forming
assay using the Adeno-X Rapid Titer Kit (Takara bio.) and 293 cells according to the manufacturer’s instructions.
Cell culture, adenoviral infection, and myotube analysis. The C2C12 myoblast cell line (ATCC;
CRL-1772) was cultured in high-glucose Dulbecco’s modified Eagle’s Medium (DMEM) supplemented with 10%
fetal bovine serum until the cells reached confluence. The medium was then replaced with DMEM 2% horse
serum (HS; Thermo Fisher Scientific), the differentiation medium, and incubated for 4 days to induce myotube
formation before proceeding with the experiments. For infection, the myotubes were incubated with adenovirus
at a multiplicity of infection (MOI) of 250, 125, and 62.5 in the differentiation medium for 18 h., and then the
medium was replaced with the differentiation medium without adenovirus. The infection efficiency was typically
greater than 90%. Two days after infection, the cells were fixed in 4% paraformaldehyde/PBS for 10 min. and
permeabilized in 0.1% Triton X-100/PBS for 10 min. The fixed cells were blocked for 1 h. in 2% BSA/PBS and
incubated overnight at 4 °C with anti-myosin heavy chain (MHC) monoclonal antibody (1:100; MF20, DSHB).
The antigens were visualized using appropriate secondary antibodies conjugated with Alexa Fluor 546 (1:200;
Thermo Fisher Scientific), and the nuclei were labeled with Hoechst 33,342 (Molecular Probes). The cells were
mounted with 20 mM Tris-HCl (pH 8.0), 90% glycerol. All images were captured by using a fluorescence micro-
scope (BIOREVO BZ-9000, Keyence). The myotube diameter was quantified by measuring a total of > 100 tube
diameters from ten random fields at 200 × magnification using ImageJ software (NIH, Frederick, MD, USA) as
described51. All data are expressed as the mean ± SEM.
Adenoviral vector administration and fiber size measurements. Adenoviral vector administra-
tion and fiber size measurements were performed as previously described63. Briefly, 2- to 4-day-old ICR mice
pups (Japan SLC Inc.) were anesthetized via hypothermia by placement on ice-cooled aluminum foil for a
few minutes. Infectious particles (1–2 × 10⁷) of Ad5 cytomegalovirus containing mouse Cacng1-IRES-EGFP,
FoxO3a(CA)-IRES-EGFP, or EGFP cDNA diluted in a final volume of 10 μl in PBS were injected percutaneously
into each skeletal muscle of the corresponding mice using an insulin syringe. The pups were reintroduced to the
mother and kept in quarantine for 5 days. All pups survived after infection.
Statistics. All data are presented as the mean ± SEM. The statistical significance between GC, AG, and MG
(Fig. 1B, E, F) were determined by Tukey’s test. Results with P < 0.05 were considered significant. The compari-
son between EGFP and Cacng1, and EGFP and FoxO3a(CA) were determined using Student’s t-test, and results
with P < 0.05 were considered significant (Fig. 5B, E).
Data availability
All data that support the findings of this study are available from the corresponding author upon reasonable
request. RNAseq data are deposited in the DDBJ database (The DNA Databank of Japan, https://www.ddbj.nig.
ac.jp/) (accession number DRA010983).
Received: 31 October 2020; Accepted: 16 March 2021
Scientific Reports | (2021) 11:9168 | https://doi.org/10.1038/s41598-021-88392-4 12
Vol:.(1234567890)www.nature.com/scientificreports/
References
1. Volkmann, D. & Baluska, F. Gravity: one of the driving forces for evolution. Protoplasma 229, 143–148. https://doi.org/10.1007/
s00709-006-0200-4 (2006).
2. Schiaffino, S., Sandri, M. & Murgia, M. Activity-dependent signaling pathways controlling muscle diversity and plasticity. Physiol-
ogy (Bethesda) 22, 269–278. https://doi.org/10.1152/physiol.00009.2007 (2007).
3. Frontera, W. R. & Ochala, J. Skeletal muscle: a brief review of structure and function. Calcif. Tissue Int. 96, 183–195. https://doi.
org/10.1007/s00223-014-9915-y (2015).
4. Baar, K., Nader, G. & Bodine, S. Resistance exercise, muscle loading/unloading and the control of muscle mass. Essays Biochem.
42, 61–74. https://doi.org/10.1042/bse0420061 (2006).
5. Desplanches, D., Mayet, M. H., Ilyina-Kakueva, E. I., Sempore, B. & Flandrois, R. Skeletal muscle adaptation in rats flown on
Cosmos 1667. J. Appl. Physiol. 1985(68), 48–52. https://doi.org/10.1152/jappl.1990.68.1.48 (1990).
6. Ohira, Y. et al. Rat soleus muscle fiber responses to 14 days of spaceflight and hindlimb suspension. J. Appl. Physiol. 1985(73),
51S-57S. https://doi.org/10.1152/jappl.1992.73.2.S51 (1992).
7. Harrison, B. C. et al. Skeletal muscle adaptations to microgravity exposure in the mouse. J. Appl. Physiol. 1985(95), 2462–2470.
https://doi.org/10.1152/japplphysiol.00603.2003 (2003).
8. Edgerton, V. R. et al. Human fiber size and enzymatic properties after 5 and 11 days of spaceflight. J. Appl. Physiol. 1985(78),
1733–1739. https://doi.org/10.1152/jappl.1995.78.5.1733 (1995).
9. Ohira, Y. et al. Myonuclear domain and myosin phenotype in human soleus after bed rest with or without loading. J. Appl. Physiol.
1985(87), 1776–1785. https://doi.org/10.1152/jappl.1999.87.5.1776 (1999).
10. Yamashita-Goto, K. et al. Maximal and submaximal forces of slow fibers in human soleus after bed rest. J. Appl. Physiol. 1985(91),
417–424. https://doi.org/10.1152/jappl.2001.91.1.417 (2001).
11. Morey-Holton, E. R., Hill, E. L. & Souza, K. A. Animals and spaceflight: from survival to understanding. J. Musculoskelet. Neuronal
Interact. 7, 17–25 (2007).
12. Sandona, D. et al. Adaptation of mouse skeletal muscle to long-term microgravity in the MDS mission. PLoS ONE 7, e33232.
https://doi.org/10.1371/journal.pone.0033232 (2012).
13. Gambara, G. et al. Gene expression profiling in slow-type calf soleus muscle of 30 days space-flown mice. PLoS ONE 12, e0169314.
https://doi.org/10.1371/journal.pone.0169314 (2017).
14. Shiba, D. et al. Development of new experimental platform ’MARS’-multiple artificial-gravity research system-to elucidate the
impacts of micro/partial gravity on mice. Sci. Rep. 7, 10837. https://doi.org/10.1038/s41598-017-10998-4 (2017).
15. Tominari, T. et al. Hypergravity and microgravity exhibited reversal effects on the bone and muscle mass in mice. Sci. Rep. 9, 6614.
https://doi.org/10.1038/s41598-019-42829-z (2019).
16. Suzuki, T. et al. Nrf2 contributes to the weight gain of mice during space travel. Commun. Biol. 3, 496. https://doi.org/10.1038/
s42003-020-01227-2 (2020).
17. Mao, X. W. et al. Impact of spaceflight and artificial gravity on the mouse retina: biochemical and proteomic analysis. Int. J. Mol.
Sci. https://doi.org/10.3390/ijms19092546 (2018).
18. Horie, K. et al. Down-regulation of GATA1-dependent erythrocyte-related genes in the spleens of mice exposed to a space travel.
Sci. Rep. 9, 7654. https://doi.org/10.1038/s41598-019-44067-9 (2019).
19. Matsumura, T. et al. Male mice, caged in the International Space Station for 35 days, sire healthy offspring. Sci. Rep. 9, 13733.
https://doi.org/10.1038/s41598-019-50128-w (2019).
20. Ohira, Y. et al. Gravitational unloading effects on muscle fiber size, phenotype and myonuclear number. Adv. Space Res. 30, 777–781.
https://doi.org/10.1016/s0273-1177(02)00395-2 (2002).
21. Cadena, S. M. et al. Skeletal muscle in MuRF1 null mice is not spared in low-gravity conditions, indicating atrophy proceeds by
unique mechanisms in space. Sci. Rep. 9, 9397. https://doi.org/10.1038/s41598-019-45821-9 (2019).
22. da Silveira, W. A. et al. Comprehensive multi-omics analysis reveals mitochondrial stress as a central biological hub for spaceflight
impact. Cell 183, 1185-1201e1120. https://doi.org/10.1016/j.cell.2020.11.002 (2020).
23. Lecker, S. H. et al. Multiple types of skeletal muscle atrophy involve a common program of changes in gene expression. FASEB J.
18, 39–51. https://doi.org/10.1096/fj.03-0610com (2004).
24. Bodine, S. C. et al. Identification of ubiquitin ligases required for skeletal muscle atrophy. Science 294, 1704–1708. https://doi.org/
10.1126/science.1065874 (2001).
25. Sacheck, J. M. et al. Rapid disuse and denervation atrophy involve transcriptional changes similar to those of muscle wasting during
systemic diseases. FASEB J. 21, 140–155. https://doi.org/10.1096/fj.06-6604com (2007).
26. Judge, S. M. et al. Genome-wide identification of FoxO-dependent gene networks in skeletal muscle during C26 cancer cachexia.
BMC Cancer 14, 997. https://doi.org/10.1186/1471-2407-14-997 (2014).
27. Mayeuf-Louchart, A. et al. Rev-erb-alpha regulates atrophy-related genes to control skeletal muscle mass. Sci. Rep. 7, 14383. https://
doi.org/10.1038/s41598-017-14596-2 (2017).
28. Milan, G. et al. Regulation of autophagy and the ubiquitin-proteasome system by the FoxO transcriptional network during muscle
atrophy. Nat. Commun. 6, 6670. https://doi.org/10.1038/ncomms7670 (2015).
29. Suzuki, H. et al. IkappaBalpha ubiquitination is catalyzed by an SCF-like complex containing Skp1, cullin-1, and two F-box/
WD40-repeat proteins, betaTrCP1 and betaTrCP2. Biochem. Biophys. Res. Commun. 256, 127–132. https://doi.org/10.1006/bbrc.
1999.0289 (1999).
30. Pan, D., Zhe, X., Jakkaraju, S., Taylor, G. A. & Schuger, L. P311 induces a TGF-beta1-independent, nonfibrogenic myofibroblast
phenotype. J. Clin. Invest. 110, 1349–1358. https://doi.org/10.1172/JCI15614 (2002).
31. Magnusson, C., Svensson, A., Christerson, U. & Tagerud, S. Denervation-induced alterations in gene expression in mouse skeletal
muscle. Eur. J. Neurosci. 21, 577–580. https://doi.org/10.1111/j.1460-9568.2005.03855.x (2005).
32. Harding, H. P. et al. An integrated stress response regulates amino acid metabolism and resistance to oxidative stress. Mol. Cell
11, 619–633. https://doi.org/10.1016/s1097-2765(03)00105-9 (2003).
33. Summermatter, S. et al. Blockade of metallothioneins 1 and 2 increases skeletal muscle mass and strength. Mol. Cell Biol. https://
doi.org/10.1128/MCB.00305-16 (2017).
34. Moresi, V. et al. Myogenin and class II HDACs control neurogenic muscle atrophy by inducing E3 ubiquitin ligases. Cell 143,
35–45. https://doi.org/10.1016/j.cell.2010.09.004 (2010).
35. Bonaldo, P. & Sandri, M. Cellular and molecular mechanisms of muscle atrophy. Dis. Model. Mech. 6, 25–39. https://doi.org/10.
1242/dmm.010389 (2013).
36. Taillandier, D. & Polge, C. Skeletal muscle atrogenes: from rodent models to human pathologies. Biochimie 166, 251–269. https://
doi.org/10.1016/j.biochi.2019.07.014 (2019).
37. Kneppers, A. et al. Coordinated regulation of skeletal muscle mass and metabolic plasticity during recovery from disuse. FASEB
J. 33, 1288–1298. https://doi.org/10.1096/fj.201701403RRR (2019).
38. Mirzoev, T. M. Skeletal muscle recovery from disuse atrophy: protein turnover signaling and strategies for accelerating muscle
regrowth. Int. J. Mol. Sci. https://doi.org/10.3390/ijms21217940 (2020).
39. Beheshti, A., Ray, S., Fogle, H., Berrios, D. & Costes, S. V. A microRNA signature and TGF-beta1 response were identified as the
key master regulators for spaceflight response. PLoS ONE 13, e0199621. https://doi.org/10.1371/journal.pone.0199621 (2018).
Scientific Reports | (2021) 11:9168 | https://doi.org/10.1038/s41598-021-88392-4 13
Vol.:(0123456789)You can also read


