Effects of atmospheric CO2 variability of the past 800 kyr on the biomes of southeast Africa - Climate of the Past
←
→
Page content transcription
If your browser does not render page correctly, please read the page content below
Clim. Past, 15, 1083–1097, 2019
https://doi.org/10.5194/cp-15-1083-2019
© Author(s) 2019. This work is distributed under
the Creative Commons Attribution 4.0 License.

Effects of atmospheric CO2 variability of the past 800 kyr on the
biomes of southeast Africa
Lydie M. Dupont1 , Thibaut Caley2 , and Isla S. Castañeda3
1 MARUM     – Center for Marine Environmental Sciences, University of Bremen, Bremen, Germany
2 EPOC,  UMR 5805, CNRS, University of Bordeaux, Pessac, France
3 University of Massachusetts Amherst, Department of Geosciences, Amherst, MA, USA

Correspondence: Lydie M. Dupont (ldupont@marum.de)

Received: 6 February 2019 – Discussion started: 20 February 2019
Revised: 10 May 2019 – Accepted: 23 May 2019 – Published: 19 June 2019

Abstract. Very little is known about the impact of atmo-        1   Introduction
spheric carbon dioxide pressure (pCO2 ) on the shaping of
biomes. The development of pCO2 throughout the Brun-            Understanding the role of atmospheric carbon dioxide pres-
hes Chron may be considered a natural experiment to eluci-      sure (pCO2 ) is paramount for the interpretation of the of
date relationships between vegetation and pCO2 . While the      the palaeovegetation record. The effects of low pCO2 on
glacial periods show low to very low values (∼ 220 to ∼         glacial vegetation have been discussed in a number of stud-
190 ppmv, respectively), the pCO2 levels of the interglacial    ies (Ehleringer et al., 1997; Jolly and Haxeltine, 1997; Cowl-
periods vary from intermediate to relatively high (∼ 250 to     ing and Sykes, 1999; Prentice and Harrison, 2009; Prentice
more than 270 ppmv, respectively). To study the influence of    et al., 2017) predicting that glacial increases in C4 vegeta-
pCO2 on the Pleistocene development of SE African vege-         tion favoured by low atmospheric CO2 would have opened
tation, we used the pollen record of a marine core (MD96-       the landscape and lowered the tree line. Comparing records
2048) retrieved from Delagoa Bight south of the Limpopo         of this glacial C4 -rich vegetation with modern analogues
River mouth in combination with stable isotopes and geo-        could have led to estimating more severe aridity than actually
chemical proxies. Applying endmember analysis, four pollen      occurred during the Last Glacial Maximum. These studies,
assemblages could be distinguished representing different       however, mostly cover the last glacial–interglacial transition
biomes: heathland, mountain forest, shrubland and wood-         and do not examine periods with intermediate pCO2 such as
land. We find that the vegetation of the Limpopo River catch-   during the early glacial (MIS 5a–d) or interglacials prior to
ment and the coastal region of southern Mozambique is influ-    430 000 years ago (430 ka). Comparing the vegetation record
enced not only by hydroclimate but also by temperature and      of subsequent climate cycles showing different CO2 levels
atmospheric pCO2 . Our results suggest that the extension of    might help to better understand the effects of pCO2 on the
mountain forest occurred during those parts of the glacials     vegetation.
when pCO2 and temperatures were moderate and that only             During the Brunhes Chron (past 780 kyr), the length of the
during the colder periods when atmospheric pCO2 was low         glacial cycles became much longer, lasting roughly 100 kyr
(less than 220 ppmv) open ericaceous vegetation including       due to a strong non-linear response of the ice sheets to so-
C4 sedges extended. The main development of woodlands in        lar forcing (Mudelsee and Stattegger, 1997). Model exper-
the area took place after the Mid-Brunhes Event (∼ 430 ka)      iments of Ganopolski and Calov (2011) indicate that low
when interglacial pCO2 levels regularly rose over 270 ppmv.     atmospheric CO2 concentrations are a prerequisite for the
                                                                long duration of the glacial cycles of the past 800 kyr. Then,
                                                                roughly midway through the Brunhes Chron, the amplitude
                                                                of the climate cycles shifted with a change in the maximum
                                                                CO2 concentration during interglacials.

Published by Copernicus Publications on behalf of the European Geosciences Union.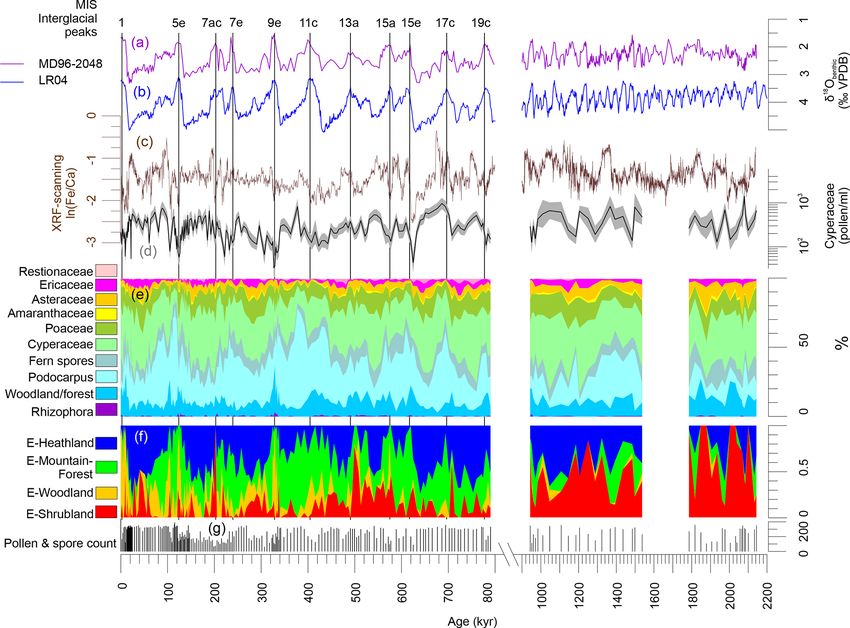
1084                                                                L. M. Dupont et al.: Effects of atmospheric CO2 variability

   This so-called Mid-Brunhes Event (MBE) (Jansen et al.,           540 ka related to the interglacials of MIS 13, 11, 9, 7, 5e
1986) – also called Mid-Brunhes Transition – occurred               and 1. The forests’ assemblage of MIS 13, however, does
about 430 kyr ago and marks the transition between inter-           not show a strong contrast with those of the interglacials af-
glacials characterized by rather low atmospheric CO2 around         ter the MBE (Miller and Goslin, 2014). The marine pollen
240 ppm (parts of Marine Isotope Stages (MIS) 19, 17, 15,           record of Ocean Drilling Program (ODP) site 658 off Cape
13) to interglacials in which CO2 levels reached 270 ppmv or        Blanc tracks the latitudinal position of the open grass-rich
more (parts of MIS 11, 9, 7, 5, 1) (Lüthi et al., 2008; Bere-       vegetation zones at the boundary between the Sahara and
iter et al., 2015). The climate transition of the MBE has been      Sahel suggesting shifting vegetation zones between glacials
extensively studied using Earth system models of interme-           and interglacials (Dupont and Hooghiemstra, 1989; Dupont
diate complexity. Yin and Berger (2010) stress the impor-           et al., 1989). The drier interglacials occurred after MIS 9,
tance of forcing by austral summer insolation, and Yin and          which indicates a transition after the MBE to more arid con-
Berger (2012) argue that the model vegetation (tree fraction)       ditions. Additionally, stable carbon isotope records from Chi-
was forced by precession through precipitation at low lati-         nese loess sections indicate interglacial–glacial variability in
tudes. Both papers show the necessity to include the change         the C3 –C4 proportions of the vegetation (Sun et al., 2010;
in atmospheric CO2 in the explanation of the MBE (Yin and           Lyu et al., 2018). However, the latter records do not show a
Berger, 2010, 2012). Yin (2013), however, concludes that it is      prominent vegetation shift over the MBE.
not necessary to invoke a sudden event around 430 ka to ex-            For East Africa, two terrestrial records and a marine one
plain the increased interglacial CO2 ; the differences between      are available. From Lake Malawi, Johnson et al. (2016) in-
interglacials before and after the MBE can be explained by          fer wetter conditions and increased woodland vegetation be-
individual responses in Southern Ocean ventilation and deep-        tween 800 and 400 ka based on the stable carbon isotopic
sea temperature to various combinations of the astronomical         composition of plant wax shifting from less to more strongly
parameters. On the other hand, statistical analysis suggests a      depleted values. Also from Lake Malawi, Ivory et al. (2018)
dominant role of the carbon cycle, which changed over the           published a pollen record of the past 600 kyr revealing a
MBE (Barth et al., 2018). Paillard (2017) developed a con-          number of phases of Miombo woodland and mountain for-
ceptual model of orbital forcing of the carbon cycle in which       est alternating with savannah vegetation (dry woodland and
sea-level fluctuations and the effects on carbon burial are de-     wooded grassland). Recently, a new record from Lake Ma-
cisive during shifts in the climate system. Further modelling       gadi (Kenya) has been published indicating a change from
by Bouttes et al. (2018) showed qualitative agreement with          wetter conditions to more aridity after 500 ka, contrasting
the palaeodata of pre- and post-MBE interglacials but largely       the Lake Malawi results (Owen et al., 2018). In Lake Ma-
underestimated the amplitude of the changes. Moreover, the          gadi, the representation of Podocarpus decreased over the
simulated vegetation seems to counteract the effects of the         MBE, while open grassy vegetation and salinity of the lake
oceanic response (Bouttes et al., 2018). Thus, the vegetation,      increased (Owen et al., 2018). Neither the Lake Malawi nor
in particular at low latitudes, may play a crucial but poorly       the Lake Magadi records show dominant interglacial–glacial
understood role in the climate system.                              variability.
   Comparing records of pre- and post-MBE interglacials                The marine record retrieved south of the Limpopo River
could offer insight in the interglacial climate at different lev-   mouth (core MD96-2048) allows inferences about vegeta-
els of CO2 (Foley et al., 1994; Swann et al., 2010). We define      tion and climate in the catchment area of the Limpopo River
interglacials after PAGES (2016) listing MIS 19c, 17c, 15a,         draining large areas of South Africa, Botswana, Zimbabwe
15e and 13a as pre-MBE and MIS 11c, 9e, 7e, 7a–c, 5e and 1          and Mozambique. Based on sediment chemistry, Caley et
as post-MBE. Currently, only a handful of vegetation records        al. (2018a) reported the effects of increased summer inso-
covering the entire Brunhes Chron have sufficient temporal          lation in increased fluvial discharge and variability associ-
resolution to enable comparisons between interglacials be-          ated with eccentricity, which modulates precession ampli-
fore and after the Mid-Brunhes Transition. These records            tudes. Superimposed on the orbital-scale precipitation vari-
are from the eastern Mediterranean, the Colombian Andes             ability, a long-term trend from 1000 to 600 ka towards in-
(PAGES, 2016), west and east Africa (Dupont et al., 1989;           creased aridity in southeastern Africa was found (Caley et
Miller and Goslin, 2014; Castañeda et al., 2016a; Johnson et        al., 2018a). The plant leaf wax carbon isotopic (hereafter
al., 2016; Ivory et al., 2018; Owen et al., 2018). The Andean       δ 13 Cwax ) record of the same core was originally interpreted
pollen record is strongly influenced by the immigration of          as reflecting a trend toward increasingly drier glacials and
oak from North America during MIS 12 (Torres et al., 2013).         wetter interglacials over the past 800 kyr (Castañeda et al.,
For the eastern Mediterranean, a decline in plant diversity         2016a). Additionally, the average chain lengths of the plant
is observed at Tenaghi Philippon (Greece) where the mod-            leaf waxes exhibit a stepwise decrease at 430 ka suggest-
ern Mediterranean oak forests gradually emerged in the in-          ing a change from more shrub vegetation before the MBE
terglacials after MIS 16 but before the MBE (Tzedakis et al.,       to a larger contribution of trees during the post-MBE in-
2006, 2009). The west African record of Lake Bosumtwi in            terglacials (Castañeda et al., 2016a). Thus, a pollen record
Ghana allows identification of six forest assemblages since         of MD96-2048 has the potential to register the changes in

Clim. Past, 15, 1083–1097, 2019                                                               www.clim-past.net/15/1083/2019/
L. M. Dupont et al.: Effects of atmospheric CO2 variability                                                                 1085

interglacial vegetation cover over the MBE. We might ex-           1.2    Present-day climate and vegetation
pect a change of Southern Hemisphere vegetation being less
ambiguous than the changes found on the Northern Hemi-             Modern climate is seasonal with the rainy season in sum-
sphere (see above), because modelling indicates that the ef-       mer (November to March). Yearly precipitation ranges from
fects of the MBE were more pronounced on the Southern              600 mm in the lowlands to 1400 mm in the mountains,
Hemisphere (Yin and Berger, 2010). Until now, the palynol-         whereby rains are more frequent along the coast under the
ogy of only the last 350 kyr has been published (Dupont et         influence of SSTs (Jury et al., 1993; Reason and Mulenga,
al., 2011a), and therefore here we extend the pollen record        1999). Annual average temperatures range from 24 to 16 ◦ C,
of MD96-2048 to cover the past 800 kyr in sufficient reso-         but in the highlands clear winter nights may be frosty.
lution. As described below, our new palynology results have           The modern vegetation of this area belongs to the forest,
led to the reinterpretation of the MD96-2048 δ 13 Cwax record      Highveld grassland and savannah biomes and also includes
(Castañeda et al., 2016a).                                         azonal vegetation (Fig. 1) (Dupont et al., 2011a, and refer-
                                                                   ences therein). The natural potential vegetation of the coastal
                                                                   belt is forest, although at present it is almost gone; north of
1.1   Previous work on core MD96-2048                              the Limpopo River mouth, rain forests belong to the Inham-
The sediments of MD96-2048 were retrieved in the middle of         bane phytogeographical mosaic and south of the Limpopo
the Delagoa Bight (Fig. 1) from the southern Limpopo cone          River the forest belongs to the Tongaland–Pondoland re-
forming a depot centre that has been build up at least since       gional mosaic (White, 1983). The vegetation of the north-
the Late Miocene (Martin, 1981). The site collects terrestrial     ern part of the Tongaland–Pondoland region is the North-
material including pollen and spores mostly from the rivers        ern Coastal Forest (Mucina and Rutherford, 2006). Semi-
that discharge into the Delagoa Bight of which the Limpopo         deciduous forest is found in the Lebombo hills (Kersberg,
River is the biggest draining large areas of northern South        1996). Afromontane forest and Highveld grasslands grow
Africa and southern Mozambique. Apart from the offshore            along the escarpment and on the mountains. The savan-
winds descending from the interior plateau, so-called Berg         nahs of the Zambezian phytogeographical region, includ-
winds, the predominant wind direction is landward (Tyson           ing, e.g. the Miombo dry forest, occur further inland (White,
and Preston-Whyte, 2000) and aeolian input of terrestrial ma-      1983). Azonal vegetation consists of freshwater swamps, al-
terial is probably minor. Thus, pollen source areas would          luvial and seashore vegetation, and mangroves (Mucina and
cover the region north of the Delagoa Bight in southern            Rutherford, 2006).
Mozambique and the region west of the Lebombo hills and
the Drakensberg escarpment (Dupont et al., 2011a).                 2     Material and methods
   A wide variety of measurements have been performed
on MD96-2048 sediments. Caley et al. (2011, 2018a)                 Pollen analysis of the 37.59 m long core MD96-2048
recorded stable oxygen isotopes of benthic foraminifers            (26◦ 100 S, 34◦ 010 E; 660 m water depth) was extended with
(Planulina wuellerstorfi) providing a stable oxygen stratig-       65 samples down core to 12 m (790 ka). Average sampling
raphy and age model aligned to the global stack LR04               distance for the Brunhes part was 7 cm reaching an aver-
(Lisiecki and Raymo, 2005) for the past 2200 kyr. Trace el-        age temporal resolution of 4 kyr according to the age model
ement (Mg/Ca ratios) of the planktic foraminifer Globigeri-        based on the stable oxygen isotope stratigraphy of benthic
noides ruber sensu stricto and foraminifer assemblages were        foraminifers (Caley et al., 2011, 2018a). Two older win-
combined to produce a robust sea surface temperature (SST)         dows have been sampled; 20 samples between 15 and 26 m
record (Caley et al., 2018a). High-resolution (0.5 cm) X-ray       (943–1537 ka) and 19 samples between 30 and 36 m (1785–
fluorescence (XRF) scanning has been performed over the to-        2143 ka) were taken with an average resolution of 31 and
tal core length, of which the iron–calcium ratios, ln(Fe/Ca),      20 kyr, respectively.
were used to estimate fluvial terrestrial input variability (Ca-      Pollen preparation has been described in Dupont et
ley et al., 2018a). At millennial resolution, higher plant leaf    al. (2011a). In summary, samples were decalcified with hy-
wax (n-alkane) concentrations and ratios and compound-             drochloric acid (HCl) (∼ 10 %), treated with hydrofluoric
specific stable carbon isotopes (δ 13 Cwax ) provided a record     acid (HF) (∼ 40 %) for 2 d, ultrasonically sieved over an
of vegetation changes in terms of open versus closed canopy        8 µm screen and, if necessary, decanted. The samples were
and C4 versus C3 plants of the past 800 kyr (Castañeda et al.,     spiked with two Lycopodium spore tablets (either of batch
2016a). A very low-resolution leaf wax deuterium isotopic          no. 938934 or batch no. 177745). Residues were mounted in
record was generated (Caley et al., 2018a) and, in conjunc-        glycerol and pollen and spores examined at 400× or 1000×
tion with other high-resolution proxies including ln(Fe/Ca),       magnification. Percentages are expressed based on the total
was used to reconstruct rainfall and Limpopo River runoff          of pollen and spores ranging from over 400 to 60 – only
during the past 2.0 Myr.                                           in six samples this sum amounts to less than 100. Confi-
                                                                   dence intervals (95 %) were calculated after Maher Jr. (1972,
                                                                   1981). Pollen has been identified using the reference collec-

www.clim-past.net/15/1083/2019/                                                               Clim. Past, 15, 1083–1097, 2019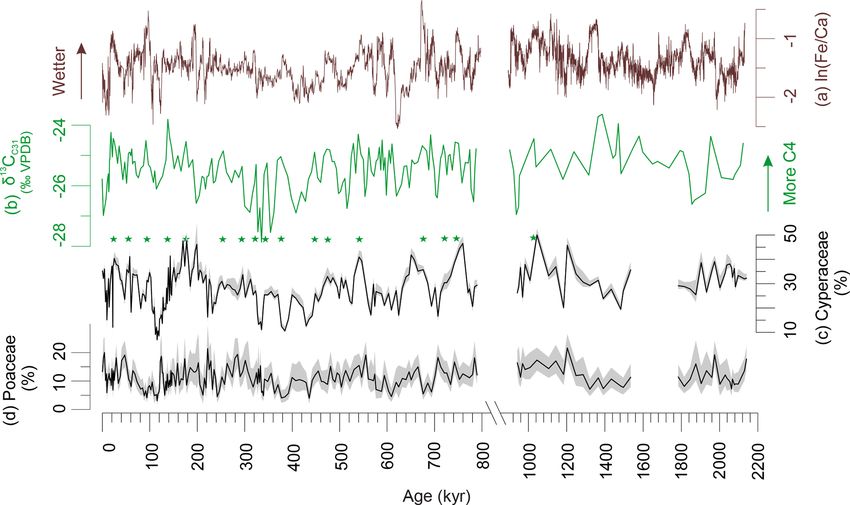
1086                                                                    L. M. Dupont et al.: Effects of atmospheric CO2 variability

Figure 1. (a) Map of southern Africa with the main phytochoria after White (1983). (b) Site location of MD96-2048; main vegetation forma-
tions; main rivers; 100, 200, 500 and 1000 m contours; 200, 500 and 1000 m bathymetric contours; Agulhas (AC) and counter current (CC)
forming a coastal Delagoa Bight lee eddy. Zambezian vegetation woodland and savannah north of ∼ 25◦ 300 S, Tongaland–Pondoland coastal
forests south of ∼ 25◦ 300 S, Zanzibar–Inhambane coastal forests east of 33–34◦ E. West of the escarpment with Afromontane forest rises the
interior plateau covered with Highveld grasslands.

tion of African pollen grains of the Department of Palynol-             model can be compared to a ternary diagram but allowing for
ogy and Climate Dynamics of the University of Göttingen,                more than three axes. We use a version of the unmixing algo-
the African Pollen Database collection and literature (e.g.             rithm programmed in MATLAB by David Heslop in 2008.
Bonnefille and Riollet, 1980; Scott, 1982; Köhler and Brück-            Taxa occurring in six or more samples (listed in Table S2
ner, 1982, 1989; Schüler and Hemp, 2016).                               in the Supplement) were used in the endmember modelling
   We assigned pollen taxa to groups such as riparian, wood-            (148 of 231 taxa in 220 samples). We selected a model with
land, forest, etc. (Table S1 in the Supplement) using infor-            four components explaining more than 95 % of the variance
mation given by Scott (1982), White (1983), Beentje (1994),             (r 2 = 0.953). Iteration was stopped at 1000× resulting in a
Kersberg (1996), Coates Palgrave (2002) and Vincens et                  convexity at termination of −1.6881. The significance level
al. (2007). Additionally, we carried out a multivariate anal-           at 99 % for taxa to score on the assemblages was 0.018.
ysis in the form of an endmember model unmixing proce-                      To study the correlations between different parameters, we
dure (Weltje, 1997), the statistics of which are specifically           used a linear regression model (least-square regression) on
designed for the treatment of percentage data. We regard the            linearly interpolated values (5 kyr steps) from 0 to 790 ka.
pollen percentages as a series of pollen assemblage mixtures,           Correlation coefficients are given in Table 1. For interpola-
whereby each modelled endmember may be interpreted as                   tion and testing the correlation, we used the package PAST
the representation of one or more biomes. This linear mixing            (Hammer et al., 2001).

Clim. Past, 15, 1083–1097, 2019                                                                     www.clim-past.net/15/1083/2019/
L. M. Dupont et al.: Effects of atmospheric CO2 variability                                                                            1087

Table 1. Correlation coefficients calculated with PAST (Hammer et al., 2001). Significant correlations are underlined (95 %) or bold and
underlined (99 %). Average chain length (ACL), ratio of concentrations of C31 / (C31 + C29 ) and stable carbon isotope composition of the
C31 n-alkane (δ 13 Cwax ) after Castañeda et al. (2016b). Cyperaceae and Poaceae pollen percentages (of total pollen and spores) after Dupont
et al. (2011b) and this study. ln(Fe/Ca) data are after Caley et al. (2018c).

                                                                  Ratio      δ 13 Cwax   Cyperaceae   Poaceae          XRF
                r2                           ACL      C31 / (C29 + C31 )           (‰)          (%)       (%)     ln(Fe/Ca)
                ACL                             1
                Ratio C31 / (C31 + C29 )    0.635                     1
                δ 13 Cwax                   0.079                0.180              1
                Cyperaceae (%)              0.027                0.140         0.142              1
                Poaceae (%)                 0.003                 0.016         0.003        0.165           1
                XRF ln(Fe/Ca)               0.016                 0.032        0.227         0.110       0.011             1

3     Result and discussion                                                ever, C4 sedges may make up to 60 % of the vegetation cover
                                                                           at 550 m. At higher altitudes the coverage of C4 sedges de-
3.1    Terrestrial input and provenance of the C4 plant wax                clines (Kotze and O’Connor, 2000).
                                                                              Cyperaceae pollen concentration (Fig. 3) and percentages
Pollen percentages of Cyperaceae (sedges) and Poaceae                      correlate with ln(Fe/Ca) and with δ 13 Cwax (Table 1, Fig. 2).
(grasses) are plotted in Fig. 2 together with the δ 13 Cwax of             The ratios of terrestrial iron over marine calcium can be in-
the C31 n-alkane and XRF-scanning data, ln(Fe/Ca), the nat-                terpreted as a measure for terrestrial input, which in this
ural logarithm of elemental ratios of iron over calcium. Com-              part of the ocean is mainly fluvial. Correlation between in-
paring the records of Cyperaceae and δ 13 Cwax reveals that                creased fluvial discharge and increased C4 vegetation as well
high relative amounts of C4 plant material co-varied with in-              as increased Cyperaceae pollen has been reported from sed-
creased representation of sedges. They also co-varied with                 iments off the Zambezi (Schefuß et al., 2011; Dupont and
higher terrestrial input indicated by ln(Fe/Ca) and increased              Kuhlmann, 2017). Moreover, a fingerprint of C4 sedges was
precipitation as suggested by deuterium of the C31 n-alkane                found in Lake Tanganyika (Ivory and Russel, 2016). As a
(Caley et al., 2018a). We substantiated the correlations for               consequence, material (leaf waxes and pollen) from the river-
the Brunhes Chron between pollen percentages, leaf waxes                   ine vegetation is probably better represented than that from
and elemental ratios in Table 1. Leaf wax data are after Cas-              dry and upland vegetation. These results corroborate the rein-
tañeda et al. (2016b) including average chain length (ACL)                 terpretation of the δ 13 Cwax record, in which the increased
of the C27 –C33 n-alkanes, the ratio of C31 / (C31 + C29 ) and             representation of C4 plants (n-alkanes enriched in 13 C) is
δ 13 Cwax . XRF ln(Fe/Ca) ratios are from Caley et al. (2018c).            instead attributed to stronger transport of material from the
Significant correlation is found between the leaf wax param-               upper Limpopo catchment and the extension of swamps con-
eters and Cyperaceae data but not between δ 13 Cwax (indica-               taining C4 sedges under more humid conditions (Caley et al.,
tive of C4 inputs) and Poaceae pollen percentages – although               2018a). Previously, Castañeda et al. (2016a) had interpreted
a correlation exists between Cyperaceae and Poaceae per-                   increased C4 inputs as reflecting increased aridity.
centages. While the sedge pollen percentages fluctuate be-                    Relatively low values of Cyperaceae pollen and Fe/Ca ra-
tween 10 % and 50 % (mostly > 20 %), the percentages of                    tios are found for most interglacials of the Brunhes Chron
grass pollen are always lower than 20 %. Such low grass                    (Figs. 2 and 3), which could be interpreted as an effect of sea-
pollen values have not been found adjacent C4 grass domi-                  level highstands. However, Caley et al. (2018a) demonstrated
nated biomes (mainly savannahs) on the western side of the                 that the fluvial discharge is not related to sea-level changes.
continent (Dupont, 2011). It is, therefore, likely that in sed-            From the bathymetry of Delagoa Bight, a strong influence of
iments of MD96-2048 the C4 component of the plant wax                      sea level is also not expected because the shelf is not broad
originated from C4 sedges rather than from C4 grasses.                     and the locality of core MD96-2048 is relatively remote on
   South Africa has 68 species of Cyperaceae (sedges) of                   the Limpopo cone in the centre of the clockwise flowing De-
which 28 use the C4 pathway (among the 10 Cyperus species,                 lagoa Bight lee eddy. The eddy transports terrestrial material
8 are C4 ) predominantly growing in the northern part of the               northeastwards before it is taken southwards (Fig. 1) (Mar-
country (Stock et al., 2004). They are an important con-                   tin, 1981) and likely has not changed direction during glacial
stituent of tropical swamps and riversides (Chapman et al.,                times. Thus, fluvial discharge was probably low during inter-
2001). An inventory of six modern wetlands between 500 and                 glacials (among other periods), which might be the combined
1900 m in KwaZulu-Natal shows that C4 grasses dominate                     result of more evapotranspiration and less precipitation. De-
the dry surroundings of the wetlands at all altitudes (Kotze               spite drier conditions, the representation of woodland and dry
and O’Connor, 2000). In the wet parts of the wetlands, how-

www.clim-past.net/15/1083/2019/                                                                       Clim. Past, 15, 1083–1097, 2019
1088 L. M. Dupont et al.: Effects of atmospheric CO2 variability
Figure 2. Indicators of C4 vegetation and terrestrial input. (a) Elemental Fe/Ca ratios (Caley et al., 2018c); less negative values indicate
relatively wetter conditions. (b) δ 13 Cwax of the n-alkane C31 (Castañeda et al., 2016b; Caley et al., 2018e); less negative values of around
−24 ‰ indicate more C4 inputs while more negative values of around −28 ‰ indicate more C3 inputs. (c) Cyperaceae (sedges) pollen
percentages (Dupont et al., 2011b, this study). (d) Poaceae (grass) pollen percentages (Dupont et al., 2011b, this study). Shaded areas denote
95 % confidence intervals after Maher Jr. (1972). Stars denote corresponding maxima in Cyperaceae pollen percentages and the stable carbon
isotopes indicating C4 vegetation. VPDB: Vienna Pee Dee Belemnite. Note the scale break.
forest is relatively high during the interglacial periods (Fig. 3; sen. We used the scores of the different pollen taxa on the
see also next section). endmember assemblages for our interpretation of the end-
members (list of taxa and scores in Tables S1 and S2 in
3.2 Endmembers representing vegetation on land the Supplement). This interpretation is summarized in Ta-
ble 2. To distinguish between the previous and current anal-
Palynological results have been published for the past yses (which show strong similarities), we have given new
350 kyr (Dupont et al., 2011a) providing a detailed vegeta- names to the endmember assemblages reflecting our interpre-
tion record for the past three climate cycles. Pollen and spore tation: E-heathland, E-Mountain-Forest, E-Shrubland and E-
assemblages could be characterized initially by three end- Woodland. A selection of pollen percentage curves are plot-
members via endmember modelling (EM1, EM2, EM3). The ted together with each endmember’s fractional abundance in
assemblage of EM1 was dominated by Podocarpus (yellow Figs. S2–S5 in the Supplement.
wood) pollen percentages being more abundant during the
non-interglacial parts of MIS 5, 7 and 9. EM2 was character- E-Heathland. Of the four endmember assemblages
ized by pollen percentages of Cyperaceae (sedges), Ericaceae (Fig. 3), one endmember had a counterpart in EM2
(heather) and other plants of open vegetation and abundant (Dupont et al., 2011a) of the previous analysis. Not only
during full glacial stages. EM3 constituted of pollen from composition but also the fractional abundances, which
woodland, forest and coastal vegetation and was interpreted were high during glacial stages, are very much alike.
to represent a mix of several vegetation complexes. We name this endmember “E-Heathland”, which is
We repeated the endmember modelling for the extended dominated by Cyperaceae (sedges) pollen percentages,
record covering the entire Brunhes Chron and the two early followed by Ericaceae (heather) pollen and hornwort
Pleistocene windows. The analysis of the extended dataset (Anthocerotaceae) spores (Table 2). Also Lycopodium
gave compatible results with the previous analysis (Dupont et (clubmoss) spore, Restionaceae and Stoebe-type pollen
al., 2011a). The main difference is that the longer sequence percentages score highest on this endmember. The E-
allowed to distinguish two assemblages of interglacial veg- Heathland assemblage represents a fynbos-like open
etation. In terms of analysis, the cumulative increase of ex- vegetation growing during full glacials. Other pollen
planatory power lessened after four (instead of three) end- records from SE Africa also indicate an open ericaceous
members, and a model with four endmembers was cho- vegetation with sedges and Restionaceae during glacial
Clim. Past, 15, 1083–1097, 2019 www.clim-past.net/15/1083/2019/L. M. Dupont et al.: Effects of atmospheric CO2 variability 1089
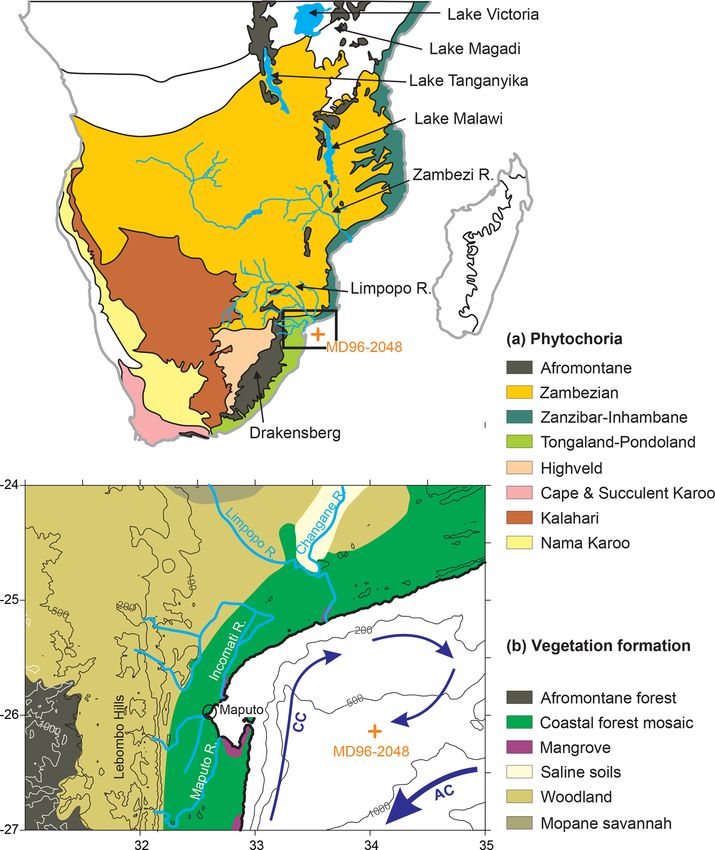
Figure 3. Summary of results of MD96-2048. (a) Stable oxygen isotopes of benthic foraminifers of core MD96-2048 (Caley et al., 2018b).
(b) Global stack of stable oxygen isotopes of benthic foraminifers, LR04 (Liesiecki and Raymo, 2005). (c) Elemental ratios ln(Fe/Ca).
(d) Cyperaceae pollen concentration per mililitre (shading denote 95 % confidence intervals after Maher Jr., 1981). (e) Pollen summary
diagram (woodland and forest taxa are listed in Table S1 in the Supplement). (f) Fractional abundance of endmembers E-Heathland, E-
Mountain-Forest, E-Woodland and E-Shrubland. (g) Pollen and spore count used to calculate percentages. On top interglacial peaks after
PAGES (2016) are indicated. VPDB: Vienna Pee Dee Belemnite.
times (Scott, 1999; Dupont and Kuhlmann, 2017). The E-Shrubland. The remaining endmember assemblages
record of MD96-2048 testifies that this type of open have no direct counterpart in the previous analysis, al-
glacial vegetation has regularly occurred for at least though summed together the pattern of fractional abun-
2 million years. dance is similar to that of EM3 (Dupont et al., 2011a).
One endmember groups together 44 pollen taxa, mostly
E-Mountain-Forest. Like the endmember EM1 (Dupont from coastal and dune vegetation, which we name
et al., 2011a) of the previous analysis, one endmem- “E-Shrubland”. It includes pollen of Asteraceae and
ber is dominated by Podocarpus (yellow wood) pollen Poaceae (grasses). The latter are not very specific as
percentages (Table 2). The assemblage is enriched by grass pollen values score almost as high on other end-
pollen of Celtis (hackberries) and Olea (olive trees) ac- member assemblages (E-Heathland and E-Woodland).
companied by undifferentiated fern spores. The inter- Several taxa scoring on this endmember are known
pretation as an assemblage representing mountain for- from coastal or halophytic settings such as Gazania
est is rather straightforward, and we name the assem- type, Amaranthaceae, Tribulus, Acanthaceae and Eu-
blage “E-Mountain-Forest”. The fractional abundance phorbia type. Arboreal taxa in this assemblage are
of the E-Mountain-Forest is also high in glacials of Dombeya, Acacia and Meliaceae/Sapotaceae (Table 2).
the Brunhes Chron but not during the extreme glacial The most typical taxa are the Buxus species. We distin-
stages, when temperatures and pCO2 are particularly guished three types of Buxus pollen: B. macowanii type,
low (Fig. 3). It is low in the early Pleistocene parts of B. hildebrandtii type and B. cf. madagascarica (Köhler
the record.
www.clim-past.net/15/1083/2019/ Clim. Past, 15, 1083–1097, 20191090 L. M. Dupont et al.: Effects of atmospheric CO2 variability
and Brückner, 1982, 1989). B. madagascarica grows on Table 2. Interpretation of the endmembers.
Madagascar and its pollen is only found sporadically,
while the other two species inhabit bushland and forest Endmember Main pollen taxa
on coastal dunes of the east African mainland. B. hilde- E-Heathland Cyperaceae, Ericaceae, Phaeoceros,
brandtii nowadays is found in Somalia and Ethiopia, Restionaceae, Stoebe type, Anthoceros,
and B. macowanii is native in South Africa. The record Typha, Lycopodium, Restionaceae
of M96-2048 indicates that these Buxus species were
more common in the early Pleistocene than during the E-Mountain-Forest Podocarpus, Celtis, Olea
Brunhes Chron (Fig. 3). E-Shrubland Poaceae, Asteroideae, Buxus, Ama-
ranthaceae, Euphorbia, Meliaceae–
E-Woodland. The last endmember, which we name “E- Sapotaceae, Acacia, Riccia type,
Woodland”, groups together 39 pollen taxa from for- Tribulus, Acanthaceae pp., Asteraceae
est and woodland species with maximum values of less Vernoniae, Hypoestes–Dicliptera type,
than 5 % or 2 % of the total of pollen and spores. To Gazania type, Dombeya
this assemblage belong Pseudolachnostylis, Dodonaea
E-Woodland Alchornea, Spirostachys africana,
viscosa and Manilkara, which are woodland trees. Pro- Pteridium type, Polypodiaceae, Myr-
tea (sugarbush) and Myrsine africana (Cape myrtle) sine africana, Cassia type, Rhi-
grow more upland, and Alchornea is a pioneer forest zophoraceae, Aizoaceae, Combretaceae
tree often growing along rivers. Others include wide- pp., Manilkara, Burkea africana,
range woodland taxa such as Combretaceae species. Brachystegia, Dodonaea viscosa, Pseu-
The occurrence of pollen of Brachystegia (Miombo dolachnostylis, Hymenocardia, Aloe,
tree), Burkea africana, Spirostachys africana and Hy- Rhamnaceae pp., Protea, Parinari
menocardia in this assemblage is indicative of Miombo
dry forest and woodland. The assemblage additionally
includes Rhizophoraceae pollen from the coastal man-
grove forest (Table 2). The fractional abundance of the et al., 2016a) somewhat paralleled the conditions around
E-Woodland assemblage is low during the early Pleis- Lake Malawi (Johnson et al., 2016). However, around Lake
tocene, increased during the interglacials prior to the Malawi, forested phases of either mountain forest, seasonal
MBE and had maximum values during Interglacials 9e, forest or Miombo woodland alternating with savannahs oc-
5e and 1 (Figs. 3, 4). These interglacials also exhib- curred during both glacial and interglacial stages (Ivory et
ited maximum percentages of arboreal pollen excluding al., 2018). Also in contrast to the Lake Malawi record, the
Podocarpus. MD96-2048 Poaceae pollen percentages fluctuated little and
In summary, the endmember analysis indicates a very remained relatively low (less than 20 %), indicating that sa-
stable open ericaceous vegetation with partially wet ele- vannahs were of less importance in the Limpopo catchment
ments such as sedges and Restionaceae characterizing the area and the coastal region of southern Mozambique.
landscape of full glacials (when global temperatures and The trend to increased woodland in SE Africa after the
pCO2 were lowest). During the less extreme parts of the MBE, noted at both Lake Malawi and in the Limpopo River
glacials, mountain Podocarpus forest was extensive as in catchment (Johnson et al., 2016; Caley et al., 2018a, this
most mountains of Africa (Dupont, 2011; Ivory et al., 2018). study), contrasts with the trend around Lake Magadi at the
On the other hand, interglacials were characterized by coastal Equator. At Lake Magadi, a trend to less forest marks the
shrubs. In the course of the Brunhes, the woody component, Mid-Brunhes Transition (Owen et al., 2018). Antiphase be-
which was relatively weak before the MBE, became more haviour of SE African climate with that of west and east
and more important, reflecting the same long-term trend Africa emphasizes the importance of the average position of
found in the leaf wax records (Castañeda et al., 2016a). It the tropical rain belt shifting southwards during globally cold
is likely that the Miombo dry forest and woodland migrated periods as has been inferred from Holocene to last glacial
into the region in the successive interglacials of the Brunhes records of Lake Malawi (Johnson et al., 2002; Scholz et al.,
Chron. Particularly during Interglacials 9e and 1, the area 2011). Our results confirm this relationship existed over the
might have been more forested than during the older inter- entire Brunhes Chron.
glacials of the Brunhes Chron. The Lake Malawi pollen records and Lake Magadi pollen
records in Kenya (Johnson et al., 2016; Owen et al., 2018)
do not show much of a glacial–interglacial rhythm and are
3.3 Long-term trends in vegetation and climate of east
dominated by the precession variability in tropical rainfall
Africa
(e.g. Clement et al., 2004). Obviously, in the tropical climate
The region of the Limpopo River becoming more and more of the Southern Hemisphere north of ∼ 15◦ S, the hydrolog-
wooded in the course of successive interglacials (Castañeda ical regime had more effect on the vegetation than changes
Clim. Past, 15, 1083–1097, 2019 www.clim-past.net/15/1083/2019/L. M. Dupont et al.: Effects of atmospheric CO2 variability 1091
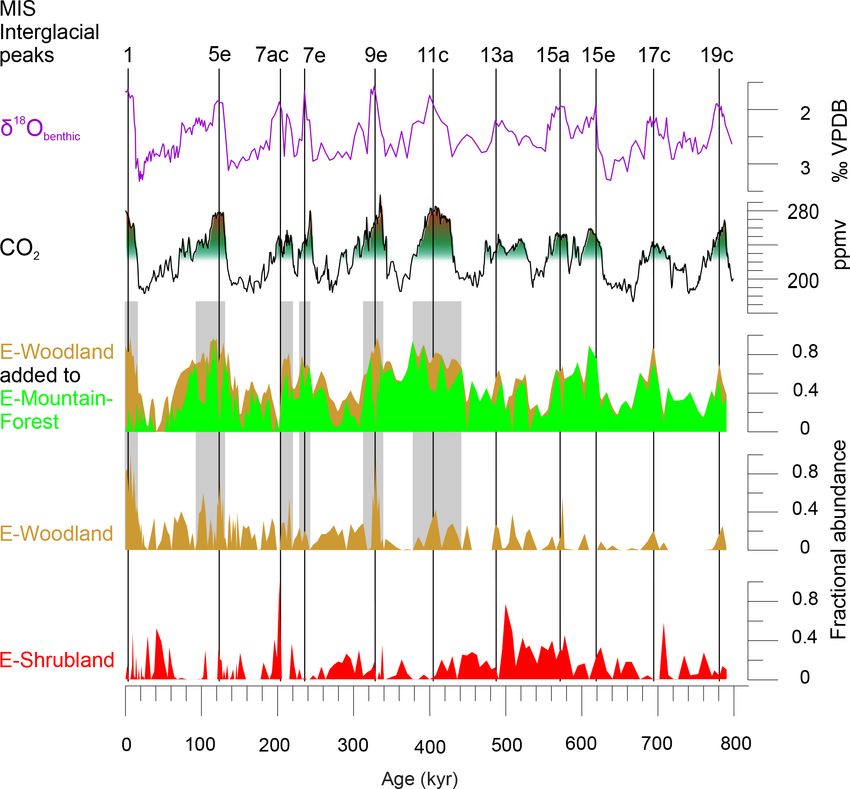
Figure 4. Comparing pollen assemblages E-Mountain-Forest, E-Woodland and E-Shrubland with atmospheric CO2 (Bereiter et al., 2015;
PAGES, 2016). On top are denoted interglacial peaks of the past 800 kyr (PAGES, 2016) and stable oxygen isotopes of benthic foraminifera
(δ 18 Obenthic ) of MD96-2048 (Caley et al., 2018b). CO2 levels of 220 and 270 ppmv are indicated with green–red shading. Grey shading
highlights periods with maximum atmospheric CO2 and maximum values of the sum of E-Woodland and E-Mountain-Forest. VPDB: Vienna
Pee Dee Belemnite.
in temperature, while further south the impact of glacial– during the post-MBE interglacials might have favoured tree
interglacial variability on the vegetation increased. growth, as higher pCO2 levels would have allowed decreased
stomatal conductivity and thus relieved drought stress (Jolly
and Haxeltine, 1997). Woodlands would have expanded at
3.4 Effects of atmospheric pCO2 the cost of mountain forest during MIS 11c, 9e, 5e and 1, and
While the hydroclimate of the region shows precession vari- to a lesser extent during 7e and 7c, when temperatures and
ability (Caley et al., 2018a), the vegetation shows a glacial– pCO2 were high (Fig. 4). It might be only after interglacial
interglacial rhythm (Fig. S1 in the Supplement), indicating pCO2 levels rose over ∼ 270 ppmv that Miombo woodland
that besides hydrology, temperature and/or atmospheric CO2 could fully establish in the area during the warm and rela-
levels were important drivers of the vegetation development. tively dry post-MBE interglacials.
Combining the results of the pollen assemblages with sta- The glacial stages showed the expansion of either moun-
ble carbon isotopes and elemental information indicates that tain forest or heathland. The record indicates extension of
during interglacials the region of SE Africa (northern South mountain forests in SE Africa during those parts of the
Africa, Zimbabwe and southern Mozambique) was less hu- glacial stages with low temperatures and atmospheric pCO2
mid. This is in accordance with other palaeoclimate estimates exceeding ∼ 220 ppmv (Fig. 5). If low temperatures were
for the region (see reviews by Simon et al., 2015; Singarayer the only driver of the extension of mountain forests, further
and Burrough, 2015). spread into the lowlands during the coldest glacial phases
The interglacial woodlands (represented by E-Woodland, should be expected. Instead, when pCO2 dropped below
Fig. 4) would probably have grown under warmer and drier ∼ 220 ppmv during those colder glacial periods, mountain
conditions than the glacial mountain forest (represented by forest declined, in particular during MIS 18, 16, 14, 8, 6 and
E-Mountain-Forest). The increase in maximum pCO2 levels 2. A picture emerges of cool glacial stages in SE Africa in
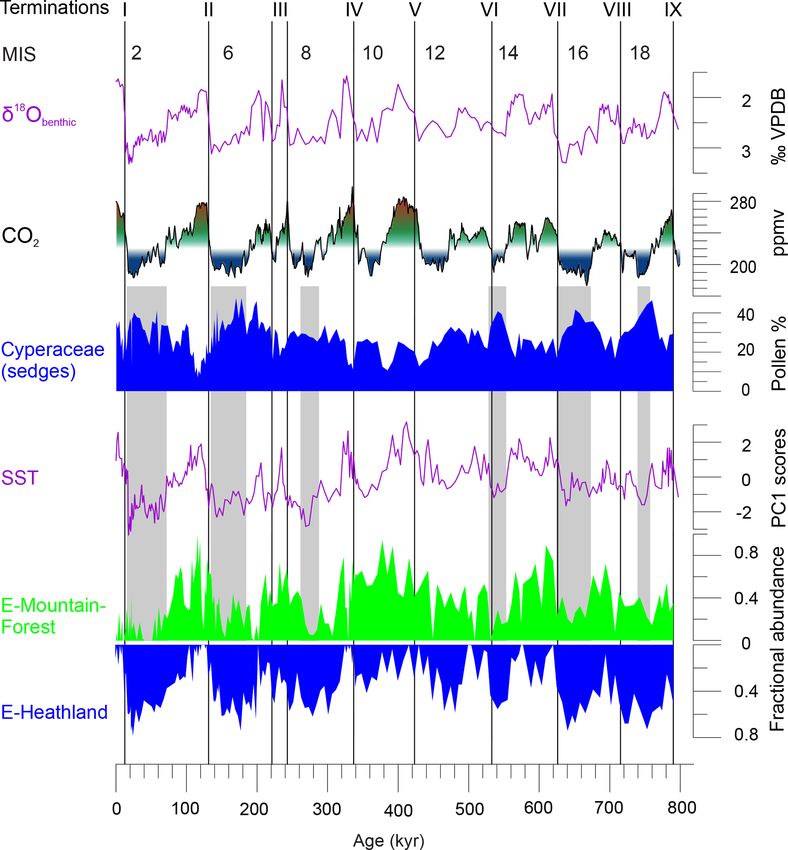
www.clim-past.net/15/1083/2019/ Clim. Past, 15, 1083–1097, 20191092 L. M. Dupont et al.: Effects of atmospheric CO2 variability Figure 5. Comparing Cyperaceae pollen percentages and fractional abundances of the glacial pollen assemblages E-Mountain-Forest and E-Heathland with atmospheric CO2 (Bereiter et al., 2015; PAGES, 2016) and sea surface temperatures of the southeastern Indian Ocean (SST PC1 scores of MD96-2048) (Caley et al., 2018d). On top are denoted terminations I through to IX of the past nine glaciations, even-numbered marine isotope stages (MISs), and stable oxygen isotopes of benthic foraminifera (δ 18 Obenthic ) of MD96-2048 (Caley et al., 2018b). CO2 levels of 220 and 270 ppmv are indicated with blue–green–red shading. Grey shading highlights periods with minimum atmospheric CO2 , minimum values of E-Mountain-Forest and maximum values of E-Heathland and Cyperaceae pollen. VPDB: Vienna Pee Dee Belemnite. which tree cover broke down when atmospheric pCO2 be- rate, the lack of trees in the southeast African mountains came too low. Additionally, mountain forests were important during glacial extremes is unlikely the result of drought, during Interglacials 19c, 17c, 15e, 15a, 13a and 7e, in which because our record indicates that climate conditions in SE pCO2 and Antarctic temperatures were subdued. Africa were less dry during glacials than during interglacials With an inverse modelling technique, Wu et al. (2007) es- (the post-MBE interglacials in particular). Instead, C4 sedges timated the climate inputs for the vegetation model BIOME4 being an important constituent of the ericaceous fynbos- using as information the biome scores of pollen records from like vegetation increased during glacials when atmospheric equatorial east African mountains. Wu et al. (2007) found pCO2 and temperatures were low (Fig. 5). However, low that lowering of the tree line under glacial conditions (1– temperatures are not particularly favourable for C4 sedges 3 ◦ C lower temperatures, less precipitation, 200 ppmv pCO2 ) as indicated by the altitudinal distribution of C4 sedges in depended hardly on temperature but primarily on increased modern wetlands of KwaZulu-Natal (Kotze and O’Connor, aridity and somewhat on lower pCO2 , whereby lower pCO2 2000). We presume, therefore, that the extension of C4 amplified the effects of water limitation. However, Izumi and sedges during the colder phases of the glacials is the result Lézine (2016) found contrasting results using pollen records of low atmospheric CO2 concentrations rather than of low of mountain sites on both sides of the Congo basin. At any temperatures. Clim. Past, 15, 1083–1097, 2019 www.clim-past.net/15/1083/2019/
L. M. Dupont et al.: Effects of atmospheric CO2 variability                                                                1093

   Pollen records of ericaceous vegetation suggest an exten-       rus species even occur in the wettest parts of lower-altitude
sive open vegetation existing in the east African mountains        wetlands in KwaZulu-Natal (Kotze and O’Conner, 2000).
(e.g. Coetzee, 1967; Bonnefille and Riollet, 1988; Marchant
et al., 1997; Debusk, 1998; Bonnefille and Chalié, 2000)
and in SE Africa and Madagascar (e.g. Botha et al., 1992;          4   Conclusions
Scott, 1999; Gasse and Van Campo, 2001; Scott and Tack-
eray, 1987) during the last glacial. In our study, ericaceous      Palynology in combination with sediment chemistry and car-
fynbos-like vegetation (E-Heathland) was found for those           bon isotope analysis of leaf waxes carried out on the marine
parts of the glacials having lower (less than ∼ 220 ppmv) at-      sediments of MD96-2048 retrieved from the Limpopo River
mospheric pCO2 (Fig. 5). Exceptions were found for MIS             cone in the Delagoa Bight (SE Africa) allowed a detailed
12 and 14 when the difference of pCO2 with that of the             reconstruction of the biome developments over the Brunhes
preceding stage was small (Bereiter et al., 2015). Dupont et       Chron and comparison with earlier Pleistocene vegetation of
al. (2011a) argued that increase of C4 vegetation as the result    SE Africa.
of low pCO2 was unlikely because no extension of grasses              Using endmember modelling, we could distinguish four
was recorded. However, this argument is flawed if sedges           pollen assemblages: E-Heathland, E-Mountain-Forest, E-
dominantly constituted the C4 vegetation in the area. We also      Shrubland and E-Woodland. The open sedge-rich and erica-
note that in many parts of South Africa, no substantial in-        ceous vegetation represented by E-Heathland occurred dur-
crease of C4 grasses occurred but that many sites suggest an       ing those parts of the glacials with lower temperatures and
expansion of C3 grasses during the Last Glacial Maximum            atmospheric pCO2 . Podocarpus-rich mountain forest repre-
(Scott, 2002).                                                     sented by E-Mountain-Forest extended during the less ex-
   As climate was wetter during most of the glacials in this       treme parts of the glacials. E-Shrubland represents a shrub-
part of the world, the question arises about the climatic impli-   like vegetation with coastal elements and Buxus species
cation of the ericaceous fynbos-like vegetation (represented       and mainly occurred during the earlier Pleistocene (be-
by E-Heathland, Fig. 5) extending during full glacials over        fore 1 Ma). E-Woodland represents interglacial woodlands,
the mountains of South Africa – and correlating with the           Miombo woodland in particular, becoming more and more
SST record (see also the correlation between SST and EM2           important in the successive interglacial stages of the Brunhes
in Dupont et al., 2011a). The correlation with SST, however,       Chron and dominated the post-MBE interglacials.
is problematic. Singarayer and Burrough (2015) argued that            Our results indicate the influence of atmospheric pCO2
the control of the Indian Ocean SSTs on the precipitation of       fluctuations on the shaping of the biomes in SE Africa dur-
South Africa shifted from a positive correlation during the        ing the Brunhes Chron. We argue that (1) the precessional
interglacial to a negative correlation during the Last Glacial     rhythms of river discharge compared to the interglacial–
Maximum. They invoked the effects of the exposure of the           glacial biome variability indicate that hydroclimate cannot
Sunda Shelf (Indonesia) and Sahul Shelf (Australia) on the         be the only driver of vegetation change. The other options
Walker circulation causing a wetter region over the west-          of forcing mechanisms on interglacial–glacial timescales
ern Indian Ocean but also weaker easterly winds to trans-          are temperature and pCO2 . (2) Because of the correlation
port moisture inland. To question the link between SST and         between Cyperaceae pollen percentages and δ 13 Cwax and
precipitation in SE Africa even further, Caley et al. (2018a)      the lack of correlation between Poaceae percentages and
found that the precession signature in the river discharge         δ 13 Cwax in combination with the relatively low grass pollen
proxy (ln(Fe/Ca); see also Fig. S1 in the Supplement) was          percentages, we deduce that the C4 plant imprint mainly de-
absent in the SST record from the same core. SE Africa             rives from the sedges. (3) The expansion of C4 sedges during
would have been more humid during glacials when the tem-           the colder periods of the glacials is unlikely to result from
perature difference between land and sea increased.                lower temperatures. Thus, during the colder phases of the
   The increase in C4 vegetation during relative cool and hu-      glacials, low atmospheric pCO2 might have favoured the ex-
mid climate would be in conflict with the idea that C4 plants      pansion of C4 sedges. (4) The expansion of mountain forest
are more competitive in hot and dry climates (Ehleringer et        during the glacial periods with moderate temperatures and
al., 1997; Sage, 2004). However, this idea is mainly based         moderate pCO2 , and the lack of extension into the lowlands
on the ecology of grasses and the development of savan-            of mountain forest during the colder periods, suggests that
nahs, while the C4 vegetation expansion in SE Africa dur-          low pCO2 became restrictive to the forest. Mountain forests
ing cool and humid phases seems to be driven by sedges. A          could thrive during glacials as long as pCO2 levels exceeded
survey of the distribution of C4 sedges in South Africa re-        ∼ 220 ppmv. (5) Based on the elemental composition as a
vealed that those Cyperaceae do not have the same tempera-         proxy for river discharge [ln(Fe/Ca)], we recognize the post-
ture constraints as C4 grass species (Stock et al., 2004). More    MBE interglacials as the drier intervals of the sequence. Nev-
important, South African C4 sedges appear to have evolved          ertheless, woodland extended during those periods, which we
under wetland conditions rather than under aridity. C4 Cype-       attribute to increased temperatures and pCO2 . Atmospheric
                                                                   pCO2 levels over 250 ppmv might have been a prerequisite

www.clim-past.net/15/1083/2019/                                                              Clim. Past, 15, 1083–1097, 2019
1094 L. M. Dupont et al.: Effects of atmospheric CO2 variability
for the expansion of the Miombo woodlands into SE Africa References
during the post-MBE interglacials.
The vegetation record of the Limpopo catchment area
shows a greater impact of glacial–interglacial variability,
Barth, A. M., Clark, P. U., Bill, N. S., He, F., and Pisias, N. G.: Cli-
mainly driven by CO2 fluctuations, and less influence of hy-
mate evolution across the Mid-Brunhes Transition, Clim. Past,
droclimate compared to the more equatorial records of Lake 14, 2071–2087, https://doi.org/10.5194/cp-14-2071-2018, 2018.
Malawi and Lake Magadi. The long-term trend of increased Beentje, H.: Kenya trees, shrubs and lianas, National Museum of
woodiness in the course of the Brunhes Chron paralleled that Kenya, Nairobi, Kenya, 722 pp., 1994.
of Lake Malawi but contrasted Lake Magadi, suggesting a Bereiter, B., Eggleston, S., Schmitt, J., Nehrbass-Ahles, C.,
long-term southward shift in the average position of the trop- Stocker, T. F., Fischer, H., Kipfstuhl, S., and Chappelaz, J.:
ical rain belt. Revision of the EPICA Dome C CO2 record from 800 to
600 kyr before present, Geophys. Res. Lett., 42, 542–549,
https://doi.org/10.1002/2014GL061957, 2015.
Data availability. Data are archived on PANGAEA; Bonnefille, R. and Chalié, F.: Pollen-inferred precipita-
https://doi.org/10.1594/PANGAEA.771285 (Dupont et al., tion time-series from equatorial mountains, Africa, the
2011b) and https://doi.org/10.1594/PANGAEA.897922 (Dupont et last 40 kyr BP, Global Planet. Change, 26, 25–50,
al., 2019). https://doi.org/10.1016/S0921-8181(00)00032-1, 2000.
Bonnefille, R. and Riollet, G.: Pollens des savanes d’Afrique orien-
tale, Éditions du Centre National de la Recherche Scientifique,
Supplement. The supplement related to this article is available Paris, France, 140 pp., 1980.
online at: https://doi.org/10.5194/cp-15-1083-2019-supplement. Bonnefille, R. and Riollet, G.: The Kashiru pollen se-
quence (Burundi). Palaeoclimatic implications for the last
40 000 yr BP in tropical Africa, Quaternary Res., 30, 19–35,
https://doi.org/10.1016/0033-5894(88)90085-3, 1988.
Author contributions. LMD carried out the palynological anal-
Botha, G. A., Scott, L., Vogel, J. C., and Von Brunn, V.: Palaeosols
ysis and conceptualised and wrote the paper, TC carried out the
and palaeoenvironments during the Late Pleistocene Hypother-
sedimentology and stratigraphy and contributed to the discussion,
mal in northern Natal, S. Afr. J. Sci., 88, 508–512, 1992.
ISC conducted the stable isotope analysis on plant waxes and con-
Bouttes, N., Swingedouw, D., Roche, D. M., Sanchez-Goni, M.
tributed to the discussion.
F., and Crosta, X.: Response of the carbon cycle in an inter-
mediate complexity model to the different climate configura-
tions of the last nine interglacials, Clim. Past, 14, 239–253,
Competing interests. The authors declare that they have no con- https://doi.org/10.5194/cp-14-239-2018, 2018.
flict of interest. Caley, T., Kim, J.-H., Malaizé, B., Giraudeau, J., Laepple, T.,
Caillon, N., Charlier, K., Rebaubier, H., Rossignol, L., Cas-
tañeda, I. S., Schouten, S., and Sinninghe Damsté, J. S.: High-
Acknowledgements. David Heslop is thanked for providing the latitude obliquity as a dominant forcing in the Agulhas current
endmember model in a MATLAB application. We thank two anony- system, Clim. Past, 7, 1285–1296, https://doi.org/10.5194/cp-7-
mous reviewers for their constructive comments that strongly im- 1285-2011, 2011.
proved the paper. Caley, T., Extier, T., Collins, J. A., Schefuß, E., Dupont, L., Malaizé,
B., Rossignol, L., Souron, A., Mcclymont, E. L., Jiminez-Espejo,
F. J., García-Comas, C., Eynaud, F., Martinez, P., Roche, D. M.,
Financial support. This project was funded through DFG – Jorry, S. J., Charlier, K., Wary, M., Gouvers, P.-Y., Billy, I., and
Research Center/Cluster of Excellence “The Ocean in the Earth Giraudeau, J.: A two-million-year-long hydroclimatic context for
System”. Thibaut Caley is supported by CNRS-INSU. Funding hominin evolution in southeastern Africa, Nature, 560, 76–79,
from LEFE IMAGO CNRS INSU project SeaSalt is acknowledged. https://doi.org/10.1038/s41586-018-0309-6, 2018a.
Caley, T., Extier, T., Collins, J. A., Schefuß, E., Dupont, L.
The article processing charges for this open-access publica- M., Malaizé, B., Rossignol, L., Souron, A., McClymont,
tion were covered by the University of Bremen. E. L., Jiménez-Espejo, F. J., García-Comas, C., Eynaud, F.,
Martinez, P., Roche, D. M., Jorry, S., Charlier, K., Wary,
M., Gourves, P.-I., Billy, I., and Giraudeau, J.: Planulina
Review statement. This paper was edited by Nathalie Com- wuellerstorfi δ 18 O analyses of sediment core MD96-2048,
bourieu Nebout and reviewed by two anonymous referees. https://doi.org/10.1594/PANGAEA.895364, PANGAEA, 2018b.
Caley, T., Extier, T., Collins, J. A., Schefuß, E., Dupont, L. M.,
Malaizé, B., Rossignol, L., Souron, A., McClymont, E. L.,
Jiménez-Espejo, F. J., García-Comas, C., Eynaud, F., Martinez,
P., Roche, D. M., Jorry, S., Charlier, K., Wary, M., Gourves, P.-I.,
Billy, I., and Giraudeau, J.: XRF ln(Fe/Ca) record of sediment
core MD96-2048, https://doi.org/10.1594/PANGAEA.895361,
PANGAEA, 2018c.
Clim. Past, 15, 1083–1097, 2019 www.clim-past.net/15/1083/2019/L. M. Dupont et al.: Effects of atmospheric CO2 variability 1095
Caley, T., Extier, T., Collins, J. A., Schefuß, E., Dupont, L. Dupont, L. M., Caley, T., Kim, J.-H., Castañeda, I., Malaizé, B.,
M., Malaizé, B., Rossignol, L., Souron, A., McClymont, and Giraudeau, J.: Glacial-interglacial vegetation dynamics in
E. L., Jiménez-Espejo, F. J., García-Comas, C., Eynaud, South Eastern Africa coupled to sea surface temperature vari-
F., Martinez, P., Roche, D. M., Jorry, S., Charlier, K., ations in the Western Indian Ocean, Clim. Past, 7, 1209–1224,
Wary, M., Gourves, P.-I., Billy, I., and Giraudeau, J.: SST https://doi.org/10.5194/cp-7-1209-2011, 2011a.
first principal component of sediment core MD96-2048, Dupont, L. M., Caley, T., Kim, J.-H., Castañeda, I. S.,
https://doi.org/10.1594/PANGAEA.895362, PANGAEA, 2018d. Malaizé, B., and Giraudeau, J.: Pollen distribution of sed-
Caley, T., Extier, T., Collins, J. A., Schefuß, E., Dupont, L. M., iment core MD96-2048 from the Western Indian Ocean,
Malaizé, B., Rossignol, L., Souron, A., McClymont, E. L., https://doi.org/10.1594/PANGAEA.771285, PANGAEA, 2011b.
Jiménez-Espejo, F. J., García-Comas, C., Eynaud, F., Martinez, Dupont, L. M., Caley, T., and Castañeda, I. S.: Pollen
P., Roche, D. M., Jorry, S., Charlier, K., Wary, M., Gourves, P.-I., and Spores of sediment core MD96-2048 Pleistocene,
Billy, I., and Giraudeau, J.: Stable carbon isotopes of sediment https://doi.org/10.1594/PANGAEA.897922, PANGEA, 2019
core MD96-2048, https://doi.org/10.1594/PANGAEA.895357, Ehleringer, J. R., Cerling, T. E., and Helliker, B. R.: C4 photosyn-
PANGAEA, 2018e. thesis, atmospheric CO2 , and climate, Oecologia, 112, 285–299,
Castañeda, I. S., Caley, T., Dupont, L., Kim, J.-H., Malaizé, B., https://doi.org/10.1007/s004420050311, 1997.
and Sschouten, S: Middle to Late Pleistocene vegetation and cli- Foley, J., Kutzbach, J. E., Coe, M. T., and Levis, S.: Feedbacks be-
mate change insubtropical southern East Africa, Earth Planet. Sc. tween climate and boreal forests during the Holocene epoch, Na-
Lett., 450, 306–316, https://doi.org/10.1016/j.epsl.2016.06.049, ture, 371, 52–54, https://doi.org/10.1038/371052a0, 1994.
2016a. Ganopolski, A. and Calov, R.: The role of orbital forcing, carbon
Castañeda, I. S., Caley, T., Dupont, L. M., Kim, J.-H., Malaizé, B., dioxide and regolith in 100 kyr glacial cycles, Clim. Past, 7,
and Schouten, S.: Plant leaf wax (n-alkane) data from sediment 1415–1425, https://doi.org/10.5194/cp-7-1415-2011, 2011.
core MD96-2048, https://doi.org/10.1594/PANGAEA.863919, Gasse, F. and Van Campo, E.: Late Quaternary environmen-
PANGAEA, 2016b. tal changes from a pollen and diatom record in the southern
Chapman, L. J., Balirwa, J., Bugenyi, F. W. B., Chapman, C., and tropics (Lake Tritrivakely, Madagascar), Palaeogeogr. Palaeocl.,
Crisman, T. L.: Wetlands of East Africa: biodiversity, exploita- 167, 287–308, https://doi.org/10.1016/S0031-0182(00)00242-X,
tion, and policy perspectives, edited by: Gopal, B., Junk, W. J., 2001.
and Davis, J. A., Biodiversity in Wetlands: Assessment, Funk- Hammer, Ø., Harper, D. A. T., and Ryan, P. D.: PAST: Paleontologi-
tion and Conservation, Backhuys Publishers, Leiden, the Nether- cal Statistics Software Package for Education and Data Analysis,
lands, 2, 101–131, 2001. Palaeontol. Electron., 4, 1–9, 2001.
Clement, A. C., Hall, A., and Brocoli, A. J.: The importance of pre- Ivory, S. J. and Russell, J.: Climate, herbivory, and fire controls on
cessional signals in the tropical climate, Clim. Dynam., 22, 327– tropical African forest for the last 60 ka, Quaternary Sci. Rev.,
341, https://doi.org/10.1007/s00382-003-0375-8, 2004. 148, 101–114, https://doi.org/10.1016/j.quascirev.2016.07.015,
Coates Palgrave, K.: Trees of Southern Africa, 3rd edition, revised 2016.
and updated, Struik, Cape Town, South Africa, 1212 pp., 2002. Ivory, S. J., Lézine, A.-M., Vincens, A., and Cohen, A. S.:
Coetzee, J. A.: Pollen analytical studies in east and southern Africa, Waxing and waning of forests: Late Quaternary biogeogra-
Palaeoecol. Afr., 3, 146 pp., 1967. phy of southeast Africa, Glob. Change Biol., 2018, 1–13,
Cowling, S. A. and Sykes, M.: Physiological significance of low https://doi.org/10.1111/gcb.14150, 2018.
atmospheric CO2 for plant-climate interactions, Quaternary Res., Izumi, K. and Lézine, A.-M.: Pollen-based biome reconstructions
52, 237–242, https://doi.org/10.1006/qres.1999.2065, 1999. over the past 18 000 years and atmospheric CO2 impacts on veg-
Debusk, G. H.: A 37 500-year pollen record from Lake Malawi etation in equatorial mountains of Africa, Quaternary Sci. Rev.,
and implications for the biogeography of afromontane forests, 152, 93–103, https://doi.org/10.1016/j.quascirev.2016.09.023,
J. Biogeogr., 25, 479–500, https://doi.org/10.1046/j.1365- 2016.
2699.1998.2530479.x, 1998. Jansen, J. H. F., Kuijpers, A., and Troelstra, S. R.: A mid-
Dupont, L. M.: Orbital scale vegetation change in Brunhes climatic event: long-term changes in global at-
Africa, Quaternary Sci. Rev., 30, 3589–3602, mosphere and ocean circulation, Science, 232, 619–622,
https://doi.org/10.1016/j.quascirev.2011.09.019, 2011. https://doi.org/10.1126/science.232.4750.619, 1986.
Dupont, L. M. and Hooghiemstra, H.: The Saharan-Sahelian bound- Johnson, T. C., Brown, E. T., Mcmanus, J., Barry, S., Barker, P.,
ary during the Brunhes chron, Acta Bot. Neerl., 38, 405–415, and Gasse, F.: A high-resolution paleoclimate record spanning
https://doi.org/10.1111/j.1438-8677.1989.tb01372.x, 1989. the past 25 000 years in southern East Africa, Science, 296, 113–
Dupont, L. M. and Kuhlmann, H.: Glacial-interglacial vegetation 132, https://doi.org/10.1126/science.1070057, 2002.
change in the Zambezi catchment, Quaternary Sci. Rev., 155, Johnson, T. C., Werne, J. P., Brown, E. T., Abbott, A., Berke, M.,
127–135, https://doi.org/10.1016/j.quascirev.2016.11.019, 2017. Steinman, B. A., Halbur, J., Conteras, S., Grosshuesch, S., Deino,
Dupont, L. M., Beug, H.-J., Stalling, H., and Tiedemann, R.: First A., Lyons, R. P., Scholz, C. A., Schouten, S., and Sinninghe
palynological results from ODP Site 658 at 21◦ N west off Damsté, J. S.: A progressively wetter climate in southern East
Africa: pollen as climate indicators, edited by: Ruddiman, W. F., Africa over the past 1.3 million years, Nature, 537, 220–224,
Sarnthein, M., Baldauf, J., and Shipboard Scientists, Proc. ODP https://doi.org/10.1038/nature19065, 2016.
Sci. Results, 108, College Station TX (Ocean Drilling Program), Jolly, D. and Haxeltine, A.: Effect of low glacial atmospheric CO2
93–111, 1989. on tropical African montane vegetation, Science, 276, 786–788,
https://doi.org/10.1126/science.276.5313.786, 1997.
www.clim-past.net/15/1083/2019/ Clim. Past, 15, 1083–1097, 2019You can also read