Land-sea temperature contrasts at the Last Interglacial and their impact on the hydrological cycle
←
→
Page content transcription
If your browser does not render page correctly, please read the page content below
Clim. Past, 17, 869–885, 2021
https://doi.org/10.5194/cp-17-869-2021
© Author(s) 2021. This work is distributed under
the Creative Commons Attribution 4.0 License.

Land–sea temperature contrasts at the Last Interglacial and
their impact on the hydrological cycle
Nicholas King-Hei Yeung1,2 , Laurie Menviel1 , Katrin J. Meissner1,2 , Andréa S. Taschetto1,2 , Tilo Ziehn3 , and
Matthew Chamberlain4
1 Climate
        Change Research Centre, University of New South Wales, Sydney NSW, Australia
2 ARC Centre of Excellence for Climate Extremes, University of New South Wales, Sydney NSW, Australia
3 CSIRO Oceans and Atmosphere, Aspendale VIC, Australia
4 CSIRO Oceans and Atmosphere, Hobart TAS, Australia

Correspondence: Nicholas King-Hei Yeung (nicholas.yeung@unsw.edu.au)

Received: 18 November 2020 – Discussion started: 25 November 2020
Accepted: 12 March 2021 – Published: 21 April 2021

Abstract. Due to different orbital configurations, high north-    of the Australian, South American and South African mon-
ern latitude summer insolation was higher during the Last         soons are consistently reduced in LIG. This is associated with
Interglacial period (LIG; 129–116 thousand years before           greater pressure and subsidence over land due to a strength-
present, ka) than during the pre-industrial period (PI), while    ening of the Southern Hemisphere Hadley cell during austral
high southern latitude summer insolation was lower. The           summer.
climatic response to these changes is studied here with fo-
cus on the Southern Hemisphere monsoons, by perform-
ing an equilibrium experiment of the LIG at 127 ka with           1   Introduction
the Australian Earth System Model, ACCESS-ESM1.5, as
part of the Paleoclimate Model Intercomparison Project 4          Antarctic ice cores suggest that the Last Interglacial pe-
(PMIP4). Simulated mean surface air temperature between           riod (LIG; ∼ 129–116 thousand years before present, ka),
40 and 60◦ N over land during boreal summer is 6.5 ◦ C            also known as Marine Isotope Stage 5e or the Eemian,
higher at the LIG compared to PI, which leads to a north-         was most likely the warmest interglacial of the last 800 ka
ward shift of the Intertropical Convergence Zone (ITCZ) and       (Masson-Delmotte et al., 2013). Paleoproxy records suggest
a strengthening of the North African and Indian monsoons.         that annual mean sea surface temperatures (SSTs) were about
Despite 0.4 ◦ C cooler conditions in austral summer in the        ∼ 0.5 ◦ C (Hoffman et al., 2017) to ∼ 1.1 ◦ C (Capron et al.,
Southern Hemisphere (0–90◦ S), annual mean air tempera-           2017) above pre-industrial (PI) values at the LIG in the
tures are 1.2 ◦ C higher at southern mid-latitudes to high lat-   North Atlantic. The summer warming at high northern lat-
itudes (40–80◦ S). These differences in temperature are co-       itudes on land was particularly pronounced with estimated
incident with a large-scale reorganisation of the atmospheric     temperatures 4 to 5 ◦ C above PI values (CAPE-Last Inter-
circulation. The ITCZ shifts southward in the Atlantic and        glacial Project Members, 2006) and a 3 to 11 ◦ C warming
Indian sectors during the LIG austral summer compared to          over Greenland (NEEM community members et al., 2013;
PI, leading to increased precipitation over the southern trop-    Landais et al., 2016). It has also been suggested that LIG
ical oceans. However, weaker Southern Hemisphere insola-          Southern Ocean SSTs were ∼ 1.8 ◦ C higher than PI values
tion during LIG austral summer induces a significant cooling      (Capron et al., 2017).
over land, which in turn weakens the land–sea temperature            Global mean sea level was ∼ 6 to 9 m higher during the
contrast, leading to an overall reduction (−20 %) in mon-         LIG than the PI values (Kopp et al., 2009; Dutton and Lam-
soonal precipitation over the Southern Hemisphere’s conti-        beck, 2012), with Greenland ice sheets contributing 0.6 to
nental regions compared to PI. The intensity and areal extent     3.5 m (Dutton et al., 2015), and an Antarctic ice-sheet con-
                                                                  tribution likely greater than 6 m (Kopp et al., 2009; Rohling

Published by Copernicus Publications on behalf of the European Geosciences Union.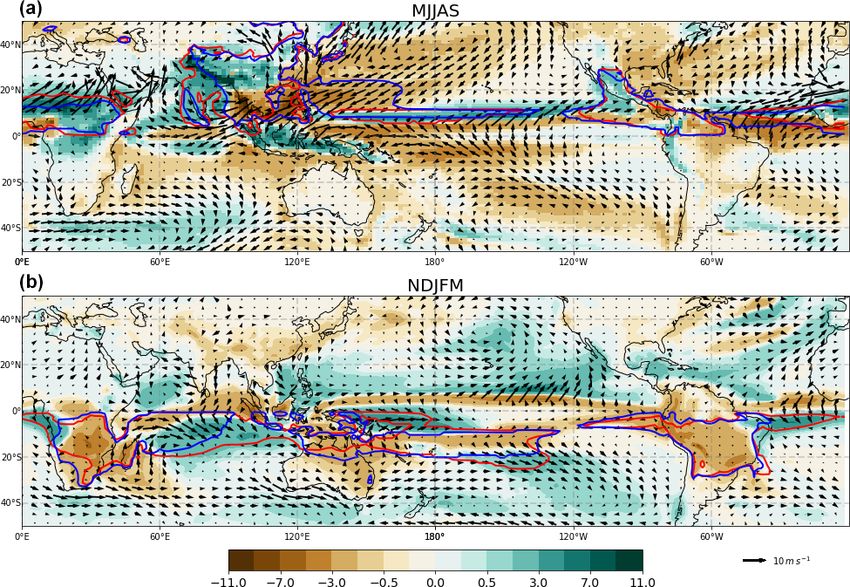
870 N. K.-H. Yeung et al.: Monsoons at the LIG
et al., 2019). Despite its importance, there are still a lot of changes in SH are less clear. A compilation of LIG precipita-
uncertainties associated with the processes leading to ice- tion proxy records with near-global coverage and a multi-
mass loss at the LIG. Even though paleoproxy records pro- model–data comparison are presented in Scussolini et al.
vide constraints on the LIG climate, low spatial and temporal (2019). The study includes 138 sites based on a range of
resolution and uncertainties in transfer functions add uncer- proxies. Most of the data suggest an increase in NH annual
tainties to the climate response to LIG boundary conditions. mean precipitation during the LIG relative to the PI, with the
Numerical simulations of the LIG can thus improve our un- exception of a small number of individual proxy sites. In the
derstanding of the climate processes and feedbacks at play. SH, the proxy signal is less consistent and spatially hetero-
The LIG equilibrium simulation (lig127k) is one of the geneous, with only partial model–data agreement.
highest-priority experiments of the Paleoclimate Modeling In this study we present the large-scale climatic features
Intercomparison Project 4 (PMIP4) designated simulations of the LIG equilibrium experiment (lig127k) as simulated by
in the Coupled Model Intercomparison Project (CMIP6) the ACCESS-ESM1.5 model, compared to the pre-industrial
(Otto-Bliesner et al., 2017). It primarily aims to examine experiment (Ziehn et al., 2020), and to available paleoproxy
the climate response due to changes in orbital configuration records. We also explore the changes in austral summer pre-
at a time when atmospheric greenhouse gas concentrations cipitation in the SH.
and continental configurations were similar to PI values (Ta-
ble 1). At the LIG, the Earth’s orbit had a larger eccentric-
2 Model description and experimental design
ity, with the timing of perihelion closer to the boreal sum-
mer solstice (Berger, 1978). Together with a greater axial tilt 2.1 ACCESS-ESM1.5 model description
of the Earth, it led to higher insolation north of 40◦ S be-
tween April and September, with a maximum anomaly of ACCESS-ESM1.5 (Ziehn et al., 2020) is an updated version
∼ 70 W m−2 at high northern latitudes in June. Insolation of ACCESS-ESM1 (Law et al., 2017). The differences be-
was generally lower south of 60◦ N between October and tween ACCESS-ESM1.5 and ACCESS-ESM1 are relatively
March and particularly in the Southern Hemisphere (SH) in small, with the majority of the changes concerning the land
December and January, with insolation anomalies reaching surface and ocean model.
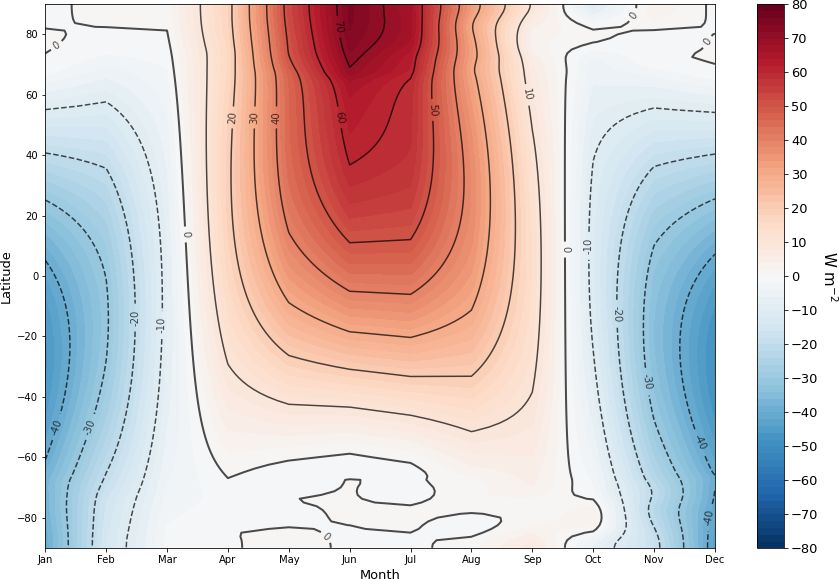
−45 W m−2 compared to PI values (Fig. 1). The atmospheric component of the ACCESS-ESM1.5 is
A recent study presented the large-scale features of the the UK Met Office Unified Model version 7.3 (UM7.3; Mar-
PMIP4-CMIP6 lig127k experiment as deduced from 17 par- tin et al., 2010; The HadGEM2 Development Team et al.,
ticipating climate models (Otto-Bliesner et al., 2021). Com- 2011), but with the Community Atmosphere Biosphere Land
pared to PI, strong warming is shown over Northern Hemi- Exchange model (CABLE2.4; Kowalczyk et al., 2013) as
sphere (NH) continents during June, July and August (JJA), land surface model (Table 2). The ocean component is the
while a cooling is simulated in December, January and NOAA/GFDL Modular Ocean Model version 5 (MOM5;
February (DJF), due to the seasonal character of insolation Griffies, 2014) with the same configuration as the ocean
anomalies (Otto-Bliesner et al., 2021). This leads to a sub- model component of ACCESS1.0 and ACCESS1.3 (Bi et al.,
stantial reduction in the boreal summer Arctic sea-ice extent, 2012). Sea ice is simulated using the LANL CICE4.1 model
while there is little change in maximum sea-ice area during (Hunke and Lipscomb, 2010), which has the same horizontal
winter (Kageyama et al., 2021). The multi-model study by grid as the ocean with five thickness classes. Coupling of the
Kageyama et al. (2021) is in broad agreement with avail- ocean and sea ice to the atmosphere is achieved through the
able paleoproxy records showing that regions south of 78◦ N OASIS-MCT coupler (Valcke, 2013). The physical climate
in the Atlantic and Nordic Seas were seasonally ice-free, model configuration used here is similar to the ACCESS1.3
though model–data comparison north of 78◦ N is difficult due model, which contributed to the Coupled Model Intercom-
to ambiguous interpretations of proxy data. parison Project Phase 5 (CMIP5) (Bi et al., 2012). The spatial
The PMIP4 lig127k ensemble mean shows that boreal resolutions of model components are listed in Table 2.
summer monsoonal precipitation is enhanced over northern The carbon cycle is included in ACCESS through the
Africa (and extends into Saudi Arabia), India and south- Nutrient, Phytoplankton, Zooplankton and Detritus (NPZD)
east Asia, and northwestern Mexico, while in the SH, aus- model WOMBAT (World Ocean Model of Biogeochemistry
tral summer monsoonal precipitation decreases over Aus- and Trophic dynamics; Oke et al., 2013), and through the
tralia, southern Africa and South America (Otto-Bliesner land surface model CABLE and its biogeochemistry module
et al., 2021). Although the model spread for precipitation is CASA-CNP (Wang et al., 2010), with CASA-CNP being run
large, the models generally agree on the sign of change in with nitrogen and phosphorus limitation.
area-averaged monsoonal precipitation, except for the South In the CABLE configuration applied here, there are a total
Asian and Australian monsoons. While studies based on of 13 plant functional types (PFTs), including 10 vegetated
proxy records consistently demonstrate a strengthening of types and 3 non-vegetated types (lake, land-ice, bare ground).
the African and Indian monsoons (e.g. Magiera et al., 2019; For land-ice, CABLE does not allow fractional amounts such
Orland et al., 2019; Rohling et al., 2002), the precipitation that relevant grid cells must be all permanent ice, effectively
Clim. Past, 17, 869–885, 2021 https://doi.org/10.5194/cp-17-869-2021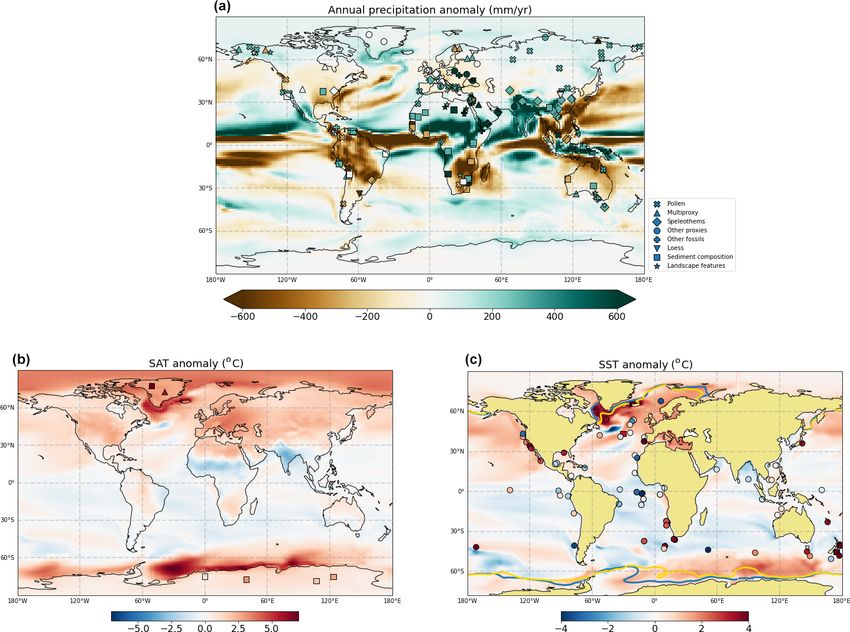
N. K.-H. Yeung et al.: Monsoons at the LIG                                                                                                          871

Table 1. Forcings and boundary conditions of the piControl and lig127k experiments.

                                                                piControl (1850 CE)                   lig127k (127 ka)
                         Orbital parameters
                         Eccentricity                           0.016764                              0.039378
                         Obliquity (degrees)                    23.459                                24.040
                         Perihelion – 180                       100.33                                275.41
                         Vernal equinox                         Fixed to noon on 21 March             Fixed to noon on 21 March
                         Greenhouse gases
                         Carbon dioxide (ppm)                   284.3                    275
                         Methane (ppb)                          808.2                    685
                         Nitrous oxide (ppb)                    273.0                    255
                         Other GHGs                             CMIP DECK piControl      0
                         Solar constant                                      TSI: 1365.65 W m−2∗
                         Paleogeography                                             Modern
                         Ice sheets                                                 Modern
                         Vegetation                                          CMIP DECK piControl
                         Aerosols: dust, volcanic, etc.                      CMIP DECK piControl
                       ∗ While the solar constant in the protocol for CMIP DECK piControl is 1360.747 W m−2 , both the piControl and
                       lig127k experiments were integrated with 1365.65 W m−2 according to CMIP5–PMIP3 guidelines. This allows
                       comparison between our piControl and our lig127k experiment.

Figure 1. Monthly insolation anomalies at LIG compared to PI. The lengths of months are adjusted using a “fixed-angular” definition
following Bartlein and Shafer (2019) (see Sect. 2.2).

limiting these cells to Greenland and Antarctica. CABLE cal-                        carbon pool and the specific leaf area. Here the PFT is fixed
culates gross primary production (GPP) and leaf respiration                         such that vegetation is static, but LAI is interactive.
at every time step using a two-leaf canopy scheme (Wang and                            Biases in the ACCESS-ESM1.5 are discussed in Ziehn
Leuning, 1998) as a function of the leaf area index (LAI).                          et al. (2020). In boreal summer, India and North America
LAI is calculated prognostically based on the size of the leaf                      show signs of a warm bias, with a dry bias over India. In

https://doi.org/10.5194/cp-17-869-2021                                                                                     Clim. Past, 17, 869–885, 2021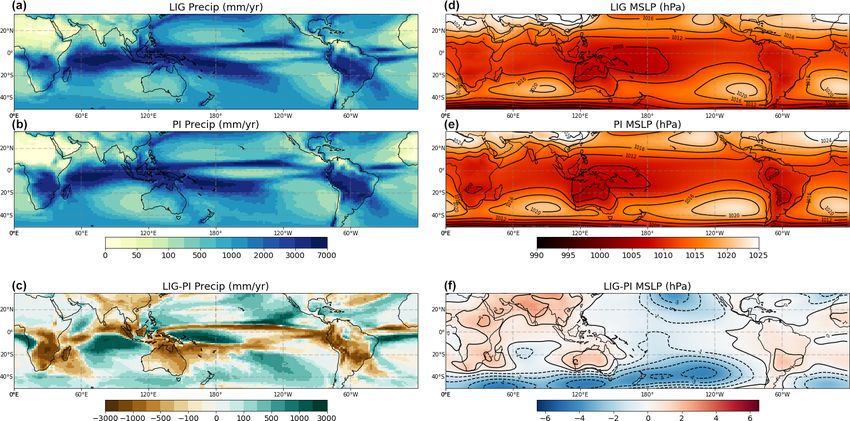
872                                                                                    N. K.-H. Yeung et al.: Monsoons at the LIG

Table 2. Model components of the ACCESS-ESM1.5.

                   Model component       Name            Resolution
                   Atmosphere            UM7.3           1.875◦ × 1.25◦ , with 38 vertical levels, extending to 40 km.
                   Land surface          CABLE2.4        Same horizontal resolution as atmosphere. Each grid cell
                                                         comprises 13 plant functional types (PFTs). No dynamic
                                                         vegetation, but interactive LAI. Biogeochemistry imple-
                                                         mented by CASA-CNP module.
                   Coupler               OASIS-MCT
                   Ocean                 MOM5            Nominally 1◦ in horizontal, with latitudinal refinements
                                                         around the Equator (0.33◦ between 10◦ S and 10◦ N) and
                                                         the Southern Ocean (ranging from 0.25◦ at 78◦ S to 1◦ at
                                                         30◦ S). 50 vertical levels with a nominal 10 m thickness in
                                                         the upper ocean.
                   Marine carbon cycle   WOMBAT          Same as MOM5.
                   Sea ice               CICE4.1         Same as MOM5.

austral summer, there are warm biases over the equatorial             to number of days. Therefore, the outputs of lig127k are ad-
regions in South America and Africa. By comparison, Aus-              justed following Bartlein and Shafer (2019). It is essential to
tralia’s biases in temperature and precipitation are very small.      consider this paleo-calendar effect for a correct interpretation
                                                                      of results.
2.2   Experimental design
The Last Interglacial is one of the two interglacial periods          3     Results
included in PMIP4. The equilibrium experiment of the Last
Interglacial, denoted lig127k, is classified as a Tier 1 PMIP4-       As the maximum insolation anomalies between the LIG and
CMIP6 experiment.                                                     PI values occur in June (+70 W m−2 at 80◦ N) and December
   The initial conditions of the lig127k experiment were de-          (−45 W m−2 at 40◦ S) (Fig. 1), we here focus on climatic
rived from a pre-industrial simulation (1850 CE, piControl)           changes occurring in JJA and DJF.
(Ziehn et al., 2020), which follows the CMIP6 protocol
(Eyring et al., 2016). piControl was integrated for 1000 years,       3.1    Changes in surface temperature and sea ice
and the average of the last 100 years serves as a reference to
which the lig127k experiment is compared.                             Due to the large insolation anomalies in the NH during bo-
   The lig127k experiment follows the lig127k protocol                real summer (Fig. 1), simulated mean JJA surface air temper-
(Table 1; Otto-Bliesner et al., 2017), with specific forc-            atures are 2.3 ◦ C higher in the NH at the LIG compared to PI
ing values described in Table 1. As the solar constant in             values (Fig. 2b), in agreement with terrestrial proxy recon-
the piControl experiment follows CMIP5–PMIP3 guidelines               structions from the region (Axford et al., 2011; Francis et al.,
(1365.65 W m−2 ), it has a slightly different value to the            2006; Fréchette et al., 2006; McFarlin et al., 2018; Melles
CMIP6 protocol (1360.75 W m−2 ). The solar constant in                et al., 2012; Plikk et al., 2019; Salonen et al., 2018). The sim-
lig127k is set equal to the one in piControl to allow a di-           ulated boreal summer warming is maximum between 40 and
rect comparison between them. The experiment is integrated            60◦ N, averaging +6.5 ◦ C over land, in line with the PMIP4
for 650 years, and we are presenting the last 200 years of that       lig127k multi-model mean (Otto-Bliesner et al., 2021). Sim-
run. During the last 100 years, changes in globally averaged          ilarly, compared to the PI simulation, boreal summer SSTs
SST are +0.11 ◦ C, changes in deep ocean temperature are              are ∼ 2.5 ◦ C higher in the North Pacific, the North Atlantic
+0.043 ◦ C and changes in salinity in the Southern Ocean are          and the Nordic Seas, and up to 4 ◦ C higher in the Labrador
less than 0.005 psu, which suggests that our experiment has           Sea (Fig. 2d). This high-latitude warming is associated with
equilibrated sufficiently.                                            a reduction in boreal summer Arctic sea-ice area (Fig. 2d),
   Since the orbital parameters of LIG and PI are different           with a maximum of 63 % reduction in sea-ice area in Septem-
(Table 1), a fixed-angular definition of months is required to        ber (Figs. S1, S2 in the Supplement). North of 40◦ N in the
achieve a valid comparison between lig127k, piControl and             North Atlantic and Norwegian Sea, 16 paleoproxy records
proxy data. The length of each month should be defined by             suggest higher SSTs during boreal summer at the LIG and 9
a fixed number of degrees of the Earth’s orbit, as opposed            suggest lower SSTs, with a range of −8.7 to +5.7 ◦ C, and a

Clim. Past, 17, 869–885, 2021                                                              https://doi.org/10.5194/cp-17-869-2021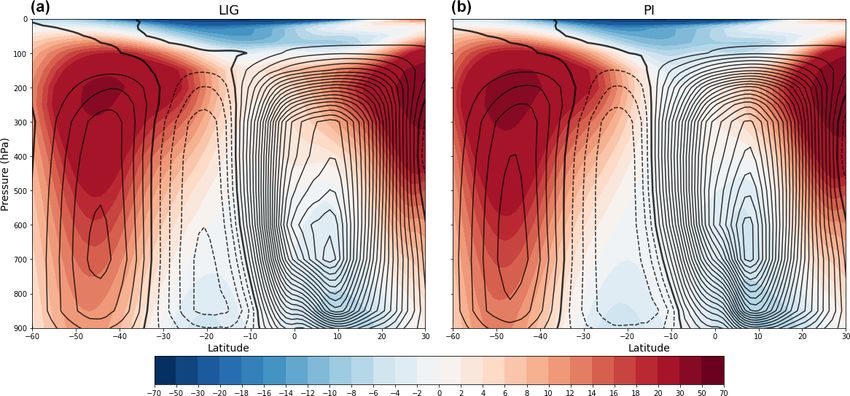
N. K.-H. Yeung et al.: Monsoons at the LIG                                                                                  873

median of +1.5 ◦ C (Fig. 2d). Out of these 25 records, sim-      tic sea-ice area in September being 31 % smaller during the
ulated SSTs agree with the anomaly sign of 16 of the pale-       LIG than during the PI period (Fig. S1). Despite lower inso-
oproxy records. The main regions of model–data disagree-         lation, Antarctic sea-ice area reaches a minimum in Febru-
ment, where proxy records suggest a cooling whereas the          ary that is 46 % smaller at the LIG than at PI. This promi-
model suggests a warming, are in the Norwegian Sea and           nent reduction in Antarctic sea-ice area is accompanied by a
off the Iberian margin.                                          marked temperature increase in the Southern Ocean all year
   Due to the strong sea-ice melting in boreal summer, the       round (Fig. 2). Simulated SSTs are 2 to 3 ◦ C higher in the
simulated boreal winter Arctic sea-ice area remains 8 %          Southern Ocean during austral summer (Fig. 2d), while an-
smaller at the LIG compared to PI values in spite of a           nual mean air temperatures over Antarctica increase close to
higher rate of boreal autumn sea-ice formation (Figs. 2c,        the coast by ∼ 4 ◦ C (Fig. 3b). The simulated Southern Ocean
S1). In addition, enhanced deep water formation is simu-         warming between 50 and 60◦ S is in agreement with SST
lated in the Labrador Sea during the LIG (not shown), in-        proxy records, however it is underestimated between ∼ 40
ducing a ∼ 2.5 ◦ C increase in winter SSTs in that region        and 50◦ S (Capron et al., 2017) (Fig. 2c). While the sim-
(Fig. 2c). However, paleoproxy records suggest there was         ulated warming is mostly confined to the south of 45◦ S,
no deep-water formation in the Labrador Sea during the LIG       proxy records suggest the warming could have reached fur-
(Hillaire-Marcel et al., 2001), and the simulated SST increase   ther north, particularly in the Atlantic Ocean. The differences
in the Labrador Sea during JJA is in contrast with some of       in seasonal insolation makes the SH annual mean surface
the SST paleoproxy records in that region (Fig. 2d; Capron       temperature 0.5 ◦ C warmer in the LIG compared to PI, with
et al., 2014, 2017). There is evidence of meltwater discharge    a higher mean warming of 1.3 ◦ C when averaged south of
from the Greenland ice sheet during the early part of the        50◦ S (Fig. 3b).
LIG (Galaasen et al., 2014, 2020; Tzedakis et al., 2018),
which could have suppressed deep ocean convection in the         3.2   Precipitation change
Labrador Sea and led to a cooling there (e.g. Tzedakis et al.,
2018), thus explaining the discrepancy.                          Simulated annual mean precipitation anomalies are shown in
   The simulated strength of the Atlantic Meridional Over-       Fig. 3a and compared to a recent compilation of LIG pre-
turning Circulation (AMOC), as represented by the maxi-          cipitation reconstructions based on a range of proxy records
mum meridional stream function at 26◦ N in the Atlantic          (including pollen, speleothems, landscape features, loess and
basin, is stronger at the LIG (21.8 Sv) than during the PI pe-   sediment composition) (Scussolini et al., 2019). In the NH
riod (18.3 Sv). The AMOC strengthening and reduced Arc-          the model is in agreement with 64 out of 109 proxy records
tic sea-ice cover lead to ∼ 3◦ C higher winter SSTs in the       (59 %), i.e. where the model and proxy data show the same
northern North Atlantic and air surface temperatures over        sign of change, or where the change in the simulations is
the ocean at high northern latitudes (+3.3 ◦ C in 60–90◦ N)      < 100 mm yr−1 and the corresponding proxy suggests no
(Fig. 2a, c). Together with stronger NH insolation, the an-      change. Although the agreement is not compellingly strong,
nual mean NH (0–90◦ N) surface air temperature is 1.4 ◦ C        it is worth pointing out that the majority of disagreements
higher at the LIG compared to PI values (Fig. 3b).               arises in central Europe where reconstructions are abundant
   Due to the lower magnitude of insolation in austral sum-      and mostly display wetter conditions, whereas the simulation
mer, simulated DJF SH air temperatures are lower at middle       shows a slight decrease in precipitation. In contrast, there is
and low latitudes during the LIG compared to PI. This cool-      a good model–data agreement in northern Africa, the Middle
ing is enhanced over land, where the anomalies can be as low     East, Asia and North America.
as −5.4 ◦ C in India (Fig. 2a). SSTs between 40◦ N and 40◦ S        As seen in Fig. 3a, the largest changes in annual mean pre-
also drop by 0.5 ◦ C on average during DJF, in good agree-       cipitation are simulated in the tropics where both the rain-
ment with most proxy records in mid-latitudes. The largest       fall mean and variability are higher. Annual precipitation in-
SST drop at low latitudes is simulated in the Bay of Bengal,     creases over land in the northern tropics, particularly over the
with an anomaly of −3 ◦ C (Fig. 2c). A ∼ 2 ◦ C SST decrease      African Sahel (> +300 %), South Asia (+100 %) and Cen-
is also simulated in the western equatorial Pacific and in the   tral America (+40 %). Coinciding with increasing precipi-
equatorial Atlantic. However, despite lower austral summer       tation, the significant cooling (∼ −3 ◦ C; Fig. 3b) over the
insolation at high southern latitudes, warmer conditions are     Sahel and India is associated with stronger evaporation over
simulated in DJF at the LIG compared to PI values in the         land during boreal summer (not shown). All ocean regions in
Southern Ocean, associated with a large decrease in sea-ice      the northern tropics are simulated to be wetter, except for the
area (−43 %) (Figs. 2a, c and S1).                               South China Sea and Philippine Sea. In general there is good
   Compared to PI, the LIG insolation reaching 60◦ S is only     agreement with proxy records in the northern tropics.
5 to 15 W m−2 larger between mid-April and mid-September            In contrast, the model generally simulates drier conditions
(Fig. 1). However, this relatively small positive insolation     over the southern tropics during the LIG (Fig. 3a), partic-
anomaly reduces the growth of Antarctic sea ice between          ularly over South America (−20 %), South Africa (−40 %)
April and September, with the simulated maximum Antarc-          and northern Australia (−40 %). This decrease in precipita-

https://doi.org/10.5194/cp-17-869-2021                                                         Clim. Past, 17, 869–885, 2021
874 N. K.-H. Yeung et al.: Monsoons at the LIG
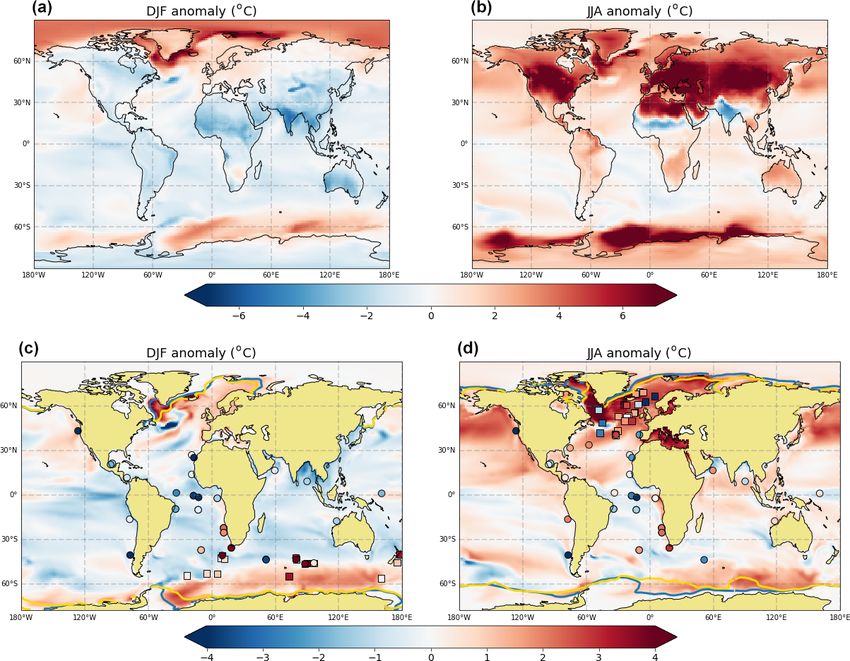
Figure 2. DJF and JJA surface temperature anomalies (LIG minus PI) with proxy data overlaid (filled markers: squares for the compilation
by Capron et al., 2014, 2017; dots for the compilation by Hoffman et al., 2017; triangles for Arctic terrestrial proxies; Axford et al., 2011;
Francis et al., 2006; Fréchette et al., 2006; McFarlin et al., 2018; Melles et al., 2012; Plikk et al., 2019; Salonen et al., 2018). The pre-
industrial reference is 1850 CE for model anomalies, 1870–1899 for Capron et al. (2014, 2017) and 1870–1889 for Hoffman et al. (2017).
(a–b) Surface air temperatures. (c–d) Sea surface temperatures, with contours of sea-ice concentration at 15 % overlaid in February for DJF
and August for JJA (blue: LIG; yellow: PI).
tion mostly occurs in DJF, during the SH monsoon season zero-energy flux equator, i.e. where the atmospheric merid-
(Fig. 4c). In addition, this precipitation reduction is consis- ional energy flux divergence vanishes (Schneider et al., 2014;
tent with an overall increase in mean sea-level pressure over Ceppi et al., 2013). In the present climate, this occurs north of
the SH land (Fig. 4f). Therefore, the simulation suggests a the Equator, thus placing the ITCZ in the NH. This is essen-
major change in precipitation in the tropics, associated with tially due to an interhemispheric energy imbalance, caused
a shift in the Intertropical Convergence Zone (ITCZ) and a primarily by the northward oceanic heat transport by the
weakening of the convergence zones in the SH, which will Atlantic Meridional Overturning Circulation (AMOC). The
be discussed in the next section. net northward oceanic heat transport to the NH is com-
pensated by a southward atmospheric heat transport via a
northward-displaced Hadley cell and the positioning of the
3.2.1 ITCZ changes ITCZ north of the Equator. Therefore, one would expect
The ITCZ position is generally identified as the latitudi- that an interhemispheric temperature gradient would drive a
nal band of maximum precipitation. Previous studies have cross-equatorial atmospheric energy flux, which in turn de-
demonstrated that the position of the ITCZ aligns with the
Clim. Past, 17, 869–885, 2021 https://doi.org/10.5194/cp-17-869-2021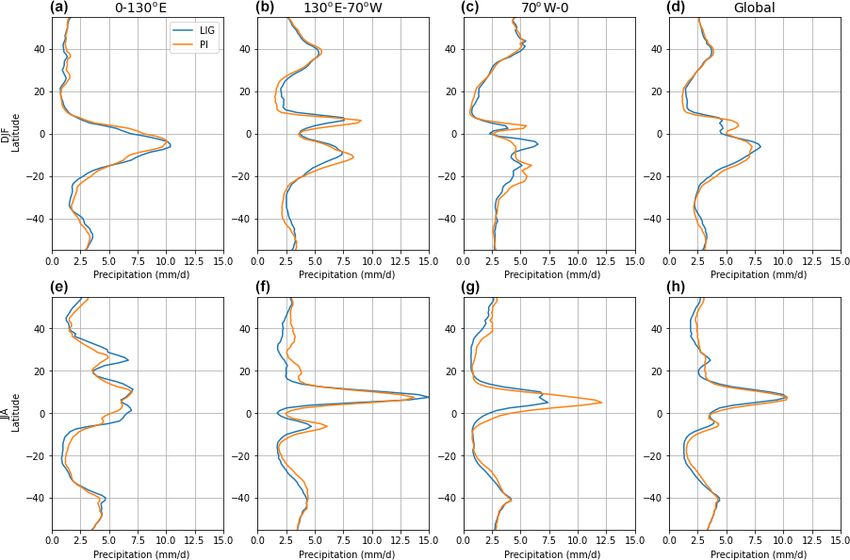
N. K.-H. Yeung et al.: Monsoons at the LIG                                                                                               875

Figure 3. (a) Simulated annual mean precipitation anomaly (mm yr−1 ) with proxy reconstructions from Scussolini et al. (2019) overlaid.
Proxy reconstructions are semi-quantitative with much drier conditions shown in brown, drier in light brown and the reverse for green.
(b) Annual mean surface air temperature anomalies (◦ C) with proxy data (filled markers: squares for the compilation by Capron et al.,
2014, 2017; triangles for Arctic terrestrial proxies; Landais et al., 2016; NEEM community members et al., 2013; Yau et al., 2016). (c) Annual
mean sea surface temperature anomalies with proxy data (filled markers: squares for the compilation by Capron et al., 2014, 2017; dots for
the compilation by Hoffman et al., 2017), and contours of annual sea-ice concentration at 15 % overlaid (blue: LIG; yellow: PI).

termines the position of the ITCZ towards the warmer hemi-                  The zonally averaged precipitation in DJF shows a more
sphere (e.g. Schneider et al., 2014).                                    complex picture for the ITCZ, with an increase in strength
   As seen in Fig. 5h, zonally averaged precipitation in JJA             (by 10 %) at 5◦ S, while precipitation at 5◦ N decreases by
displays a slight northward shift of the ITCZ at the LIG com-            23 % (Fig. 5d). However, the DJF precipitation response
pared to PI. Although this northward ITCZ shift is seen in all           across basins varies significantly. In the Indian sector, there
ocean basins, there are differences in the magnitude of the              is a southward shift (∼ 3◦ ) and slight strengthening of the
peak precipitation. The peak is 9 % stronger in the Pacific              ITCZ. In contrast, in the Pacific sector, which displays a
sector (130◦ E to 70◦ W), but 39 % weaker in the Atlantic                double ITCZ in DJF in both PI and LIG periods, there is a
sector. In the Indian sector (0 to 130◦ E), even though the              weakening and northward shift (∼ 1 to 4◦ ) of the precipita-
ITCZ location is less defined, precipitation is higher between           tion peaks at 10◦ S and 7◦ N. Similarly, in the Atlantic sec-
5◦ S and 20◦ N at the LIG. In short, the ITCZ shifts northward           tor, a ∼ 25 % weakening of DJF precipitation at 5◦ N dur-
in the Pacific and Atlantic sectors in JJA compared to PI. This          ing the LIG is simulated, while there is a strengthening of
consistent northward shift during JJA can be explained by the            the ITCZ peaks at 5◦ S (Figs. 4a–c, 5c). The simulation thus
higher NH summer temperatures, which accentuate the inter-               displays a southward ITCZ shift over the Atlantic and In-
hemispheric temperature gradient.                                        dian Oceans, but a northward shift in the Pacific Ocean.

https://doi.org/10.5194/cp-17-869-2021                                                                    Clim. Past, 17, 869–885, 2021
876                                                                                   N. K.-H. Yeung et al.: Monsoons at the LIG

Figure 4. Left panels: simulated DJF precipitation for (a) LIG, (b) PI and (c) LIG minus PI. Right panels: simulated DJF mean sea level
pressure (MSLP) for (d) LIG, (e) PI and (f) LIG minus PI.

These differences in longitudinal responses are associated               As evident from Fig. 6b, there is a marked difference in
with changes in large-scale atmospheric circulation. Since            NDJFM precipitation anomalies over the SH land and ocean
low-latitude precipitation is associated with monsoon sys-            regions during LIG relative to PI. To investigate this differ-
tems, we will now look into more detail at the precipitation          ence further, we separate the simulated tropical precipita-
changes occurring in each of the monsoon regions.                     tion anomalies over land and ocean (Fig. 7). The metrics in
                                                                      Fig. 7 have been calculated using an adjusted paleo-calendar
3.2.2   Precipitation changes in monsoon regions                      from monthly outputs (Bartlein and Shafer, 2019). However,
                                                                      Brierley et al. (2020) suggest that this method might ac-
Monsoon domains are defined as regions in which the pre-              centuate the anomalies. As seen in Fig. S3, non-calendar-
cipitation during the monsoon season is (1) greater than the          adjusted results are similar to the calendar-adjusted ones (dif-
dry season by at least 2.5 mm d−1 , and (2) responsible for           ferences ∼ < 5 %), even though the calendar-adjusted results
at least 55 % of the annual precipitation (Wang et al., 2011).        are slightly dry-biased for most precipitation-related met-
For the NH, May–September is used as the monsoon wet sea-             rics. The major difference is the total precipitated water for
son while November–March is the dry season. The reverse is            the North African monsoon (NAF), in which the calendar-
adopted for the SH, i.e. November–March is the wet season,            adjusted results suggest a ∼ 72 % increase, whereas the non-
while the May–September is the dry season. As shown in                calendar-adjusted results suggest a ∼ 90 % increase.
Fig. 6a, the model simulates a general expansion of the mon-             Precipitation over land is generally higher in the north-
soon domains in the northern tropics, also associated with in-        ern tropics, with an increase of over 60 % in total precip-
creased precipitation rates, whereas there is a contraction of        itated water for the NAF (Fig. 7). The South Asian Mon-
the monsoon domains and reduced precipitation in the south-           soon (SA) also displays a large increase in precipitated wa-
ern tropics.                                                          ter (> 60 %), mainly due to a large increase in areal extent
   The North African monsoon domain expands significantly             (+ >55 %), as the increase in area-averaged precipitation
into the Sahara region. This expansion is associated with             is small (∼ 5 %). The North American monsoon (NAM) is
enhanced southwesterly winds. The Indian monsoon also                 slightly weaker, with a slight decrease in area-averaged pre-
strengthens and expands due to intensified onshore winds              cipitation rate (−0.3 %), areal extent (−2.2 %) and total pre-
from the Arabian Sea and convergence inland (Fig. 6a). On             cipitated water (−2.5 %). Compared to PI, all NH monsoon
the other hand, a contraction of the monsoon domain over              domains during the LIG experience an increase in air surface
the Philippine Sea and South China Sea is simulated and at-           temperature during monsoon seasons. While there is signifi-
tributed to a northeastern wind anomaly associated with trade         cant cooling during JJA over the Sahel at ∼ 15◦ N and India
winds strengthening in MJJAS.

Clim. Past, 17, 869–885, 2021                                                             https://doi.org/10.5194/cp-17-869-2021
N. K.-H. Yeung et al.: Monsoons at the LIG 877 Figure 5. Zonally averaged precipitation (mm d−1 ). 0–130◦ E covers most of Africa, Indian Ocean and up to western Australia; 130◦ E– 70◦ W covers the Pacific Ocean, and 70◦ W–0◦ covers the central part of Atlantic Ocean. (a–d) DJF; (e–h) JJA. due to stronger evaporation over land (Fig. 2b), this is com- precipitation in the Indian Ocean between 10 and 20◦ S, as- pensated by the warming in higher latitudes. sociated with a strengthening of northwesterly surface wind The contrary is simulated in the SH, with higher precip- north of the IOCZ (Figs. 6b and 7). This southward shift itation simulated over the ocean and lower precipitation, by is associated with an IOCZ weakening, which induces a at least 10 %, over land in the SH monsoon regions at the 35 % decrease in total monsoonal precipitation over land in LIG compared to PI values (Figs. 6b and 7). In the Indo- the South African monsoon region (SAF), and a 15 % de- Australian region, there is a northward shift and weakening crease in the areal extent of the SAF. Central southern Africa of the South Pacific Convergence Zone (SPCZ). This leads (15◦ S, 30◦ E) displays the greatest decrease in summer pre- to a precipitation increase over the western equatorial Pa- cipitation. The monsoon domain contracts along the north– cific. Precipitation also increases at the southeastern edge of south direction but expands westward close to the Equator the SPCZ (Figs. 4c, 6b). This is linked to the weakening of on the west coast (5◦ S, 15◦ E). This could be linked to the the south Pacific high (Fig. 4f) and the associated wester- southward shift of the ITCZ in the southern tropical Atlantic lies south of 40◦ S and the easterlies between 15 and 35◦ S Ocean (Fig. 6b). (Fig. 6b). The Australian monsoon (AUS) displays the great- Area-averaged precipitation associated with the South est decline, with a decrease in total precipitated water over American monsoon (SAM) decreases by 21 % (Fig. 7), land by over 70 %, and a ∼ 60 % decrease in areal extent while the areal extent only decreases slightly as the mon- as the monsoon domain contracts northward. Drier condi- soon domain remains spatially very similar to the PI values tions (< −1 mm d−1 ) are also simulated over eastern Aus- (Fig. 6b). This means that the monsoon reduction is primar- tralia, even though it is not being included in the monsoon ily due to weaker precipitation over the same region, with domain. drier conditions more prevalent over the west coast and the In contrast, the Indian Ocean Convergence Zone (IOCZ) southern boundary of the monsoon domain (25◦ S), suggest- shifts southward, which leads to a ∼ 8 % intensification of ing a weakening of the South Atlantic Convergence Zone https://doi.org/10.5194/cp-17-869-2021 Clim. Past, 17, 869–885, 2021
878                                                                                       N. K.-H. Yeung et al.: Monsoons at the LIG

Figure 6. Precipitation anomaly (mm d−1 ) with surface wind anomaly overlaid. (a) MJJAS; (b) NDJFM. Monsoon domains, defined as
regions in which the precipitation during the monsoon season (NH: MJJAS; SH: NDJFM) is greater than the dry season (NH: NDJFM; SH:
MJJAS) by at least 2.5 mm d−1 and responsible for at least 55 % of the annual precipitation, are shown for the LIG (red contours) and for PI
(blue contours) periods.

Figure 7. Changes in monsoon season (NH: MJJAS; SH: NDJFM) precipitation averaged within (a) terrestrial monsoon domains shown in
Fig. 6 and (b) over SH ocean regions. Areas in which individual monsoon and ocean regions are bounded as defined in Table S1. Pav: percent-
age change in area-averaged precipitation rate during monsoon season. Aav: percentage change in areal extent of regional monsoon domain.
Totwater: percentage change in total precipitated water during monsoon season (mean precipitation rate over monsoon domain multiplied by
areal extent). TAS: air surface temperature (in ◦ C). Key: SAF = South African monsoon; AUS = Australian monsoon; SAM = South Amer-
ican monsoon; NAF: North African monsoon; NAM = North American monsoon; SA = South Asian monsoon; EA = East Asian monsoon;
SAO = South Atlantic Ocean; IND = southern Indian Ocean; WPO = western to central Equatorial Pacific Ocean.

Clim. Past, 17, 869–885, 2021                                                                 https://doi.org/10.5194/cp-17-869-2021
N. K.-H. Yeung et al.: Monsoons at the LIG                                                                                 879

(SACZ; Carvalho et al., 2002). The Brazilian coast along 0       4   Discussion
to 15◦ S shows an increase in summer precipitation (+1 to
+3 mm d−1 ) due to the southward shift of the ITCZ in the
Atlantic Ocean, but this does not contribute much to the gen-    At the LIG the insolation reaching Earth was different from
eral monsoon activity since LIG rainfall levels remain low.      PI, with higher insolation in JJA in the NH and lower insola-
   To a first order, the reduced precipitation over land in      tion in DJF in the SH. In agreement with paleo-records, the
the southern tropics can be explained by the consistently        ACCESS-ESM1.5 lig127k simulation presented here sug-
colder conditions over land masses in SH low to middle lati-     gests a 2 to 4 ◦ C SST increase in the North Atlantic as well
tudes during austral summer (Fig. 2a). Due to reduced land–      as a 5 ◦ C warming over land in the mid-northern latitudes
sea temperature gradients, colder conditions over land in-       in JJA. The simulated northern latitude temperature anoma-
duce a weakening of the onshore winds (i.e. a weakening          lies as well as JJA Arctic sea-ice cover are very close to the
of the easterlies over Brazil, South Africa and northeastern     PMIP4 lig127k multi-model means (Kageyama et al., 2021;
Australia, and reduced northwesterlies in northwestern Aus-      Otto-Bliesner et al., 2021). The simulated Arctic LIG sea-ice
tralia), which tends to decrease moisture advection inland,      cover is in agreement with 16 out of 27 proxy records and
and restrict convective activity over the SH land regions.       suggests that the simulated LIG Arctic sea-ice cover might
   Due to the high heat capacity of the ocean, land masses       be slightly overestimated (Kageyama et al., 2021).
are more sensitive to changes in insolation. As insolation is       At low to mid-southern latitudes, simulated surface air
lower across most latitudes at the LIG compared to PI val-       temperature anomalies in the ACCESS-ESM are also very
ues during austral summer, the strongest anomalous cool-         similar to the PMIP4 multi-model mean with ∼ 3 ◦ C warm-
ing occurs over land (Fig. 2a), which leads to positive sur-     ing over land in JJA, and ∼ 2 ◦ C cooling over land in DJF.
face pressure anomalies (Fig. 4f). In particular, the strong     However, the model simulates much warmer conditions over
cooling over southwestern Australia (Fig. 2a) is associated      the Southern Ocean all year round, with values higher than
with an anomalously high surface pressure (Fig. 4f), block-      the multi-model mean. This is concurrent with a large de-
ing the monsoonal inflow. The situation is similar in India:     crease in Southern Ocean sea ice at the LIG. While the simu-
the strongest cooling occurs over the region centred on India,   lated warming over the Southern Ocean throughout the year
which induces positive pressure anomalies over the region        is at the higher end of the PMIP4 lig127k model range, the
and the northern part of the Indian Ocean. On the other hand,    warming over Antarctica is at the lower end (Otto-Bliesner
negative pressure anomalies develop in the southern tropical     et al., 2021).
Indian Ocean. As a result the IOCZ shifts southward.                The simulated spatial distribution of annual precipitation
   While the reduced insolation in the SH during DJF would       anomalies (Fig. 3a) agrees well with the PMIP4 multi-model
tend to reduce precipitation over the SH, changes in the         mean (Otto-Bliesner et al., 2021), with drier conditions over
global atmospheric circulation produce a southward shift of      SH land regions including North Australia, South Africa
the ITCZ in the Indian and Atlantic Oceans (Sect. 3.2.1,         and South America, while wetter conditions are simulated
Figs. 4c and 5a and c) that leads to higher precipitation        at ∼ 10◦ S in the Atlantic Ocean, the Indian Ocean and the
over those tropical ocean regions (Fig. 7). In addition, the     western equatorial Pacific Ocean. However, while our simu-
land–ocean contrast helps maintain this configuration via        lation suggests wetter conditions over the equatorial Pacific
changes in zonal pressure gradient between land and adja-        at 10◦ N due to a strengthening of the ITCZ in this basin in
cent oceans, creating local Walker-type circulation anomalies    JJA (Fig. 5f), this does not occur in the multi-model mean.
(with anomalous ascending motion over oceans and compen-            Reduced precipitation over land and increased precipita-
satory subsidence over land).                                    tion over the ocean in DJF in low to mid-southern latitudes is
   A strengthening of the Hadley circulation in the SH is sim-   also evident in the PMIP4 multi-model mean, indicating that
ulated in DJF (Fig. 8). It contributes to the simulated drier    the ACCESS-ESM1.5 lig127k simulation provides a good
conditions in the subtropics at ∼ 30◦ S due to greater sub-      representation of the LIG features as simulated by coupled
sidence, as seen from the increase in surface pressures over     climate models. Despite the strong signal emanating from
land. The southern boundary of the Hadley cell also experi-      the lig127k simulations, these precipitation anomalies are not
ences a slight northward shift, from ∼ 36 to ∼ 33◦ S (see the    necessarily evident from SH paleoproxy records, highlight-
zero contour in Fig. 8), which pushes regions of high pres-      ing the need for additional hydrological records from low and
sure in the subtropics to the north (Fig. 4f). This favours an   mid-southern latitudes. Furthermore, the lig127k is an equi-
anomalous subsidence and weaker convection over the SH           librium simulation, which does not take into account poten-
convergence zones thus reducing monsoonal precipitation.         tial meltwater discharges from the Antarctic and Greenland
                                                                 ice sheets, and their associated impact on deep water forma-
                                                                 tion and therefore variability in ocean and atmospheric circu-
                                                                 lation (e.g. Hayes et al., 2014; Rohling et al., 2019; Tzedakis
                                                                 et al., 2018). The time evolution across the LIG of the hydro-
                                                                 logical proxy records should thus be looked at in detail, and

https://doi.org/10.5194/cp-17-869-2021                                                        Clim. Past, 17, 869–885, 2021
880 N. K.-H. Yeung et al.: Monsoons at the LIG Figure 8. Atmospheric mass stream function in DJF, represented by solid (positive) and dashed (negative) contour lines, is contoured every 20 Sv, with the bold lines being the zero contours. Zonal mean zonal winds (m s−1 ) are represented by colour shading. (a) LIG. (b) PI. Note the shading interval is not linear. additional LIG experiments including North Atlantic and/or rainfall variability and, to a lesser extent, mean precipita- Southern Ocean meltwater pulses should be performed. tion over the monsoon regions. Indeed a recent study shows The orbital forcings and latitude–month insolation anoma- that ENSO variability was shown to be consistently reduced lies relative to PI values are similar between the LIG and during the LIG compared to PI, with the ensemble mean of mid-Holocene (6 ka). SH monsoons are also weakened and PMIP4 simulations suggesting a 20 % weakening of ENSO contracted during the mid-Holocene (D’Agostino et al., amplitude (Brown et al., 2020a). To what extent an ENSO 2020), with similar SH land–sea precipitation contrast pat- weakening may have contributed to mean state changes over terns compared to lig127k. The reduced monsoonal precipi- the SH monsoon system is unclear and a subject for future tation in the mid-Holocene is largely attributed to changes in exploration. atmospheric mean flow (i.e. the Walker and Hadley circula- A significant reduction in precipitation in the tropical re- tions) and the decrease in net energy input (D’Agostino et al., gions of the SH would have impacted vegetation during the 2020). While an energetic approach is beyond the scope of LIG. Changes in vegetation cover are not taken into account this study, the weakening of SH monsoons in our lig127k in our study, but the LAI was interactive in the model. The simulation are indeed associated with weaker local insola- simulated change in LAI is consistent with precipitation. For tion during the wet season, which leads to reduced surface example, the LAI is decreased during boreal summer and au- air temperature (Fig. 2a) and increased surface pressure over tumn at ∼ 50◦ N across Eurasia and North America in regions land (Fig. 4f). One can therefore hypothesise that the weak- with less summer rainfall during the LIG (Fig. S4). In con- ening of SH monsoons in lig127k might also be associated trast, increased precipitation over the Sahel and surrounding with a similar decrease in net energy input. Furthermore, as regions (Fig. 6a) corresponds to elevated LAI. This affects the changes in the Walker and Hadley cells are not analysed evapotranspiration, as an increase in LAI enhances canopy in detail here, a closer examination of the relationship be- evapotranspiration, while reducing soil evaporation, and ulti- tween SH monsoons and these large-scale atmospheric cir- mately also alters the hydrological cycle. culations is recommended for future studies. It has been previously shown that due to changes in albedo Additional studies looking into the details of the mecha- and moisture availability, changes in vegetation might am- nisms leading to changes in the SH monsoon systems, and plify the changes in precipitation (e.g. Messori et al., 2019). their relationship to low-latitude modes of variability, such For example, a large increase in precipitation over the Sa- as the El Niño–Southern Oscillation and the Indian Ocean hel would lead to a greening of the Sahara (Hopcroft et al., Dipole, are needed. Under LIG conditions, these modes of 2017; Larrasoaña et al., 2013; Osborne et al., 2008; Pausata variability might be altered in terms of magnitude and spa- et al., 2020). The greening would tend to increase the sensi- tial variation, which might have contributed to changes in ble and latent heat fluxes into the atmosphere and produce a Clim. Past, 17, 869–885, 2021 https://doi.org/10.5194/cp-17-869-2021
N. K.-H. Yeung et al.: Monsoons at the LIG                                                                                           881

cyclonic circulation anomaly over the Sahara, whose anoma-           Supplement. The supplement related to this article is available
lous westerly flow would transport more moisture from the            online at: https://doi.org/10.5194/cp-17-869-2021-supplement.
neighbouring Atlantic Ocean into the region (Messori et al.,
2019; Patricola and Cook, 2007; Rachmayani et al., 2015).
Additional simulations with interactive vegetation, or with          Author contributions. NKHY performed the bulk of model inte-
prescribed changes in vegetation cover, should thus be per-          gration, analysis and writing. LM, KJM and AST provided support
formed to quantify the coupled effect of precipitation and           to the interpretation of results and writing. TZ and MC contributed
                                                                     to the model setup and troubleshooting.
vegetation changes.
   Due to the importance of the SH monsoon systems for
water availability, such reduced precipitation in the south-
                                                                     Competing interests. The authors declare that they have no con-
ern tropics in a past warmer world are concerning. How-              flict of interest.
ever, since these negative precipitation anomalies mostly
result from the strong cooling over land, such hydrolog-
ical changes are not currently expected over the coming              Special issue statement. This article is part of the special issue
centuries under the RCP/SSP (Representative Concentration            “Paleoclimate Modelling Intercomparison Project phase 4 (PMIP4)
Pathway/Shared Socioeconomic Pathways) scenarios where               (CP/GMD inter-journal SI)”. It is not associated with a conference.
future climate changes are due to greenhouse gas forcing
and not to changes in orbital parameters. In fact, moisture
budget analysis has shown that the SH monsoon expands                Acknowledgements. Computational resources were provided by
and intensifies under the RCP8.5 scenario (D’Agostino et al.,        the NCI National Facility at the Australian National University,
2020). Incidentally, lig127k shows increased precipitation at        through awards under the Merit Allocation Scheme, the Intersect
the southeastern edge of the SPCZ, which is associated with          allocation scheme, and the UNSW HPC at NCI scheme. Nicholas
the weakening of the local high-pressure region. Such en-            King-Hei Yeung also acknowledges the Research Training Program
hanced moisture at the eastern SPCZ margin is also linked            provided by the Australian government, a top-up scholarship pro-
                                                                     vided by the Climate Change Research Centre and support from the
to a reduction in trade wind inflow from the southeastern Pa-
                                                                     ARC Centre of Excellence for Climate Extremes.
cific (Fig. 6b), as previously demonstrated by Lintner and
Neelin (2008). Interestingly, CMIP5 models project drier
conditions over the southeastern edge of the SPCZ due to
                                                                     Financial support. This research has been supported by the Aus-
the transport of dry subtropical air into the region (Brown          tralian Research Council (grant nos. DP180100048, FT180100606
et al., 2020b), thus suggesting a different mechanism can take       and FT160100495).
place in a warmer climate. CMIP6 future projections indeed
generally simulate no significant changes in the Australian,
South African and South American monsoons by 2100 under              Review statement. This paper was edited by Julien Emile-Geay
all SSP scenarios, while drier conditions are simulated over         and reviewed by Josephine Brown and Anni Zhao.
these regions in JJA (Cook et al., 2020). In Australia, north-
ern rainfall in DJFMAM is more constrained in CMIP6 than
in CMIP5, and it is projected to experience a ∼ 2 % increase
                                                                     References
by the year 2090 under a high-emission scenario (RCP8.5
and SSP5-85; Grose et al., 2020), which is a small change
                                                                     Axford, Y., Briner, J. P., Francis, D. R., Miller, G. H.,
compared to the decrease in our LIG simulation (Fig. 7).                Walker, I. R., and Wolfe, A. P.: Chironomids record ter-
   In conclusion, drier conditions are simulated over SH land           restrial temperature changes throughout Arctic interglacials
during austral summer in the lig127k experiment and all SH              of the past 200,000 yr, GSA Bulletin, 123, 1275–1287,
monsoons are found to be consistently weaker compared to                https://doi.org/10.1130/B30329.1, 2011.
PI. At the same time, summer precipitation over southern             Bartlein, P. J. and Shafer, S. L.: Paleo calendar-effect adjustments
tropical oceans is higher, associated with a southward shift            in time-slice and transient climate-model simulations (PaleoCal-
of the ITCZ in DJF in the Indian and Atlantic Oceans. The               Adjust v1.0): impact and strategies for data analysis, Geosci.
dry conditions are caused by reduced land–sea temperature               Model Dev., 12, 3889–3913, https://doi.org/10.5194/gmd-12-
contrast due to cooling over land, and also higher mean sea             3889-2019, 2019.
                                                                     Berger, A.: Long-Term Variations of Daily Insola-
level pressure attributed from greater subsidence as the SH
                                                                        tion and Quaternary Climatic Changes, J. Atmos.
Hadley cell strengthens.
                                                                        Sci.,     35,      2362–2367,       https://doi.org/10.1175/1520-
                                                                        0469(1978)0352.0.CO;2, 1978.
                                                                     Bi, D., Dix, M., Marsland, S., O’Farrell, S., Rashid, H., Uotila,
Data availability. The model results of the lig127k simulation are      P., Hirst, A., Kowalczyk, E., Golebiewski, M., Sullivan, A.,
archived on the CMIP6 ESGF website at https://doi.org/10.22033/         Yan, Y., Hannah, N., Franklin, C., Sun, Z., Vohralik, P.,
ESGF/CMIP6.13703 (Yeung et al., 2019).                                  Watterson, I., Zhou, K., Fiedler, R., Collier, M., and Puri,

https://doi.org/10.5194/cp-17-869-2021                                                               Clim. Past, 17, 869–885, 2021
882 N. K.-H. Yeung et al.: Monsoons at the LIG K.: The ACCESS coupled model: Description, control cli- house Gas–Induced Global Warming, J. Climate, 33, 9595–9613, mate and evaluation, Aust. Meteorol. Ocean., 63, 41–64, https://doi.org/10.1175/JCLI-D-19-0672.1, 2020. https://doi.org/10.22499/2.6301.004, 2012. Dutton, A. and Lambeck, K.: Ice Volume and Sea Level Brierley, C. M., Zhao, A., Harrison, S. P., Braconnot, P., Williams, During the Last Interglacial, Science, 337, 216–219, C. J. R., Thornalley, D. J. R., Shi, X., Peterschmitt, J.-Y., Ohgaito, https://doi.org/10.1126/science.1205749, 2012. R., Kaufman, D. S., Kageyama, M., Hargreaves, J. C., Erb, M. Dutton, A., Carlson, A. E., Long, A. J., Milne, G. A., P., Emile-Geay, J., D’Agostino, R., Chandan, D., Carré, M., Clark, P. U., DeConto, R., Horton, B. P., Rahmstorf, S., Bartlein, P. J., Zheng, W., Zhang, Z., Zhang, Q., Yang, H., and Raymo, M. E.: Sea-level rise due to polar ice-sheet Volodin, E. M., Tomas, R. A., Routson, C., Peltier, W. R., Otto- mass loss during past warm periods, Science, 349, 6244, Bliesner, B., Morozova, P. A., McKay, N. P., Lohmann, G., https://doi.org/10.1126/science.aaa4019, 2015. Legrande, A. N., Guo, C., Cao, J., Brady, E., Annan, J. D., Eyring, V., Bony, S., Meehl, G. A., Senior, C. A., Stevens, B., and Abe-Ouchi, A.: Large-scale features and evaluation of the Stouffer, R. J., and Taylor, K. E.: Overview of the Coupled PMIP4-CMIP6 midHolocene simulations, Clim. Past, 16, 1847– Model Intercomparison Project Phase 6 (CMIP6) experimen- 1872, https://doi.org/10.5194/cp-16-1847-2020, 2020. tal design and organization, Geosci. Model Dev., 9, 1937–1958, Brown, J. R., Brierley, C. M., An, S.-I., Guarino, M.-V., Steven- https://doi.org/10.5194/gmd-9-1937-2016, 2016. son, S., Williams, C. J. R., Zhang, Q., Zhao, A., Abe-Ouchi, Francis, D. R., Wolfe, A. P., Walker, I. R., and Miller, G. H.: In- A., Braconnot, P., Brady, E. C., Chandan, D., D’Agostino, terglacial and Holocene temperature reconstructions based on R., Guo, C., LeGrande, A. N., Lohmann, G., Morozova, P. midge remains in sediments of two lakes from Baffin Island, A., Ohgaito, R., O’ishi, R., Otto-Bliesner, B. L., Peltier, W. Nunavut, Arctic Canada, Palaeogeogr. Palaeocl., 236, 107–124, R., Shi, X., Sime, L., Volodin, E. M., Zhang, Z., and Zheng, https://doi.org/10.1016/j.palaeo.2006.01.005, 2006. W.: Comparison of past and future simulations of ENSO in Fréchette, B., Wolfe, A. P., Miller, G. H., Richard, P. J. H., and CMIP5/PMIP3 and CMIP6/PMIP4 models, Clim. Past, 16, de Vernal, A.: Vegetation and climate of the last interglacial on 1777–1805, https://doi.org/10.5194/cp-16-1777-2020, 2020a. Baffin Island, Arctic Canada, Palaeogeogr. Palaeocl., 236, 91– Brown, J. R., Lengaigne, M., Lintner, B. R., Widlansky, M. J., 106, https://doi.org/10.1016/j.palaeo.2005.11.034, 2006. van der Wiel, K., Dutheil, C., Linsley, B. K., Matthews, A. J., and Galaasen, E. V., Ninnemann, U. S., Irvalı, N., Kleiven, H. Renwick, J.: South Pacific Convergence Zone dynamics, vari- K. F., Rosenthal, Y., Kissel, C., and Hodell, D. A.: Rapid ability and impacts in a changing climate, Nature Reviews Earth Reductions in North Atlantic Deep Water During the Peak & Environment, 1, 530–543, https://doi.org/10.1038/s43017- of the Last Interglacial Period, Science, 343, 1129–1132, 020-0078-2, 2020b. https://doi.org/10.1126/science.1248667, 2014. CAPE-Last Interglacial Project Members: Last Interglacial Galaasen, E. V., Ninnemann, U. S., Kessler, A., Irvalı, N., Rosen- Arctic warmth confirms polar amplification of cli- thal, Y., Tjiputra, J., Bouttes, N., Roche, D. M., Kleiven, H. mate change, Quaternary Sci. Rev., 25, 1383–1400, K. F., and Hodell, D. A.: Interglacial instability of North https://doi.org/10.1016/j.quascirev.2006.01.033, 2006. Atlantic Deep Water ventilation, Science, 367, 1485–1489, Capron, E., Govin, A., Stone, E. J., Masson-Delmotte, V., Mulitza, https://doi.org/10.1126/science.aay6381, 2020. S., Otto-Bliesner, B., Rasmussen, T. L., Sime, L. C., Wael- Griffies, S. M.: Elements of the Modular Ocean Model (MOM) broeck, C., and Wolff, E. W.: Temporal and spatial structure 5 (2012 release with updates), Technical Report 7, Tech. rep., of multi-millennial temperature changes at high latitudes dur- NOAA/Geophysical Fluid Dynamics Laboratory Ocean Group, ing the Last Interglacial, Quaternary Sci. Rev., 103, 116–133, available at: https://mom-ocean.github.io/assets/pdfs/MOM5_ https://doi.org/10.1016/j.quascirev.2014.08.018, 2014. manual.pdf (last access: 21 April 2021), 2014. Capron, E., Govin, A., Feng, R., Otto-Bliesner, B., and Wolff, Grose, M. R., Narsey, S., Delage, F. P., Dowdy, A. J., Bador, E.: Critical evaluation of climate syntheses to benchmark M., Boschat, G., Chung, C., Kajtar, J. B., Rauniyar, S., Fre- CMIP6/PMIP4 127 ka Last Interglacial simulations in the und, M. B., Lyu, K., Rashid, H., Zhang, X., Wales, S., Tren- high-latitude regions, Quaternary Sci. Rev., 168, 137–150, ham, C., Holbrook, N. J., Cowan, T., Alexander, L., Ar- https://doi.org/10.1016/j.quascirev.2017.04.019, 2017. blaster, J. M., and Power, S.: Insights From CMIP6 for Aus- Carvalho, L. M. V., Jones, C., and Liebmann, B.: Extreme Precip- tralia’s Future Climate, Earth’s Future, 8, e2019EF001469, itation Events in Southeastern South America and Large-Scale https://doi.org/10.1029/2019EF001469, 2020. Convective Patterns in the South Atlantic Convergence Zone, J. Hayes, C. T., Martínez-García, A., Hasenfratz, A. P., Jaccard, Climate, 15, 2377–2394, 2002. S. L., Hodell, D. A., Sigman, D. M., Haug, G. H., and An- Ceppi, P., Hwang, Y.-T., Liu, X., Frierson, D. M. W., and Hart- derson, R. F.: A stagnation event in the deep South Atlantic mann, D. L.: The relationship between the ITCZ and the South- during the last interglacial period, Science, 346, 1514–1517, ern Hemispheric eddy-driven jet, J. Geophys. Res.-Atmos., 118, https://doi.org/10.1126/science.1256620, 2014. 5136–5146, https://doi.org/10.1002/jgrd.50461, 2013. Hoffman, J. S., Clark, P. U., Parnell, A. C., and He, F.: Regional and Cook, B. I., Mankin, J. S., Marvel, K., Williams, A. P., Smer- global sea-surface temperatures during the last interglaciation, don, J. E., and Anchukaitis, K. J.: Twenty-First Century Drought Science, 355, 276–279, https://doi.org/10.1126/science.aai8464, Projections in the CMIP6 Forcing Scenarios, Earth’s Future, 8, 2017. e2019EF001461, https://doi.org/10.1029/2019EF001461, 2020. Hopcroft, P. O., Valdes, P. J., Harper, A. B., and Beerling, D’Agostino, R., Brown, J. R., Moise, A., Nguyen, H., Dias, P. L. S., D. J.: Multi vegetation model evaluation of the Green Sa- and Jungclaus, J.: Contrasting Southern Hemisphere Monsoon hara climate regime, Geophys. Res. Lett., 44, 6804–6813, Response: MidHolocene Orbital Forcing versus Future Green- https://doi.org/10.1002/2017GL073740, 2017. Clim. Past, 17, 869–885, 2021 https://doi.org/10.5194/cp-17-869-2021
You can also read