SEPTEMBER 2018 - Committee for Sydney
←
→
Page content transcription
If your browser does not render page correctly, please read the page content below

SEPTEMBER 2018
FOREWORD

Dexus and Landcom                         This year’s report shows a city
                                          continuing to perform strongly on a
are pleased to support
                                          global scale, scoring well as a home
Sustaining the Advantage,                 for global firms and a destination for
the third in the series of                globally significant investment. Indeed,
benchmarking reports on                   in some rankings Sydney measures
Sydney developed by the                   third in the world – behind the
                                          megacities of London and New York.
Committee for Sydney and
the Business of Cities.                   The report also addresses the
                                          importance of sustaining Sydney’s
This insightful research highlights       performance, identifying a number of       Darren Steinberg,
Sydney’s strengths and weaknesses,        areas to consider when planning for        CEO – Dexus
helping civic leaders and key             rapid growth.
stakeholders plan for future growth
                                          We commend this report and look
while addressing the pain points.
                                          forward to its findings contributing
Benchmarking is an important              to the ongoing debate about our
measure of our progress against           city’s future.
other comparable world cities. While
benchmarking cities and regions
has become commonplace within
Australia, comparisons on the world
stage are less available, and we are
proud to be supporting the Committee
for Sydney in leading this thinking.
There is further value in the annual                                                 John Brogden AM,
publication of this benchmarking data.                                               CEO – Landcom
Three years on from the first Sydney
benchmarking report, we are gaining a
deeper understanding of the progress
and investment made by government
and the private sector towards changing
the lived experience of our city.

Cover image Destination NSW
EXECUTIVE
SUMMARY

Sydney is a global metropolis
moving to the next level.
It is right in the middle of a
remarkable cycle of growth –
in population, infrastructure
and economy – and this
is driving unprecedented
business and investor demand.

                                                                                                     Image City of Canterbury-Bankstown

Sydney’s economic transition, spatial development, and             THE EVIDENCE BASE
global integration is propelling the region towards new
                                                                   This 3rd edition of Committee for Sydney’s benchmarking
levels of achievement and the opportunity to engage in
                                                                   report reviews Sydney’s performance over the last 12
many global networks.
                                                                   months. It draws on a meta-analysis across 70 global indices,
For Sydney, as for other advanced global cities, this success      35,000 data points, and more than 200,000 underlying
also has consequences. New challenges emerge that                  metrics. Sydney’s progress is then reviewed across 14
require even closer attention and more active management.          indicators in comparison with more than 30 peer cities
Consequently Sydney is beginning the journey towards a             around the world – these are very high performing cities
more managed metropolis. Metropolitan Sydney is taking             that combine both strong business and liveability offers.
shape, with an inspiring Metropolitan Plan and a much
                                                                   In 2018, Sydney’s global visibility has improved. It is
needed cycle of infrastructure investment. As Sydney grows
                                                                   appearing in more global benchmarks and rankings than
and takes its place on the world stage, its character, identity,
                                                                   ever – in this medium it is the highest profile city in the
performance, and its global peer group, are all changing.
                                                                   Southern Hemisphere. Its global visibility will continue
Global city benchmarks are one resource that can help to           to grow, it has momentum. The field of city benchmarks
make sense of this pace of change. Tracking as they do             has also been changing. With the arrival of more indices
the ups and downs of the world’s cities, the more than 400         from new providers, more media attention is being paid to
global studies of cities reveal the larger dynamics of change      distinct themes, ways of understanding how cities really
and the rationale for why cities have to adapt and improve.        perform, and how they are coping with the challenges of
They identify key underlying trends and imperatives that           growth. Importantly, these benchmarks are now measuring
need attention. For Sydney, a metropolitan city with special       Sydney almost always at its full metropolitan scale – the
advantages and on the cusp of rapid change, benchmarks             5 million metropolis of Greater Sydney, rather than the
can reveal a fresh and forward-looking perspective on the          municipal entity of the City of Sydney.
opportunities and challenges that lie ahead.

                                                                                                                                          1
This 3rd edition reviews this expanding body of analysis             Sydney’s liveability model is also questioned by
    and identifies six core findings:                                    benchmarks of culture which suggest that the city has
                                                                         been relying on an ‘events and bed-nights’ based cultural
    1. Sydney has consolidated its place among the top                   economy (consumption) more than one driven by
       global contenders                                                 creativity, cutting edge art, place-making, and optimising
                                                                         the culture eco-system. Culture in Sydney is oriented
      In 2017 we observed that Sydney had come to form part
                                                                         more towards the visitor economy than resident quality
      of a high performing second tier of 10 elite global city
                                                                         of life.
      ‘contenders’, all vying to join the top table of 7 cities that
      have established global functions, and enjoy greatest              As the benchmarks continue to observe such edges,
      global reach. Sydney has now cemented its position in              these issues require attention as they impact on both
      this contender group.                                              resident experience, and wider strategic imperatives to
                                                                         attract and retain talent.
      Sydney’s population is growing faster than the majority
      of contenders, and demand for Sydney’s assets and                3. Sydney’s brand remains compelling but living up to
      opportunities from global corporates, capital, students,            brand promise is becoming more of a challenge
      talent, visitors and other customers is all up, buoyed by
                                                                         Sydney’s scores remain very high and are improving for
      our magnet brand, the surge in infrastructure investment,
                                                                         visitor brand and appeal, and for the investor brand in
      and the longer-term pipeline for growth. In particular,
                                                                         real estate. Here the city is still among the very best in the
      Sydney has excelled in terms of its higher education
                                                                         world amid strong competition.
      performance, both as an export market success and in
      terms of research quality. The data also highlights the            But since 2017 there has been a decline in performance
      way that international students are increasingly playing           in measures that include the quality of visitor experience.
      an ambassadorial role for Sydney, contributing to its              This partly reflects the improvements of other cities
      positive brand. Sydney’s global appeal continues to grow.          that manage tourism overflows, invest in pathfinding
                                                                         and storytelling, and provide a mix of opportunities and
    2. Sydney’s liveability equation is changing                         locally generated amenities to all visitor types.
      As expected, Sydney’s health, safety, life expectancy              Meanwhile Sydney’s score in measures of soft power –
      and natural environment ratings are high and, in some              which reflect its status as a centre of influence, diplomacy
      cases, improving. Well-being indexes continue to show              and institutional reach – remain behind other contender
      Sydney near the very top of the global charts. Sydney              cities such as Amsterdam and Shanghai. These cities
      is also revealing itself to be a leading city of freedom           are making important efforts in this space to attract
      and tolerance.                                                     institutions, cluster global NGOs, host gatherings of
      But this year, as urban population grows globally and              influencers and to establish their distinctive contribution
      there is more focus on how well cities manage growth,              to the world, reflecting their confident metropolitan
      there are many signs that Sydney’s inherited liveability           identity. These studies suggest that Sydney’s brand
      equation is changing. Relative to other cities, employee           identity is compelling but incomplete as it does not yet
      life satisfaction has fallen from its very high level. New         include a clear cultural and business story to the world.
      measures of everyday experience and soft factors of
      amenities, vibrancy and quality of place see Sydney
      slightly losing its position, as other cities improve and
      as data on the whole of Greater Sydney becomes
      increasingly available. Declining affordability of housing
      for long term residents is another influential factor, with
      knock on effects on measures of Sydney’s social fairness
      and cohesion.

2                                                                       Sustaining the Advantage | Benchmarking Sydney’s Performance 2018
5. Sydney’s smaller-sized innovation economy has
                                                                         limited capacity to attract, accommodate and retain
                                                                         talent, and is a barrier to taking the next step
                                                                        Despite superb knowledge production capabilities,
                                                                        there is a present risk of Sydney missing out on its
                                                                        full potential in the innovation economy. Sydney
                                                                        is consistently outside the top 20 in innovation
                                                                        assessments – benchmarks show more gravitational
                                                                        pull to leading global innovation hubs.
                                                                        The gap between university performance and innovation
                                                                        performance is notably high for Sydney. Attracting large
                                                                        numbers of international students to prestigious institutions
                                                                        is clearly an important growth dimension of Sydney’s
                                                                        economy. But there is a potential risk that ‘exporting degrees’
                                                                        to high numbers of international students is prioritised at the
                                                                        expense of hosting an advanced innovation economy that
                                                                        promotes invention and discovery, leverages cutting edge
                                                                        knowledge, and generates enterprise growth. These need
                                                                        not be alternatives.
                                                                        The benchmarks analysis suggests that efforts to turbo
                                              Image Destination NSW     charge the innovation economy are still nascent. There
                                                                        may be a focus on innovation precincts coming ahead
                                                                        of the innovation eco-system requirements – including
4. International assessment comparisons on Transport
                                                                        the presence of firms in competitive sectors, overcoming
   and Infrastructure have not caught up with the recent
                                                                        siloed work habits, incentives for entrepreneurship,
   surge in investment in Sydney, so the city is not yet
                                                                        affordability for start-ups, and availability of risk capital.
   getting credit for the investment and is at a low point
   in the cycle                                                         The small size of the innovation economy is one reason
  As Sydney awaits the dividend of the much-needed                      we observe more examples in 2018 where measures of
  infrastructure boost, benchmarks of commuting reliability             talent see a fall for Sydney. Talent attraction and appeal
  and public transport are intensifying world-wide. For                 is high, but retention of talent via the innovation system
  Sydney they are becoming an area of even more                         and through the career cycle appears to be an emerging
  comparative disadvantage, as other cities make more                   obstacle for Sydney.
  rapid progress, and have started from a base of larger
  and more integrated public transport network. Sydney is             6. Benchmarks are switching from cities’ inherited assets
  engaged in a shift towards metropolitan systems, a modal               to systems co-ordination – Sydney needs to be vigilant
  change towards public transport, and is catching up with               as the focus changes.
  population growth.                                                    The new ways that city data is now being assembled and
                                                                        aggregated allows more creative ways to measure city
  Meanwhile there is also a visible relative decline in
                                                                        success. For example, City Sustainability and Resilience
  Sydney’s digital infrastructure, with other global cities
                                                                        are becoming less about green space and the benefits
  having moved faster on Wi-Fi hotspots and high-
                                                                        of low density, and more about effective policies, working
  speed broadband.
                                                                        incentives, governance and co-ordination, measured
  Some more recent measures reflect Sydney’s current                    behaviour change, land use efficiency, and supply
  cycle of investment, but in general it may take time for              chain management.
  the present surge of investment to produce much ‘catch
                                                                        How cities manage their assets, what is the long-term
  up’ in Sydney’s performance against the top ranked cities.
                                                                        multi-cycle governance, and whether there is broad
  Importantly, global perceptions of Sydney have not                    commitment to address weaknesses, are all priority
  caught up with this. Sydney’s infrastructure deficits are             questions among the more insightful benchmark studies.
  not well known by global public opinion and are not                   These insights give observers a new look at the future
  reflected in more general surveys of cities. This is a short-         prospects of cities beyond the current cycle.
  term reputational advantage, but it could become a risk
                                                                        This will help Sydney continue to assess its cycle of change
  in the future if greater progress is not sustained
                                                                        and reform in light of what others are doing. It may also
                                                                        reinforce the imperative to continue to invest, innovate,
                                                                        plan, and cordinate. Sydney still has the attributes to attract
                                                                        growth and perform well, but is now being assessed more
                                                                        on ability to manage growth and transition.

                                                                                                                                          3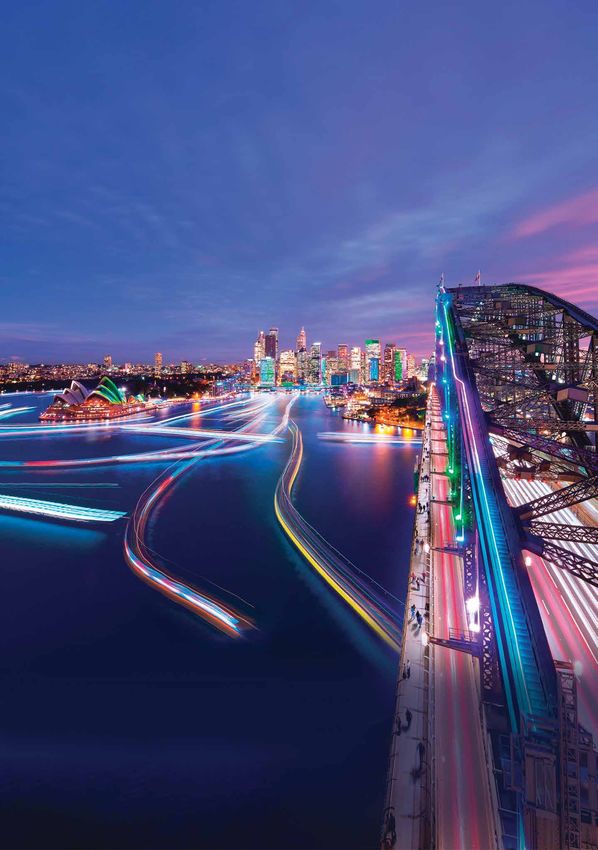
SYDNEY’S
    PERFORMANCE
    IN 2018

    Figure 1: Sydney’s relative performance in each area compared to its peers

                                                    2016
     GLOBAL FIRMS                                   2017
                                                    2018
                                                    2016
     BUSINESS FRIENDLINESS                          2017
                                                    2018                                                   BUSINESS
                                                    2016                                                   AND FINANCE
     FINANCE SERVICES                               2017
                                                    2018
                                                    2016
     INVESTMENT ATTRACTION                          2017
                                                    2018
                                                    2016
     TALENT AND LABOUR MARKET                       2017
                                                    2018
                                                    2016
     HIGHER EDUCATION                               2017
                                                                                                           KNOWLEDGE
                                                    2018
                                                    2016                                                   ECONOMY
     R&D AND INNOVATION                             2017
                                                    2018
                                                    2016
     LIVEABILITY                                    2017
                                                    2018
                                                    2016
     WAGES AND COSTS                                2017
                                                    2018                                                   LIFESTYLE AND
                                                    2016                                                   ENVIRONMENT
     SUSTAINABILITY                                 2017
                                                    2018
                                                    2016
     TRANSPORT AND INFRASTRUCTURE                   2017
                                                    2018
                                                    2016
     CULTURE AND DIVERSITY                          2017
                                                    2018
                                                    2016                                                   CULTURE AND
     VISITOR AND DESTINATION APPEAL                 2017
                                                                                                           DESTINATION
                                                                                                           APPEAL
                                                    2018
                                                    2016
     IMAGE, BRAND AND INFLUENCE                     2017
                                                    2018

                    0           1     2   3     4          5    6         7        8         9        10

    Source: The Business of Cities.

4                                                               Sustaining the Advantage | Benchmarking Sydney’s Performance 2018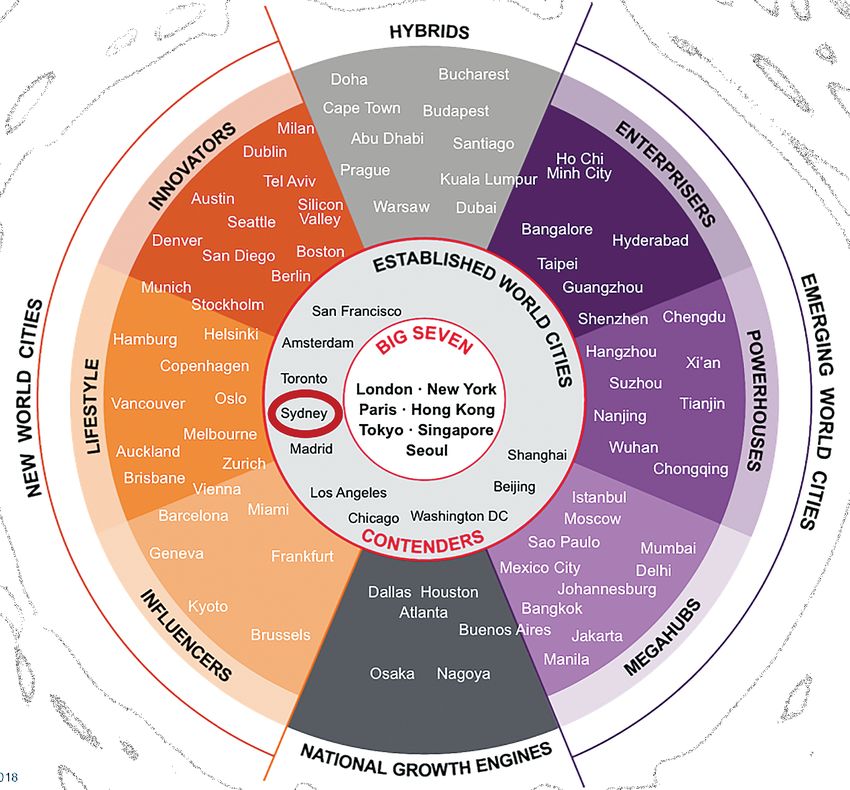
Image Destination NSW

For each of the 14 indicators, Sydney has been evaluated        peer group as used in 2016 and 2017, for consistency and
in relevant multiple comparative benchmarks. In each            comparability. Decile position is based on position among
category, Sydney’s performance is graded on a 10-point          the 33 city group, with figures rounded. e.g. 3rd/33 = 1st Decile.
scale, based on its performance against all comparator cities   7th = 2nd Decile. 17th = 6th Decile.
from within the peer group of 33 selected. This is the same

The cities compared (33 in all) are:
•• Amsterdam                    •• Hamburg                      •• Osaka                          •• Toronto
•• Barcelona                    •• Hong Kong                    •• Paris                          •• Vancouver
•• Berlin                       •• London                       •• San Francisco                  •• Vienna
•• Boston                       •• Madrid                       •• Seattle                        •• Washington D.C.
•• Brisbane                     •• Melbourne                    •• Seoul                          •• Warsaw
•• Brussels                     •• Miami                        •• Singapore                      •• Zurich
•• Buenos Aires                 •• Milan                        •• Stockholm
•• Chicago                      •• Montreal                     •• Sydney
•• Frankfurt                    •• Munich                       •• Tel Aviv

                                                                                                                                       5
INTRODUCTION:
    SYDNEY’S
    GROWTH
    CYCLE IN
    PERSPECTIVE

                                                                                                                     Image Destination NSW

    SYDNEY THE CONTENDER                                              In the last five years, the data and benchmarks of cities
                                                                      demonstrate that Sydney has established itself in a high-
    The universe of city benchmarks has become a very
                                                                      performing ‘second division’ of ‘Contenders’. This group
    useful tool for those interested in the future of cities. There
                                                                      of 10 cities have separated themselves from the rest
    are now more than 400 benchmarks of cities globally,
                                                                      and possess the assets and aspirations to join the long
    spanning nearly every dimension of urban performance,
                                                                      established global centres – London, New York, Hong Kong,
    and surveying multiple types of ‘customers’ and ‘audiences’
                                                                      Singapore, Seoul, Paris and Tokyo.
    for hundreds of cities. These benchmark results altogether
    comprise well over 100,000 data points of city scores and
    relative positions, which are themselves informed by over
    a million indicators and sub-indicators.
    Benchmarks have many uses and purposes. One way to
    apply the growing body of city benchmarks produced
    around the world is to assess cities’ capability and readiness
    to compete successfully in a variety of globally traded
    markets, and to manage their growth as they compete
    globally and attract new kinds of activity. Benchmarks can
    help to spot patterns of cities sharing similar profiles and
    strategic perspectives over more than one cycle.

6                                                                      Sustaining the Advantage | Benchmarking Sydney’s Performance 2018
Source: JLL/The Business of Cities1

Sydney has become a core member of this group of ‘contenders’ as it has developed its
metropolitan scale, become a popular choice for global investment capital, and become a
gateway to international students, all while continually expanding its visitor and corporate
economies. In this sense it shares many characteristics with Toronto, San Francisco,
Amsterdam and others. As a result, it is a city that retains huge global appeal and attraction,
while also experiencing very distinct and novel challenges about how to manage and
optimise the demand.

                                                                                                  7
SYDNEY’S GLOBAL POSITION
    As a metropolitan region, Greater Sydney is growing faster than most. As an urban region
    it is now among the 75 largest in the world by population, and its total economic output
    places it among the 50 largest urban economies. Overall, Sydney’s combined scale puts the
    city on a par with Greater Miami, Greater Toronto and Metropolitan Barcelona, three cities
    with which it shares many inherited features and assets (see Table 1).

    Table 1: Sydney’s key metropolitan level statistics, 2017
                                                                                                                               Global position
            Population                                                                              5.1 million                               74th
            GDP                                                                                 $254 billion                              50th
    Source: JLL.

    Sydney’s recent rate of growth continues to exceed that of most other similar cities. From
    2000 to 2016, among its 33 core peers identified in this report, all successful growing cities,
    Sydney is among the 10 fastest growing in terms of jobs and population. It is growing faster
    than other contenders such as Toronto, Madrid, Amsterdam and Washington D.C. Looking
    ahead it stands out for being among a group of advanced cities that are growing well above
    average in terms of both economy and population (see Figure 2). This growth is set to
    continue over the next period, with total population growth surpassing 100,000 annually.2
    Up to 2025, Sydney’s growth pattern more closely resembles other success stories such as
    Stockholm and Vancouver.

    Figure 2: GDP per capita and population growth by city, 2015-2025
                                   1.6%
                                                                                           Brisbane
                                   1.4%                                                                             Tel Aviv
                                                                                     Melbourne
                                   1.2%          Zurich    Vancouver          Stockholm       Singapore
    Annual population growth (%)

                                                             Toronto
                                                                                           Sydney              HIGH
                                   1.0%                                                    Washington D.C.     GROWTH
                                                            Montréal                        Seattle
                                   0.8%                   Amsterdam                         London       Buenos Aires
                                                                            Miami
                                                           Vienna
                                                           Munich                 Paris      Madrid
                                   0.6%                                                     Barcelona
                                                  Brussels    Frankfurt                                       Hong Kong
                                                                                            Boston
                                                                          Chigaco      San Franciso
                                   0.4%
                                             LOW                          Hamburg
                                             GROWTH                         Berlin
                                                                                                       MEDIUM                              Warsaw
                                   0.2%                                                                GROWTH
                                                           Milan
                                                                                     Osaka
                                   0.0%
                                          0.0%    0.3%    0.6%     0.9%    1.2%     1.5%     1.8%     2.1%   2.4%      2.7%     3.0%   3.3%
                                                                           Annual GDP per capita growth (%)
    Sources: McKinsey Urban World, UN

8                                                                                                                 Sustaining the Advantage | Benchmarking Sydney’s Performance 2018
The distinctive character of Sydney’s growth presents many opportunities, but also
risks. Rapid growth requires sharper growth management. More will depend on Sydney
developing the toolkit and growing its metropolitan institutions to manage growth in a way
that sustains the city’s lifestyle, appeal and reputation. The launch of the Greater Sydney
Commission’s new A Metropolis of 3 Cities plan, in tandem with the State Infrastructure
Strategy, is one important step forward in this regard. Benchmarks will become an
important tool for assessing this progress.
In terms of economic size, Sydney’s neighbouring peers include Toronto and Barcelona.
However, despite growth Sydney still ranks just 131st globally for GDP per capita, putting
it on a par with larger European cities such as Madrid and Milan (see Table 2).
Table 2: Sydney’s economy in relation to its neighbours and global peers, 2017
GDP per GDP per
GDP ($US bn) GDP rank
capita ($US) capita rank
Chicago 602 14 63,500 44
Singapore 501 20 83,900 12
Washington D.C. 478 24 76,500 18
San Francisco 439 27 90,000 11
Hong Kong 431 28 56,100 81
Boston 408 30 81,900 13
Madrid 338 35 48,600 126
Seattle 316 37 81,200 14
Miami 314 39 50,600 111
Toronto 299 42 45,900 149
Sydney 254 50 47,900 131
Barcelona 214 60 41,800 191
Melbourne 199 65 41,100 199
Berlin 197 67 43,200 176
Milan 190 69 45,200 153
Stockholm 160 88 69,000 28
Frankfurt 158 90 59,500 59
Munich 144 100 65,600 41
Vienna 121 121 54,700 88
Amsterdam 105 138 62,900 46
Source: JLL Global 300.
Image Destination NSW
9Image Destination NSW
SYDNEY’S OVERALL PERFORMANCE AND VISIBILITY IN
BENCHMARKS
Sydney remains a highly visible city in global benchmarks in 2017/18. Across more than 400 global
indices, rankings and benchmarks, Sydney is currently the world’s 6th most frequently featured city,
up two places since 12 months ago, and still by far the highest profile city in the Southern Hemisphere.
In comparison to all cities that are frequently ranked, Sydney is also 8th highest in terms of its median
position. Across all measures, Sydney’s visibility and performance puts it ahead of other global
contender cities such as Amsterdam, Toronto, Madrid and Chicago (see Figure 3).
Figure 3: Visibility and performance of Sydney in global benchmarks, compared to selected peers
0
HIGH VISIBILITY,
HIGH PERFORMANCE
London
Median position across all global benchmarks
5
Paris
Singapore
10
Hong Kong
Toronto Sydney
15 Amsterdam
San Francisco
Seoul
Chicago
Madrid
20
LOWER VISIBILITY,
LOWER PERFORMANCE
Washington D.C
25
250 300 350 400 450 500
Total number of appearances in global benchmarks
10 Source: The Business of Cities Sustaining the Advantage | Benchmarking Sydney’s Performance 2018Image Destination NSW
HOW CITY BENCHMARKS ARE CHANGING
This has been a year of change in the universe of Secondly, there has been a shift to focus on a wider set of
city benchmarks. themes to define city success. Whereas established city
benchmarks focus on fundamentals of competitiveness,
Firstly, a new generation of start-ups have launched their
investment attraction, infrastructure platform and economic
own benchmarks of city performance, leveraging new
specialisation, a new wave of benchmarks are responding
data mining and aggregation techniques. They reveal cities’
to urban growth and urban management agendas. They
performance across a wider range of indicators than before,
reveal not just whether cities have the ingredients to attract
and include insights into global audience perceptions as
growth, but also how well they are managing such growth.
well as local performance. These new benchmarks usefully
The outcome is a much broader set of measures on quality
complement the established benchmarks created by
of life, career opportunities, sustainability, destination
leading global consultancies, real estate companies and
brand, governance, investment, affordability, and natural
media companies (see Figure 4).3
environment (see Table 3).
Figure 4: Relative media influence of a sample of 10 global benchmarks, 2017-2018
Mercer “Quality of Living Survey”
Inrix “Global Traffic Scorecard”
INSEAD Global Talent Competitiveness...
Z-Yen “Global Financial Centres Index”
Arcadis “Sustainable Cities Mobility Index”
ZipJet “Stressful Cities”
Time Out City Life Index
Mori MF – Global Power City Index
AT Keamey Global Cities Index
Established benchmarks
IESE Cities in Motion
Start-up benchmarks
Source: Google News, month after benchmark release.
11WHAT CITY BENCHMARKS WHAT CITY BENCHMARKS
MEASURED 5 YEARS AGO MEASURED TODAY
COMPETITIVENESS
ECONOMIC PERFORMANCE
RESIDENT AND LONG TERM LIVEABILITY
BRAND, IDENTITY AND PERCEPTION
QUALITY OF LIFE FOR EXPATS
SMARTNESS
CULTURE AND NEIGHBOURHOOD VIBRANCY
COST OF LIVING RESILIENCE
BUSINESS AND INSTITUTIONAL INVESTMENT
TOURIST NUMBERS AND EXPERIENCE AFFORDABILITY
SOCIAL COHESION AND INTEGRATION
LEADERSHIP AND INSTITUTIONS
REAL ESTATE INVESTMENT
INNOVATION ECO-SYSTEMS
Table 3: Number of new global benchmarks launched in past year, by theme
No. of new benchmarks
Destination Appeal & Brand Identity 11
Quality of Life 9
Natural Environment, Sustainability & Resilience 5
Research, Technology, Innovation and Talent 5
Smartness & Governance 3
Source: The Business of Cities. *”New benchmarks” refers to new benchmarks that do not have previous editions, not including sub-
indexes, added between May 2017 and May 2018.
In many of the areas now being measured using more nuanced approaches, Sydney has
traditionally performed very well. As we highlight in the sections below, Sydney is slipping
in some of its key areas of comparative advantage, as new benchmarks reveal patterns of
performance and perception across the whole of Greater Sydney.
Table 4: Ranking Sydney against other ‘contender’ world cities
Areas where Sydney ranks among top two of the contender world cities
Higher education appeal
Air pollution
Visitor brand and identity
Real estate investment transparency
Global reputation for scenic assets and safety
Areas where Sydney ranks among bottom two of the contender world cities
Public transport coverage and efficiency
Cost of living for expats and students
Variety of cultural attractions and anchor infrastructure
Technology and digital readiness for the future
External perception of nightlife offer
In the following sections we examine Sydney’s performance in 14 different areas that
underpin its growth and competitiveness, and review its year-on-year progress in each.
12 Sustaining the Advantage | Benchmarking Sydney’s Performance 2018BUSINESS AND FINANCE
GLOBAL FIRMS Benchmarks also testify to Sydney’s ongoing fintech sector
growth. By the end of 2017, the number of fintech start-ups
Sydney is continually growing its status as a preferred
in Australia had increased more than six-fold since 2014,
location for firms in globally traded sectors. AT Kearney’s
with over 60% of these firms located in Sydney.8 The largest
Global Cities Index sees Sydney continue to rank in the
ever global survey of start-up ecosystems recently identified
top 20 of 125 cities for business activity globally, holding a
Sydney’s fintech sector as “one to watch”, while other studies
steady position at 17th since 2017.4 In the 2017 Global City
observe an opportunity for Sydney to overtake Hong Kong
Power Index, Sydney has improved 5 places year on year for
and Singapore and become Asia-Pacific’s leading fintech
global headquarter presence.5 However, Sydney surprisingly
hub, building off the back of the large finance and insurance
lags other cities in terms of the presence of global retail
sector presence in the CBD.9
firms, remaining steady at 76th globally, and 24th among its
32 peers for this measure.6
INVESTMENT ATTRACTION
FINANCIAL SERVICES Sydney has consolidated its position as a top destination
for global corporates and capital. The city ranks 1st for both
Sydney is maintaining its position as the leading global
investment and development prospects in ULI and PwC’s
financial centre in the Southern Hemisphere. In 2018, it
Emerging Trends in Asia Pacific Real Estate, a big jump
is the 9th most highly rated financial centre in the world,
from 9th in 2017. This result reflects Sydney’s combination
down slightly from a previous high of 8th last year. Within
of a deep and liquid market of core assets and better-than-
the Asia Pacific, Sydney sits just behind Singapore, Hong
average yield.
Kong and Tokyo, but has also been overtaken by Shanghai
in measures of both perception and activity since the Relative to other cities, a major draw for investors over the
last report. past year has been Sydney’s strong forecast office rental
growth.10 Figure 5 highlights the long upward trend for
Sydney is among a small group of medium-sized global
Sydney since the peak of the global financial crisis.
‘contenders’ (e.g. San Francisco, Chicago) whose financial
services offer is increasingly competitive with that of the Sydney’s office market has performed particularly
most established world cities. The city is highly regarded for impressively. In the latest JLL Global Office Index, Sydney
banking (11th), professional services (12th) and government/ ranks 1st out of 125 cities worldwide for prime office rental
regulation (12th), although not yet among the top 15 for growth. Its annual rental growth of 17.4% puts it well ahead of
insurance services. Among financial professionals, Sydney other contender cities.11
stands out for financial sector infrastructure (7th) and
reputation (14th). Where it is slightly behind is its talent base
and financial sector maturity (both outside the top 15).7
13Figure 5: Change in rank in ‘city investment prospects’
over time
1 OSAKA SYDNEY
MELBOURNE
3 SINGAPORE
SINGAPORE
5
MELBOURNE
7
9
OSAKA
11 HONG
Rank out of 23
KONG
13 SEOUL HONG KONG
15
SYDNEY
17
SEOUL
19
21
23
2007 2008 2009 2010 2011 2012 2013 2014 2015 2016 2017 2018
Source: PwC/ULI Emerging Trends in Real Estate Asia Pacific (publication series).
For cross-border real estate investment Sydney has fallen
Sydney’s recent exceptional record of investment has been from 13th to 17th globally, although this is still some way ahead
partly driven by its highly transparent real estate sector. of Toronto and San Francisco.14 Strikingly, however, new
In the latest JLL Real Estate Transparency Index, which transport infrastructure is making several secondary satellite
measures overall stability and trustworthiness for investors, markets more appealing, which is in turn encouraging
Sydney ranks 3rd overall, just behind London and New York. foreign funds to pursue more investment outside of the
The excellent access to high-quality and trusted information CBD, which is an important ingredient in the development of
sources about how well investments are performing (5th) the Metropolitan Plan.15
is a major advantage over other contenders such as
At the global level, the amount of capital allocated to real
Amsterdam (35th), Toronto (37th) and Madrid (58th).
estate and other fixed assets is still growing. But the number
Sydney’s popularity with international business investors of cities considered highly investable is not currently
reflects confidence in the city’s prospects boosted by growing as fast. This is leading to competition, and also
the recent infrastructure investment surge. In 2017, means investors are becoming more interested in different
international investors represented around a third of total attributes – the potential of secondary centres, wholly
transactions in the city, and overall FDI flows increased, in new greenfield developments, and other projects. What
contrast to the slowdown observed in flows to established is apparent is that Sydney’s metropolitan strategy offers a
cities around the world.12 Sydney also continues to excel very attractive investment prospect because it will unlock
for the numbers of corporate expansion and co-location multiple new centres of different sizes, scales and character.
projects. In the most recent edition of fDi’s Re-investment
Ranking, the city ranks 10th worldwide for this measure, and
is the only medium-sized global contender city to feature in
the top 10.13
14 Sustaining the Advantage | Benchmarking Sydney’s Performance 2018BUSINESS FRIENDLINESS
Sydney’s business friendliness has remained steady but
In the latest JLL Real Estate
still has room for improvement. On the one hand, the latest Transparency Index, which
Global Power City Index shows that Sydney performs fairly measures overall stability and
well for levels of political, economic and business risk (13th). trustworthiness for investors,
On the other hand, Sydney retains a high corporate tax
Sydney ranks 3rd overall, just
rate (27th), which continues to represent a disincentive for
potential investors. Sydney also does not make it into the behind London and New York.
latest top 10 Asia Pacific cities for business friendliness in
the latest version of fDi’s Asian Pacific Cities of the Future,
whereas peer cities such as Singapore and Hong Kong do.
National barriers remain a key part of the equation for
Sydney’s relative business friendliness. Australia is very
competitive in terms of the time and number of procedures
to start a business (4th and 7th out of 137 countries),16 and
improvements in tax payment systems (37th to 23rd) are
welcome.17 However cluster development (51st), restrictive
labour regulations, and inefficient government bureaucracy
remain important disincentives for doing business in
the country.18,19
15KNOWLEDGE
AND ECONOMY
TALENT AND LABOUR MARKET INSEAD analysis indicates that while the city’s ability to
attract talent remains strong, although quality of life as the
Relative to other top cities, it has become clear that
driver of this appeal is not as strong relative to some cities
Sydney is becoming increasingly less welcoming to global
as it has been (see Figure 6), Sydney increasingly falls
talent. In INSEAD’s major study of talent competitiveness,
down on talent retention. Sydney ranks favourably for its
Sydney now ranks 20th out of 90 cities, or 12th among 20
safety, and high-performing and well-regarded university
peers – well behind Amsterdam (11th) Washington D.C. (6th)
system, but is held back by unaffordable rent, challenges to
and San Francisco (8th).20
support key workers, and low spending on the kind of R&D
to build the talent base.21 These factors also hold Sydney
back in the Global Power City Index main measure of
securing talent (14th out of 44 cities).
Figure 6: Factors attracting talent to Sydney in comparison to peers
WASHINGTON
ZURICH
AMSTERDAM
LONDON
STOCKHOLM
BRUSSELS
SYDNEY
PARIS
SAN FRANCISCO
BOSTON Environmental
quality (max 100)
VIENNA
Quality of life
CHICAGO (max 100)
GDP per capita
MADRID (max 100)
BERLIN
WARSAW
BARCELONA
SINGAPORE
BUENOS AIRES
MILAN
SEOUL
Source: INSEAD Global Talent Competitiveness Index 2018.
16 Sustaining the Advantage | Benchmarking Sydney’s Performance 2018Threats to Sydney’s ability to attract and retain talent are also But despite obvious challenges in attracting and retaining
increasingly registering in large-scale perception benchmarks. career-age workers, measures of talent that focus on
Sydney’s reputation as as a popular city in which to work international students and university quality continue to see
among highly educated career-age talent has slipped Sydney rank highly. Sydney is up to 15th of 165 cities in the
in recent years. Results from the latest edition of Boston Cities in Motion Index for human capital because of these
Consulting Group’s Decoding Global Talent Report show that factors, as well as the high spend on leisure and recreation.22
the gap in attractiveness between leading cities and the rest The human capital dimension of the Global Cities Index,
has shrunk over time and more career-age workers are willing which also has a strong focus on education, also sees
to move to the top 30-40 global cities to find employment Sydney climb 2 places to 13th.23
(see Figure 7). However, in relative terms others are moving
In general, these results reflect the national situation.
ahead of Sydney. Today, Sydney is perceived as being only
Latest national-level data show that Australia as a whole
the 9th most popular city in which to work globally, and has
has a higher capacity for attracting talent (17th) than for
been overtaken by Los Angeles, Dubai and Amsterdam since
retaining it (23rd), ranking 17th and 23rd respectively out of
its previous ranking of 4th in 2014.
137 economies worldwide.24
Sydney continues to boast a strong labour market that
Figure 7: Change in attractiveness to workers,
puts the city firmly on a par with other global ‘contender’
2014-2018, based on percentage of global citizens
cities worldwide. In Nestpick’s Millennial Cities Ranking,
willing to move to cities for work
Sydney has climbed 4 places since 2017 and now ranks 29th
2014 2018 of 100 cities for low unemployment.25 In other measures
1 London 1 London of unemployment, Sydney ranks at least 15 places ahead
2 New York 2 New York of peers such as Toronto, Amsterdam, and Madrid. This is
reflective of the city’s ability in the current cycle to generate
3 Paris 3 Berlin
jobs across the income and skills spectrum.26
4 Sydney 4 Barcelona
5 Madrid 5 Amsterdam
6 Berlin 6 Dubai
7 Barcelona 7 Los Angeles
8 Toronto 8 Paris
9 Singapore 9 Sydney
10 Rome 10 Tokyo
Source: Boston Consulting Group.
17HIGHER EDUCATION RESEARCH AND INNOVATION
Sydney’s momentum remains strong in benchmarks Sydney continues to benefit from investment and support
measuring higher education performance. In the most in its innovation ecosystem but benchmarks show that
recent version of QS’ Best Student Cities, Sydney ranks it is still behind the global top 20 in this field. In 2018,
9th, up 4 places from 2017.27 The city’s attractiveness Sydney misses out on being included in the UN Habitat
to students has overtaken that of Vancouver, Toronto Technology Innovation Index, which ranks the top 20 cities
and Hong Kong and has been bolstered by a diverse for innovation globally.31 Meanwhile Sydney is also outside
student mix (2nd), high desirability (4th), and a large jump the top 20 in the innovation dimension of the latest AT
in student recommendations (up 14 places from 38th to Kearney Global Cities Outlook and Startup Blink’s Global
24th.28 This demonstrates that students are increasingly Ranking of Start-up Ecosystems,32 which rate cities on
beginning to play an ambassadorial role for Sydney. patents per capita, the volume of private venture capital
investments and the number and strength of university-
Although the city has fewer higher education institutions
sponsored incubators. The former index puts Sydney’s
than some of its peers, they are nevertheless consistently
innovation potential on a par with Washington DC and
rated highly for research impact. Sydney ranks 10th for
Zurich and well behind other contenders such as Toronto,
education in the EasyPark Smart Cities Index, or 6th out of
Amsterdam and Stockholm.33
30 peers, because of these factors.29,30 The global appeal of
the university system in Sydney continues to underpin the However, there are areas of promise. Sydney ranks 14th
city’s high scores in this area, even though attainment of the out of 100 in a new index, which accords more weight to
domestic population is lower than in other contender cities. start-ups that have raised over €100,000 in funding since
2016.34 In Startup Genome’s annual study, Sydney emerges
as the 4th best city worldwide for local relationships
between founders, aided by networks such as the Sydney
Startup Hub, which helps to connect Sydney with other
start-up communities throughout the state.35,36 Sydney also
possesses recognised strengths in fintech, digital media
and adtech.37
But commercialisation of Sydney’s existing R&D remains
a key deficit. Sydney has dropped 2 places since 2016
here, and now ranks 12th out of 24 peers, behind Osaka,
Washington D.C. and Berlin. This decline is primarily due
to a fall in the city’s readiness for accepting researchers
(from 10th to 13th out of 44) and opportunities for interaction
between researchers (from 6th to 12th).38 Additional national
data also verifies that university-industry collaboration (from
20th to 32nd), the volume of venture capital deals (from 16th to
22nd), and knowledge impact (from 47th to 62nd) are all on the
slide relative to the gains experienced elsewhere around the
world.39,40 This underscores the fact that although efforts to
accelerate the innovation economy are underway, there is a
risk that Sydney might miss out on the many rewards of the
innovation economy.
Image Destination NSW
18 Sustaining the Advantage | Benchmarking Sydney’s Performance 2018LIFESTYLE AND
ENVIRONMENT
Image Lendlease
LIVEABILITY However, a number of studies that examine a wider set
of factors show Sydney slipping slightly (see Figure 8):
Sydney is still a leader in terms of quality of life, but
the benchmarks signal that its liveability edge may be •• The Lee Kuan Yew School of Public Policy Global
diminishing. The global benchmarks increasingly measure Liveability Cities Index sees the city rank only 12th.
a liveable city in terms of resident experience, with less •• In new indices that measure family-friendliness and
focus on access to natural attractions such as waterways stress in the world’s cities, Sydney’s employee life
and beaches. Sydney’s advantage is being eroded as more satisfaction has slipped from 7th to 10th, while social
attention is trained on the full spectrum of metropolitan freedom, fairness and equity has also declined, from 10th to
residents, access to amenities, and affordability for 12th. The city’s physical health is only 36th out of 150 cities,
young professionals.41 and happiness is 17th out of 100.46
In the established liveability benchmarks that emphasise •• Sydney’s overall quality of place has also seen a relative
safety and longevity, Sydney continues to perform very well. decline since 2017. In the Resonance World’s Best Brands
In the latest Mercer Quality of Living Survey, the city ranks Index, Sydney has slipped 4 places for this measure, and
10th out of 231, or 6th out of its 33 top peers. The Economist’s now ranks 7th, down from 3rd in 2017.47
Safe Cities Index sees Sydney place 7th, well ahead of
London (20th) and Paris (24th) while in its new Liveability •• Quality of place is further compromised by low
ranking Sydney jumps up to 5th on account on improved walkability. Online data provider WalkScore ranks Sydney
security performance.42 And in the Global Power Cities Index, 10th out of 12 peers, ahead of only other Australian cities.48
Sydney’s liveability ranking has climbed 14 places, from Sydney’s score is held back by lower than average
30th to 16th globally, primarily due to an increase in safety pedestrian friendliness, high average block length and
(12th to 2nd for number of murders per million residents), life low density of intersections compared to other cities.
expectancy, and lower relative risks of natural disaster (28th This is an example of how Sydney’s sprawl pattern is not
to 8th).43 Among the world’s top 25 cities, Sydney has also conducive to high scores in this new generation of studies
climbed 2 places from 7th to 5th for personal-well-being in AT of amenities and lifestyle in the world’s cities.
Kearney’s Global Cities Outlook.44 Access to green spaces •• Access to lifestyle amenities is low – in terms of access to
continues to be a key advantage for the city across a range a variety of restaurants and retail shops, Sydney continues
of measures. to rank relatively poorly, at 34th and 38th out of 44 leading
Sydney also continues to be very highly regarded as a place cities respectively.49
to live. In IPSOS’ new study of the best cities in which to live, •• Affordability is declining. The Global Power City Index
based on the responses of over 18,500 adults across 26 shows that average housing rent and overall price levels
countries, Sydney emerged 2nd only to Zurich.45 This is an have remained as high as ever by global standards.50
important brand advantage and driver of interest in the city Together with high relocation costs, these affordability
for workers, students, investors and families. pressures partly explain why Sydney is still not perceived
as a top location for the widest range of global expats,
ranking just 44th out of 51 cities – or 17th among 18 peers –
in ExpatInsider’s index on talent appeal.51
19Image Destination NSW
Figure 8: Areas of liveability where Sydney has improved and declined since 2017
Up 10 places
Global Power City Index
Up 2 places
Global Power City Index
SOCIAL EMPLOYEE
SAFETY PERSONAL QUALITY
FREEDOM & LIFE AFFORDABILITY
WELL-BEING OF PLACE
EQUALITY SATISFACTION
Down 2 places
Global Power City Index
Down 3 places
Global Power City Index
Down 4 places
Resonance World’s
Best Cities
Down 9 places
Numbeo
Source: The Business of Cities.
Taken together, the above results effectively add up to a fraying liveability equation for
Sydney – particularly for young professionals seeking a high amenity high affordability
lifestyle. As talent and the firms they comprise becomes increasingly mobile and more
inclined to vote with their feet, this could represent a key competitive concern for the city
moving forwards.
20 Sustaining the Advantage | Benchmarking Sydney’s Performance 2018TRANSPORT AND INFRASTRUCTURE
As investment in system upgrades continues, the rating These figures highlight how welcome the current
of current public transport continues to be an area of infrastructure ‘catch up’ investment will be, which should
comparative disadvantage for Sydney. Access to the result in steady improvements over the next 2-3 years relative
CBD and the main airport is a relative advantage, but until to the world’s cities. Over the longer term, the vision of a
the current cycle of new infrastructure comes online, 30-minute metropolitan city has the potential to catapult
Sydney remains behind in terms of density and coverage Sydney right up the rankings of successful metropolises and,
of stations, cost and reliability, slipping to 27th of 44 cities in so doing, to sustain a pillar of the city’s position among the
(see Figure 9).52 In the IESE Cities in Motion Index, Sydney’s world’s quality of life leaders.55 A new Deloitte benchmark
transportation ranking has slipped 5 places since 2017, and of the readiness of cities for future mobility confirms these
the city now ranks 76th for this measure – more than 50 findings. It shows that while Sydney’s transport system
places behind Melbourne.53 And in the Arcadis Sustainable falls down on its resilience, quality of service and levels of
Cities Mobility Index, the city now ranks 51st, down 21 places inclusion, its improving vision and leadership for transport
from its previous high of 30th.54 Sydney’s past of low public (rated above average among 47 leading cities) now will be
transport provision and monocentric development is really an important asset in translating to transport innovation and
registering on the global numbers. investment over the coming years.56
Figure 9: Density of railway stations per square kilometre by city
Paris
Barcelona
Osaka
Stockholm
Frankfurt
Zurich
Brussels
Milan
Boston
Buenos Aires
Seoul
Madrid
Berlin
SYDNEY TO IMPROVE
London IN THE NEXT 5 YEARS
Vienna
Washington D.C.
Chicago
Amsterdam
San Francisco
Sydney
Singapore
Vancouver
Toronto
Hong Kong
0.00 0.50 1.00 1.50 2.00 2.50 3.00 3.50
Destiny of railway stations (per km2)
Source: Global Power City Index Yearbook 2017 their environmental sustainability and urban form than they
New benchmarks of “softer” aspects of transport do for their social placemaking credentials, but compared
experience show Sydney is far from outstanding. In the to other peers, stand out in neither category (see Figure
Arcadis Mobility Oriented Development Benchmarking 10). Finally, in a new measure of citizen satisfaction with
Index, which measures the design, environmental quality the city’s key ports of entry, including airports and major
and connectivity of key transport hubs, Martin Place station train stations, Sydney ranks 50th out of 100, ahead of Paris
– the highest ranked of the city’s stations – ranks just 12th and Barcelona, but well behind San Francisco (34th) and
out of 25. On average, the city’s stations perform better for Auckland (4th).57
21Figure 10: Average placemaking and urban quality metrics of Sydney’s major train
stations in comparison to peers
0
New York
HIGH PLACEMAKING
Washington
5 Bejing
Paris
Madrid
Social placemaking rank
10
Berlin
Shanghai
15 Hong Kong
Melbourne Amsterdam
20 London
Sydney
25
Brussels
HIGH ENVIRONMENTAL
STANDARDS
30
25 20 15 10 5 0
Urban environment rank
*Based on average rank of all stations measured within city
Source: Arcadis Transport Oriented Development Benchmarking Index.
Sydney’s brand means it receives the benefit of the doubt from the global public about
issues such as congestion. Multiple indexes of congestion and driving experience show
that Sydney has become more congested more quickly than most of its peer cities.58,59
But PwC’s Global Best Cities Report, which surveyed 5,000+ business decision makers and
general population adults from across 16 countries, found Sydney is perceived as having the
3rd lowest levels of congestion, just behind Amsterdam and Stockholm.60
The next big area of infrastructure priority for Sydney is digital and smart connectivity. Over
the past year, Sydney’s technology ranking has slipped 17 places from 7th to 24th globally, due
to other cities having made more substantial progress in implementing Wi-Fi hotspots and
strengthening access to high-speed broadband.61
Meanwhile, ground-breaking new studies of smartness and readiness for the future
highlight that despite potential, Sydney still has a long way to go before it can be considered
a global leader in this field.
On the one hand, a number of new technology benchmarks highlight the latent potential
provided by Sydney’s strong mobile cellular data signal (2nd), the size of the city’s car-sharing
fleet (13th), and its readiness to roll out smart healthcare (2nd) and virtual service provision
(3rd).62 Sydney has a reasonable technology base enabling the deployment of applications
for a range of purposes (see Figure 11).
22 Sustaining the Advantage | Benchmarking Sydney’s Performance 2018On the other hand, Sydney does not record outstanding performances across any of the
categories included in McKinsey’s new benchmark of smart cities, ranking 17th among 19
peers, ahead of only Tel Aviv and Buenos Aires. It is striking that for citizen awareness and
uptake in particular, Sydney lags all cities in the Asia-Pacific except for Melbourne and Tokyo,
and also falls well behind some Indian cities.63 PwC’s new study of city technological and
regulatory readiness also sees Sydney rank weakly for digitisation of culture and tourism
(10th) and its open learning environment (8th).64 These deficits currently constrain the
potential to use technology to upgrade everyday experience and enjoyment of the city.
Figure 11: Sydney’s smart city performance, supply and demand side, in relation to peers
60
STRONG SYSTEMS
FUNDAMENTALS AND Seoul Singapore
strength of smart city technology base (supply side score)
POTENTIAL
Combined score for deployment of smart city apps and
55
San Francisco
Amsterdam London
50 Chicago
Stockholm
Hong Kong
Barcelona Vienna Seattle
Melbourne Hamburg
45 Boston
Sydney
Toronto
Paris
40
Tel Aviv HIGH CITIZEN
Buenos Aires ENGAGEMENT
35
5 10 15 20 25
Score for awareness and usage of, and satisfaction with, smart city apps (demand side score)
Source: Adapted from McKinsey Global Institute.
WAGES AND COSTS
Living and working in Sydney remains expensive even relative to other high-performing
global contenders. Studies by Mercer (181st out of 209) and Deutsche Bank (40th out of 47)
highlight the fact that the region’s cost of living is still significantly higher than in many other
peer cities such as Madrid, Amsterdam and Chicago, although relative costs have stabilised
in some global indexes in 2018.65 Rent increases have seen Sydney slip down the Numbeo
Cost of Living Index.66 And in a new index of financial attractiveness for mobile talent, which
measures costs, wages and taxes, Sydney’s overall package rates behind other medium-
sized global contender cities such as Toronto.67
Housing costs outstripping wage growth is a key factor. Deutsche Bank now ranks Sydney
28th out of 47 cities for property prices to income ratios, or 12th out of 19 peers.68 This puts the
city on a par with housing markets such as San Francisco and a long way behind Melbourne.
And in two new studies of student accommodation, Sydney ranks as the 4th most expensive
location, ahead of all peers except for Boston and San Francisco.69,70
23New analysis by UBS shows that Sydney has the 5th highest price level (excluding rent)
among 23 peers, or the 11th highest worldwide. This is despite the city also having relatively
high net earnings – 4th among peers or 10th worldwide (see Figure 12).71
Figure 12: Sydney’s average price level and net earnings in comparison to peers
110
HIGH NET EARNINGS, HIGH PRICES HIGH NET EARNINGS, LOW PRICES
Miami
100 New York (baseline)
Chicago
Net earnings (100 = NYC index)
90 Sydney
Munich Toronto
Frankfurt
80 Vienna
Stockholm Berlin
London
Montreal Hong Kong
70 Paris
Amsterdam
Tel Aviv
60
Milan
50 Brussels Madrid Barcelona
Seoul
LOW NET EARNINGS, HIGH PRICES LOW NET EARNINGS, LOW PRICES
40
100 95 90 85 80 75 70
Average price level excluding rent (100 = NYC index)
Source: UBS.
New benchmarks also show that Sydney is one of the most unaffordable in the Asia-Pacific
for visitors, while the cost of food and restaurants is also 86th of 100 cities, on a par with
London, Paris and Tokyo.72 73 Although demand remains high, this constitutes a significant
risk to Sydney’s sustained ability to attract and retain international talent.
The unaffordability challenge also adds to the imperative to improve productivity. In
IESE Cities in Motion’s economy measure Sydney has slipped 18 places from 17th to 35th
globally because of relatively flat productivity growth and lower motivation for early stage
entrepreneurial activity.74 Meanwhile, the latest Global Metro Monitor sees Sydney rank only 16th
among peers for GDP per capita growth over the 2014-2016 period, behind many of the other
contender cities, such as San Francisco (2nd), Madrid (4th) and Amsterdam (10th). A transition into
the innovation economy will be one important route into a higher wage economy.
24 Sustaining the Advantage | Benchmarking Sydney’s Performance 2018SUSTAINABILITY AND RESILIENCE Sydney’s building and water management is also very
competitive. In a new index measuring the percentage of
As sustainability benchmarks evolve and become more
office buildings meeting green standards, Sydney ranks 3rd,
complex, Sydney’s performance is starting to appear less
just behind Vancouver and Toronto.78 It also ranks 13th in the
favourable. The city has traditionally tended to perform
most recent version of the Arcadis Sustainable Cities Water
well in this field, because the city’s low-density development
Index, or 6th out of 18 peers, reflecting recent commitments
model inadvertently favours metrics assessing green space
to protect the water supply and diversify its water portfolio.79
and low pollution. But as the benchmarks increasingly
favour measures of policy, co-ordination and supply chain However, Sydney’s overall environmental performance
management, Sydney’s performance is slipping. continues to be held back by high CO2 emissions, high
reliance on fossil fuels, and energy intensive systems.
All-round environmental performance is still strong.
Only 16% of energy is currently supplied by renewables.80
Sydney ranks 9th out of 44 cities for environment in the
In one measure, Sydney ranks 90th out of 100 cities for its
Global Power City Index, and 22nd out of 165 cities in the
high CO2 and greenhouse gas emissions, and in the Global
Cities in Motion index, up 8 places from 2017.75 These strong
Power Cities Index, Sydney has dropped 25 places for
performances are largely due to low air pollution (the lowest
CO2 emissions to 39th, as it has been slower to implement
among 44 cities globally) and high levels of recycling (only
emission reduction initiatives while other cities are making
37% of waste is currently sent to landfill).76 Benchmarks
large gains.81,82
measuring the city’s natural assets also place Sydney
among the top cities in the world larger than 4 million Sydney also performs less well in benchmarks measuring
people for access to green space, woodland and parks sustainability practice, policy and outcomes. The city places
(see Figure 13).77 61st for the planetary and environmental impacts of the city’s
mobility system, due to past coordination failures to lower
Figure 13: Amount of green space per inhabitant transport emissions and congestion.83 In addition, Sydney has
in comparison to peers, 2018 slipped 7 places to 17th in the Global Destination Sustainability
Index, which measures the sustainability practices of the city’s
Sydney hotels and meetings industry.84
Hamburg
Once again, the global public still perceives Sydney more
Warsaw
strongly than the performance would suggest – business
Tel Aviv leaders and citizens around the world see Sydney as the
Vienna 4th best of 30 cities for sustainability and environmental care,
Berlin just behind Toronto and Amsterdam.85 The gap between
Madrid performance and perception will need to close over time.
Zurich
Amsterdam
Munich
Stockholm
Washington DC
London
San Francisco
Brussels
Toronto
Barcelona
Seoul
Paris
0 50 100 150 200 250
Amount of green space (m2 per person)
Source: TravelBird Green Cities Index.
25You can also read