Natural sea-salt emissions moderate the climate forcing of anthropogenic nitrate - ACP
←
→
Page content transcription
If your browser does not render page correctly, please read the page content below
Atmos. Chem. Phys., 20, 771–786, 2020
https://doi.org/10.5194/acp-20-771-2020
© Author(s) 2020. This work is distributed under
the Creative Commons Attribution 4.0 License.

Natural sea-salt emissions moderate the climate forcing
of anthropogenic nitrate
Ying Chen1,2,3,9 , Yafang Cheng2 , Nan Ma4,2,3,1 , Chao Wei3 , Liang Ran5 , Ralf Wolke6 , Johannes Größ1 ,
Qiaoqiao Wang4 , Andrea Pozzer7 , Hugo A. C. Denier van der Gon8 , Gerald Spindler10 , Jos Lelieveld7,11 , Ina Tegen6 ,
Hang Su3 , and Alfred Wiedensohler1
1 Department  Experimental Aerosol and Cloud Microphysics, Leibniz Institute for Tropospheric Research,
Leipzig, Germany
2 Minerva Research Group, Max Planck Institute for Chemistry, Mainz, Germany
3 Multiphase Chemistry Department, Max Planck Institute for Chemistry, Mainz, Germany
4 Center for Pollution and Climate Change Research (APCC), Institute for Environmental and Climate Research,

Jinan University, Guangzhou, China
5 Key Laboratory of Middle Atmosphere and Global Environment Observation, Institute of Atmospheric Physics,

Chinese Academy of Sciences, Beijing, China
6 Modelling of Atmospheric Processes, Leibniz Institute for Tropospheric Research, Leipzig, Germany
7 Atmospheric Chemistry Department, Max Planck Institute for Chemistry, Mainz, Germany
8 TNO, Department of Climate, Air and Sustainability, Princetonlaan 6, Utrecht, the Netherlands
9 Lancaster Environment Centre, Lancaster University, Lancaster, UK
10 Atmospheric Chemistry Department, Leibniz Institute for Tropospheric Research, Leipzig, Germany
11 The Cyprus Institute, Nicosia, Cyprus

Correspondence: Yafang Cheng (yafang.cheng@mpic.de) and Ying Chen (chen@tropos.de)

Received: 10 June 2019 – Discussion started: 12 August 2019
Revised: 16 November 2019 – Accepted: 19 December 2019 – Published: 22 January 2020

Abstract. Natural sea-salt aerosols, when interacting with          forcing of anthropogenic nitrate, which had been expected to
anthropogenic emissions, can enhance the formation of par-          dominate the aerosol cooling by the end of the century. Com-
ticulate nitrate. This enhancement has been suggested to in-        prehensive considerations of this redistribution effect foster
crease the direct radiative forcing of nitrate, called the “mass-   better understandings of climate change and nitrogen depo-
enhancement effect”. Through a size-resolved dynamic mass           sition.
transfer modeling approach, we show that interactions with
sea salt shift the nitrate from sub- to super-micron-sized par-
ticles (“redistribution effect”), and hence this lowers its ef-
ficiency for light extinction and reduces its lifetime. The re-     1   Introduction
distribution effect overwhelms the mass-enhancement effect
and significantly moderates nitrate cooling; e.g., the nitrate-     Particulate nitrate (NO−  3 ) is one of the most important an-
associated aerosol optical depth can be reduced by 10 %–            thropogenic aerosol components that exerts a climate cool-
20 % over European polluted regions during a typical sea-           ing effect (IPCC, 2013; Haywood and Schulz, 2007). On a
salt event, in contrast to an increase by ∼ 10 % when only          global scale, its average direct radiative forcing (DRF) has
accounting for the mass-enhancement effect. Global model            been estimated to span over a relatively wide range from
simulations indicate significant redistribution over coastal        −0.08 to −0.19 W m−2 (Liao et al., 2004; Liao and Sein-
and offshore regions worldwide. Our study suggests a strong         feld, 2005; IPCC, 2013; Xu and Penner, 2012; Haywood and
buffering by natural sea-salt aerosols that reduces the climate     Schulz, 2007; Myhre et al., 2013; Forster et al., 2007; Adams
                                                                    et al., 2001; Bauer et al., 2007; Jacobson, 2001; Streets et al.,

Published by Copernicus Publications on behalf of the European Geosciences Union.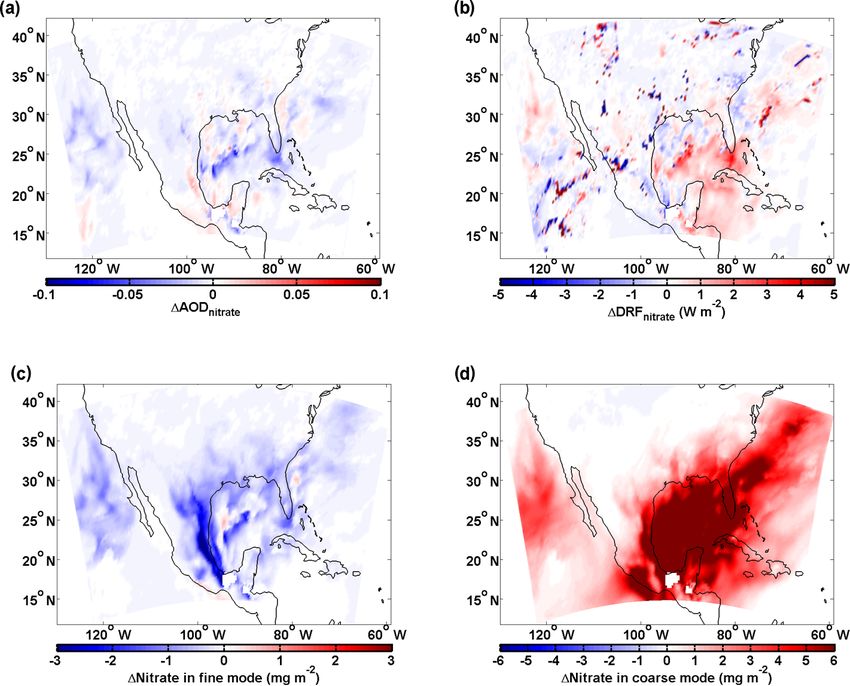
772                                                                                  Y. Chen et al.: Natural sea-salt emissions

2013; van Dorland et al., 1997). It is projected to reach up to
about −0.4 to −1.3 W m−2 and dominate the aerosol cool-
ing by the end of the century (Adams et al., 2001; Bellouin
et al., 2011; Hauglustaine et al., 2014). Although the gaseous
precursors of nitrate, e.g., NOx (NO + NO2 ) and HNO3 , are
mainly of anthropogenic origin, globally about 35 %–50 %
of the nitrate mass is associated with natural sea-salt aerosol
(Xu and Penner, 2012; Myhre et al., 2006). This is because
sea-salt aerosol can be transported over industrialized re-
gions, interacts with anthropogenic precursors of nitrate and
enhances the total nitrate column loading in the atmosphere
through heterogeneous uptake of HNO3 and its precursors
(Liao et al., 2004; Liao and Seinfeld, 2005; Seinfeld and Pan-
dis, 2006; Xu and Penner, 2012; Ravishankara, 1997; Lowe
et al., 2015). Such sea-salt-induced nitrate mass increase is
believed to strengthen the DRF and climate cooling of nitrate
(Liao and Seinfeld, 2005), called the “mass-enhancement ef-
fect”.
   However, not only the mass concentration but also the par-
ticle mass size distribution (PMSD) is essential for evaluat-
ing the direct radiative forcing of nitrate (DRFnitrate ) (IPCC,
2013; Murphy et al., 1998; Kok et al., 2017). Besides lead-
ing to the increase of total nitrate mass, interactions with
sea-salt aerosol also have a “redistribution effect” on nitrate
PMSD, which shifts nitrate from sub- to super-micron sizes
(e.g., Chen et al., 2016a; see also Fig. 1). Because sea-salt
aerosol is mainly present as super-micron (coarse) particles       Figure 1. Concept of the redistribution effect induced by sea-salt
(Murphy et al., 1998; O’Dowd et al., 1997; Ravishankara,           aerosol.
1997), chemical equilibrium favors the formation of ther-
modynamically stable sodium nitrate in the coarse mode,
                                                                   methods” for details. A 1-year simulation with the EMAC
which inhibits the formation of semivolatile ammonium ni-
                                                                   (ECHAM5/MESSy Atmospheric Chemistry) model is used
trate in the submicron size (fine mode) through competitive
                                                                   to demonstrate the importance of the redistribution effect on
consumption of gaseous precursors and change in the gas–
                                                                   a global scale (Jöckel et al., 2010).
particle equilibrium (Chen et al., 2016a; Zaveri et al., 2008;
Myhre et al., 2006). Compared to the fine particles, coarse
particles have a significantly lower extinction efficiency in      2     Data and methods
the visible part of the spectrum (IPCC, 2013; Murphy et al.,
1998); the sea-salt-induced redistribution effect thus tends to    2.1    Observations
weaken DRFnitrate , which counteracts the mass-enhancement
effect. The competition between these two effects will ulti-       The HOPE campaign (HD(CP)2 Observational Prototype
mately determine the net impact of sea-salt aerosol on an-         Experiment, Macke et al., 2017) was carried out during
thropogenic DRFnitrate . To the best of our knowledge, this        10–20 September 2013 at Melpitz, Germany (51.53◦ N,
sea-salt-induced redistribution effect is neglected in most        12.93◦ E; 86 m a.s.l.). Melpitz represents the regional back-
global models, due to the computationally expensive calcu-         ground of central Europe (Spindler et al., 2012), with flat
lations of fully dynamic mass transfer between size-resolved       surrounding topography over an area of hundreds of square
particulate nitrate (Adams et al., 2001; Myhre et al., 2006);      kilometers, ranging 100–250 m a.s.l.
for more details, see the Supplement Sect. S1.                        Size-segregated measurements of particle composition
   To explore the competition between the sea-salt-induced         were carried out on 13 and 18 September, which repre-
mass-enhancement effect and redistribution effect and the          sent the continental period and marine period, respectively
impact of the redistribution process on the nitrate cooling        (see back-trajectories in Fig. S1 in the Supplement). A five-
of climate, we conducted a series of sensitivity studies with      stage Berner impactor (Hauke, Austria, 0.05–0.14, 0.14–
and without sea-salt aerosol emission for a typical sea-salt       0.42, 0.42–1.2, 1.2–3.5 and 3.5–10 µm; Berner and Luerzer,
event over Europe and North America, using a regional atmo-        1980) was operated to segregate particles onto ring-like pre-
spheric chemistry model (WRF-Chem) with a fully dynamic            baked (350 ◦ C) aluminum foils with a sampling period of
mass transfer approach (Zaveri et al., 2008); see “Data and        24 h (00:00–24:00, local time) for detailed chemical analy-

Atmos. Chem. Phys., 20, 771–786, 2020                                                 www.atmos-chem-phys.net/20/771/2020/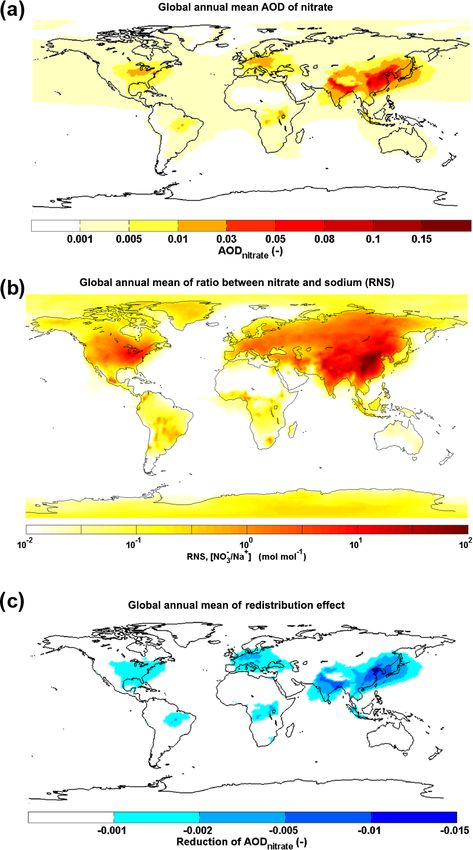
Y. Chen et al.: Natural sea-salt emissions                                                                                     773

ses (Spindler et al., 2012). The isokinetic inlet for particles    nium nitrate; details are given in the Sect. 4 of Zaveri et
with an aerosol dynamic diameter smaller than 10 µm was in-        al. (2008). We note that heterogeneous hydrolysis of N2 O5
stalled 6 m above the ground. To compare with modeling re-         with NaCl is an important chemical pathway of particulate
sults, we use the sum of the particle mass at stage 1–3 (PM1.2 ,   nitrate in coarse mode during nighttime (Bertram and Thorn-
aerosol dynamic diameter smaller than 1.2 µm) to represent         ton, 2009; Archer-Nicholls et al., 2014). This process may
fine-mode particles and the sum of the mass at stages 4–5          enhance the redistribution effect; however, it is not consid-
(PM1.2–10 , aerosol dynamic diameter smaller between 1.2           ered in this study. The sea-salt emissions computed with
and 10 µm) to represent coarse-mode particles. The gravi-          the modified Gong scheme (Gong, 2003) were reduced to
metric mass of the preheated aluminum foils was weighted           10 % in the “Case_SeasaltOn” simulation , because a previ-
before and after the sampling process, by a microbalance           ous study (Chen et al., 2016a) has shown that the original
(UMT-2, Mettler-Toledo, Switzerland). Before each weight-          Gong scheme overestimates the sea-salt mass concentrations
ing, the aluminum foils were equilibrated for at least 72 h        by a factor of ∼ 10 over the coastal regions of Europe using
in a strictly controlled environment with a temperature of         the WRF-Chem model. We note that although the mass of
20 ± 1 ◦ C and a relative humidity of 50 ± 5 %. After an aque-     coarse sea-salt particles is certainly overestimated, it might
ous extraction of foil aliquots, the main water-soluble cations    not necessarily indicate overestimation in fine sea-salt parti-
(Na+ , NH+      +
           4 , K , Mg
                       2+ and Ca2+ ) were quantified by stan-      cles related to their minor contribution to the total mass. The
dard ion chromatography (Neusüß et al., 2000). Likewise,           sea-salt emission was turned off in the “Case_SeasaltOff”
capillary electrophoresis (Neusüß et al., 2000) was carried        simulation. We calculate the DRF and aerosol optical depth
                                        2−
out to quantify the anions (NO−                   −
                                  3 , SO4 and Cl ). A carbon       of anthropogenic nitrate at the top of the atmosphere for both
analyzer (Behr Labor-Technik, Germany) was used to sep-            sea-salt emission cases, based on the difference in the net in-
arate and measure the sampled organic and elemental car-           coming radiative flux with and without the anthropogenically
bon with a two-step thermographic method (modified VDI             emitted gas-phase precursor NOx (IPCC, 2013; Xu and Pen-
method 2465 part-2; Spindler et al., 2012). Organic carbon         ner, 2012). Only the model results during daytime (07:00–
was vaporized at 650 ◦ C for 8 min under N2 and catalytically      16:00, local time) and under clear-sky condition (cloud opti-
converted to CO2 ; the remaining elemental carbon was com-         cal depth equals to zero) were used for the analyses of DRF
busted for another 8 min with O2 at 650 ◦ C. Generated CO2         in this study.
was then quantitatively determined using a nondispersive in-          WRF-Chem calculated aerosol optical depth (AOD) and
frared detector.                                                   direct radiative effect of total aerosols based on the internal
                                                                   mixture assumption and taking the hygroscopicity into ac-
2.2   Model description                                            count. In order to calculate the light extinction coefficient and
                                                                   optical depth for individual aerosol species, we performed
We performed regional model simulations with the “online           the following off-line calculation. The AOD of each species
coupled” air quality model Weather Research and Forecast-          is calculated by integrating light extinction coefficient (σex )
ing with Chemistry model (WRF-Chem V3.5.1; Grell et al.,           over all vertical layers. The σex of sea salt (NaCl) and partic-
2005). WRF-Chem enables more detailed investigation of             ulate nitrate were calculated with Mie theory, based on their
aerosol–radiation interaction over specific regions at higher      PMSD. Different from the WRF-Chem calculation of total
horizontal resolution compared with global models, and it          aerosol AOD, an external mixture was assumed for nitrate
has been broadly used for investigating aerosol radiative          and sea-salt particles when calculating their respective con-
forcing in previous studies (e.g., Archer-Nicholls et al., 2019;   tributions on σex or AOD. Hygroscopic growth was also con-
Fast et al., 2006; Saide et al., 2012; Gao et al., 2018; Yao et    sidered, following the κ-Köhler theory (Köhler, 1936; Petters
al., 2017; Huang et al., 2015). To investigate the impact of re-   and Kreidenweis, 2007).
distribution effect on PMSD and climate effect of nitrate, the
fully dynamic aerosol module MOSAIC (Zaveri et al., 2008)          2.3   European simulation
was utilized with eight discrete size bins (39–78, 78–156,
156–312, 312–625, 625–1250 nm, 1.25–2.5, 2.5–5, 5–10 µm;           The European simulations focus on the HOPE-Melpitz cam-
see also Fig. 2), with the online coupled CBMZ (Carbon-            paign period of 10–20 September 2013, during which a sea-
Bond Mechanism version Z) gas chemistry scheme (Zaveri             salt event that influenced most of Europe was captured. The
and Peters, 1999). In MOSAIC, NaCl reacts irreversibly with        simulations are defined by two nested domains with hori-
nitric acid with its equilibrium surface vapor pressure of         zontal resolutions of 54 and 18 km and 39 vertical layers
zero; a gas–particle partitioning approach ASTEM (Adap-            with model top at 50 hPa. The coarse domain (D01) cov-
tive Step Time-Split Euler Method) is coupled with a ther-         ers the North Sea, the European continent and the north-
modynamic module (MESA-MTEM, Multicomponent Equi-                  ern part of Africa; the inner domain (D02) covers most of
librium Solver for Aerosols – Multicomponent Taylor Ex-            the North Sea and the European continent (Fig. S2). The
pansion Method) to dynamically calculate the equilibrium           European anthropogenic emission inventories are provided
vapor pressure and condensation rate of semivolatile ammo-         by TNO (https://www.tno.nl, last access: 17 January 2020),

www.atmos-chem-phys.net/20/771/2020/                                                   Atmos. Chem. Phys., 20, 771–786, 2020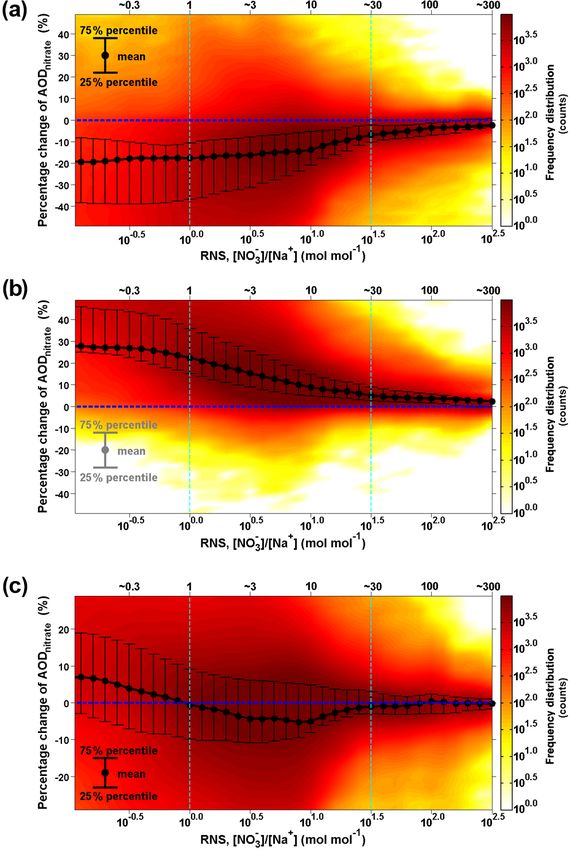
774                                                                                         Y. Chen et al.: Natural sea-salt emissions

Figure 2. Model results of mass concentration of each chemical compound in eight size bins at Melpitz. The results shown here are averaged
during 17 September 2013 when marine air masses started approaching Melpitz. Sodium is used as an indicator of sea-salt aerosol. (a) Result
of the “Case_SeasaltOff” simulation (without sea-salt emission). (b) Result of the “Case_SeasaltOn” simulation (with sea-salt emission).
The differences between particulate nitrate mass concentration (1[NO−3 ]) in each size bin are marked.

from the AQMEII project (Air Quality Model Evaluation In-               Table 1. Configurations of WRF-Chem.
ternational Initiative) for PM2.5 , PM2.5–10 , NOx , SO2 , CO,
NH3 and nonmethane volatile organic compounds (Pouliot                    Physics                  WRF options
et al., 2012; Chen et al., 2018b), and from the EUCAARI                   Microphysics             Lin scheme (Lin et al., 1983)
project (European Integrated project on Aerosol, Cloud, Cli-              Boundary layer           YSU (Honget al., 2006)
                                                                          Surface                  Rapid Update Cycle (RUC) land surface model
mate, and Air Quality Interactions) for particulate organic               Shortwave radiation      Goddard shortwave (Chou et al., 1998)
carbon and elemental carbon (Kulmala et al., 2011). The                   Longwave radiation       New Goddard scheme
inventories are with a spatial resolution of 1/8◦ × 1/16◦                 Cumulus                  Grell 3-D
                                                                          Urban                    3-category UCM
longitude–latitude. We excluded the point source emissions
of elemental carbon in the EUCAARI inventory over Ger-                    Chemistry and aerosol    Chem options
many since a previous study (Chen et al., 2016b) reported                 Aerosol module           MOSAIC with 8 bins (Zaveri et al., 2008)
large uncertainty for them. More details about emissions and              Gas-phase mechanism      CBMZ (Zaveri and Peters, 1999)
                                                                          Photolytic rate          Fast-J photolysis scheme (Wild et al., 2000)
meteorological and chemical initial and boundary conditions               Sea-salt emission        Gong scheme (Gong, 2003)
can be found in Sect. S2. Detailed information about the
model configuration is given in Table 1.
   In the European Case_SeasaltOn simulation (with sea-
salt emission), modeled [Na+ ] showed good agreement                    man lowland (Melpitz) and northern Polish regions (Chen
with measurements over coastal regions from the Euro-                   et al., 2016a). In line with previous studies (Xu and Penner,
pean Monitoring and Evaluation Programme (EMEP, https:                  2012; Li et al., 2013), the modeled AOD agreed reasonably
//www.emep.int, last access: 17 January 2020), with a fac-              well with the AERONET observations ( AErosol RObotic
tor (and correlation coefficient) of 0.85 (0.67), 1.16 (0.80)           NETwork, http://aeronet.gsfc.nasa.gov, last access: 17 Jan-
and 0.83 (0.87) for Bilthoven, Kollumerwaard and Vrede-                 uary 2020). The spatial distribution of AOD can be generally
peel (Fig. S3), respectively. Compared with ground-based                captured by the model (R = 0.64), although the model may
measurements at Melpitz and radio-sounding measurements                 overestimate AOD by a geometric mean bias of 70 % (see
across Europe, the meteorological conditions were well cap-             Sect. S3 for details).
tured by the model (Chen et al., 2016a). Vertical structures
of potential temperature and wind speed were realistically              2.4   North America and global simulations
reproduced, with correlation coefficients between simula-
tion and measurement results of ∼ 0.9 over coastal, Ger-                To investigate the significance of the redistribution effect in
                                                                        a broader spatial scale, we also conducted WRF-Chem sim-

Atmos. Chem. Phys., 20, 771–786, 2020                                                           www.atmos-chem-phys.net/20/771/2020/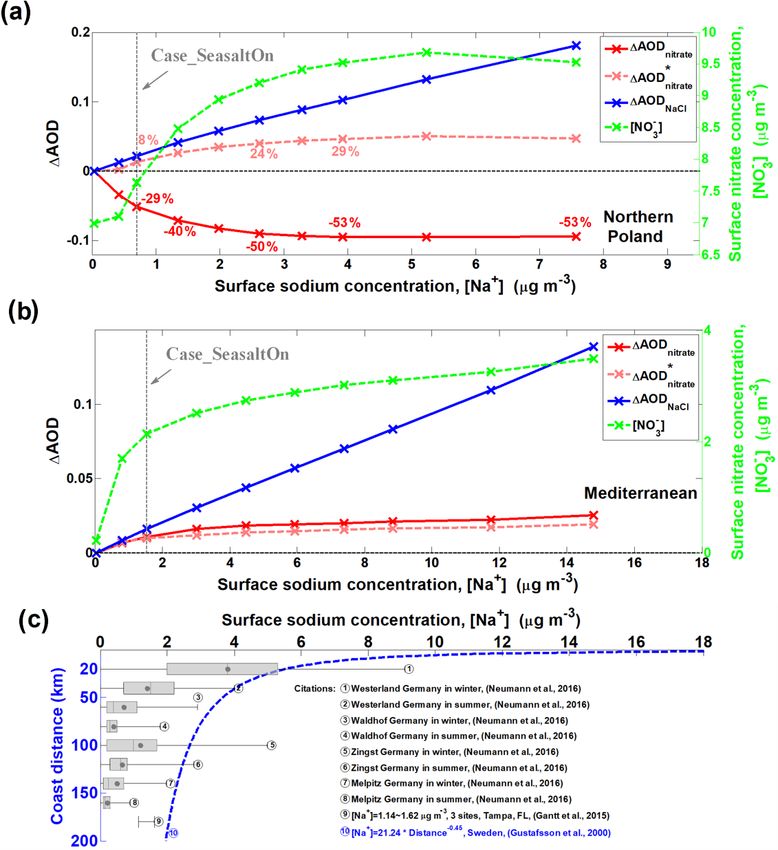
Y. Chen et al.: Natural sea-salt emissions                                                                                     775

ulations over North America, where high concentrations of
nitrate were usually observed. We focus on the period of 10–
17 January 2015, when strong continental outflow interacted
with marine air masses over the Gulf of Mexico. The North
American domain covers the US, the Gulf of Mexico and
parts of the Pacific and Atlantic oceans, with a horizontal res-
olution of 36 km. In addition, a 1-year simulation with global
model (EMAC) was carried out for analysis of the potential
impact of redistribution effect on a global scale. Although
the fully dynamic mass transfer between particle sizes is not
considered in EMAC (four size modes rather than eight size
bins as applied in the WRF-Chem model), we adopt a param-
eterization derived from WRF-Chem simulations to estimate
the potential impact (details given in Sect. 3.5). More de-
tails of EMAC model and its aerosol module are described
in our previous work (Pozzer et al., 2012; Klingmüller et al.,
2014; Pringle et al., 2010). The global simulation was run at
T106L31 resolution, corresponding to a quadratic Gaussian
grid of approximately 1.1◦ × 1.1◦ (in latitude and longitude)
and with 31 levels in the troposphere. The global emission in-     Figure 3. Surface sodium mass concentration over Europe do-
ventory EDGAR (V4.3, 2010, https://edgar.jrc.ec.europa.eu,         main at 12:00 local time (LT) on 19 September 2013. The 10 m
last access: 17 January 2020) was used in the North Ameri-         wind is indicated by the gray arrows. The results are based
                                                                   on Case_SeasaltOn. Westerland, Waldhof, Zingst, Bilthoven, Kol-
can and global simulations.
                                                                   lumerwaard, Vredepeel, Melpitz, central Europe and northern
                                                                   Poland regions are marked.

3     Results and discussion
                                                                      As shown in Fig. 4a and b, the Case_SeasaltOn simula-
3.1    Sea-salt-induced redistribution effect                      tion successfully reproduces the redistribution effect of ni-
                                                                   trate when the dominating air mass changed from a con-
Marine air masses frequently influence, ∼ up to 90 % of the        tinental to marine type at the central Europe background
days in a year, central Europe (Birmili et al., 2001; Fig. 2).     site Melpitz. Measurements and model results both show an
The interaction between anthropogenic pollutants and sea-          ∼ 10 times increase of sodium concentration ([Na+ ], indica-
salt aerosol commonly happens in the atmosphere. In this           tor of sea-salt aerosol) in the coarse mode when marine air
study, we performed a series of numerical sensitivity ex-          masses approached (Fig. S4). While the nitrate mass frac-
periments during a typical sea-salt transport event from 10        tion in the coarse mode was enhanced by a factor of ∼ 5.5,
to 20 September 2013 during the HOPE-Melpitz campaign.             its concentration ([NO− 3 ]) in the fine mode was lowered by
During the campaign, central Europe was dominated by con-          ∼ 20 % (Fig. 4b). A clear redistribution of particulate nitrate
tinental air masses before 15 September. Subsequently, ma-         from fine to coarse mode is found when introducing sea salt
rine air masses started traveling over land on 17 September,       in Case_SeasaltOn, with negligible changes in other partic-
and sea-salt aerosol originating from the North Sea and the        ulate species except sea salt (Fig. 2). Conversely, without
Baltic Sea was transported to northern Poland and dominated        introducing sea-salt aerosol, Case_SeasaltOff did not cap-
central Europe on 19 September (Fig. 3). Sea salt is emitted       ture the redistribution effect, and the nitrate mass in the fine
into the marine planetary boundary layer (PBL) with a mass         mode (∼ 97 %) dominated in both continental and marine air
concentration dominated by coarse particles, usually with a        masses (Fig. 4c).
short lifetime and a limited transport range. Previous studies
showed that the special PBL thermodynamic structure over           3.2   Moderation of nitrate cooling by the redistribution
coastal regions (Ding et al., 2004) can bring sea salt from the          effect
marine PBL to the continental free troposphere, and therefore
prolonging its lifetime and favoring long-range transport (see     Figure 5 shows the strong impact of the redistribution ef-
the Fig. 11 of Chen et al., 2016a). Afterwards, the sea salt       fect on nitrate cooling when a marine air mass transported
aloft could be mixed down to the surface layer by the fully        further inland and predominated over Europe on 19 Septem-
developed PBL (Chen et al., 2009, 2016a) and interact with         ber. Although sea-salt aerosol leads to an overall enhance-
anthropogenic nitrate. Therefore, this transport mechanism         ment of nitrate column loading (∼ 1 mg m−2 , Fig. S5) com-
broadens the sea-salt-induced redistribution effect on nitrate     pared to Case_SeasaltOff, the nitrate-associated aerosol op-
to a larger spatial scale.                                         tical depth (AODnitrate ) decreases significantly over the rel-

www.atmos-chem-phys.net/20/771/2020/                                                   Atmos. Chem. Phys., 20, 771–786, 2020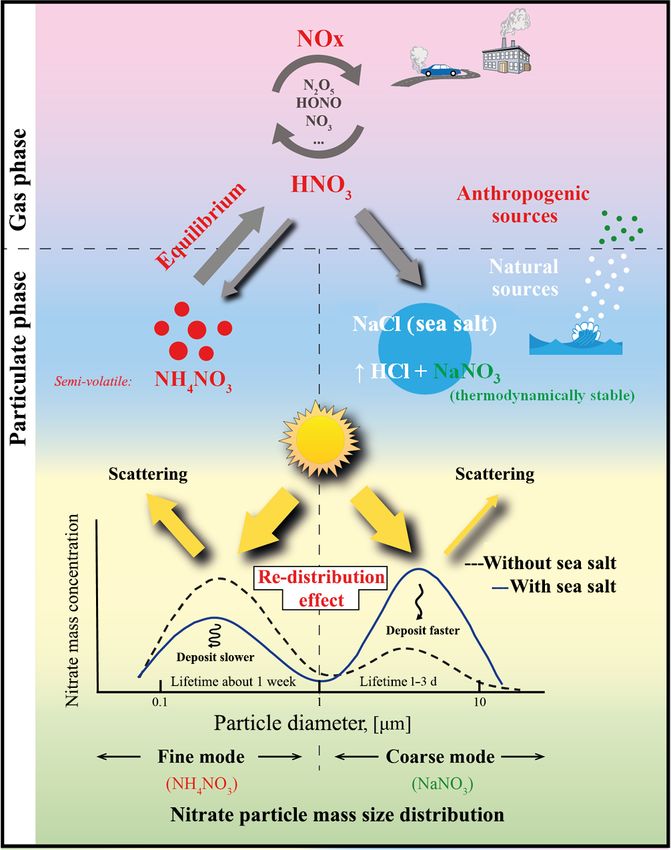
776                                                                                           Y. Chen et al.: Natural sea-salt emissions

Figure 4. Observed and simulated mass fraction of particulate nitrate in fine and coarse modes at Melpitz, Germany. (a) Observation based on
the Berner impactor measurements. (b) WRF-Chem Case_SeasaltOn simulation, i.e., with sea-salt emission. (c) WRF-Chem Case_SeasaltOff
simulation, i.e., without sea-salt emission. The results are grouped into continental (black bar) and marine (red bar) air mass types. According
to the size-cuts of the Berner impactor, the size ranges of the fine- and coarse-mode particles are defined as PM1.2 (particles with an
aerodynamic diameter smaller than 1.2 µm) and PM1.2–10 (particles with an aerodynamic diameter larger than 1.2 µm and smaller than
10 µm), respectively.

atively polluted continental regions (Fig. 5a), leading to a              uously as a function of [Na+ ], which is in line with previ-
strongly weakened cooling effect of nitrate in those regions              ous estimates and clearly shows the mass-enhancement effect
(positive change in DRFnitrate in Fig. 5b). We find that the              (Liao and Seinfeld, 2005). However, the redistribution ef-
regions of reduced AODnitrate co-locate with the regions of               fect overwhelms the mass-enhancement effect in this region,
reduced fine mode [NO−     3 ] (bluish colored areas in Fig. 5a           and the AODnitrate drops significantly by ∼ 29 % (red solid
and c). Over a large area of the European continent, the re-              line in Fig. 6a) when the scaling factor of sea-salt aerosol
distribution effect shifts the nitrate PMSD from the fine to              is 1 (Case_SeasaltOn). Note that this is slightly higher than
the coarse mode (Fig. 5c, d), resulting in much less efficient            the average ∼ 22 % from the online calculation, due to the
light scattering of nitrate aerosol with a reduced cooling ef-            difference in aerosol mixing state, i.e., internal mixing of
fect. The box with a solid black frame in Fig. 5 marks a                  aerosol compositions in the online calculation and external
region in northern Poland, where sea-salt aerosol strongly                mixing in the off-line calculation. The reduction in AODnitrate
interacted with anthropogenic precursors of nitrate during                reaches a maximum of ∼ 50 % (∼ 0.09 in absolute AOD
the studied sea-salt event. In this region, the redistribution            value) when [Na+ ] is ∼ 2.5 µg m−3 or higher, which is a
effect leads to a decrease in column nitrate loading in the               level of sea-salt aerosol that has been often observed in cen-
fine mode by ∼ 2.9 mg m−2 (Fig. 5c) accompanied by an in-                 tral Europe (Fig. 6c; Gustafsson and Franzén, 2000; Neu-
crease of ∼ 3.7 mg m−2 in the coarse mode due to the mass-                mann et al., 2016; Gantt et al., 2015). A similar net reduc-
enhancement effect (Fig. 5d). Consequently, anthropogenic                 tion in AODnitrate is also found for central Europe (marked
AODnitrate is significantly reduced by up to ∼ 30 % with an               in Fig. 3), where the overall moderation is ∼ 13 % compared
average reduction of ∼ 22 % (∼ 0.05 in absolute AOD value,                to Case_SeasaltOff (Fig. S6a). To further demonstrate the in-
Fig. 5a), despite a ∼ 0.8 mg m−2 net increase in total nitrate            fluence of the redistribution effect on nitrate cooling, we cal-
loading. This results in a 5 %–70 % reduction in nitrate cool-            culate the 1AODnitrate by reallocating nitrate mass into dif-
ing, on average by ∼ 26 % (Fig. 5b). Our results demonstrate              ferent size bins according to the normalized nitrate PMSD
that the sea-salt-induced redistribution effect overwhelms the            simulated in Case_SeasaltOff, i.e., by neglecting the redis-
mass-enhancement effect over polluted regions, thus moder-                tribution effect (1AOD∗nitrate , pink dashed line in Fig. 6a).
ating the anthropogenic nitrate cooling.                                  A distinct opposite trend, of increasing AOD∗nitrate with in-
   The resulting decrease of nitrate cooling is nonlinear with            creasing [NO− 3 ] (green dashed line), would result when the
respect to the sea-salt aerosol loading due to the competi-               redistribution effect was neglected. For example, instead of
tion between sea-salt-induced mass-enhancement effect and                 a decrease by 29 %, the AOD∗nitrate over the region of north-
redistribution effect. To investigate the net impact of this              ern Poland increases by ∼ 8 % from the Case_SeasaltOff to
competition, we performed a series of sensitivity simulations             Case_SeasaltOn simulation.
with different sea-salt aerosol emission scaling factors (0,                 It is noteworthy that the increasing rate of [NO−     3 ] de-
0.5, 1, 2, 3, 4, 5, 6, 8 and 10, the ones with scaling factors            creases as [Na+ ] further increases. There is even a slight de-
of 0 and 1 being our Case_SeasaltOff and Case_SeasaltOn,                  crease of [NO−               +
                                                                                         3 ] when [Na ] exceeds ∼ 5 µg m
                                                                                                                             −3 (Fig. 6a).

respectively). As a surrogate of aerosol DRF, the AOD of                  This is mostly due to the consumption of nitrate precur-
nitrate and sea-salt aerosol was calculated offline based on              sor and stronger deposition of particulate nitrate by redis-
the simulated PMSD (see “Data and methods”). Over the                     tribution toward larger particles sizes and, thus, shorter life-
region in northern Poland (box with solid frame in Fig. 5),               times. The lifetime of nitrate particles can be shortened from
total [NO− 3 ] (green dashed line in Fig. 6a) increased contin-           about a week to 1 d by shifting from the fine to the coarse

Atmos. Chem. Phys., 20, 771–786, 2020                                                          www.atmos-chem-phys.net/20/771/2020/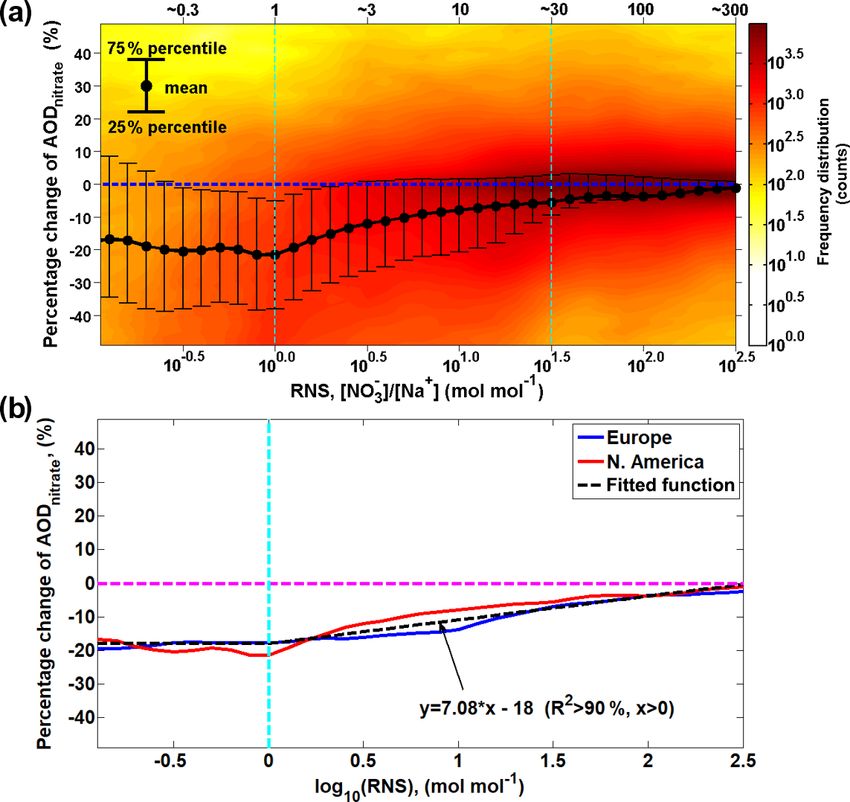
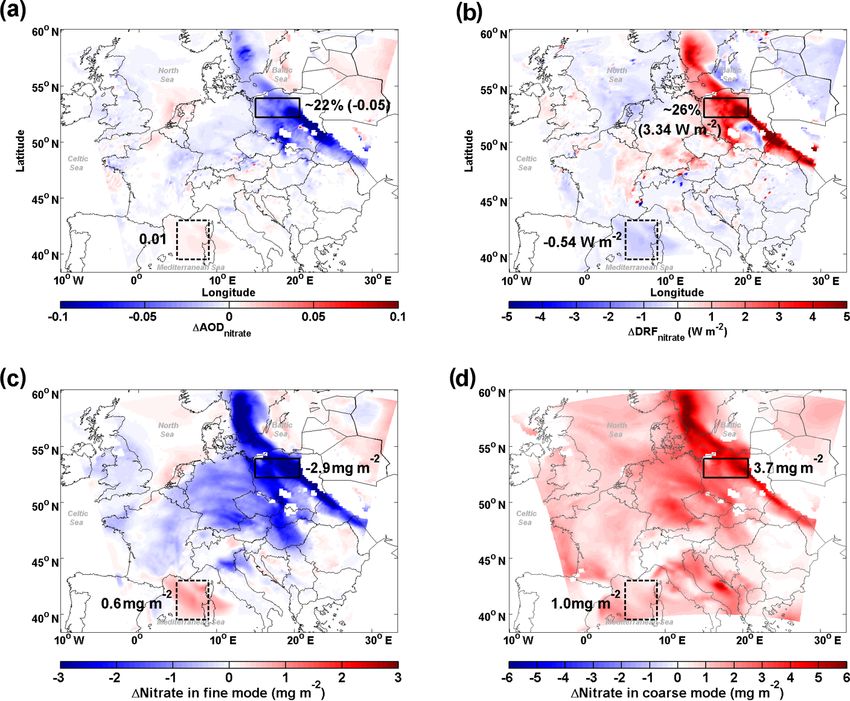
Y. Chen et al.: Natural sea-salt emissions                                                                                               777

Figure 5. Influence of sea salt on the abundance and direct radiative forcing of nitrate. (a) Differences (Case_SeasaltOn – Case_ SeasaltOff)
between simulations with and without sea-salt emission in aerosol optical depth (1AODnitrate ), (b) direct radiative forcing (1DRFnitrate ),
and column loading of nitrate (1Nitrate) for the (c) fine- and (d) coarse-mode particles, during daytime, i.e., 07:00–16:00 local time (LT) on
19 September 2013. The northern Poland and Mediterranean regions are marked by boxes with solid and dashed black frames, respectively.

mode (Croft et al., 2014; Chen et al., 2016b) further mod-               phenomenon. To demonstrate this, we conducted a sensitiv-
erating the nitrate cooling effect. Moreover, coarse-mode ni-            ity simulation with aerosol dry deposition turned off. We
trate associated with highly hygroscopic sea salt enhances               found that nitrate concentration kept increasing from 10.91 to
its water uptake (Chen et al., 2018a) and cloud condensa-                11.02 µg m−3 when sea-salt emission factors increased from
tion nuclei activation (Xu and Penner, 2012; Wang and Chen,              8 to 10, instead of showing a decreasing trend as in the simu-
2019), increasing its deposition and scavenging rate Itahashi            lations with aerosol dry deposition turned on. This indicates
et al. (2016) reported that oxidized nitrogen deposition can             an enhanced deposition of nitrate by interaction with sea salt,
be enhanced by 1.6–2.2 times over ocean regions in East                  which shortens nitrate lifetime and can further reduce nitrate
Asia by including sea-salt-associated nitrate. Liao and Se-              cooling.
infeld (2005) implied a similar enhancement for sulfate de-
position associated with sea salt and dust, which resulted in a          3.3    Competition between redistribution effect and
decrease in sulfate concentrations in downwind regions. Our                     mass-enhancement effect
study implies the enhancement of nitrate deposition. As one
can see in Fig. 6a, nitrate concentration (green dashed line)            As a result of competition between the sea-salt-induced re-
firstly increases with increasing sea salt and then slightly de-         distribution effect and mass-enhancement effect, a clear spa-
clines when the amount of sea salt (represented by sodium)               tial inhomogeneity can be found in Fig. 5. The redistri-
exceeds a certain level. An inflection point is observed when            bution effect decreases AODnitrate over the polluted conti-
the sodium concentration approached 5.5 µg m−3 (sea-salt                 nental regions, while the mass-enhancement effect increases
emission factor of 8); the nitrate starts to decrease as sodium          AODnitrate mostly over marine areas (Fig. 5a), although the
further increases (sea-salt emission factor of 10). The en-              absolute enhancement is rather small due to the low [NO−3 ] in
hancement of nitrate deposition should be the reason of this             this environment. For example, over the Mediterranean Sea

www.atmos-chem-phys.net/20/771/2020/                                                           Atmos. Chem. Phys., 20, 771–786, 2020
778                                                                                            Y. Chen et al.: Natural sea-salt emissions

Figure 6. Sensitivity of aerosol optical depth (1AOD) as a function of sodium mass concentration ([Na+ ]). Differences between
Case_SeasaltOff and sensitivity cases (sea-salt emission with different scaling factors) for different aerosol components, i.e., nitrate
(1AODnitrate ) and sea salt (1AODNaCl ): 1AOD (sensitivity case – Case_SeasaltOff) versus [Na+ ] over northern Poland (a) and Mediter-
ranean regions (b), respectively. The model results shown here are averages over a sea-salt event during daytime (07:00–16:00 LT) on
19 September 2013. The results of surface [NO−   3 ] are indicated by the dashed green line. Here, the Case_SeasaltOff is the reference case and
Case_SeasaltOn is marked. Note: 1AOD∗nitrate (dashed pink line) indicates the 1AOD of nitrate calculated by reallocating nitrate mass into
different size bins according to the normalized nitrate particle mass size distribution simulated in Case_SeasaltOff (i.e., without redistribution
effect). (c) The measured [Na+ ] at different sites over Sweden as a function of coast distance, as well as in Germany (marked in Fig. 3) and
the US. The box-and-whisker plots of the references marked (1)–(8) indicate the median, mean (black dot), 25th percentile, 75th percentile,
maximum and minimum. The error bar of reference no. (9) indicates the range. The dashed blue line of reference no. (10) indicates the
statistically empirical function of [Na+ ] with distance from coast, based on the network measurements of 16 sites in Sweden.

(marked by the box with a dashed black frame in Fig. 5),                   in Case_SeasaltOff) favor an efficient redistribution effect
the AODnitrate increases by ∼ 0.01 and the cooling effect                  that reduces AODnitrate and moderates nitrate cooling. To
of nitrate is amplified by ∼ 0.54 W m−2 (negligible with-                  compare the relative importance of the sea-salt-induced re-
out introducing sea-salt aerosol). A sensitivity study also                distribution effect and mass-enhancement effect on anthro-
shows a monotonic increase of AODnitrate with [Na+ ] over                  pogenic nitrate cooling, we conducted statistical analysis
the Mediterranean Sea (Fig. 6b), indicating a dominant role                of the molar ratio between fine nitrate in Case_SeasaltOff
of the mass-enhancement effect over regions with limited an-               and total sodium in Case_SeasaltOn (called RNS, RNS
thropogenic influence.                                                     = [NO−          +             −1
                                                                                   3 ]/[Na ] in mol mol ) with relation to the per-
   Thus, abundant sea-salt aerosol and pre-existing fine-                  centage change in nitrate AOD (surrogate of DRFnitrate )
mode nitrate (as if there was no sea-salt aerosol influence                between the two cases, i.e., (AODnitrate Case_SeasaltOn –

Atmos. Chem. Phys., 20, 771–786, 2020                                                           www.atmos-chem-phys.net/20/771/2020/
Y. Chen et al.: Natural sea-salt emissions 779
AODnitrate Case_SeasaltOff )/AODnitrate Case_SeasaltOn . We found
that the redistribution effect tends to be strong enough to
overwhelm the mass-enhancement effect when the RNS
value is in the range of about 1 to 30, corresponding to
∼ 70 % of the data points in the European domain, as de-
tailed in the Supplement (Fig. 7c and Sect. S4). Note that
only the surface concentrations were used for calculating the
RNS, because fine-mode ammonium nitrate is mostly limited
in the surface layer because emissions of NH3 are in the sur-
face layer. The sea salt (or sodium) aloft during the transport
process (as discussed in Sect. 3.1) did not exert the redistribu-
tion effect before being mixed down to the surface layer, and
it should not be included in the analysis. Therefore, we car-
ried out a statistical analysis with surface nitrate and sodium
concentrations to draw a more robust conclusion. When the
redistribution effect is sufficiently strong, the net reduction in
AODnitrate may even counteract the AOD enhancement con-
tributed by the additional sea-salt aerosol loading and lead to
an overall reduction in total AOD in many regions in Europe
(Fig. S6b and Sect. S5).
3.4 The redistribution effect over Europe
Due to the frequent interactions between sea-salt aerosol
and polluted air masses (Myhre et al., 2006; Xu and Pen-
ner, 2012), the moderation of nitrate cooling is expected to
be common over Europe, where the lower atmosphere is
characterized by RNS values between 1 and 30 (Fig. 7).
As discussed above (Figs. 6a and S6), considerable mod-
eration is expected over inland and central Europe, where
[Na+ ] > 2.5 µg m−3 is observed frequently (Gustafsson and
Franzén, 2000, also see Fig. 6c). Such moderation could be Figure 7. Intensity of the redistribution effect as a function of
even more relevant over coastal and continental outflow re- molar ratio between surface fine nitrate and total sodium (RNS)
gions of North America and Southeast Asia (discussed in the over the European domain. (a) The intensity of the redistribu-
next section), where high loadings of nitrate were observed tion effect is calculated as the difference in percentage between
and found to be significantly associated with sea-salt aerosol AODnitrate and AOD∗nitrate in Case_SeasaltOn; (b) the intensity of
(30 %–90 % of total nitrate) (Xu and Penner, 2012). mass-enhancement effect. The black dots indicate the mean values;
the upper and lower error bars indicate the 75th and 25th percentiles,
To quantify the possible overestimation of nitrate radiative
respectively; (c) the net effect of mass-enhancement and redistribu-
forcing when only the sea-salt-induced mass-enhancement tion effects; the color indicates the frequency distribution (i.e., how
effect was treated but not the redistribution effect, a sim- many counts) of the hourly model results over the entire European
ilar statistical analysis (Fig. 7a) is conducted for the per- domain during 16–20 September 2013. The coverage of model re-
centage change in nitrate AOD between the AODnitrate sults between the two dashed light-blue lines is ∼ 70 %.
in Case_SeasaltOn and the corresponding AOD∗nitrate , i.e.,
(AODnitrate – AOD∗nitrate )/AODnitrate . As described be-
fore, AODnitrate stands for the case where both mass- slightly conservative), despite the overestimation of particu-
enhancement and redistribution effects have been accounted late nitrate over Europe (Sect. S6). The uncertainty in depo-
for Case_SeasaltOn, while only the mass-enhancement ef- sition parameterizations could be one reason of this overesti-
fect is accounted for in AOD∗nitrate . Figure. 7b shows that mation, as suggested by the overestimation of sea-salt parti-
the AOD∗nitrate could increase by 5 %–30 % when introducing cles as well (Chen et al., 2016a) and the underestimation of
sea salt and only the mass-enhancement effect is considered. nitrogen deposition over Europe in many models (Vivanco et
Conversely, the statistics show that the redistribution ef- al., 2017). The upper limit of our result is comparable to a
fect tends to significantly reduce the nitrate AOD by 10 %– previous estimate of 25 % reduction in AODnitrate by sea-salt
20 % when there is abundant sea salt interacting with anthro- aerosol on a global scale by Myhre et al. (2006). They evalu-
pogenic nitrate (RNS < ∼ 30, Fig. 7a). Note that this estima- ated a similar redistribution effect of sea-salt aerosol. But the
tion of percentage reduction in AODnitrate is robust (may be simplifications of the mass transfer between fine and coarse
www.atmos-chem-phys.net/20/771/2020/ Atmos. Chem. Phys., 20, 771–786, 2020780 Y. Chen et al.: Natural sea-salt emissions
modes may lead to overestimation of the reduction (Sect. S1). AODnitrate over Europe. This result is consistent with a pre-
The redistribution effect becomes rather weak (limited within vious study (Myhre et al., 2006). Nevertheless, it is still pos-
10 %) as RNS further increased (RNS > ∼ 30) when marine sible that sea salt is transported (May et al., 2018) further in-
air masses are transported further inland. land over North America and impacts AODnitrate there. The
coastal and offshore regions of Asia with 11 ≤ RNS ≤ 30
3.5 The redistribution effect over North America and may experience strong reductions of AODnitrate , where the
on a global scale redistribution effect is expected to overwhelm the mass-
enhancement effect, such as coastal and outflow regions of
An additional simulation over North America confirms our China. The influence of sea-salt aerosol becomes negligible
findings. Similarly, as over Europe, the sea-salt-induced re- over inland Asia where the marine air mass influence is small
distribution effect predominates and reduces AODnitrate over (RNS > 30). For the open sea regions with RNS < 0.01 (white
industrialized and outflow regions of the North American do- background), the nitrate climate effect is not important, due
main (Fig. 8). Generally, a similar reduction in AODnitrate is to a very limited nitrate loading contributing to AODnitrate
found over North America due to the sea-salt-induced redis- (Fig. 10a).
tribution effect. A monotonous decrease (increase) of column
fine (coarse) nitrate loading is observed all over North Amer-
ica and oceanic regions (Fig. 8c and d). This sea-salt-induced 4 Summary and discussion
redistribution effect overwhelms the mass-enhancement ef-
fect over most regions and, thus, reduces AODnitrate (Fig. 8a) The interaction between natural sea-salt aerosols and anthro-
and cooling effect of nitrate especially over the Gulf of Mex- pogenic nitrate leads to the redistribution effect, which can
ico (Fig. 8b), although the total nitrate column loading in- shift the particulate nitrate from sub- to super-micron sizes.
creases significantly (Fig. S7). This is because the high con- This effect lowers its mass light extinction efficiency and
centration of nitrate in the continental outflow from North shortens its lifetime. This redistribution effect can signifi-
America and Central America strongly interacts with sea salt cantly moderate nitrate cooling.
over the Gulf of Mexico (Xu and Penner, 2012). The interaction between natural sea-salt aerosols and an-
The statistical analysis of the redistribution effect over thropogenic nitrate happens frequently over Europe (up to
North America (Fig. 9a) shows a similar pattern as over Eu- 90 % of the days in a year). We performed a series of sen-
rope (Fig. 7a), and a first-order approximation (R 2 > 90 %) sitivity studies during a typical sea-salt event over Europe,
is derived from the European and North American results of using the WRF-Chem model with a fully dynamic aerosol
the WRF-Chem model to parameterize the relationship be- mass transfer treatment coupled online. The redistribution ef-
tween RNS and the changes in AODnitrate associated with fect of nitrate is observed by field measurements and well
the redistribution effect (Fig. 9b). In general, the impact of captured by the Case_SeasaltOn simulation. Over the highly
the redistribution effect on AODnitrate decreases as RNS in- polluted northern Poland region, our sensitivity modeling re-
creases. Only considering the mass-enhancement effect but sults show that the redistribution effect can reduce AODnitrate
ignoring the redistribution effect may lead to an overestima- by about 20 %–30 %, or even up to ∼ 50 % when the sea-salt
tion of AODnitrate by about 20 % when RNS < 1, by about event is sufficiently strong. Conversely, if we only consider
10 %–20 % when 1 ≤ RNS ≤ 30 and by less than ∼ 10 % the increase of nitrate mass by introducing sea salt (mass-
when RNS > 30. enhancement effect) and ignore the redistribution effect, ni-
On a global scale, the potential influence of the redistri- trate AOD could increase by ∼ 8 % or even up to ∼ 30 % in
bution effect on AODnitrate is estimated by using the above a strong sea-salt event. We propose a single parameter, RNS
first-order approximation combined with a 1-year RNS sim- ([NO− + −1
3 ]/[Na ] in mol mol ), to describe the competition
ulation with the EMAC (Klingmüller et al., 2014; Pringle between the sea-salt-induced redistribution effect and the
et al., 2010) chemistry–climate model (Fig. 10). The global mass-enhancement effect. In general, (1) the sea-salt-induced
distributions of percentage changes in AODnitrate and sur- mass-enhancement effect is dominant over oceanic regions
face nitrate concentration are given in Fig. S8. In line with and tends to increase AODnitrate ; the dominance of mass-
the WRF-Chem results, a significant redistribution effect is enhancement effect could take place when RNS is lower
expected over North America and Europe, especially over than 1; (2) the sea-salt-induced redistribution effect on ni-
the coastal regions with high nitrate loading and RNS val- trate PMSD can decrease AODnitrate by about 10 %–20 % and
ues around 1 (Fig. 10b). As shown in Fig. 10c, the im- overwhelm the mass-enhancement effect, resulting in a net
pact over Europe is stronger than over North America. The reduction in AODnitrate ; this could take place when RNS is
oceanic influence dominates over western Europe, whereas in the range between 1 and 30; and (3) the influence of sea-
over North America the predominantly more continental air salt aerosol is not significant when RNS is higher than 30.
masses (Kottek et al., 2006) may be a possible reason of this. These findings are further confirmed by the sensitivity sim-
It leads to less interactions of sea salt with anthropogenic ulations over North America. The impact of the redistribu-
nitrate in North America and more significant reduction in tion effect on a global scale is estimated using global simu-
Atmos. Chem. Phys., 20, 771–786, 2020 www.atmos-chem-phys.net/20/771/2020/Y. Chen et al.: Natural sea-salt emissions 781
Figure 8. Influence of sea-salt aerosol on the abundance and direct radiative forcing of nitrate (similar to Fig. 5). (a) Differences (Case_
SeasaltOn – Case_SeasaltOff) between simulations with and without sea-salt emission in aerosol optical depth (1AODnitrate ), (b) direct
radiative forcing (1DRFnitrate ) and column loading of nitrate (1Nitrate) for the (c) fine- and (d) coarse-mode particles. The modeled results
shown here are averaged during daytime over the North American domain, i.e., 16:00–22:00 (UTC) on 10–17 January 2015.
lation of RNS. A significant redistribution effect is expected heterogeneous reaction and consumption of gaseous organic
over Europe, the Gulf of Mexico, Eastern Asia and coastal compounds and sulfuric and nitric acids on natural desert
and offshore regions worldwide, resulting in a reduction in dust (Usher et al., 2003; Ponczek and George, 2018; Dupart
AODnitrate by about 10 %–20 %. This study demonstrates the et al., 2012; Ravishankara, 1997), although nonvolatile par-
suppression of AOD and DRF of particulate nitrate by the re- ticulate sulfate does not shift from fine to the coarse-mode
distribution effect. In addition, the redistribution effect may aerosols. Uptake of acids by dust particles can shorten their
also reduce the number of cloud condensation nuclei (CCN) lifetimes and reduce their radiative forcing (Liao and Sein-
by lowering the nitrate concentration in fine particles, which feld, 2005; Harris et al., 2013; Karydis et al., 2016; Abdelka-
are the main contributors to CCN number. The hygroscopic- der et al., 2015), which could be significant over inland areas
ity of coarse sea-salt particles could also be reduced by as- where sea-salt aerosol is lacking. All these previous studies
sociating with nitrate, which might suppress cloud droplet imply the possibility that natural particles (sea-salt aerosol
activation (Xu and Penner, 2012). Further studies are needed and very likely dust as well) moderate the DRF of anthro-
to investigate the influences of the redistribution effect on pogenic aerosols and alter the nitrogen and sulfur deposition
aerosol–cloud interactions and indirect radiative forcing. efficiency. We highlight the importance of further study of
the interactions between natural and anthropogenic aerosols.
More comprehensive modeling studies with fully dynamic
5 Implication aerosol mass transfer treatments are needed for improving
the assessment of aerosol climate effect accounting for the
This study highlights the impact of the redistribution effect redistribution effect on a global scale.
on moderating nitrate cooling and altering the nitrogen depo-
sition efficiency by interacting with natural sea-salt aerosols
(Fig. 1). A similar redistribution effect may apply to the
www.atmos-chem-phys.net/20/771/2020/ Atmos. Chem. Phys., 20, 771–786, 2020782 Y. Chen et al.: Natural sea-salt emissions Figure 9. Intensity of redistribution effect as a function of molar ratio between surface fine nitrate and total sodium (RNS). (a) The intensity of the redistribution effect over the North American do- main, similar to Fig. 7a, is calculated as the difference in percentage between AODnitrate and AOD∗nitrate in Case_SeasaltOn. AOD∗nitrate indicates the AODnitrate calculated by reallocating nitrate mass into different size bins according to the normalized nitrate particle mass size distribution simulated in Case_SeasaltOff (i.e., without redis- tribution effect). The black dots indicate the mean values; the upper and lower error bars indicate the 75th and 25th percentiles, respec- tively. The color indicates the frequency distribution (i.e., how many counts) of the hourly model results over the entire North American domain during 10–17 January 2015. (b) The median possibility of the percentage change in AODnitrate as a function (first-order ap- proximation) of RNS. Data availability. WRF-Chem model code is openly avail- able from https://www2.acom.ucar.edu (NCAR/UCAR, 2020). Figure 10. The global distribution of annual mean AODnitrate (a), FINN fire emissions is openly available for download from RNS (b) and reduction in AODnitrate associated with the redistri- http://bai.acom.ucar.edu/Data/fire/ (Wiedinmyer et al., 2011). bution effect (c). The results of (a) and (b) are simulated with the NCEP FNL operational model global tropospheric analyses EMAC model; the results of (c) are estimated from the first-order (ds083.2) is openly available from https://rda.ucar.edu/data/ds083. approximation in Fig. 9b. 2/ (NCEP/National Weather Service/NOAA/U.S. Department of Commerce, 2000), and sea surface temperature data is openly available from https://polar.ncep.noaa.gov/sst/ (NCEP SST, 2019). AERONET and aerosol observational datasets are openly avail- Supplement. The supplement related to this article is available on- able for download from the websites https://aeronet.gsfc.nasa.gov/ line at: https://doi.org/10.5194/acp-20-771-2020-supplement. (AERONET, 2020) and http://ebas.nilu.no/default.aspx (EBAS, 2020). The European emission inventory is available from the AQMEII project (http://aqmeii.jrc.ec.europa.eu/, AQMEII, 2020) Author contributions. YaC led the study. YaC and YiC conceived and EUCAARI project (https://www.atm.helsinki.fi/eucaari/?q= and designed the study. YiC performed the WRF-Chem model sim- node/3, EUCAARI, 2020). The global emission inventory is ulations and processed the data. NM supported the optical calcu- available from the EDGAR project (http://edgar.jrc.ec.europa.eu, lation. CW supported the kinetic part of the model simulation and EDGAR, 2020). The results of the EMAC global model are result analyses. AP and JL provided the EMAC global simulation. available from https://doi.org/10.17635/lancaster/researchdata/297 GS carried out the aerosol chemical composition observations at (Chen et al., 2020). Melpitz. YiC, YaC and HS interpreted the results. All co-authors Atmos. Chem. Phys., 20, 771–786, 2020 www.atmos-chem-phys.net/20/771/2020/
Y. Chen et al.: Natural sea-salt emissions                                                                                             783

discussed the results. YiC and YaC wrote the article with inputs        Bauer, S. E., Koch, D., Unger, N., Metzger, S. M., Shindell, D. T.,
from all co-authors.                                                      and Streets, D. G.: Nitrate aerosols today and in 2030: a global
                                                                          simulation including aerosols and tropospheric ozone, Atmos.
                                                                          Chem. Phys., 7, 5043–5059, https://doi.org/10.5194/acp-7-5043-
Competing interests. The authors declare that they have no conflict       2007, 2007.
of interest.                                                            Bellouin, N., Rae, J., Jones, A., Johnson, C., Haywood, J., and
                                                                          Boucher, O.: Aerosol forcing in the Climate Model Intercompar-
                                                                          ison Project (CMIP5) simulations by HadGEM2-ES and the role
Acknowledgements. We thank Konrad Müller (TROPOS) for                     of ammonium nitrate, J. Geophys. Res.-Atmos., 116, D20206,
his contribution to the aerosol composition measurements.                 https://doi.org/10.1029/2011JD016074, 2011.
Yafang Cheng would also like to thank the Minerva Program of            Berner, A. and Luerzer, C.: Mass size distributions of traf-
MPG.                                                                      fic aerosols at Vienna, J. Phys. Chem., 84, 2079–2083,
                                                                          https://doi.org/10.1021/j100453a016, 1980.
                                                                        Bertram, T. H. and Thornton, J. A.: Toward a general parameteriza-
                                                                          tion of N2 O5 reactivity on aqueous particles: the competing ef-
Financial support. This research has been supported by the
                                                                          fects of particle liquid water, nitrate and chloride, Atmos. Chem.
German Federal Ministry of Education and Research (grant
                                                                          Phys., 9, 8351–8363, https://doi.org/10.5194/acp-9-8351-2009,
no. 01LK1212C), the National Natural Science Foundation
                                                                          2009.
of China (91644218), the National Key R&D Program of
                                                                        Birmili, W., Wiedensohler, A., Heintzenberg, J., and
China (2017YFC0210104) and Guangdong Innovative and En-
                                                                          Lehmann, K.: Atmospheric particle number size distribu-
trepreneurial Research Team Program (2016ZT06N263).
                                                                          tion in central Europe: Statistical relations to air masses
                                                                          and meteorology, J. Geophys. Res., 106, 32005–32018,
The publication of this article was funded by the
                                                                          https://doi.org/10.1029/2000JD000220, 2001.
Open Access Fund of the Leibniz Association.
                                                                        Chen, Y., Zhao, C., Zhang, Q., Deng, Z. Z., Huang, M. Y.,
                                                                          and Ma, X. C.: Aircraft study of mountain chimney effect
                                                                          of Beijing, china, J. Geophys. Res.-Atmos., 114, D08306,
Review statement. This paper was edited by Pedro Jimenez-                 https://doi.org/10.1029/2008JD010610, 2009.
Guerrero and reviewed by Daniel Neumann and one anonymous               Chen, Y., Cheng, Y., Ma, N., Wolke, R., Nordmann, S., Schüt-
referee.                                                                  tauf, S., Ran, L., Wehner, B., Birmili, W., van der Gon,
                                                                          H. A. C. D., Mu, Q., Barthel, S., Spindler, G., Stieger, B.,
                                                                          Müller, K., Zheng, G.-J., Pöschl, U., Su, H., and Wieden-
                                                                          sohler, A.: Sea salt emission, transport and influence on size-
References                                                                segregated nitrate simulation: a case study in northwestern Eu-
                                                                          rope by WRF-Chem, Atmos. Chem. Phys., 16, 12081–12097,
Abdelkader, M., Metzger, S., Mamouri, R. E., Astitha, M., Barrie,         https://doi.org/10.5194/acp-16-12081-2016, 2016a.
  L., Levin, Z., and Lelieveld, J.: Dust–air pollution dynamics over    Chen, Y., Cheng, Y.-F., Nordmann, S., Birmili, W., Denier van
  the eastern Mediterranean, Atmos. Chem. Phys., 15, 9173–9189,           der Gon, H. A. C., Ma, N., Wolke, R., Wehner, B., Sun, J.,
  https://doi.org/10.5194/acp-15-9173-2015, 2015.                         Spindler, G., Mu, Q., Pöschl, U., Su, H., and Wiedensohler,
Adams, P. J., Seinfeld, J. H., Koch, D., Mickley, L., and Ja-             A.: Evaluation of the size segregation of elemental carbon
  cob, D.: General circulation model assessment of direct radia-          (EC) emission in Europe: influence on the simulation of EC
  tive forcing by the sulfate-nitrate-ammonium-water inorganic            long-range transportation, Atmos. Chem. Phys., 16, 1823–1835,
  aerosol system, J. Geophys. Res.-Atmos., 106, 1097–1111,                https://doi.org/10.5194/acp-16-1823-2016, 2016b.
  https://doi.org/10.1029/2000JD900512, 2001.                           Chen, Y., Wild, O., Wang, Y., Ran, L., Teich, M., Größ, J., Wang,
AERONET: Aerosol Robotic Network, available at: https://aeronet.          L., Spindler, G., Herrmann, H., van Pinxteren, D., McFiggans,
  gsfc.nasa.gov/, last access: 21 January 2020.                           G., and Wiedensohler, A.: The influence of impactor size cut-off
Archer-Nicholls, S., Lowe, D., Utembe, S., Allan, J., Zaveri,             shift caused by hygroscopic growth on particulate matter loading
  R. A., Fast, J. D., Hodnebrog, Ø., Denier van der Gon, H.,              and composition measurements, Atmos. Environ., 195, 141–148,
  and McFiggans, G.: Gaseous chemistry and aerosol mech-                  https://doi.org/10.1016/j.atmosenv.2018.09.049, 2018a.
  anism developments for version 3.5.1 of the online re-                Chen, Y., Wolke, R., Ran, L., Birmili, W., Spindler, G.,
  gional model, WRF-Chem, Geosci. Model Dev., 7, 2557–2579,               Schröder, W., Su, H., Cheng, Y., Tegen, I., and Wiedensohler,
  https://doi.org/10.5194/gmd-7-2557-2014, 2014.                          A.: A parameterization of the heterogeneous hydrolysis of
Archer-Nicholls, S., Lowe, D., Lacey, F., Kumar, R., Xiao,                N2 O5 for mass-based aerosol models: improvement of par-
  Q., Liu, Y., Carter, E., Baumgartner, J., and Wiedin-                   ticulate nitrate prediction, Atmos. Chem. Phys., 18, 673–689,
  myer, C.: Radiative Effects of Residential Sector Emis-                 https://doi.org/10.5194/acp-18-673-2018, 2018b.
  sions in China: Sensitivity to Uncertainty in Black Car-              Chen, Y., Lelieveld, J., and Pozzer, A.: EMAC_2010.nc, Lancaster
  bon Emissions, J. Geophys. Res.-Atmos., 124, 5029–5044,                 University, https://doi.org/10.17635/lancaster/researchdata/297,
  https://doi.org/10.1029/2018JD030120, 2019.                             2020.
AQMEII: Air Quality Modelling Evaluation International Initiative,      Chou, M.-D., Suarez, M. J., Ho, C.-H., Yan, M. M. H.,
  available at: http://aqmeii.jrc.ec.europa.eu/, last access: 21 Jan-     and Lee, K.-T.: Parameterizations for Cloud Overlap-
  uary 2020.

www.atmos-chem-phys.net/20/771/2020/                                                         Atmos. Chem. Phys., 20, 771–786, 2020
You can also read