Modeling dust sources, transport, and radiative effects at different altitudes over the Tibetan Plateau
←
→
Page content transcription
If your browser does not render page correctly, please read the page content below
Atmos. Chem. Phys., 20, 1507–1529, 2020
https://doi.org/10.5194/acp-20-1507-2020
© Author(s) 2020. This work is distributed under
the Creative Commons Attribution 4.0 License.

Modeling dust sources, transport, and radiative effects at different
altitudes over the Tibetan Plateau
Zhiyuan Hu1,2 , Jianping Huang1 , Chun Zhao3 , Qinjian Jin4 , Yuanyuan Ma5 , and Ben Yang6
1 Key Laboratory for Semi-Arid Climate Change of the Ministry of Education, College of Atmospheric Sciences,
Lanzhou University, Lanzhou, China
2 School of Atmospheric Sciences and Guangdong Province Key Laboratory for Climate Change and Natural Disaster Studies,

Sun Yat-sen University, Zhuhai, China
3 School of Earth and Space Sciences, University of Science and Technology of China, Hefei, Anhui, China
4 Department of Geography and Atmospheric Science, The University of Kansas, Lawrence, KS, USA
5 Key Laboratory of Land Surface Process and Climate Change in Cold and Arid Regions,

Northwest Institute of Eco-Environment and Resources, Chinese Academy of Sciences, Lanzhou, China
6 School of Atmospheric Sciences, Nanjing University, Nanjing, China

Correspondence: Jianping Huang (hjp@lzu.edu.cn)

Received: 6 May 2019 – Discussion started: 7 August 2019
Revised: 29 November 2019 – Accepted: 21 December 2019 – Published: 7 February 2020

Abstract. Mineral dust plays an important role in the cli-         ported to the north and over the TP, mass loadings are 5–
mate of the Tibetan Plateau (TP) by modifying the radiation        10 mg m−2 above a height of 6 km.
budget, cloud macro- and microphysics, precipitation, and             The dust mass flux carried from East Asia to the TP is
snow albedo. Meanwhile, the TP, with the highest topogra-          7.9 Tg yr−1 , mostly occurring at heights of 3–6 km. The dust
phy in the world, can affect intercontinental transport of dust    particles from North Africa and the Middle East are trans-
plumes and induce typical distribution characteristics of dust     ported eastward following the westerly jet and then are car-
at different altitudes. In this study, we conduct a quasi-global   ried into the TP at the west side with dust mass fluxes
simulation to investigate the characteristics of dust source       of 7.8 and 26.6 Tg yr−1 , respectively. The maximum mass
contribution and transport over the TP at different altitudes      flux of the North African dust mainly occurs at 0–3 km
by using a fully coupled meteorology–chemistry model, the          (3.9 Tg yr−1 ), while the Middle Eastern dust occurs at 6–
Weather Research and Forecasting model with chemistry              9 km (12.3 Tg yr−1 ). The dust outflow occurs on the east
(WRF-Chem), with a tracer-tagging technique. Generally,            side (−17.89 Tg yr−1 ) and south side (−11.22 Tg yr−1 ) of
the simulation reasonably captures the spatial distribution of     the TP, with a peak value (8.7 Tg yr−1 ) at 6–9 km. Moreover,
satellite-retrieved dust aerosol optical depth (AOD) at dif-       the dust (by mass) is concentrated within the size range of
ferent altitudes. Model results show that dust particles are       1.25–5.0 µm and the dust (by particle number) is concen-
emitted into atmosphere through updrafts over major desert         trated in the size range of 0.156–1.25 µm. Compared with
regions and then transported to the TP. The East Asian dust        other aerosols, the dust contributes to more than 50 % of
(mainly from the Gobi and Taklamakan deserts) is trans-            the total AOD over the TP. The direct radiative forcing in-
ported southward and is lifted up to the TP, contributing a        duced by the dust is −1.28 W m−2 at the top of the atmo-
mass loading of 50 mg m−2 at a height of 3 km and 5 mg m−2         sphere (cooling), 0.41 W m−2 in the atmosphere (warming),
at a height of 12 km over the northern slope of the TP. Dust       and −1.68 W m−2 at the surface (cooling). Our quantitative
from North Africa and the Middle East are concentrated over        analyses of the dust contributions from different source re-
both of the northern and southern slopes below 6 km, where         gions and the associated radiative forcing can help us to bet-
mass loadings range from 10 to 100 and 1 to 10 mg m−2 be-          ter understand the role of dust on the climate over the TP and
low 3 km and above 9 km, respectively. As the dust is trans-       surrounding regions.

Published by Copernicus Publications on behalf of the European Geosciences Union.
1508                                                     Z. Hu et al.: Modeling dust sources, transport, and radiative effects

1   Introduction                                                   contribute to these changes, such as absorbing aerosols (e.g.,
                                                                   dust and black carbon), which can heat the atmosphere and
Mineral dust, emitted from deserts such as the Sahara, Ara-        reduce the snow albedo (Kang et al., 2000; Lau et al., 2006,
bian, Gobi, and Taklamakan, is a major contributor to the          2010; Xu et al., 2009). The intercontinental transport of dust
global aerosol burden (e.g., Uno et al., 2009; Yu et al., 2012;    aerosols originating from surrounding major deserts, i.e., the
Hu et al., 2016; Chen et al., 2018). Dust aerosols can be lifted   Gobi and Taklamakan deserts on the northern side and Sahara
into the upper troposphere by the strong frontal/postfrontal       and Arabian deserts on the western side, frequently assaults
convection from major desert source regions and then trans-        the TP (Huang et al., 2008; Liu et al., 2008) and greatly in-
ported to downwind regions following the westerlies (Zhao          fluences the regional climate over the TP (Lau et al., 2006;
et al., 2006; Hu et al., 2019a, b), with parts of the dust even    Wu et al., 2007). Meanwhile, the TP plays an important role
being transported for one full circuit around the globe (Uno       in the global-scale transport of dust through dynamical and
et al., 2009). During the intercontinental transport, dust has     thermal forcing in the mid-latitudes (Xu et al., 2018). When
a significant effect on the regional and global climate system     dust plumes arrive at the TP, they are split into two branches
(Lau et al., 2006; Jin et al., 2015; Pu and Ginoux, 2018; Chen     and stack up around the slopes of the TP (Lau et al., 2006;
et al., 2018). For instance, previous studies showed that dust     Jin et al., 2016; Hu et al., 2019a); then dust particles rise to
could change the atmospheric heating and affect atmospheric        the TP due to the topographic uplifting. Because of a strong
circulation patterns in the middle and upper troposphere (Lau      ability to absorb and scatter solar radiation, dust can heat
et al., 2006; Lau and Kim, 2006; Alizadeh-Choobari et al.,         up the air in the mid-to-upper troposphere (Lau et al., 2006;
2014). Further, dust could spur anomalous water cycle feed-        Lau and Kim, 2006; Nigam and Bollasina, 2010; D’Errico et
back and alter the rainfall distribution over East Asia (Lau       al., 2015), which provides cyclonic conditions in the lower
et al., 2016; Liu et al., 2011) and South Asia (Lau and Kim,       layer and induces dry convention over the TP (Ma et al.,
2006; Kim et al., 2017; Jin et al., 2014; Jin and Wang, 2017).     2011; Xu et al., 2018). Under these conditions, dust particles
Dust particles were also found to change regional radiation        can be more easily elevated into the upper troposphere and
budget (Huang et al., 2005, 2006; Zhao et al., 2014; Bi et         lower stratosphere and then continue the long-range trans-
al., 2017) by scattering and absorbing the solar radiation and     port with a relatively longer lifetime in the upper troposphere
modifying the properties of clouds (Li et al., 2017, 2018) by      and lower stratosphere (Huang et al., 2008; Xu et al., 2018).
serving as cloud condensation nuclei and ice nuclei. Dust          Also, because of the rising of hot air induced by absorbing
aerosols also exacerbate air quality (Chin et al., 2007; Hu        aerosols (e.g., dust or black carbon) over the TP, more warm
et al., 2016) and reduce regional visibility (Watson, 2002).       and moist air is drawn into the Indian subcontinent, leading
When deposited on the surface of snow/ice, dust could accel-       to an earlier onset of the South Asian summer monsoon and
erate the snowmelt and glacier retreat and change the hydro-       an intensification of the summer rainfall over the Indian sub-
logical cycle (Qian et al., 2009; Painter et al., 2010; Huang et   continent (Lau et al., 2006).
al., 2011; Zhao et al., 2014); when deposited into rainforests        Although the long-range transport dust aerosols play an
and oceans, dust could provide nutrients to ecosystems and         essential role in a rapid climate change over the TP, the char-
influence the carbon cycle (Mahowald et al., 2008; Yu et al.,      acteristics of vertical distribution of dust are not well studied
2015).                                                             and are crucial to understanding the intercontinental trans-
   As the highest plateau (average elevation of about 4000 m)      port of dust (Bourgeois et al., 2015; Xu et al., 2018). Us-
in the world, the Tibetan Plateau (TP) has received extensive      ing the Cloud-Aerosol Lidar and Infrared Pathfinder Satellite
scientific attention in the past decades due to its unique to-     Observation (CALIPSO) retrievals, Xu et al. (2018) showed
pographic characteristics (Ma et al., 2014; Yao et al., 2012).     that the dust particles were uplifted to the middle troposphere
The TP exerts profound influences on the climate system in         over the source region and then transported eastward. When
the Northern Hemisphere by modulating the thermodynam-             the dust particles reached the TP, they were lifted up to the
ics of the atmosphere (Yeh et al., 1957; Ye and Wu, 1998;          upper troposphere, with a dust mass flux of about 1010 g inte-
Wu et al., 2007). Generally, the TP serves as a huge heat          grated across a 2◦ -latitude segment, by the dry and deep con-
source in the middle and upper troposphere that significantly      vections that were prevailing in spring. Chen et al. (2013) ad-
affects the Asian summer monsoon, while in winter the TP,          dressed a dust storm that occurred in the Taklimakan Desert
as a giant wall across the Eurasian continent, can block cold      during 26–30 July 2007. They pointed out that a value of
outbreaks from the north and confines the winter monsoon to        6.6 Gg d−1 mass flux was brought into the TP and −5.58,
eastern and southern Asia (Wu et al., 2012). Recent studies        1.61, and −3.97 W m−2 of dust radiative forcing were pro-
have indicated that the climate of the TP is warming rapidly       duced at the surface, in the atmosphere and at the top of the
(e.g., Duan and Wu, 2008; Wang et al., 2008; Xu et al., 2009;      atmosphere (TOA), respectively. However, we are not aware
Kang et al., 2010) and the glacier retreat is accelerating (Yao    of studies of the dust source contributions at different alti-
et al., 2007). These changes over the TP are primarily at-         tudes over the TP.
tributed to increasing greenhouse gases (e.g., Duan et al.,           In general, many studies focused on dust events over the
2006; Ren et al., 2006), but other major factors could also        TP (Uno et al., 2004; Huang et al., 2007, 2008; Yumimoto et

Atmos. Chem. Phys., 20, 1507–1529, 2020                                             www.atmos-chem-phys.net/20/1507/2020/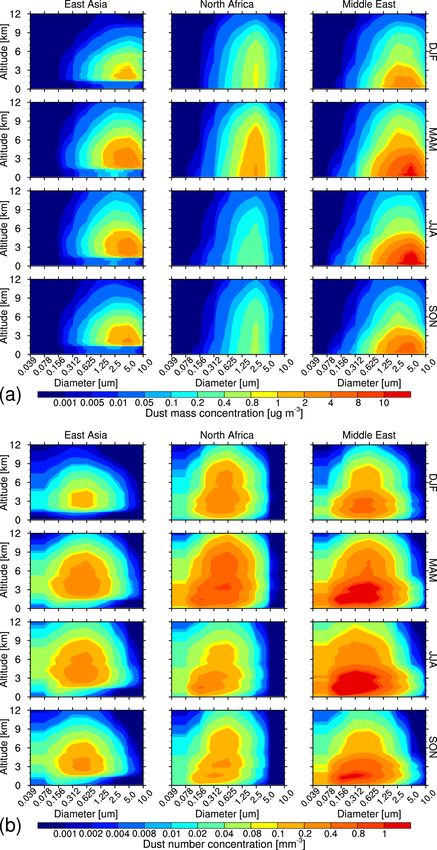
Z. Hu et al.: Modeling dust sources, transport, and radiative effects                                                        1509

al., 2009, 2010; Chen et al., 2013). They showed that the dust     vations. In Sect. 5, the main results will be presented, includ-
could make an important impact on aerosol mass loading             ing the transport characteristics of dust from different source
throughout the year, with the largest efficiency in spring and     regions, the contribution of different major deserts to the dust
summer (Uno et al., 2004; Huang et al., 2007, 2008; Chen           mass and number of particles at different altitudes over the
et al., 2013). For example, Middleton (1986) showed that the       TP, the dust mass flux carried into and flowing out from the
dust coupled with locally generated pollution aerosols from        TP, and the dust radiative forcing. The conclusion is summa-
the Arabian Peninsula and Indian subcontinent was trans-           rized in Sect. 6.
ported and loaded into the TP over the southern slope. The
strength of the North African and Arabian Peninsula dust
had a significantly seasonal variability, and it was observed      2     Model
to peak in summer (Liu et al., 2008; Alizadeh-Choobari et
                                                                   2.1    WRF-Chem
al., 2014; Jin et al., 2016). Huang et al. (2007) indicated that
dust plumes originating from the nearby Taklimakan desert          In this study, the WRF-Chem model is updated at the Uni-
were lifted to a very high altitude (7–10 km) over the north-      versity of Science and Technology of China (USTC) based
ern slope. Chen et al. (2017) pointed out that a dust storm oc-    on version 3.5.1 (Zhao et al., 2013b, 2014; Hu et al., 2016),
curring in 18–23 March 2010 brought dust aerosols from the         including, particularly, the capability of quasi-global simula-
Taklimakan Desert dust (up to 0.8 t d−1 ) and the Gobi Desert      tion and tracer source tagging (Hu et al., 2019a, b). It incor-
(up to 3.7 t d−1 ) into the TP. So far, however, few studies       porates the Model for Simulation Aerosol Interactions and
have described the dust plumes transported into the TP from        Chemistry (MOSAIC) aerosol scheme (Zaveri et al., 2008)
a climatological view. Moreover, although the global-scale         and the Carbon Bond Mechanism (CBM-Z) photochemical
transport of dust has been studied using both observations         mechanism (Zaveri and Peters, 1999) for simulating the com-
and model simulations, the spatiotemporal characteristics of       plex photolysis rates and aerosol radiative properties (Fast et
dust particle size and number and their associated climatic        al., 2006). Eight size bins are used in the MOSAIC aerosol
impact are poorly understood (Zhao et al., 2013b). The dust        scheme to describe the aerosol size distributions using the
particle number could be used to determine the number of           bin approach (Fast et al., 2006), which could better repre-
cloud condensation nuclei and/or ice nuclei (e.g., Liu and         sent the spatial distribution of the dust particles and dust
Penner, 2005; DeMott et al., 2010) and dust particle depo-         size loading than 3-mode and 4-bin approaches (Zhao et al.,
sition (Zhao et al., 2013b). Consequently, this could affect       2013b). Meanwhile, all major aerosol components includ-
the precipitation by modifying the cloud formation and dis-        ing mineral dust, sulfate (SO−2                      +
                                                                                                  4 ), ammonium (NH4 ), nitrate
tribution over the TP (Huang et al., 2014; Li et al., 2016) and         −
                                                                   (NO3 ), organic matter (OM), black carbon (BC), and sea
further change the hydrological cycle, influencing the lives       salt are simulated in the model to represent the sophisticated
of people in South and East Asia (Xu et al., 2009; Yao et al.,     chemistry during the long-range transport. The aerosol phys-
2012).                                                             ical and chemical processes in MOSAIC include coagula-
   In this study, we implement a newly developed tracer-           tion, condensation, nucleation, water uptake, and aqueous-
tagging method in the Weather Research and Forecasting             phase chemistry. The aerosol dry deposition approach in-
model with chemistry (WRF-Chem) to characterize the in-            cluding gravitational settling and turbulent diffusion follows
tercontinental transports of dust emitted from different ma-       Binkowski and Shankar (1995). Wet removal of aerosols in-
jor desert sources and quantify their contributions to the to-     duced by grid precipitation and resolved stratiform clouds
tal dust mass loading over the TP (Wang et al., 2014; Hu et        is simulated using the approach of Easter et al. (2004) and
al., 2016, 2019a). A 6-year (2010–2015) quasi-global simu-         Chapman et al. (2009). A function depending on wavelength
lation is conducted in the updated version of WRF-Chem.            is used for the aerosol optical properties of each model’s grid
Hu et al. (2016; 2019a, b) have shown that model results           box. The aerosol longwave (LW) and shortwave (SW) re-
could represent the dust intercontinental transport over East      fractive indices use the Optical Properties of Aerosols and
Asia and the Pacific Ocean well when compared with mul-            Clouds (OPAC) dataset, except for the SW refractive index
tiple observations. Here, our purposes are to (1) explore the      of dust, which is defined as 1.53 + 0.003i, following Zhao
transport characteristics of dust particles from different ma-     et al. (2010, 2011). Zhao et al. (2013a) implemented the
jor deserts at different altitudes over the TP, (2) describe the   aerosol radiative feedback for LW and SW radiation into
dust particle size distributions at different altitudes over the   WRF-Chem, which had been coupled with the Rapid Radia-
TP, (3) analyze the dust radiative forcing over the TP, and (4)    tive Transfer Model (RRTMG) (Mlawer et al., 1997; Iacono
compare dust mass and particle number concentrations with          et al., 2000).
other aerosols at different altitudes over the TP.
   The model setup and satellite retrievals will be described      2.2    Dust emission
in Sects. 2 and 3, respectively. In Sect. 4, we will evaluate
the simulated dust aerosol optical depth (AOD) from WRF-           The dust emissions are simulated by the Goddard Chemistry
Chem at different altitudes over the TP against satellite obser-   Aerosol Radiation and Transport (GOCART) model (Ginoux

www.atmos-chem-phys.net/20/1507/2020/                                               Atmos. Chem. Phys., 20, 1507–1529, 2020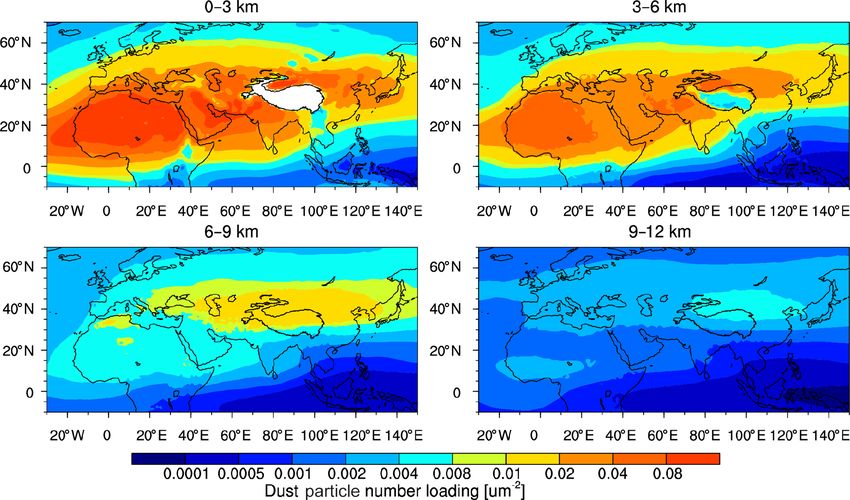
1510                                                      Z. Hu et al.: Modeling dust sources, transport, and radiative effects

et al., 2001), which has been fully coupled with the MOSAIC         tinental transport. In the model, four dust source regions are
in WRF-Chem (Zhao et al., 2010). Zhao et al. (2010) and Hu          selected, i.e., East Asia (25–50◦ N and 75–150◦ E), North
et al. (2016; 2019a, b) pointed out that the model could repre-     Africa (0–40◦ N and 20◦ W–35◦ E), North America (15–
sent the dust emission distributions and long-range transport       50◦ N and 80–140◦ W), and the elsewhere in the world (dom-
processes over the Northern Hemisphere well. In GOCART,             inated by the Middle Eastern dust in the Northern Hemi-
the dust emission flux G is calculated as                           sphere, 0–50◦ N and 35–75◦ E). The dust particles emitted
                                                                    from the four source regions are tagged and explicitly tracked
G = CSsp u210 m (u10 m − ut ),                                      using additional model variables within a single simulation
                                                                    in the model, following Hu et al. (2016, 2019a, b) and Mao
where C (µg s2 m−5 ) is defined as a dimensionless empiri-          et al. (2019). During the model simulation, the physical and
cal proportionality constant with the value of 1.0 µg s2 m−5        advective tendencies of all tagged dust variables are treated
provided by Ginoux et al. (2001), S is soil erodibility calcu-      in the same way. Therefore, the contribution of a dust source
lated by a potential dust source function, sp is a fraction of      to the dust quantity in a receptor region is defined by the ra-
the mass of each size bin of dust emissions, u210 m (m s−1 ) is     tio of the dust quantity in the receptor region from the dust
the horizontal wind speed at 10 m above the surface, and ut         source to the dust quantity of all sources combined. This di-
is the wind speed threshold under which dust emissions do           rect tagging technique neither introduces aerosol source per-
not occur and is a function of surface moisture, air density,       turbations to the model nor employs assumptions of aerosol
and particle size. To match the particle size distribution in the   sources/sinks along the transport pathways (Hu et al., 2019a;
aerosol scheme, the dust mass fractions are set to 45 %, 26 %,      Mao et al., 2019). Zhao et al. (2013b) pointed out that the up-
6 %, 1.5 %, 0.2 %, 0.02 %, 10−4 %, and 10−6 %. The dust             dated model could better simulate the distribution of aerosol
emissions within the research area are indicated in Fig. 1a.        size and particle number and give more detailed informa-
Clearly, dust emission from the TP is much smaller than that        tion about the horizontal and vertical distribution of aerosols
of the Gobi and Taklamakan deserts, so the East Asian dust          and the aerosol intercontinental transport process. More de-
defined here is mainly contributed to by dust emitted from          tailed information on the numerical experiment, including
the Gobi and Taklamakan deserts.                                    the physical and chemical schemes, can be found in Hu et
                                                                    al. (2016).
2.3    Other emissions

The Hemispheric Transport of Air Pollution version 2                3     Satellite retrievals
(HTAPv2) is used in the simulations, as anthropogenic emis-
sions with a monthly temporal resolution and 0.1◦ × 0.1◦            3.1    MODIS
horizontal resolution (Janssens-Maenhout et al., 2015). The
Fire INventory from NCAR (FINN) supplies biomass burn-              The AOD datasets obtained from the Moderate Resolution
ing emissions with 1 km horizontal resolution and hourly            Imaging Spectroradiometer (MODIS) instrument on board
temporal resolution (Wiedinmyer et al., 2011), and the ver-         the NASA EOS Terra satellite are used to evaluate model
tical distribution follows the injection heights suggested by       simulations. It provides datasets with daily and 1◦ × 1◦ reso-
Dentener et al. (2006). The sea salt emissions were obtained        lution for the period of 2010–2015. In order to better qual-
from Jaeglé et al. (2011), depending on sea surface temper-         ify, presumably, the AOD, the “dark target” algorithm is
ature, and Gong (2003), based on the correction of particles        used to retrieve aerosol size parameters and AOD over veg-
with a radius of less than 0.2 µm.                                  etated and waters lands (Kaufman et al., 1997; Remer et al.,
                                                                    2005), and the “deep blue” algorithm is used to retrieve the
2.4    Numerical experiments                                        AOD over vegetated land and bright targets (Hsu et al., 2006,
                                                                    2013). The uncertainties in the merged AODs (at 550 nm)
Following Hu et al. (2016), a quasi-global WRF-Chem                 from MODIS Collection 6 are about 0.11 over the globe and
simulation was performed at 1◦ horizontal resolution with           0.069 over northeast Asia (Sayer et al., 2014) when com-
360 × 145 grid cells (180◦ W–180◦ E, 67.5◦ S–77.5◦ N) and           pared with AErosol RObotic NETwork (AERONET) obser-
35 vertical layers up to 50 hPa over the period of 2010–            vations. In this study, the dark-target-retrieved AOD over
2015 (Fig. 1b). The lateral meridional boundary conditions          ocean and deep-blue-retrieved AOD over land are merged in
and meteorological initial conditions are obtained from the         MODIS Collection 6.
National Center for Environmental Prediction final analysis
(NCEP FNL) data at 6 h temporal and 1◦ horizontal resolu-           3.2    MISR
tion. In order to better modeling aerosol long-range trans-
port, the nudged method is used to provide more realistic at-       The AOD from the Multi-angle Imaging SpectroRadiometer
mospheric temperature and wind components (Stauffer and             (MISR) Level 2 version 23 aerosol data is also used. MISR
Seaman, 1990). In addition, a tracer-tagging method is used         instrument on board the Terra spacecraft is designed to view
to tag and explicitly track dust particles during the intercon-     the Earth using nine separate cameras. Four spectral bands

Atmos. Chem. Phys., 20, 1507–1529, 2020                                                www.atmos-chem-phys.net/20/1507/2020/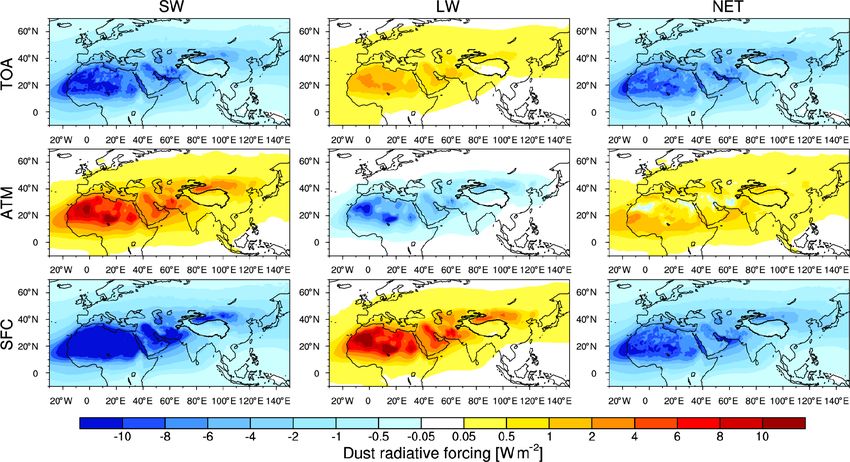
Z. Hu et al.: Modeling dust sources, transport, and radiative effects 1511
Figure 1. Spatial distribution of annual mean (a) dust emission (micrograms per square meter per second) and (b) elevation (meters) simulated
in WRF-Chem for the period of 2010–2015.
(centered at 446, 558, 672, and 866 nm) are measured along 4 Evaluation of AOD and dust AOD simulated by
the orbital track angles with a range of ±70.5◦ (Diner et WRF-Chem
al., 1998). They can provide well the retrieval of AOD daily
products (Level 2) with a spatial resolution of 0.5◦ × 0.5◦ , es-
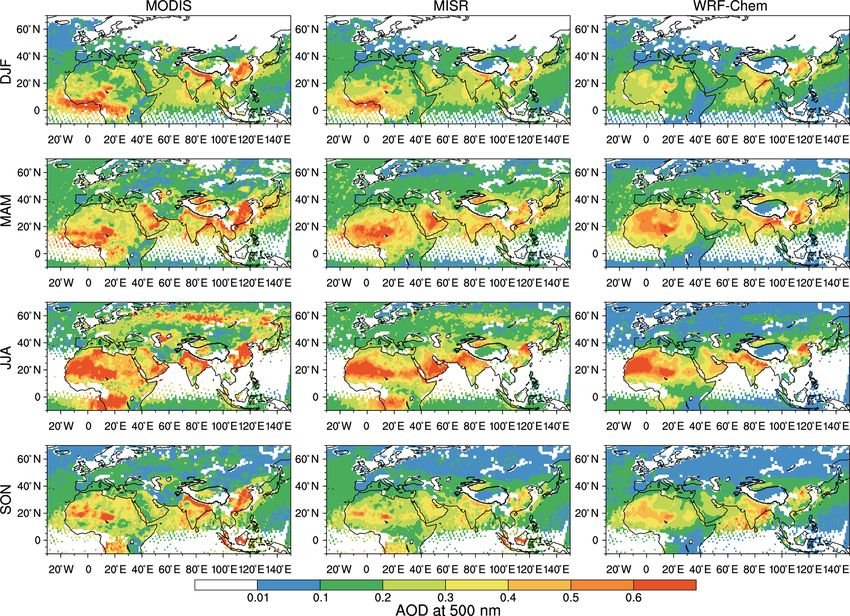
Figure 2 illustrates the spatial distributions of the observed
pecially over highly reflective surfaces such as deserts (Mar-
(MODIS and MISR on board Terra) and modeled (WRF-
tonchik et al., 2002). The uncertainties in the MISR AOD
Chem simulation) seasonal AOD at 550 nm for the period
(version 23) is about 0.049, which is more realistic than the
of 2010–2015. The simulated AOD is interpolated at 550 nm
0.003 uncertainty in version 22 products (Witek et al., 2018).
using the Ångström exponent from 400 and 600 nm results
Here, we compare the MISR AOD at 550 nm from Level 2
due to the wavelength discrepancy between simulations and
with the model results. Notice that the model results are sam-
observation. Also, we extract and average the simulated AOD
pled in the same time as the MISR overpass.
at 10:30 LT (local time) to match the MISR and MODIS re-
3.3 CALIPSO trievals. Because of the missing values of satellite retrievals,
there are blank areas over the ocean, which are relatively
The aerosol extinction profiles retrieved by the Cloud- larger from June through August (JJA) (Hu et al., 2016). The
Aerosol Lidar with Orthogonal Polarization (CALIOP) are MODIS retrievals show a higher AOD over anthropogenic
used in this study. It was launched into a Sun-synchronous polluted regions (i.e., eastern China and southern India) and
orbit on board the CALIPSO satellite on 28 April 2006. the major desert regions (i.e., the Sahara, Arabian, Gobi, and
The vertical profiles of attenuated backscatter can be ac- Taklamakan deserts) than the MISR retrievals and model
quired during both night and day (Winker et al., 2007). The simulations. This is partly because the MODIS retrievals
CALIPSO level 3 profile products, which are retrieved from overestimate the AOD magnitude in semi-arid regions due
level 2 aerosol profile datasets through a quality screen, are to the large uncertainties associated with the assumed surface
used to evaluate the model. For the CALIPSO aerosol extinc- reflectance (Remer et al., 2005; Levy et al., 2013). Relatively,
tion retrievals, the uncertainties are mainly determined by the the MISR characterizes a better land surface reflectance and
lidar ratio and the misclassification of aerosol type (Winker retrieves better quality values, presumably. Moreover, the
et al., 2009). Yu et al. (2010) reported that the fraction of un- simulation overestimated the AOD over the North African
certainty in the lidar ratio is about 30 %, which could result in deserts and the northern Pacific with the peak value (about
an AOD fraction of uncertainty of about 50 % (for the AOD 0.16) in spring (March–May; MAM) (Fig. S1 in the Supple-
it is about 0.5). Moreover, the dust extinction at 532 nm with ment). Over the TP, the simulated AOD is smaller than that of
the vertical resolution of 60 m (from −0.5 to 12 km) and the MISR and MODIS, and the difference is about −0.08. Over-
spatial resolution of 5◦ × 2◦ (longitude × latitude) is used. all, the WRF-Chem-simulated mean AOD shows a consis-
In this study, the CALIOP nighttime observations are used tent spatial pattern when compared with MISR and MODIS
to compare with the dust extinction profiles of the model in retrievals. The spatial correlation coefficients of the AOD
cloud-free conditions, because the CALIOP observations are are about 0.65 and 0.79 for MODIS and MISR, respec-
influenced less by noises during nighttime than during day- tively. The seasonal variabilities of spatial correlation co-
time (Winker et al., 2010). efficients between the simulation and MODIS (MISR) are
0.55 (0.62), 0.63 (0.66), 0.63 (0.68), and 0.67 (0.75) for
winter (December–February; DJF), MAM, JJA, and autumn
(September–November; SON), respectively. Over the dust
source regions, the simulated results are closer to the MISR
retrievals, with the largest AOD (more than 0.6) having a cor-
www.atmos-chem-phys.net/20/1507/2020/ Atmos. Chem. Phys., 20, 1507–1529, 2020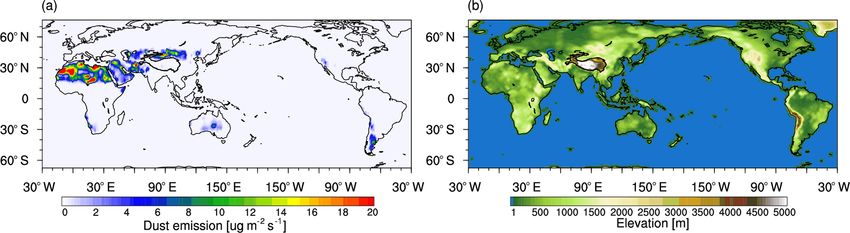
1512 Z. Hu et al.: Modeling dust sources, transport, and radiative effects
relation coefficient of about 0.87. The trans-Pacific transport mean dust mass loading emitted from East Asia (Fig. 4a),
of East Asian aerosols and trans-Atlantic transport of Saha- North Africa (Fig. 4b), and the Middle East (Fig. 4c) are il-
ran dust are also well simulated and are contained in the stud- lustrated. Clearly, the East Asian dust dominates the north-
ies of Hu et al. (2016) and Yu et al. (2010, 2012). The model ern slope of the TP and even extends to the southern TP.
also captures the seasonal variabilities of AOD over the ma- Meanwhile, the dust mass loading decreases with altitude.
jor desert regions shown in the satellite retrievals. The maxi- At 0–3 km, the maximum dust mass loading occurs over the
mum AOD over North Africa and the Middle East appears in source regions with a value of more than 200 mg m−2 . At 3–
JJA, while that over East Asia is in MAM. 6 km, dust can rise up to the TP and even reach the southern
Globally, the dust emissions often occur over source re- edge of the TP. Over the northern slope, the dust mass load-
gions with the terrain elevation generally below 3 km, and ing is about 50 and 10 mg m−2 at 3–6 and 6–9 km, respec-
then they can be lifted into the upper troposphere (Yu et al., tively. At 9–12 km, the dust (5 mg m−2 ) appears over the TP
2008). By using the CALIPSO retrievals, Xu et al. (2018) due to the effect of the TP orography. Compared with other
studied the dust transport at different altitudes and found sources, the East Asian desert contributes more than 90 %
that the TP had an important impact on global dust long- at 0–3 km over the northern slope of the TP. At 3–6 km, the
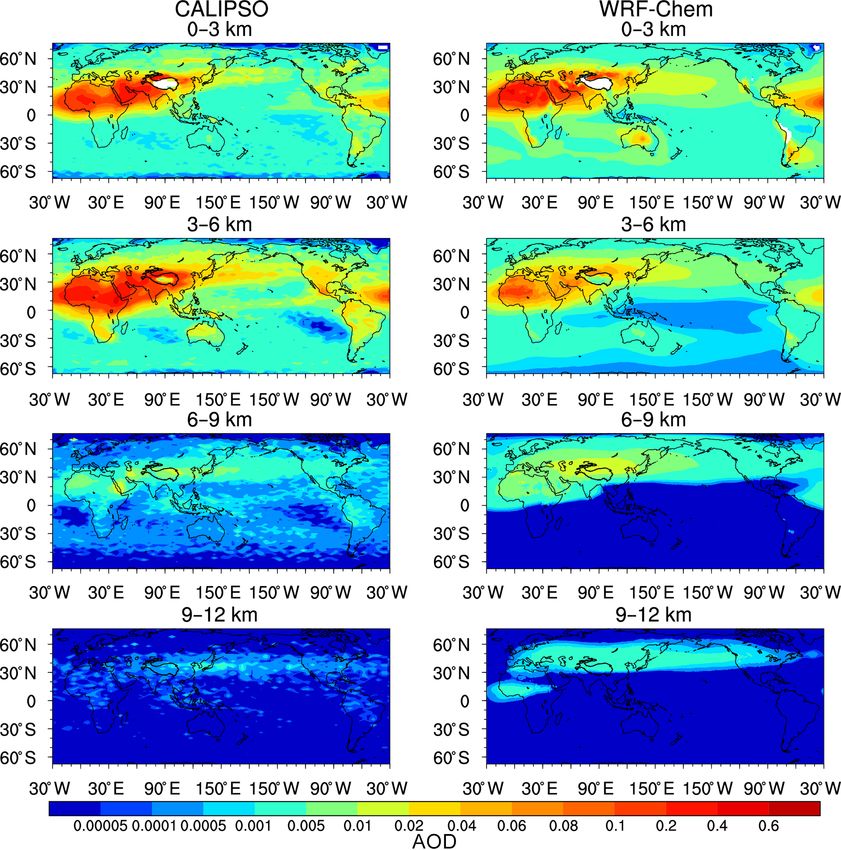
range transport to the upper troposphere. In order to evalu- contribution from East Asian dust dominates north of 35◦ N
ate the model results, we compare the spatial distribution of with a contribution of about 80 %. However, the contribution
annual dust AOD from WRF-Chem between 0–3, 3–6, 6–9, decreases to 40 % above 6 km because of the mixing of dust
and 9–12 km with the CALIPSO results (Fig. 3). It shows particles from North Africa and the Middle East (Fig. 4b and
that the model simulations reasonably reproduce the spatial c). It is worth noting that there are significant dust plumes
distributions of dust AOD at different altitudes with corre- over the TP (Fig. 3), especially in the northeast region. This
lation coefficients of 0.71 (0–3 km), 0.86 (3–6 km), 0.49 (6– dust transport can be attributed to the effect of the TP, which
9 km), and 0.32 (9–12 km). The maximum dust AOD appears could provide more favorable conditions (i.e., cyclonic and
around the dust sources between 0–3 km, with a peak value dry convection) to make dust uplift into the upper tropo-
of 0.6, in which the overestimation of the simulation (more sphere (Xu et al., 2018).
than 0.06) is over the North African deserts and the underes- The North African dust can be transported westward
timation (less than −0.06) is over the Middle East and India across the Atlantic Ocean by African easterly waves, which
(Fig. S2). Between 3–6 km, the model has a similar spatial are a major global dust long-range transport and have been
distribution to the CALIPSO results at 0–3 km. The positive addressed by many studies (e.g., Liu et al., 2008; Su and
difference is about 0.02 over the North African deserts, and Toon, 2011; Nowottnick et al., 2011; Ben-Ami et al., 2012;
the negative difference is about −0.02 over southern Arabian Yu et al., 2013). Beyond that, the North African dust could
Peninsula, Somali Peninsula, and the northern slope of the transport into Europe (Park et al., 2005; Lee et al., 2010) and
TP (Fig. S2). Between 6–9 and 9–12 km, the modeled dust the Middle East (Hu et al., 2019a). Hu et al. (2019a) pointed
AODs are higher than CALIPSO, with a positive difference out that the North African dust mixed with the Middle East-
of 0.001–0.01 (Fig. S2), which is possibly induced by model ern dust could be transported eastward and carried into East
biases, such as those related to circulation conditions. Asia. During the eastward transport, the TP stands in the way
and plays an important role in affecting the dust transport
and vertical distribution over the TP. Clearly, the TP can af-
5 Result fect the intercontinental dust transport and split it into two
branches below 6 km (Fig. 4b). When above 6 km, the major
5.1 Characteristics of dust transport from different dust transport appears over the northern branch, and this can
source regions be attributed to the northward shift of the easterlies (Yu et
al., 2008). Meanwhile, more wet deposition induced by In-
The TP is surrounded by several large deserts. On the north- dian summer monsoon rainfall over the southern branch can
ern side, the major Taklimakan and Gobi deserts emit mineral reduce the dust transport. The North African dust brought
dust particles that can be transported into the TP and elevated 10 mg m−2 of mass loading over the southern slope below
to a very high altitude, i.e., approximately 4–7 km (Huang et 3 km, but the dust can reach the northern slope with the value
al., 2007) in most years and up to 12 km during some ex- of 10 mg m−2 at 6–9 km. Compared with East Asia, North
treme conditions (Liu et al., 2008). Also, the dust particles Africa dominates contributions above 6 km with a value of
from deserts on the western side (i.e., the Thar desert and the 40 %.
Middle East desert) could be brought into the TP by the west- Similar to the North African dust eastward transport, the
erlies (Jin et al., 2016; Lau et al., 2016). Hu et al. (2019a) has Middle Eastern dust can also be transported into East Asia
pointed out that the North African dust mixes with the Mid- (Hu et al., 2019a). Over the TP, the dust mass loading is
dle Eastern dust before being carried into East Asia. In order about 50 mg m−2 at 3–6 km, which is concentrated over both
to better describe the impact of dust from different sources of the southern and northern slopes (Fig. 4c). At the higher
over the TP, the horizontal spatial distributions of annual altitude, the dust can pass over the TP with 10 mg m−2 at 6–
Atmos. Chem. Phys., 20, 1507–1529, 2020 www.atmos-chem-phys.net/20/1507/2020/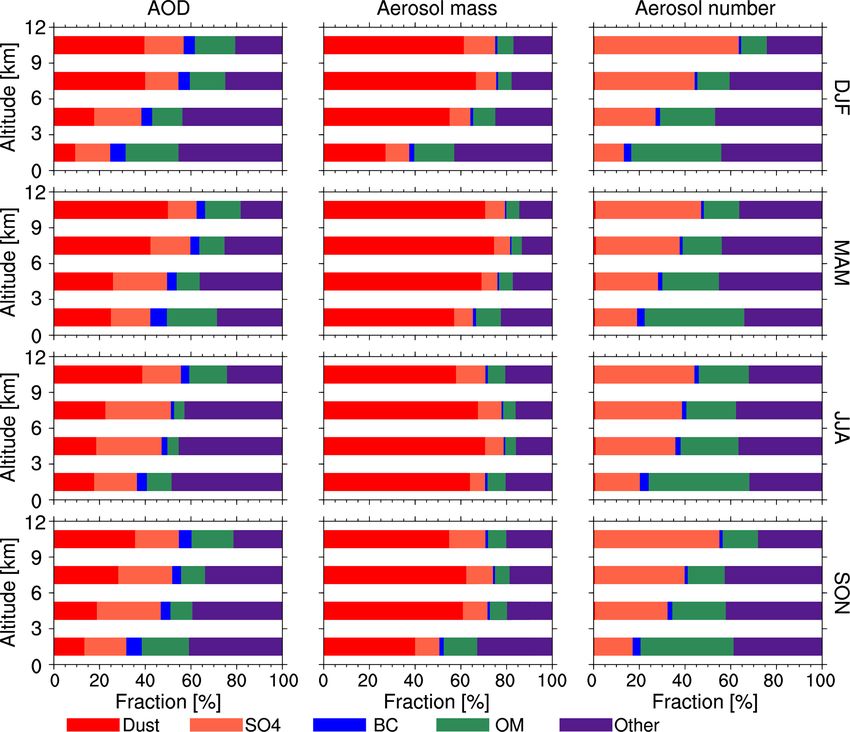
Z. Hu et al.: Modeling dust sources, transport, and radiative effects                                                       1513

Figure 2. Spatial distributions of seasonal mean AOD at 550 nm from the retrievals of MODIS and MISR on board Terra and from the
WRF-Chem simulation for the period of 2010–2015. The daily results from MISR, MODIS, and WRF-Chem are only sampled for averaging
when all of them have valid values at the same location and time.

9 km and 5 mg m−2 at 9–12 km. Also, the Middle Eastern            transport to downwind regions (Fig. 4a, b, and c). At 3–6 km,
dust is transported north over 30◦ N, and this is similar to      a significant updraft occurs around the TP, especially over the
the North African dust above the 6 km. Different from North       southern slope. Therefore, the dust from the Middle East and
Africa and East Asia, the contribution from the Middle East-      North Africa accounts for a larger fraction of the contribution
ern dust is concentrated over the southern slope of the TP,       than the northern slope. At 6–9 and 9–12 km, the updraft over
and the value decreases with the altitude. Below 3 km, the        the TP reaches 0.012 m s−1 , which is greater than the verti-
maximum contribution value occurs over the source region          cal wind velocity over the surrounding areas. This could be
(more than 90 %). At 3–6 km, the contribution is about 80 %       attributed to the dynamical (Huang et al., 2008; Liu et al.,
over the southern slope, and the value reduces to 60 % at 6–      2008) and thermal forcing due to the TP (Lau et al., 2006)
12 km.                                                            on the atmospheric flows. Under these updraft conditions,
   Figure 5 illustrates the annual mean wind field in the hori-   the dust particles can be brought into the upper troposphere
zontal (denoted by arrows) and vertical directions (indicated     (∼ 12 km), which is consistent with the results from CAL-
by the colors) at various altitudes from the WRF-Chem sim-        ISPO observations (Liu et al., 2008). Also, the horizontal and
ulations for the period of 2010–2015. The positive (negative)     vertical wind has significant seasonal variability (Fig. S3). At
value of the vertical wind velocity shows it to be an updraft     the 0–3 km, the maximum updrafts appear in JJA over major
(downdraft). At 0–3 km, the updrafts appear over major dust       dust source regions, followed by MAM. Over the TP, the up-
source regions, i.e., the Sahara, Arabian, Thar, Gobi, and        drafts are clearly in JJA, while the downdrafts dominate in
Taklamakan deserts. Because of the updrafts, dust particles       DJF. In MAM and SON, the updrafts and downdrafts occur
are emitted into the atmosphere over the sources and then         in a spatially uniform way. Additionally, the vertical wind is

www.atmos-chem-phys.net/20/1507/2020/                                              Atmos. Chem. Phys., 20, 1507–1529, 2020
1514                                                    Z. Hu et al.: Modeling dust sources, transport, and radiative effects

Figure 3. Spatial distributions of annual mean dust AOD from CALIPSO (left) and WRF-Chem (right) between 0–3, 3–6, 6–9, and 9–12 km
for the period of 2010–2015.

ascending at 3–6 km on the southern fringe of the TP across         a concentration value of 2 µg m−3 , especially for the Mid-
all seasons, while the vertical wind is descending above 6 km       dle Eastern dust (higher than 10 km). Different from the East
in DJF, MAM, and SON.                                               Asian and Middle Eastern dust, the North African dust has
   To describe the transport characteristics of dust from vari-     a peak mass concentration (∼ 4 µg m−3 ) in the 3–8 km (at
ous deserts, we analyze the vertical cross sections of merid-       90◦ E) after being carried into the TP.
ional circulation and zonal dust mass concentration at 75, 90,         Figure 7 shows the vertical height–longitude cross section
and 102◦ E (Fig. 6). The three longitudes crossed the TP are        at 24, 36, and 38◦ N of the zonal circulation and meridional
denoted by purple solid lines in Fig. 4a. Clearly, a large dust     dust mass concentration from the WRF-Chem simulation for
mass from East Asia and the Middle East is accumulated              the period of 2010–2015. These latitudes are the same as in
over the northern and southern slope of the TP, then lifted         Xu et al. (2018), which can represent well the dust zonal
up to the TP due to orographic lifting. The East Asian dust         transport over the TP. The maximum East Asian dust mass
is lifted up to the TP from its northern slope, and a majority      concentration is located at the 80–120◦ E, and the maximum
of the Middle Eastern dust is lifted from the southern slope.       North African and Middle Eastern dust concentrations are
Also, the strong northwesterly wind can transport the East          at 20◦ W–40◦ E and 30–80◦ E, respectively. These distribu-
Asian dust continuously eastward (Liu et al., 2015) and the         tions are consistent with their source regions. The dust emit-
dust mass concentration increases significantly from 75 to          ted from East Asia is lifted up to the TP at 38◦ N, with a peak
102◦ E. The Middle Eastern dust is carried into the TP along        mass concentration of 40 µg m−3 , then arrives over the TP (at
with the westerly wind, but the dust mass concentration de-         36◦ N) with a value of 2–10 µg m−3 . After passing through
crease from 75 to 102◦ E. The vertical height–latitude cross        the TP, there are very few dust particles over the southern
section of the modeled dust mass concentration centered at          slope of the TP. Because the dust from North Africa and the
90◦ E suggests that the dust particles can lift up to 9 km with     Middle East is mainly concentrated over 30◦ N and to the

Atmos. Chem. Phys., 20, 1507–1529, 2020                                              www.atmos-chem-phys.net/20/1507/2020/
Z. Hu et al.: Modeling dust sources, transport, and radiative effects                                                        1515

Figure 4.

north, the eastward transport of dust particles is not signifi-    5.2   Dust mass flux flowing into and flowing out from
cant. At 36 and 38◦ N, eastward transport of the dust is larger,         the TP
with two peaks on both sides of 100◦ E. These peak values
are attributed to the updraft on the western side and down-        The annual dust mass flux carried into or flowing out from the
draft on the eastern side in the westerly circulation.             boundaries of the TP at various altitudes is shown in Fig. 8.
   Overall, the East Asian dust is lifted up to the TP over        In order to better describe the dust mass flux carried into or
the northern slope and the Middle Eastern dust is lifted up        flowing out from the TP, we use the meridional wind to cal-
over the southern slope (Fig. 4a and b). However, the North        culate the dust mass flux at the west side (75◦ E) and east side
African dust is important into the TP in a higher altitude         (104◦ E), with the latitude range of 27–38◦ N, and the zonal
(Fig. 5). Above 3 km, the westerly wind is effected by the         wind to calculate the dust mass flux at the north (38◦ N) and
TP, which results in the major transport pathway of dust be-       south sides (27◦ N), with a longitude range of 75–104◦ E.
ing north of 30◦ N (Fig. 4a, b and c). At a higher altitude        The annual dust mass carried into the TP from the west
(above 6 km), the major contributor of dust over the TP is the     side is dominated by Middle Eastern dust (26.6 Tg yr−1 ), fol-
Middle Eastern dust, with a value 60 %. Obviously, the dust        lowed by North African dust (7.8 Tg yr−1 ). The Middle East-
particles can be brought to 9 km under the TP orographic ef-       ern dust mass flux decreases from 12.3 Tg yr−1 (0–3 km) to
fect (Fig. 5).                                                     1.2 Tg yr−1 (9–12 km) with the altitude. The North African
                                                                   dust mass flux increases from the surface to 9 km with a
                                                                   peak value of 3.3 Tg yr−1 . At 9–12 km, the North African
                                                                   dust mass flux (1.4 Tg yr−1 ) is greater than Middle Eastern
                                                                   dust mass flux (1.2 Tg yr−1 ). Over the east side, the dust

www.atmos-chem-phys.net/20/1507/2020/                                               Atmos. Chem. Phys., 20, 1507–1529, 2020
1516 Z. Hu et al.: Modeling dust sources, transport, and radiative effects Figure 4. mainly flows out from the TP with a peak value (8.7 Tg yr−1 ) 2010–2015. It should be noted that the TP is defined as 27– at 6–9 km. Impacted by East Asian dust, the dust mass flux 38◦ N and 75–103◦ E (Fig. S4), which shows that some ar- over the north side is dominated by the East Asian dust with eas within the TP domain have an altitude of less than 3 km. a peak value (6.2 Tg yr−1 ) at 3–6 km, followed by 0–3 km Clearly, the dust mainly is carried into the TP below 6 km. At (3.1 Tg yr−1 ). At 6–9 km, North Africa contributes about 0–3 km, the peak inflow and outflow are in JJA and MAM, 1.1 Tg yr−1 , while the East Asia contributes −0.9 Tg yr−1 with fluxes of 7.2 and 2.1 Tg, respectively. The weakest in- (outflow) due to the westerly wind shift to the north (Fig. 5). flow (outflow) is in DJF, with a magnitude of 0.82 Tg (0.6 Tg) At 9–12 km, the East Asian dust mass flux is −0.5 Tg yr−1 . for the mass flux. At 3–6 km, the inflow and outflow is the Over the south side, the dust is mainly flowing out from greatest in MAM. The maximum value is 8.9 and 4.4 Tg, re- the TP with a maximum value originating from the Mid- spectively. Differently, the second greatest inflow is in JJA dle East (−10.4 Tg yr−1 ) below 6 km. The Middle Eastern (5.6 Tg), but the second greatest outflow is in DJF (2.7 Tg). (North African) mass flux is about −5.0 (−0.5) Tg yr−1 at The minimum season of in- and outflow is SON, with mass 0–3 km and −4.2 (−0.6) Tg yr−1 at 3–6 km. fluxes of 2.0 Tg (inflow) and 1.5 Tg (outflow). At 6–9 km, the Although most case studies of dust aerosols have been peak value is in MAM with mass fluxes of 4.6 Tg (inflow) focused on the late spring and early summer over the TP and 5.3 Tg (outflow), followed by DJF (2.2 Tg for inflow and (Huang et al., 2008; Chen et al., 2013; Liu et al., 2015), 2.4 Tg for outflow). At 9–12 km, the peak value occurs in seasonal variabilities of long-range transported dust at dif- MAM, with the inflow mass flux of 1.8 Tg and the outflow ferent altitude are not well understood. Figure 9 shows the mass flux of 2.7 Tg, which account for about 50 % and 54 % model-based estimation of annual dust mass flux between of the annual flux, respectively. Moreover, we can see that 0–3, 3–6, 6–9, and 9–12 km over the TP for the period of the outflow is greater than the inflow above 6 km while the Atmos. Chem. Phys., 20, 1507–1529, 2020 www.atmos-chem-phys.net/20/1507/2020/
Z. Hu et al.: Modeling dust sources, transport, and radiative effects                                                                    1517

Figure 4. (a) Spatial distributions of (left) annual mean dust mass loading (in milligrams per square meter) emitted from East Asia between
0–3, 3–6, 6–9, and 9–12 km and (Right) the corresponding fractions compared with total dust mass loading over TP. The box in red dotted
lines shows the dust source regions, while the box in blue solid lines shows the TP regions in this study. The purple solid lines are at 75, 90
and 102◦ E for the dust height–latitude cross sections. (b) Same as (a) but for dust emitted from North Africa. The purple solid lines are at
24, 36 and 38◦ N for the dust height–longitude cross sections. (c) Same as (a) but for dust emitted from the Middle East.

inflow is greater than the outflow below 6 km, especially at              from 2.5 to 5.0 µm, with a peak in MAM, followed by JJA.
9–12 km due to the effect of the TP topography.                           This is consistent with previous studies in which the Tak-
                                                                          limakan Desert has a peak emission rate of dust in MAM
5.3   Characteristics of size distribution of dust over the               (i.e., Huang et al., 2008; Chen et al., 2013; Liu et al., 2015).
      TP                                                                  The North African dust mass is mainly in the range of 1.25–
                                                                          5.0 µm, which is smaller than those of East Asia and the
Dust size representation can significantly influence the dust             Middle East. This is likely attributed to the larger particles
mass balance in the atmosphere and dry/wet dust deposition                scavenged more easily by dry/wet deposition during dust in-
(Zhao et al., 2013b). In order to better understand the dust              tercontinental transport, and fine particles can be more easily
particle characteristics over the TP, the vertical distribution           transported and reside in the atmosphere. Also, the maximum
of dust mass vs. dust particle size from 0.039 to 10.0 µm                 dust mass concentration is centered at 2.5 µm, and these par-
over the TP is analyzed in Fig. 10a. Obviously, dust mass                 ticles can reach about 9 km in MAM, followed by DJF. Sim-
vertical distribution vs. dust size has significant seasonal and          ilar to the East Asian dust, the Middle Eastern dust mass is
altitudinal variabilities. The East Asian dust dominates in the           concentrated in the size range of 1.25–10.0 µm below 3 km,
size range of 1.25–10.0 µm above 1 km, in which the maxi-                 in which the maximum mass concentration ranges in size
mum dust mass concentration (up to 4 µg m−3 ) ranges in size              from 1.25 to 5.0 µm, with a peak (up to 10 µg m−3 ) in MAM,

www.atmos-chem-phys.net/20/1507/2020/                                                       Atmos. Chem. Phys., 20, 1507–1529, 2020
1518 Z. Hu et al.: Modeling dust sources, transport, and radiative effects Figure 5. Annual mean wind field between 0–3, 3–6, 6–9, and 9–12 km from the WRF-Chem simulations for the period of 2010–2015. The arrows indicate the horizontal wind (meters per second). The colors indicate the vertical wind velocity (meters per second) and positive values are for updrafts and negative values are for downdrafts. followed by JJA. Above 3 km, the Middle Eastern dust has concentration over the TP is mainly at 2–8 km with a peak similar seasonal and vertical distribution of different parti- (∼ 0.4 mm−3 ) in MAM and has a smaller dust particle num- cle sizes compared to the East Asian dust, both of which can ber concentration compared with other sources. While the reach a height of 12 km. North African and Middle Eastern dust particle number con- Beside dust mass and AOD, dust particle number is an- centration have a broader vertical distribution, even reaching other critical factor influencing the ice nuclei concentration up to 12 km. For the number of Middle Eastern dust parti- number (e.g., Phillips et al., 2008; DeMott et al., 2010) and cles, there is a significant peak value occurring (more than determines the distribution of clouds, radiation, and precip- 1 mm−3 ) below 4 km, which is larger than other sources. This itation (Zhao et al., 2013a). By comparing the dust particle result implies that the dust from the Middle East could con- number loading from three different approaches of represent- tribute more particles to the number of dust particles, which ing dust size distribution (8-bin, 4-bin, and 3-mode), Zhao et could influence regional clouds and precipitation. al. (2013b) pointed out that the 8-bin approach could bet- Figure 11 shows the spatial distribution of dust parti- ter represent the dust particle number distribution for differ- cle number loading between 0–3, 3–6, 6–9, and 9–12 km. ent sizes. In this study, we use the MOSAIC aerosol scheme Clearly, the dust particle number concentration reduces from with the 8-bin approach to simulate the long-range transport west to east, but the gradient is smaller than that of dust mass of dust particles. Figure 10b shows the vertical distribution due to a faster removal rate of mass in general (Zhao et al., of the number of dust particles vs. particle size from 0.039 2013b). Between 0–3 km, the greatest number of dust par- to 10.0 µm over the TP. It suggests that dust particle number ticles appear over the source regions (i.e., the Sahara, Ara- has a similar seasonal variability as the dust mass vs. dust bian, Thar, Gobi, and Taklamakan deserts) with a value of particle size. However, the size range is different for dust 0.08 µm−2 . Between 3–6 km, dust particle number loading from various sources over the TP. The East Asian and North reduces, and a value of ∼ 0.008 µm−2 appears over the TP. African dust particle numbers are predominately in the range The dust particle number loading increases (∼ 0.02 µm−2 ) of 0.156–1.25 µm, but the Middle Eastern dust particle num- due to the orographic effect, which is consistent with the dust bers fall in a broader range of 0.078–2.5 µm. Compared with AOD distribution at 6–9 km (Fig. 3). At 9–12 km, there is a the dust mass, the dust particle number loading over the TP is peak in the number of dust particles over the north of the TP mainly smaller in particle size. This is likely due to the eas- with a value of ∼ 0.008 µm−2 . ier suspension and long-range transport of smaller dust parti- cles (Chin et al., 2007). The East Asian dust particle number Atmos. Chem. Phys., 20, 1507–1529, 2020 www.atmos-chem-phys.net/20/1507/2020/
Z. Hu et al.: Modeling dust sources, transport, and radiative effects 1519
Figure 6. Vertical cross sections of meridional circulation (in meters per second and a scale factor of 300 is applied for vertical wind) and
zonal dust mass concentration (in micrograms per cubic meter) emitted from East Asia, North Africa, and the Middle East at 75, 90, and
102◦ E.
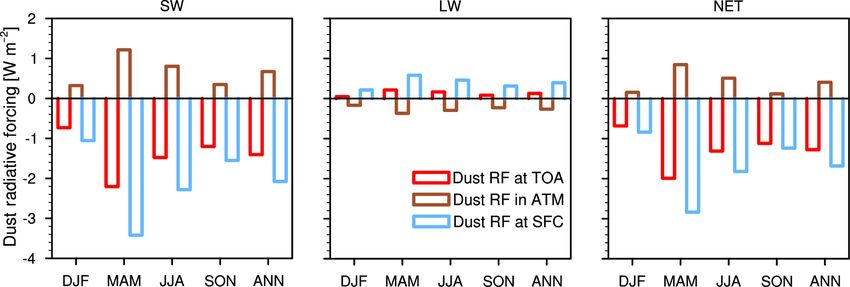
5.4 Dust radiative forcing over the TP ted from surface. Moreover, the net dust radiative forcing is
negative and cooling the surface. The seasonal and annual
mean SW, LW, and net radiative forcing of dust simulated
Figure 12 shows the spatial distribution of annual mean SW, by WRF-Chem over the TP are summarized in Fig. 13. The
LW, and net (SW + LW) direct radiative forcing of dust at dust significantly cools the TOA and SFC and warms the at-
the TOA, in the atmosphere (ATM) and at the surface (SFC) mosphere with a peak effect in MAM, because of a larger
from the WRF-Chem simulations averaged over 2010–2015. dust mass concentration in this season over the TP (Hu et al.,
Over the TP, the dust SW radiative forcing is negative at TOA 2019a). Also, the annual dust-related SW radiation forcing
with a value around −0.5 W m−2 , which is far less than the values are −1.40 W m−2 (TOA), 0.67 W m−2 (ATM), and
value over the desert regions due to the high dust albedo and −2.08 W m−2 (SFC), which is far larger than the dust-related
absorbing capability (Zhao et al., 2011). Because of dust LW LW radiation forcing values, which are 0.13 W m−2 (TOA),
absorption, the dust LW radiative forcing at TOA is warm- −0.26 W m−2 (ATM), and 0.39 W m−2 (SFC). Overall, the
ing with a positive value of 0.5 W m−2 . Overall, the net dust dust-induced change in net radiation forcing is −1.28 W m−2
radiative forcing at TOA has a cooling effect. In the atmo- at the TOA, 0.41 W m−2 in the ATM, and −1.68 W m−2 at
sphere, the dust warms the atmosphere through absorbing the SFC over the TP. The annual mean radiative effect of
SW and cools the atmosphere by increasing atmospheric out- dust is less than in the results from Chen et al. (2013), which
going LW radiation. Dust produces a net warming effect with investigated the dust radiative forcing under an intense dust
a value of 0.5 W m−2 over the TP. At the surface, the dust storm event.
induces a cooling effect by reducing downward SW radia-
tion and a warming effect by trapping the LW radiation emit-
www.atmos-chem-phys.net/20/1507/2020/ Atmos. Chem. Phys., 20, 1507–1529, 20201520 Z. Hu et al.: Modeling dust sources, transport, and radiative effects
Figure 7. Vertical cross sections of zonal circulation (in meters per second and a scale factor of 300 applied for vertical wind) and meridional
dust mass concentration (in micrograms per cubic meter) emitted from East Asia, North Africa, and the Middle East at 24, 36, and 38◦ N.
5.5 Comparison between dust and other aerosols at For aerosol mass, the dust fraction is more than 50 % in
different altitudes over the TP MAM (57 %) and JJA (65 %) due to the maximum inter-
continental transport of dust into the TP at 0–3 km. Above
Figure 14 shows the vertical distribution of seasonal AOD, 3 km, the dust mass contribution fraction is more than 55 %.
aerosol mass, and aerosol particle number over the TP. Sig- The maximum contribution value occurs at 6–9 km in all sea-
nificantly, AOD, aerosol mass, and aerosol particle number sons, except JJA (occurs at 3–6 km). However, the number of
decrease with altitude. At 0–3 km, the peak AOD (0.24) is in dust particles contributed can be ignored. The major portions
JJA, but the peak aerosol mass (88 µg m−2 ) and aerosol par- of the aerosol particle number are sulfate, OM, and other
ticle number (7.2 µm−2 ) are in MAM. While, above 6 km, aerosols. The sulfate particle number contribution increases
the effect of aerosols has a peak in MAM. Also, the aerosol with the altitude, but the OM decreases. At 0–3 km, OM con-
mass and particle number have a larger decrease from the sur- tributes the greatest amount, with a value of more than 40 %.
face to 6 km. At 6–12 km, weaker decreasing indicates that At 3–9 km, other aerosols contribute about 40 % to the num-
dust and sulfate, in particular, decrease less with altitude and ber of particles. At 9–12 km, sulfate contributes more than
account for more than 50 % of the total aerosols (Fig. 15). 45 % to the number of particles.
At higher altitudes (9–12 km) there are no obvious seasonal
changes in the aerosols.
In order to explore the relative contribution of dust, the 6 Conclusions and discussion
fraction from dust and other components is shown in Fig. 15.
Clearly, the fraction of dust AOD shows an increasing trend In this study, we conduct a quasi-global WRF-Chem sim-
with altitude. The fraction of dust AOD has significant sea- ulation and implement a newly developed tracer-tagging
sonal variabilities at different altitudes with a peak in MAM. method, which divides the global deserts into four source
Atmos. Chem. Phys., 20, 1507–1529, 2020 www.atmos-chem-phys.net/20/1507/2020/Z. Hu et al.: Modeling dust sources, transport, and radiative effects 1521
Figure 8. Model-based estimation of annual dust mass flux (in ter-
agrams per year) at the (a) west, (b) east, (c) north, and (d) south
sides of the Tibetan Plateau. The latitude ranges from 27 to 38◦ N,
and the longitude ranges from 75 to 104◦ E. The west and east mass
flux carried into the TP are based on the zonal wind, and the south
and north mass flux are based on the meridional wind. Also, the
values are positive for dust carried in and negative for dust flowing
out.
Figure 10. (a) Vertical distribution of seasonal dust mass concentra-
tion (micrograms per cubic meter) over the TP within various parti-
cle size groups emitted from East Asia, North Africa, and the Mid-
dle East averaged for 2010–2015. (b) Vertical distribution of sea-
sonal dust particle number concentration (per cubic meter) over the
TP in different particle sizes emitted from East Asia, North Africa,
Figure 9. Model-based estimation of annual dust mass flux (tera- and the Middle East averaged over the period of 2010–2015.
grams) inflow and outflow from the TP between 0–3, 3–6, 6–9, and
9–12 km from the WRF-Chem simulations averaged over 2010–
2015.
www.atmos-chem-phys.net/20/1507/2020/ Atmos. Chem. Phys., 20, 1507–1529, 20201522 Z. Hu et al.: Modeling dust sources, transport, and radiative effects
Figure 11. Spatial distributions of annual mean dust particle number loading (per square micrometer) from WRF-Chem between 0–3, 3–6,
6–9, and 9–12 km for the period of 2010–2015.
regions and explicitly online, tracks the emission, transport, mass loading of ∼ 50 mg m−2 below 6 km and passes
and deposition of the dust particles. Using this method, we over the TP with mass loading of 5–10 mg m−2 above
investigate dust source, intercontinental transport, and radia- 6 km. Overall, East Asia contributes more dust mass
tive forcing at the different altitudes over the TP for the pe- over the northern slope, and the Middle East contributes
riod of 2010–2015. The main conclusions are summarized more dust mass over the southern slope. At higher alti-
below: tudes (above 6 km) over the TP, the major contributor is
from the Middle East with a value of 60 %.
1. The spatial and seasonal variability in AOD can be cap-
tured well by the model simulation. Observation and 3. On an annual basis, the Middle Eastern dust and North
simulated results show that the maximum AOD ap- African dust are mainly carried into the TP on the west
peared over North Africa, the Middle East, and central side with mass fluxes of 26.6 and 7.8 Tg yr−1 , while the
Asia in JJA but in MAM over East Asia. Also, the model East Asian dust is carried into the TP on north side
has a reliable representation of spatial distribution of with a mass flux of 8.0 Tg yr−1 . The mass fluxes of
dust AOD at different altitudes when compared with the different source dust flowing out of the TP from the
CALIPSO retrievals. The maximum dust AOD appears east and south sides are −5.4 (East Asia), −6.2 (North
around the dust sources, with a peak value of 0.6. Africa), and −6.4 (the Middle East) Tg yr−1 and −0.2
(East Asia), −1.3 (North Africa), and −9.7 (the Middle
2. Lifted by updrafts, dust particles are emitted into the at- East) Tg yr−1 , respectively. The greatest dust mass flux
mosphere over the major desert regions and then trans- carried into and flowing out from the TP is at 3–6 km.
port to downwind regions. The East Asian dust is trans- Also, the incoming and out flowing dust mass fluxes
ported southward and rises up to the TP over the north- mainly occur in MAM. The peak values are 8.9 Tg (in-
ern slope with the mass loading from 50 (at 3 km) to flow) and 4.4 Tg (outflow) at 3–6 km and 6.4 Tg (inflow)
5 (at 12 km) mg m−2 . The North African dust is trans- and 8.0 Tg (outflow) above 6 km.
ported eastward under the westerly wind, mixes with the
Middle Eastern dust and then is carried into East Asia. 4. The dust can be brought up to 9 km under the effect
However, the TP stands in the way and splits the dust of the TP orography. Inside, the East Asian dust mass
plumes into two branches. The North African dust is dominates in the size range of 1.25–10.0 µm in spring
carried into the TP over the northern slope with a mass (MAM), followed by JJA. While, the North African and
of 10 mg m−2 below 6 km. While the Middle Eastern Middle Eastern dust masses are mainly in the range of
dust concentrates over the southern slope with a dust 1.25–5.0 µm, and the dust particles can reach heights
Atmos. Chem. Phys., 20, 1507–1529, 2020 www.atmos-chem-phys.net/20/1507/2020/You can also read