East Carson Street Business District Strategy - October, 2018 - Urban ...
←
→
Page content transcription
If your browser does not render page correctly, please read the page content below
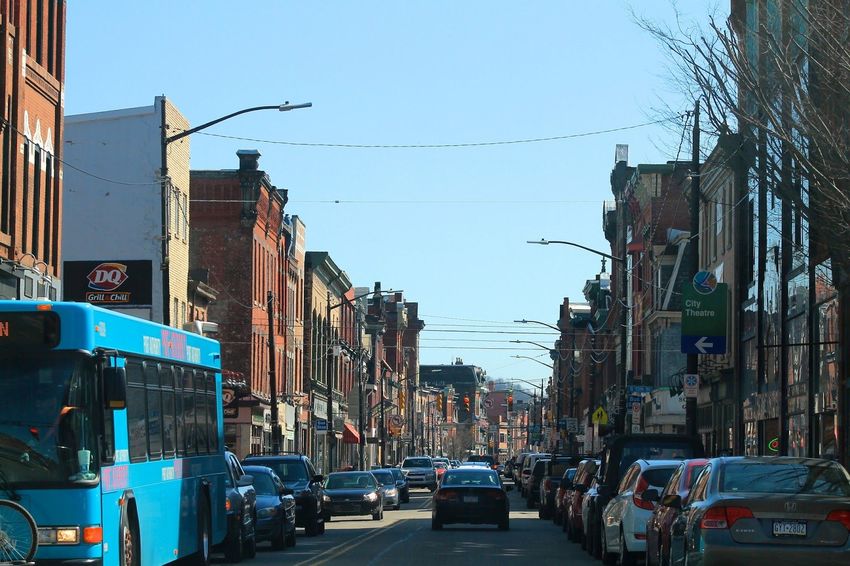
Photo Source: Flickr user Jon Dawson

                             East Carson Street Business
                             District Strategy
                             October, 2018

                                                           1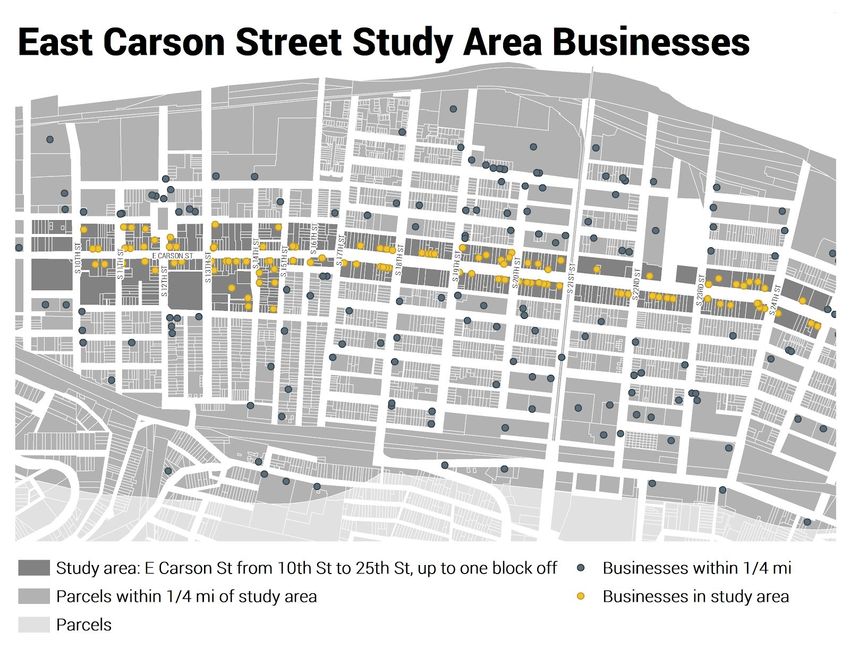
Table of Contents

Table of Contents                                 2

Executive Summary                                 4

Introduction                                      6

Community Engagement                              7

Market Analysis                                  10

Nighttime Economy Analysis                       21

Recommendations                                  25

Three-Year Strategy                              33

Appendix                                         37

                                                  2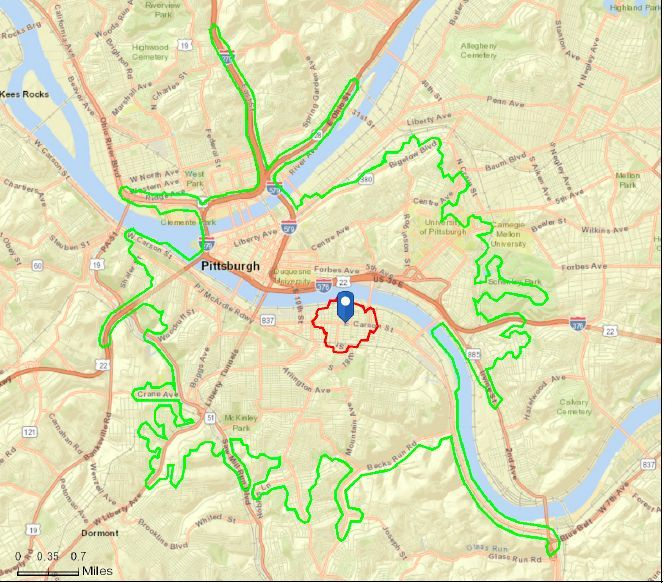
Executive Summary
Fourth Economy Consulting partnered with TST Productions to conduct a business
district planning and capacity building analysis to support the East Carson Business
District Strategy. The outcome of this effort is a business district plan for East Carson
Street, which is located in the City of Pittsburgh’s South Side neighborhood.

The East Carson Street corridor has long been one of Pittsburgh’s most well-known
neighborhood business districts. It was designated in 1993 as a National Register
Historic District, and is notable as the longest collection of intact Victorian commercial
buildings in the country. East Carson Street is also a City of Pittsburgh designated historic
district.

This report was funded by the Urban Redevelopment Authority of Pittsburgh (URA) and
Pittsburgh City Councilman Bruce Kraus. The process was guided by a project team,
which consisted of representatives from the South Side Community Council, South Side
Chamber of Commerce, South Side Development Review Committee, South Side
Neighborhood Plan Committee, the URA, the Department of City Planning, the Mayor’s
Office, the Nighttime Economy Office, and Councilman Kraus’ office.Throughout the
process, the project team ensured that the business district plan was well informed by
engaging a variety of stakeholders, including residents, local business owners, employees
of local businesses, and visitors to the neighborhood. These community engagement
efforts were supplemented with a market analysis and nighttime economy analysis to
provide a comprehensive business district plan for the Urban Redevelopment Authority
(URA) and other project partners.

Through the community engagement and data analysis components of the project,
recommendations were developed to support the East Carson Street Business District
Strategy. These recommendations align with the four components of the Main Street
transformation strategies. These components are economic vitality, design, promotion,
and organization. The recommendations in this report and the three-year strategy are
framed around these four components.

Economic Vitality
Informed by the community vision and market analysis, the economic vitality
recommendation focuses on the ideal business mix for East Carson Street, considering
current businesses and desired ones. Some of the businesses indicated through this
recommendation align nicely with the current market. These businesses include specialty
stores, unique dining options, and fitness and wellness businesses. However, other
businesses highlighted through the process, such as additional stores with fresh food

                                                                                            3
options and home furnishing stores, will be more difficult for East Carson Street to attract
and sustain.

An additional area of focus of the economic vitality recommendations is business
incentives and supports. These incentives and supports can be used to assist businesses
and property owners already located on the corridor, those that are making location
decisions, and owners of underutilized property.

Design
A commercial corridor’s design, or the way the corridor looks and feels to those visiting or
travelling through, has a tremendous impact on initial perceptions, lasting impressions,
and ultimately business success. Successful commercial corridors are welcoming,
well-maintained, and focused on the experience of being there.

During a public meeting that was hosted as part of this process, stakeholders were asked
to consider the design principles of East Carson Street. This group developed the
following four themes related to design: green, clean, safe, and welcoming. Green
included items such as better connection to riverfront trails and more green space. Clean
included cleaner streets and sidewalks and improved recycling systems. The safe design
principle highlighted code enforcement and enhanced lighting on East Carson Street.
Lastly, the principle of welcoming design included lighting up vacant storefront windows
and increasing public transportation and ride sharing.

Promotion
The promotion recommendation relates to the corridor’s ability to increase awareness of
East Carson Street and ensure that the public--residents and visitors alike--has an
accurate perception of the area. Among other strategies identified through the process,
community members indicated that developing a public relations campaign, creating a
cultural district in the South Side and hosting more seasonal events would support the
promotion recommendation.

Organization
The organization principle and recommendation applies to stakeholders’ ability to
coordinate and arrange themselves in a way that is supportive of these
recommendations. There are organizations that already exist that can continue to move
this work forward, but in some cases new formations of stakeholders may be necessary.
This recommendation highlights the opportunities that exist with the Chamber of
Commerce and, working with this body to support a full-time staff member, leveraging

                                                                                           4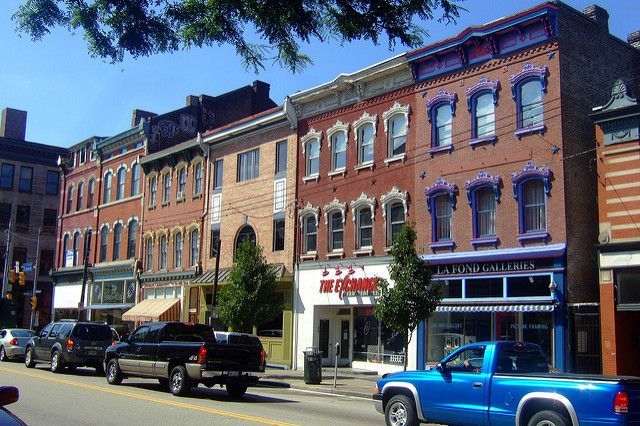
the excitement of local residents in an organized manner, and ultimately growing into a
Main Street Program.

Recommendations in these four areas were used to develop a three-year strategy with
goals for each year that align with the four principles above.

Introduction
The Urban Redevelopment Authority (URA) contracted with Fourth Economy Consulting,
in partnership with TST Productions, to conduct a business district planning and capacity
building analysis to support the East Carson Business District Strategy. The project
focused on the development of a business district plan for East Carson Street and
considered how this business district supports neighborhood residents and visitors to the
area. To inform this project, data was collected through a variety of manners to create a
community-driven and action-oriented plan for strengthening the South Side’s historic
East Carson Street corridor. During this process, the project team collected data through
the following activities:

   ● Community and stakeholder engagement, including attending community and
     organizational meetings, surveys, intercept and phone interviews, and individual
     meetings.
   ● Participating in South Side Planning Forum meetings.
   ● Producing a market analysis that incorporates both anecdotal and data-based
     information about resident, business owner, worker, and patron preferences.
   ● Analyzing the nighttime economy and undertaking a policy review.

This report includes the results from the community engagement and analytic activities,
which will support a three- to five-year business district strategy for the East Carson
Street business district.

                                                                                          5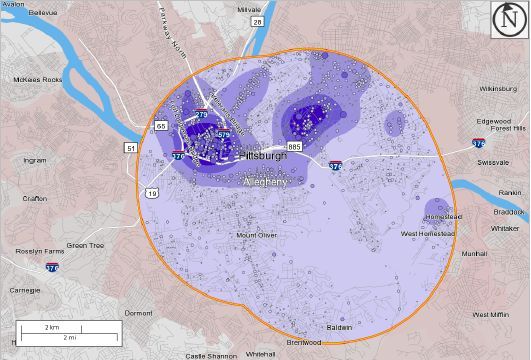
Community Engagement
To ensure that this process was driven by the community, the project team sought to
engage a diverse set of stakeholders familiar with East Carson Street throughout the
project. This group of stakeholders included business owners, residents, employees, and
visitors to the area.
The community engagement process included intercept interviews, which were
conducted on East Carson Street, phone interviews, a resident focus group, and
numerous conversations with business owners. Community engagement efforts
culminated in a final public meeting, during which an interactive session was held to
source strategies that stakeholders felt were high-priority and achievable with the right
support.
Several themes about the East Carson Business District were shared through the
community engagement process. These themes are detailed below, and the strategies
developed by stakeholders at the public meeting are detailed near the end of this report.
● Stakeholders consider East Carson Street to be eclectic. Residents and business
owners shared that East Carson Street seems to be influenced by a broad and
diverse set of ideas and styles. This also aligns with how residents use the
business district, noting that they visit East Carson Street numerous times during
the week for a variety of reasons, including p urchasing basic goods, visiting
specialty shops, dining, and going out for the evening.
● East Carson Street’s walkability is an appreciated asset. In almost all the
interviews with stakeholders, they highlighted that one of East Carson Street’s
biggest strengths was how walkable it is. Many of the residents who visited East
Carson Street said they walked there, especially if they lived in the Flats. This
walkability also makes the area attractive to business owners, since the increased
foot traffic encourages walk-in business.
● Parking is an issue that the community is passionate about. Residents and
business owners are concerned about the lack of parking in the community. There
was not a consensus on what should be done to address this issue, but most
individuals engaged in this process noted this as a problem that should be
addressed.
● Some stakeholders feel that East Carson Street is too dirty. This was shared as
an issue that contributes to a negative perception about the area. Additionally, the
6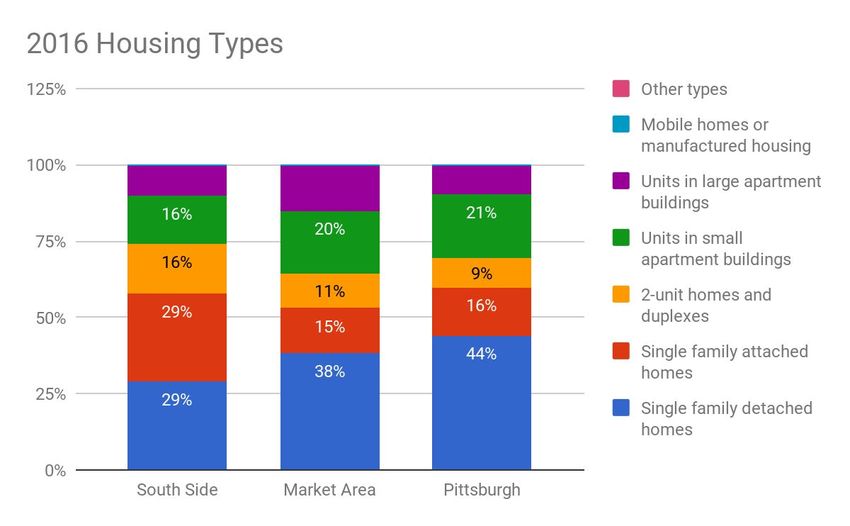
lack of cleanliness on East Carson Street was identified as a deterrent for wanting
to spend more time there. , When asked how they would describe East Carson
Street, many stakeholders’ answer was “dirty”.
● There is interest in bringing in more quality restaurants and specialty shops.
Many of the stakeholders surveyed said that more quality dining options would
lead them to spend more time on East Carson Street. They also emphasized the
need for more specialty shops, such as a butcher or a place to purchase small
gifts. People acknowledged that there were nearby places that provided these
options, such as Southside Works, but noted that many of the stores have closed.
Given this, the respondents feel that more specialty shops and quality dining
options on East Carson Street would lead to more people shopping there,
especially the residents.
● East Carson Street has a negative perception due to excessive alcohol
consumption. A common perception region-wide is that East Carson Street is the
“Jersey Shore” of Pittsburgh. For some businesses, this can be a good thing, but it
can lead to lower customer traffic for others. Many residents and
non-food-and-drink businesses do not appreciate this perception, as they feel it
negatively impacts their neighborhood and businesses on East Carson Street.
While the perception of East Carson Street as an alcohol-based environment on
weekend nights is realistic, it does not apply to the corridor at other times. Some
noted that the community should work together to change how people consider
East Carson Street.
In addition to the theme shared above, those residents, business owners, employees, and
visitors that were engaged as part of this process also shared ideas on how to strengthen
East Carson Street.
● Create a public relations/advertising campaign for the South Side. Individuals
feel strongly that a public relations campaign, showcasing a variety of things the
South Side has to offer, beyond bars, will give people new reasons to come to the
South Side and attract more visitors to the area.
● Consider making the South Side a cultural district. It was shared that the cultural
institutions in the South Side could come together to create a committee that
would focus on making it into a cultural district. East Carson Street has a
significant number of cultural attractions, and coordinating these organizations in
this way could lead to more economic activity in the area.
7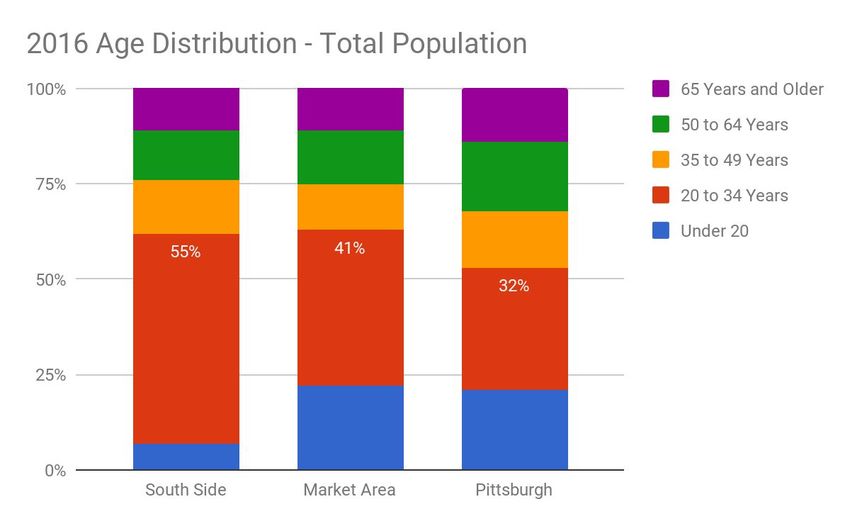
● Establish a music/entertainment district with live music venues and nightlife.
This is similar to the idea of establishing East Carson Street as a cultural district.
East Carson Street has considerable assets that would facilitate a
music/entertainment district, and residents suggested building on these assets to
provide more diverse entertainment choices, like jazz clubs and other quality
music venues.
● Host outdoor festivals. Many people remarked on the success of Open Streets in
the South Side and were interested in hosting more outdoor festivals. These
festivals can include live music shows and focus on highlighting the eclectic style
of East Carson Street.
● Host pop-up shops in vacant storefronts. Several people cited vacant storefronts
as an issue and really liked the idea of supporting local small businesses in these
spaces by allowing for pop-up shops until the storefront was rented out.
8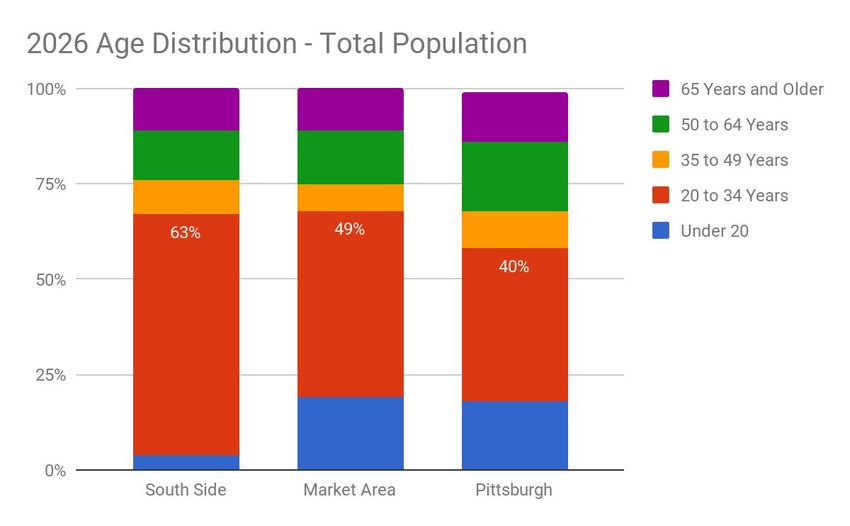
Market Analysis
The goal of the market analysis component of this project is to refine perception into a
factual picture of the opportunities and issues associated with the East Carson Street
Business District.

East Carson Street is the heart of Pittsburgh’s South Side, one of the more dense
neighborhoods in Pittsburgh. It borders the Monongahela River, connecting to Downtown
via the Smithfield and Tenth Street Bridges, to the Hill District and Oakland via the
Birmingham Bridge, and to Oakland and Hazelwood via the Hot Metal Bridge. The South
Side is packed with rowhouses and small businesses that serve local residents and
provide a destination entertainment attraction. The maps below show the two-minute
drive time (red) and 10-minute drive time (green), as well as the jobs within 2.5 miles of
the core (orange).

Note: two-minute drive time in red, 10-minute drive time in green, and jobs within 2.5 mile
radius (orange).

The market analysis focuses on the South Side as defined by ZIP Code 15203, and a
market area defined by a 2.5-mile radius that roughly corresponds to the 10-minute drive
time. Data for the city of Pittsburgh is also provided, for further context.

Population
Population             2000           2010           2016          2026
South Side             8,933         9,499         10,015         10,635
Market Area         122,542        106,834        105,313         92,025
Pittsburgh          334,563        305,704        305,305       297,884

                                                                                           9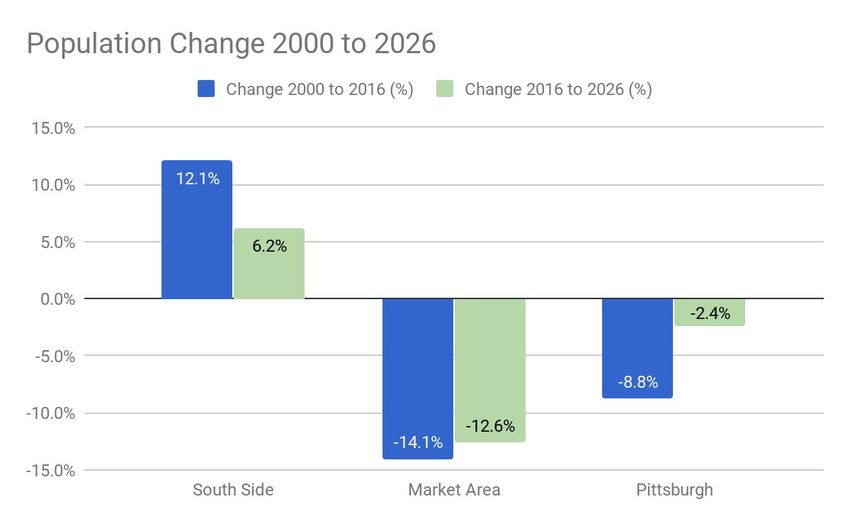
The South Side has a growing population and employment base. Population has
increased from less than 9,000 in 2000 to more than 10,000 in 2016 and is projected to
exceed 10,600 by 2026. Population in the Market Area has been declining, from more
than 122,000 in 2000 to 105,000 in 2016, and is projected to fall to 92,000 around 2026.
Pittsburgh’s population decline has stabilized, but it could fall below 300,000 by 2026.

Population growth in the South Side grew by more than 12% from 2000 to 2016, but it is
expected to slow to just above six percent from 2016 to 2026. Population decline in the
Market Area and the city of Pittsburgh will slow down.

Employment
In terms of job growth, the South Side is also leading in the area, with a 35% increase in
jobs from 2005 to 2015--well above the seven percent for Pittsburgh and only two
percent for the Market Area.

                        Total All Jobs    South Side    Market Area      Pittsburgh
                                 2005           8,007        225,932        258,283
                                 2015          10,788        230,434        276,462
                   Change 2005-2015             2,781           4,502        18,179
          Percent Change 2005-2015               35%              2%             7%

                                                                                             10
The South Side and the Market Area, which includes the Central Business District and
Oakland, are job centers with more jobs than residents. The South Side is more evenly
balanced, with 108 jobs per 100 residents, compared to the Market Area, which has 219
jobs per 100 residents.
Jobs per 100
Population Jobs Residents
South Side 10,015 10,788 108
Market Area 105,313 230,434 219
Pittsburgh 305,305 276,462 91
Three of the top five job sectors for the South Side neighborhood and the larger Market
Area are the same, although the exact rank of each sector differs for these areas.
Accommodation and Food Services, Health Care and Social Assistance, and Professional,
11Scientific, and Technical Services are common to both. Finance and Insurance and
Educational Services, which are in the top five for the Market Area, are not in the top five
for the South Side. Retail Trade and Manufacturing are in the top 5 for the South Side but
not the Market Area.
Top 5 Job Sectors South Side
Accommodation and Food Services 2,195
Health Care and Social Assistance 1,938
Professional, Scientific, and Technical Services 1,436
Retail Trade 941
Manufacturing 560
Top 5 Job Sectors Market Area
Health Care and Social Assistance 50,029
Finance and Insurance 33,234
Educational Services 31,477
Professional, Scientific, and Technical Services 21,070
Accommodation and Food Services 20,008
12Market
2015 Jobs - All Categories South Side Area Pittsburgh
Agriculture, Forestry, Fishing and Hunting 0 1 1
Mining, Quarrying, and Oil and Gas
Extraction 15 699 751
Utilities 48 1,186 2,396
Construction 261 3,154 5,638
Manufacturing 560 4,169 6,769
Wholesale Trade 518 3,773 6,041
Retail Trade 941 8,776 11,322
Transportation and Warehousing 337 1,681 5,041
Information 368 4,824 6,616
Finance and Insurance 353 33,234 33,865
Real Estate and Rental and Leasing 264 3,219 3,805
Professional, Scientific, and Technical
Services 1,436 21,070 24,276
Management of Companies and Enterprises 166 14,082 15,000
Administration & Support, Waste
Management and Remediation 310 5,649 9,603
Educational Services 403 31,477 34,914
Health Care and Social Assistance 1,938 50,029 60,430
Arts, Entertainment, and Recreation 345 5,664 8,091
Accommodation and Food Services 2,195 20,008 21,066
Other Services (excluding Public
Administration) 295 6,204 8,495
Public Administration 35 11,535 12,342
13Housing
The South Side has fewer single-family detached homes and fewer apartments than the
Market Area or Pittsburgh as a whole. It does have a higher share of 2-unit homes and
duplexes.
Demographics
Racially, the South Side is 92% White, compared to 69% in the Market Area and 66% in
Pittsburgh. Four percent of South Side residents are African American, while African
Americans comprise 22% of the Market Area and 24% of all Pittsburghers. Only 2.2
percent of South Side residents are Hispanic, compared to 2.9 percent in the Market Area
and 2.8 percent for Pittsburgh overall.
14More than half of South Side residents are in the 20-to-34-year-old age group. The Market
area is also an area with a young-adult majority. Despite the population losses in
Pittsburgh, the city has had some growth in younger populations, driven by the
universities and hospitals and overall strong job growth. Furthermore, this age group is
expected to grow by 2026, when more than 6 out of every 10 residents will be aged 20 to
34.
15Reflecting the youth of this area, there are few families or individuals with children in the
South Side. In terms of income distribution, the South Side is a picture of extremes, with
higher shares of residents at the lowest and highest income groups. The income
distribution largely reflects the age and family composition of the South Side.
16East Carson Tapestry Demographic Segments
ESRI is a national market database. The ESRI Tapestry Segmentation model helps to
define customers' lifestyle choices, buying preferences, and how they use their free time.
There are two major demographic segments in the South Side: College Towns and Metro
Renters. The ESRI Tapestry profiles from the Tapestry Segmentation Reference Guide
helped guide recommendations for this strategy based on what is known about these key
segments, and the full reference guides from Esri are available in the Appendix.
Retail Supply and Demand
Based on the size and scale of competing business districts, This area captures
consumer expenditures for a radius of 7 miles, but as a destination entertainment center
for young adults, it has a regional draw, as well. Although it has this larger market
capture, the core customers who most frequently visit the South Side and East Carson
business district will live and work within a 10-minute drive time.
The retail trade and food-and-drink trade in this area attract consumer spending from
outside the primary 10-minute drive time. Overall retail sales (supply) of nearly $1.5 billion
far exceed the retail expenditures (demand) of area consumers. This amounts to a total
17of nearly $655 million in consumer expenditures that the area attracts from visitors
outside of the core area. The area draws more than $362 million in retail trade annually
from visitors and more than $292 million in expenditures for food and drink. The business
district therefore continues to need customers from outside of the neighborhood and
from beyond the 10-minute drive time in order to thrive. Supporting the needs of only
local residents would greatly shrink the business district.
Although there is a surplus of retail trade and food-and-drink trade beyond what the
residential base can support, there are several categories of trade that are underserved in
the South Side. Unfortunately, many of these retail and service categories either do not fit
the urban footprint of the business district (e.g., Motor Vehicles) or are facing high levels
of competition from online retailers (e.g., General Merchandise Stores, Furniture and
Home Furnishing Stores). The kind of stores that would fit the urban fabric are already
represented in the city, so any expansion would likely poach consumers from other
neighborhoods.
Demand Supply
Industry Group (Retail Potential) (Retail Sales) Retail Gap
General Merchandise Stores $111,460,358 $31,344,811 $80,115,547
Motor Vehicle & Parts Dealers $155,335,801 $132,978,412 $22,357,389
Gasoline Stations $75,499,773 $64,321,966 $11,177,807
Furniture & Home Furnishings Stores $25,540,166 $15,473,183 $10,066,983
18In all other industry groups, the South Side draws consumer expenditures. Restaurants
are the primary draw, accounting for more than $272 million in additional annual sales
beyond the predicted market area demand. Clothing stores also provide a significant
draw.
Demand Retail Surplus
(Retail Supply (Draws
Industry Group Potential) (Retail Sales) Consumers)
Restaurants/Other Eating Places $71,718,532 $344,318,529 $272,599,997
Clothing Stores $28,665,508 $123,488,512 $94,823,004
Drinking Places - Alcoholic Beverages $4,064,115 $58,556,160 $54,492,045
Direct Selling Establishments $2,419,698 $55,044,697 $52,624,999
Jewelry, Luggage & Leather Goods
Stores $6,883,052 $53,667,131 $46,784,079
Health & Personal Care Stores $44,066,442 $90,531,152 $46,464,710
Beer, Wine & Liquor Stores $6,005,059 $32,525,654 $26,520,595
Sporting Goods/Hobby/Musical Instr
Stores $18,377,476 $33,512,605 $15,135,129
Bldg Material & Supplies Dealers $35,989,706 $47,826,515 $11,836,809
Used Merchandise Stores $3,011,553 $13,169,956 $10,158,403
Specialty Food Stores $6,534,343 $13,514,877 $6,980,534
Other Miscellaneous Store Retailers $21,750,969 $26,745,382 $4,994,413
Shoe Stores $6,240,186 $11,151,993 $4,911,807
Book, Periodical & Music Stores $3,192,296 $6,576,460 $3,384,164
Florists $1,274,515 $4,342,492 $3,067,977
Grocery Stores $127,457,934 $130,238,434 $2,780,500
Special Food Services $1,823,845 $3,383,714 $1,559,869
Note: These figures represent estimated sales from 2017 and may not include recently
opened or closed businesses.
The South Side’s principal challenge will be to define its niche compared to other
business districts, such as the Central Business District, Lawrenceville, Oakland,
Shadyside and East Liberty. There also are districts in the South Hills that compete with
the South Side for consumer expenditures.
19Nighttime Economy Analysis
An economic impact analysis of economic activity that occurs in the evening was
conducted for the East Carson Street corridor’s establishments and patrons. The analysis
captures economic, employment, and government revenue impacts generated by these
establishments and patrons using an IMPLAN model.
IMPLAN (short for “impact analysis for planning”) is a standard economic modeling
approach. IMPLAN provides a basic input/output model of economic activity that
estimates the interactions between industries and households in an economy, to identify
how transactions impact the production and consumption of goods and services in that
economy. IMPLAN distinguishes among Direct, Indirect, and Induced impacts. Direct
impact is the net change in revenue resulting from a transaction. Indirect effects take
account of every resource that an industry needs to produce a unit of a commodity.
Induced effects are the impacts resulting from re-spending of earnings generated by the
direct and indirect expenditures.
For this study,he model is based on data for the 15203 zip code in Pittsburgh and
estimated using IMPLAN’s Social Account Matrix (SAM), which represents flows of all
economic transactions taking place within this zip code. SAM multipliers include direct,
indirect, and estimated induced effects based on the social account matrix. In addition,
the SAM model accounts for social security and income tax leakage from the local
economy, institution savings, commuting, and inter-institutional transfers. The direct,
indirect, and induced effects specific to the nighttime economy are explained below:
Direct Indirect Induced
Direct economic impacts in this case come from actually selling the food and beverages
in restaurants and bars. Indirect impacts include all of the things that factor into those
businesses’ sale of food and beverages, such as purchases of fresh foods, or contracts
with linen purveyors. Finally, induced impacts come from all of the spending in the
20community by the people who work at a restaurant or bar during the evening hours,
together with suppliers’ earnings from the indirect impacts.
The IMPLAN model enables an analysis of the nighttime economy based on four major
sectors of activity: Full-service restaurant, limited-service restaurant, drinking
establishment (bar), and transportation. Data on establishments in the market area was
collected, cleaned and summarized to identify the employment and sales for each
category in the IMPLAN model. The model generates economic impacts from the most
recent year using observations about the interplay between industries made in 2015. In
other words, the economic impacts listed below can be considered as one year’s worth of
economic impacts.
The IMPLAN model does not fully account for the supply chain of full-service restaurants
for special activities such as linen services or the purchase of locally sourced food. To
correct for this, Fourth Economy identified local linen services and farms that supply food
to local restaurants and estimated their potential sales and employment impacts as part
of the full-service supply chain or indirect impacts.
The results are segmented by whether establishments are full-service, limited-service, or
bars. Full-service restaurants are establishments that offer sit-down dining and generally
also include liquor sales. L imited-service restaurants may offer some seating, but they do
not provide liquor and also include takeout and delivery establishments. Bars might also
sell food, but the majority of their sales are from drinks.
Transportation impacts are also captured. Transportation services include both public
transit and other forms of for-hire transportation, as well as parking. Online and intercept
surveys provided additional data on spending for food and beverages, as well as parking
and transportation.
Nighttime Economic Outputs
The results of the analysis estimate a total economic impact of $304.1 million per year
from the nighttime economy. The majority of the impact is from the direct activity of
food, beverages and transportation, which together generate $215.8 million in direct
economic output. The supply chain supporting this activity (indirect impacts) contributes
$55.9 million, and spending by workers adds another $32.5 million. The breakdown by
sectors and effects is provided in the table below.
21Full-Service Limited-Service
Restaurants Restaurants Bars Transportation Total
Direct Effect $77,887,880 $73,609,480 $58,556,160 $5,701,453 $215,754,973
Indirect Effect $26,670,056 $16,248,424 $11,434,080 $1,506,755 $55,859,316
Induced Effect $12,076,391 $6,634,091 $12,818,664 $955,208 $32,484,354
Total Effect $116.6 million $96.4 million $82.8 million $8.2 million $304.1 million
In terms of jobs located in Pittsburgh, the nighttime economy in the East Carson Street
business district supports 4,645 jobs annually. The bulk of these jobs are from direct
employment in full-service restaurants and bars. Estimates for the number of jobs held by
Pittsburgh residents are based on data from the U.S. Census’s Longitudinal
Employer-Household Dynamics (LEHD) program, which provides aggregate data on
where people live and work, down to the Census block group level. This data provides an
estimate of how many of the 4,645 jobs supported by East Carson Street’s nighttime
economy might be held by Pittsburgh residents. Based on the IMPLAN estimated jobs,
the nighttime economy provides a total of 2,508 jobs for Pittsburgh residents. The full
results of the employment impacts by sector and effect are provided in the table below.
Full-Service Limited-Service
All Jobs Restaurants Restaurants Bars Transportation Total
Direct Effect 1,595 863 1,424 81 3,963
Indirect Effect 307 79 56 9 451
Induced Effect 86 47 91 7 230
Total Effect 1,988 990 1,571 96 4,645
Jobs for
Pittsburgh Full-Service Limited-Service
residents Restaurants Restaurants Bars Transportation Total
Direct Effect 861 466 769 44 2,140
Indirect Effect 166 43 30 5 244
Induced Effect 46 25 49 4 124
Total Effect 1,073 535 848 52 2,508
The nighttime economy in the East Carson Street business district provides an estimated
$34.1 million in total annual state and local taxes. This estimate does not include property
taxes, because there was no clear method for allocating a portion of those taxes to the
nighttime economy. Taxes accruing to the school district amount to nearly $1.1 million
22annually, primarily from income taxes. The city receives an estimated $3.7 million per
year, with the bulk of the revenue from the parking tax. Annual taxes for Allegheny County
amount to nearly $9.5 million, primarily from the drink tax. The state receives nearly $19.9
million, with the majority of those revenues from sales and use taxes.
Annual Operating Taxes City School County State Total
Parking $2,455,196 NA NA NA $2,455,196
Hotel Occupancy NA NA $0 NA $0
Sales and Use Taxes NA NA $3,040,986 $18,245,919 $21,286,905
Drink Tax NA NA $6,435,568 NA $6,435,568
Earned Income $531,232 $1,062,463 NA $1,630,881 $3,224,575
Emergency Service Tax $206,088 NA NA NA $206,088
Payroll Prep $541,069 NA NA NA $541,069
Total Annual Operating
Taxes $3,733,584 $1,062,463 $9,476,554 $19,876,799 $34,149,401
23Recommendations
To set the foundation for the three-year strategy, broad recommendations were
developed based on the community engagement, market analysis, and impact analysis
phases. The URA adopts the four components of Main Street transformation strategies in
its commercial corridor. These are economic vitality, design, promotion, and organization.
Both the broad recommendations and the three-year strategy are framed in these four
components.
Economic Vitality
Economic vitality strategies should be informed by both the community vision and the
market analysis. A critical component of economic vitality on East Carson Street will be
considering the current and desired business mix.
Business Mix
The business types that generated the most interest in the public meeting and survey are
detailed below.
Market Alignment
Specialty stores
Cheese shops, wine shops, butcher shops, bakeries, and retail stores with a social
mission were all specialty shops that the community and market area would like to see
on East Carson Street. This type of retail, which offers consumers a shopping experience
that they cannot get online, aligns with the type of retail that is best weathering decline
across the sector.
Unique dining
Restaurants and other eating establishments generate $344.3 million in revenue each
year, with $272.6 million being drawn in from outside of the trade area. On one hand, this
reflects a market strength, in that East Carson Street is already a destination for eating
establishments. However, it also means that establishing a new location on East Carson
Street and remaining successful there requires differentiating this new location from the
high level of competition on the corridor.
Many community members expressed interest in seeing unique dining establishments,
including early breakfast spots, higher-end dining options, and restaurants offering craft
beer and wine that cater to an earlier evening clientele.
24Fitness and wellness
Fitness and wellness came up in every component of the community engagement
process. Not only would businesses focused around fitness and wellness align with the
demographic tapestry segments’ interests, but many stakeholders view Ascend, which
opened in early 2017, as a success story and positive addition just a few blocks off of
East Carson Street. Eating establishments on the corridor take advantage of the traffic
coming to this and other fitness centers by advertising healthy menu options to enjoy on
East Carson Street after a workout.
Potential Challenges
Additional fresh food options
At the public meeting in particular, community members expressed interest in additional
fresh food options on East Carson Street. While this is not an impossible endeavor, fresh
food markets can be difficult to establish and maintain in terms of financial sustainability,
due to equipment needs and the short shelf-life of products. Any fresh food market would
need to compete with the seasonal farmers market, Giant Eagle, and Aldi.
If the community and/or prospective business owners wish to add to the fresh food
options available on East Carson Street, it will be critical to differentiate from the
significant competition in the area. This could mean offering foods that are hard to find
elsewhere (for example, culturally focused cooking ingredients that could save patrons a
trip to the Strip District), offering on-site products like bakery goods and butchered meats,
and providing high-quality produce that exceeds grocery store expectations in the
farmers market off season.
Home Furnishings
While East Carson Street is home to PerLora, a long-standing, unique and successful
home furnishings store, the community would also like to see quality chains such as
Crate and Barrel, and additional collectible stores. This aligns with the ESRI tapestry
model, but it is difficult to compete with online retailers. As mentioned in the market
analysis, the kind of stores that would fit on East Carson Street do exist in the city, so
competing with these will pose a challenge. If a business owner does wish to offer home
furnishings on East Carson Street, they would have the support of the community but will
need support (see below) to ensure their success and longevity. Again, this would mean
significantly differentiating between their offerings and those online and at other
locations throughout the city. Differentiators could include uniqueness of furnishings,
local craftsmanship, or customization options, as lower pricing than online suppliers is
unlikely to be achievable for a small-scale operation.
25Incentives and Support
Working with business and property owners already on the corridor
Business and property owners on East Carson Street have access to a number of existing
programs and incentives that work to help strengthen the corridor. Therefore, the
beginning stages of this strategy will focus on coalition-building among these
organizations and making connections between business and property owners with
existing resources.
Of business owner survey respondents, only 42% reported their revenues increasing over
the past year, while the remaining 48% reported revenues remaining the same or
decreasing. This suggests that business owners should be supported in both internal and
external processes. To help grow revenue internally, business owners should be
connected with organizations that provide business owner education and lending. This
way, the business owner could assess the root of any revenue challenges with support
from an outside resource. URA and City of Pittsburgh staff can work with the community
to connect businesses to these resources.
On the external side, business owners should be supported in marketing and promotions.
Word of mouth was the most common form of advertising that business owners
reported using and finding successful in the survey. Working with business owners to find
creative ways to leverage their marketing successes and reach new markets should be
adopted as a strategy that supports business marketing without creating burdensome
additional work for the business owners.
In order to achieve the project stakeholder goal of raising the profile of specialty retailers,
which is also desired by the community, retail owners should also be provided with or
connected to coaching on customer service and merchandising. By providing excellent
customer service in a setting that focuses on the experience and surroundings of the
customer, the retailers can better compete with online outlets.
Working with businesses making location decisions
The URA frequently interacts with business owners making location decisions, and East
Carson Street comes up as an option regularly. One of the first steps toward supporting
the URA in encouraging businesses to locate on the corridor is understanding which
spaces are available for rent or for lease and having descriptions of those spaces to
match to the prospective business’s needs. Therefore, the first recommendation to
attract new businesses is to create a simple database to track availability. The database
itself can be as simple as an excel file to start, with a larger effort needed on staffing a
review of available properties at least on a quarterly basis.
26Working with underutilized property owners
In addition to benefiting business owners, facade programs and other programs that
assist property owners in improving the space available to businesses will help fill
storefronts that are currently vacant.
One idea posed by the strategy review team was to provide financial incentives to
business owners who might fill the storefronts if they have assistance in the first few
months of occupancy and operation. While the mechanics of a program like this would
need to be developed, the idea posed would be to consider pursuing funding to subsidize
rent in the first few months and then decrease assistance until the tenant is paying the
rent in full. Similarly, a master lease program, as suggested by the South Side Chamber of
Commerce, is also a possibility, with one entity managing the leasing, and therefore
business mix, of a portion of the properties on East Carson Street.
Another idea is to create pop-up events in vacant storefronts to activate the spaces,
demonstrate their value to potential business occupants, and provide flexible space to
fledgeling small businesses. Pop-up events could be hosted in partnership with the City
and/or URA if there are properties they own and are willing to use for this purpose.
Design
A commercial corridor’s design, or the way the corridor looks and feels to those visiting or
travelling through, has a tremendous impact on initial perceptions, lasting impressions,
and ultimately business success. Successful commercial corridors are welcoming,
well-maintained, and focused on the experience of being there.
The public meeting fostered an engaged conversation among residents and business
owners who are eager to continue working on design for East Carson Street. In addition
to identifying active organizations to partner with, such as Tree Pittsburgh, and models in
other parts of the city to draw inspiration from, such as PDP ambassadors, participants
identified four key areas of focus they would like to begin to tackle in the near future.
These are green, clean, safe, and accessible.
Green
Residents and business owners expressed interest in more greenery in the environment,
for aesthetic reasons and for the calming effect that residents, in particular, want to
experience in their walks down the corridor. At every stage of community engagement,
more green space in general was an idea that arose again and again. Other benefits
include energy efficiency in the summer months, improved property values, better
stormwater management, and even crime reduction.
27East Carson Street also has the benefit of being close to Pittsburgh’s strong riverfront
trail network. The riverfront is a recreational amenity to residents and also brings in
visitors from the rest of the city. Because of the Great Allegheny Passage, which
connects Pittsburgh to Washington, DC, the South Side is also positioned to benefit from
trail tourism. According to the Trail Towns program, overnight visitors spend an average
of $124 per night and daytime users spend an average of $18 per day. The South Side is
flat and is home to at least one establishment that caters specifically to cyclists (Over the
Bar Bicycle Cafe). These strengths can be leveraged to pursue the goal of increasing
fitness- and wellness-focused businesses on East Carson Street, as they represent a
customer base that aligns with these business types.
Clean
Unfortunately, one of the main concerns voiced by residents and business owners was a
need for better litter and trash collection and control, and overall maintenance. Cleaner
streets and sidewalks communicate a message that the corridor is cared about and
makes customers feel at ease. It should be noted that visitors from other cities
interviewed described East Carson Street as clean and nice, suggesting that the problem
is not as insurmountable as it seems when viewed through a local lens. Some of the
burden of sidewalk cleaning currently rests on volunteers and organizations like the
Chamber of Commerce. However, funds from the Parking Enhancement District have
enabled the hiring of a Clean Team, which has made a noticeable difference.
Safe
Perceptions of safety are always important in a commercial corridor, and the South Side’s
active nighttime economy makes this even more important: without feeling safe, fewer
visitors are likely to patronize businesses in the evening.
From a proactive lens, physical safety strategies range from snow-and-ice removal to
better lighting and maintenance of the much-needed public restroom at the S. 18th Street
parking lot, which is currently not functional. Many project stakeholders reported that they
would like to see a more visible police presence, sharing that the police presence on East
Carson Street is complicated due to districting, and much of the security and policing
within individual establishments is done on a contract basis.
During the course of this business district study, three dozen security cameras were
installed by the Allegheny County District Attorney on East Carson Street between 10th
and 19th Streets. The City also was continuing its saturation policing on weekends, with
the addition of up to 24 patrol officers. According to the Pittsburgh Post-Gazette, the
28South Side experienced a 30% reduction in crime over the past year due in part to these
changes.
Accessible
East Carson Street should be accessible in many senses of the word: from basic access
by several modes of transportation for residents, employees, visitors, and business
owners to those who have disabilities or other mobility challenges. Many of the
transportation ideas generated during the community engagement process are under
consideration and may warrant further research as the City of Pittsburgh finalizes its
upcoming streetscape project. Concurrently, PennDOT investments will address traffic
calming, pedestrian safety, and other measures. Business owners and residents alike
expressed concern that comprehensive sidewalk replacement is not included in the
streetscape projects that are scheduled to be implemented in 2019.
One topic that arose again and again is parking. As noted in the community engagement
section, there is strong interest in increased parking availability and a parking garage. At
the same time, physical space for parking is limited and current parking options cannot
possibly serve all residents, visitors, and employees.
Several solutions can help alleviate the parking issue. The relatively new pick-up and
drop-off station on East Carson Street and the availability of ride-sharing services expand
transportation options. Creative solutions, like contracting with a private parking garage
and establishing a shuttle between the parking garage and destinations on East Carson
Street, should be investigated, especially when it comes to providing safe access for
employees who work late into the evening. The South Side Chamber of Commerce
recently received a Community Infrastructure and Tourism Fund grant through Allegheny
County to conduct a parking study of the South Side neighborhood.
Despite many establishments on East Carson Street being open and generating
economic impacts until closing at 2 a.m., bus service ends at 1:30 am. Not only does this
mean that visitors to these businesses cannot count on taking public transit home, but
the employees who stay behind to close the businesses well past 2 a.m. are also unable
to take public transit home. As a result, employees occupy parking spaces earlier in the
evening when they arrive for work, incurring costs for gas and vehicle maintenance and
often parking fees as well. Given the modest wages employees earn in these
establishments and the tax revenue generated by these business activities, bus service
should be expanded to cover these important early morning hours.
The culture and identity of East Carson Street should also be accessible to visitors,
especially the creative and historic elements of the community. The South Side is full of
interesting and historic architecture that can be highlighted and complemented with
29signage and streetscape selections that draw attention to the historic assets on the
corridor. Building on existing art assets in the area, strategies to grow East Carson
Street’s cultural identity can include displaying local art in vacant storefronts and
developing a brand identity for signage surrounding the arts and culture establishments.
To this end, the physical inventory that was completed by the Design Center in 2017
should be updated annually. The update should highlight and ensure compliance with
historic district standards. Also, business and property owners should be encouraged to
fix and maintain their structures, and should be directed to URA facade and other
programs for this work.
Promotion
Business owners, residents, and public officials alike expressed an interest in expanding
the public perception of East Carson Street. In order to draw attention to the eclectic
offerings on the corridor and challenge assumptions about East Carson Street, a
branding and public relations campaign should be developed, beginning with the member
organizations who served on the Strategy Review Committee.
While detailed steps will be developed over the first two years of implementation, ultimate
visions for a campaign include promoting unique retail and other hidden gems, creating
content that highlights positive news on East Carson Street for publishing in the Reporter
and expanded to citywide outlets, and generating something like a “myth vs. fact” series.
Project stakeholders would also like to see a common brand akin to Lawrenceville
Corporation’s doughboy-themed logo. Promotions activities should also include
organizing public events to showcase the corridor. One possibility suggested at the public
meeting was a food truck roundup.
A significant asset on the corridor that can help draw attention to the variety of amenities
on East Carson Street is the array of cultural and entertainment options. A “Cultural
District” Committee should be established and eventually be made up of a mix of
residents and representatives from cultural institutions on the South Side, including City
Theatre, WYEP, and the many existing music venues. Goals for this committee could be
to advocate on behalf of entertainment venues to encourage cultural tourism through
targeted marketing and to work to attract new galleries, music halls, festivals, and
performing arts events on and near East Carson Street. .
Organization
The East Carson Business District Strategy has two strong foundational elements to build
upon. First, a truly engaged Strategy Review Committee was integral in guiding the
analysis and developing the priority actions for the project. Strategy Review Committee
30members included key City and URA staff members, South Side Chamber of Commerce,
South Side Slopes Neighborhood Association, South Side Community Council, and
Council President Bruce Kraus, whose constituency includes the South Side.
The second foundational element is the activism of residents. There is a core group of
already engaged residents that want to make things happen on East Carson Street. They
see the potential and have the skills, experience, and drive to support and lead initiatives
as the strategy is implemented.
Recommendations for the organization segment of the business district strategy are
detailed in the following section.
31Three-Year Strategy
At the time of this report, more than 200 stakeholders have indicated their interest in
staying involved in working to improve East Carson Street. Many of these attended the
public meeting and worked together to identify priority actions to begin in Fall of 2018.
The organization to carry out the strategy should grow from a committee or task force
structure in the first year comprised of Strategy Review Committee members, followed by
a transitional second year, and culminating in the hiring of a paid staff member, such as a
business district manager, by the third year.
Task forces should be formed to align with the four key elements of the strategy:
economic vitality, design, promotion, and organization. In addition, a policy working group
should be created to help provide research and analysis in the early stages of setting
goals for the organization.
Each task force will be responsible for developing and implementing an annual plan for
years two and three. The task force structure will ensure that each annual work plan is
rooted in the expertise of the task forces and adaptable to opportunities and realities that
arise each year. Meanwhile, developing capacity slowly before hiring a paid staff member
ensures that the organizational functions necessary to implement the strategy are firmly
in place to set the stage for discrete goals and tangible successes.
32Timeline and Objectives
Period Objectives
2018 Q4 ● Assemble beginning task forces comprised of Strategy Review
Committee members and a policy working group comprised of City
and URA personnel.
● Task forces begin meeting to prioritize the broad strategies from
this report and select one priority action to focus on in 2019.
2019 Q1 ● Begin to expand task forces to include active stakeholders,
especially those who expressed interest during the survey process
and attended the public meeting in July of 2018. Identify
low-hanging fruit for active community members and business
owners to begin to work on.
● Policy working group: create working papers on each of the priority
tasks identified by the four tasks forces to guide and clarify planning
processes.
Q2 ● Task forces: begin to scan for resources and create a library of
funding sources, alignment with priority actions, and deadlines.
● Engage active community members and business owners in simple,
achievable activities to advance the priority action.
Q3 ● Task forces: draft a work plan for year two based on all prior steps
(prioritization, policy papers, and resource scan).
● Begin fundraising based on resource scan in Q2.
● Expand, clarify, and refine priority actions selected for 2019 to
inform annual plan for 2020.
Q4 ● Continue fundraising based on resource scan and continued efforts
to build up library of funding sources.
● Each of the four task forces has completed a work plan, including
who will carry out the key tasks for 2020.
2020 Q1 ● Begin to identify potential leadership for task forces beyond the
Strategy Review Team, based on engagement, activities, and
achievements in 2019. For 2020, task force leaders will form the
direction of the organization and evaluate achievements from the
annual plans.
● Policy working group: begin to assess organizational options: 501c3
or employment within an existing organization or government
agency for a paid staff member to be hired in 2021.
● Continue fundraising based on resource scan and continued efforts
to build up library of funding sources.
33Q2 ● Policy working group: convene task force representatives to
consider and decide on which model of employment will be most
appropriate for the paid staff member.
● Task force leadership: convene to assess successes toward
achieving priority actions outlined in 2020 annual plan.
● Engage active community members and business owners in
achievable activities from the 2020 plan to advance the priority
action.
Q3 ● Continue fundraising based on resource scan and continued efforts
to build up library of funding sources.
● Organization task force: convene task force leadership to discuss
and refine employment and organizational model options.
● Develop preliminary objectives for a paid staff member to be hired in
2021.
● Task forces: Expand, clarify, and refine priority actions selected for
2020 to inform annual plan for 2021.
Q4 ● Organization task force: convene to finalize selection of an
organizational model, job description, and work space needs for a
person to be hired in 2021.
● Identify initial employer for the paid staff member. If the ultimate
goal is a stand-alone organization, the paid staff member will likely
need to be employed by a sponsor organization until sufficient
capacity is available for more direct employment.
● Each of the four task forces has completed a work plan to be carried
out by task force members and transitioning to paid staff in 2021.
2021 Q1 ● Release the job description, screen and interview candidates, and
hire paid staff person to begin employment by March 2021.
● Finalize work space for staff person.
● Develop a clear work plan and measurable objectives to break down
annual plan for paid staff member.
Q2 ● Task force leadership: convene to assess successes toward
achieving priority actions outlined in 2021 annual plan.
● Continue to secure funding and build capacity for the organization
and programming as it becomes more robust.
Q3 ● Review Q2 activities, objectives, successes, and unexpected
challenges with staff member and adjust or refine work plan for Q4.
Q4 ● Develop organizational, task force, fundraising, and priority action
objectives for 2022.
3435
Appendix

A1. Survey Report

                    36
E Carson St Survey Report
May 2018
www.fourtheconomy.comSummary of Respondents
Which of the following best describes you?

                                            2% None of these

                1% Business owner within a few
                blocks of E Carson St

         3% Business owner on E carson
         St between 10th and 25th St
                                                               40% South Side resident
            9% Employee within a few
            blocks of E Carson St

         4% Employee on E Carson St
         between 10th and 25th St

                42% Visitor to E Carson St (even
                just once)

Value                                                          Percent           Responses

South Side resident                                                 39.7%                  294

Visitor to E Carson St (even just once)                             41.6%                 308

Employee on E Carson St between 10th and 25th St                     4.0%                   30

Employee within a few blocks of E Carson St                          9.0%                   67

Business owner on E carson St between 10th and 25th St               2.7%                   20

Business owner within a few blocks of E Carson St                    1.1%                    8

None of these                                                        1.9%                   14

                                                                                  T ot als: 741
Resident Responses
Where in South Side do you live?

                  21% Slopes

                                             79% Flats

Value                              Percent               Responses

Flats                                79.3%                        233

Slopes                               20.7%                         61

                                                         T ot als: 294
How often do you stop in a business on East Carson Street?
0% Never
0% Once every 3-6 months
2% Once every 4-6 weeks
4% Once every 2-3 weeks
48% 4-7 times a week
44% 1-3 times a week
Value Percent Responses
4-7 times a week 48.3% 142
1-3 times a week 44.2% 130
Once every 2-3 weeks 4.4% 13
Once every 4-6 weeks 2.4% 7
Once every 3-6 months 0.3% 1
Never 0.3% 1
T ot als: 294Where do you typically come from directly before visiting East Carson Street?
0% Other - please specify
0% Another commercial area -
please specify
1% School
11% Work
88% Home
Value Percent Responses
Home 88.1% 259
Work 10.5% 31
School 0.7% 2
Another commercial area - please specify 0.3% 1
Other - please specify 0.3% 1
T ot als: 294How do you travel to and from E Carson St?
Uber, lyf t, or Ride my
Bus taxi Drive Walk bicycle Carpool Responses
On your way
there 8 2 72 207 5 0 294
Count 2.7% 0.7% 24.5% 70.4% 1.7% 0.0%
Row %
On your way
home 9 7 79 193 6 0 294
Count 3.1% 2.4% 26.9% 65.6% 2.0% 0.0%
Row %
T otals
T otal 294
ResponsesYou can also read