East Liberty Crime Data Analysis - Client: East Liberty Development Incorporated (ELDI)
←
→
Page content transcription
If your browser does not render page correctly, please read the page content below
Client: East Liberty Development Incorporated (ELDI)
October 2013
East Liberty Crime Data Analysis
Tayo Fabusuyi & Victoria Hill, Numeritics
Tayo Fabusuyi, Lead Economist and Victoria Hill, Research Scientist are with Numeritics
(www.numeritics.com), a Pittsburgh-based consulting practice. All inquiries regarding the report should
be directed to Tayo Fabusuyi at Tayo.Fabusuyi@numeritics.com. We would like to express our gratitude
to Eric Jester and the staff of ELDI who gave generously of their time during the course of the study.
We are also indebted to Ben Levitt of the University of Michigan and Jason Zhang of Carnegie Mellon
University for their excellent research assistance. The contributions of individuals who took part in the
interview sessions are also acknowledged. Finally, the study benefited from comments and feedback
obtained from individuals who participated in the Pennsylvania Housing Finance Agency (PHFA)
presentation held on September 25, 2013 at the East Liberty Carnegie Library.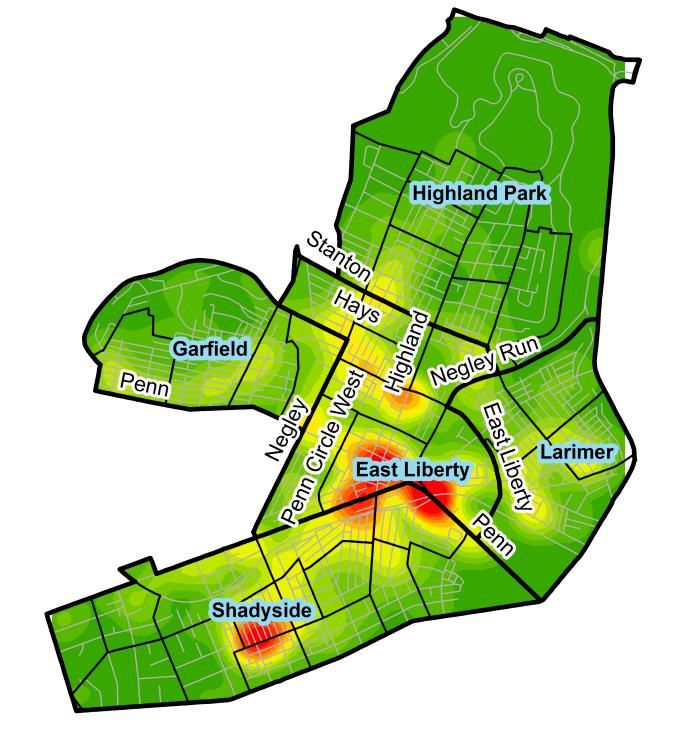
Executive Summary

Within a span of five years, 2008 to 2012, overall crime in the residential area of East Liberty has
decreased by 49%, and residential property prices have doubled. These developments occurred in an
environment where the median income stagnated and actually declined in real terms and where there
was minimal change in the racial composition of the neighborhood. This crime reduction is
significantly greater than what occurred in the City of Pittsburgh during that period, and is also larger
than that observed for comparable neighborhoods in close proximity to East Liberty.

A series of questions prompted by these developments are what informed this study. Numeritics, a
Pittsburgh-based consulting practice, was approached by the real estate arm of East Liberty
Development Incorporated (ELDI), to examine the linkages between these developments and ELDI
initiatives. Numeritics was tasked with providing plausible reasons that explain these developments;
examining the degree to which ELDI was responsible for them and documenting the process by
which these outcomes were achieved while providing some formalism on the process.

ELDI staff who live in or around East Liberty came to the realization that crime is a real estate
problem and therefore requires a real estate solution. In their experience, most of the criminal
activity emanated from or around nuisance properties typically owned by slumlords, an observation
buttressed by existing “hot spot” literature on crime that shows that 3% of addresses are responsible
for 50% of all service calls to the police. This prompted the decision to embark on targeted
acquisition of these properties at scale – a strategy reminiscent of the hot spot theory.

Decisions on which properties to target came out of a combination of approaches. Using a “boots on
the ground” approach, ELDI staffers became intimately involved in the neighborhood. They listened
to complaints from neighbors, talked to the police and examined crime statistics. As a result of this
process, East liberty “hot spots” were identified, most of which were either slumlord or abandoned
properties. These properties were then targeted for acquisition by ELDI. In total, more than 200
units were purchased, representing 3% of the total rental housing units within the neighborhood.
Post-acquisition, effective property managers were put in place to regulate the conduct of the
properties and to function as place-owners.

This strategy of property acquisition and management was strengthened by a number of
complementary initiatives that helped to increase neighborhood cohesiveness. Beginning in 1997,
ELDI has been highly conscious of involving neighborhood residents in the planning, decision-
making and redevelopment process. These efforts allowed for the rebuilding of neighborhood
cohesion and trust; what some call “collective efficacy;” the willingness of neighbors to intervene on
behalf of the common good. This side effect in turn increases informal social controls; or neighbors
looking out for each other, with the result being a positive effect on crime rates.

                                                   1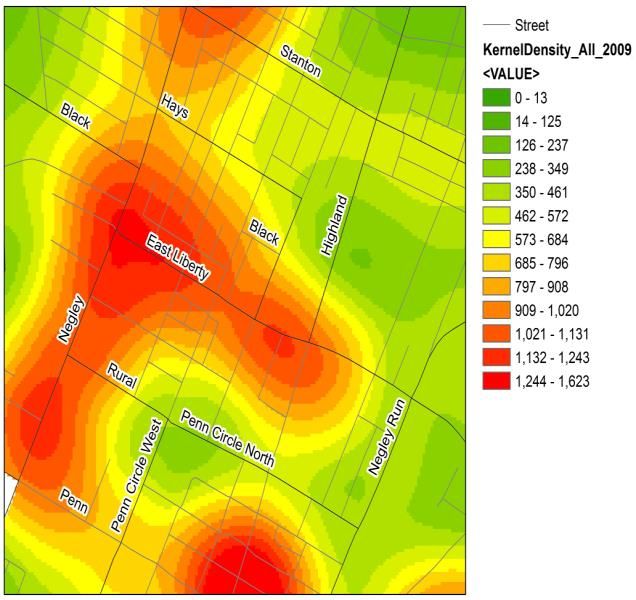
This unique hybrid strategy – the combination of hot spot intervention that is real estate driven and
initiatives geared towards improving the neighborhood’s characteristics is what sets ELDI apart from
other community development organization. The effectiveness of the strategy is aptly demonstrated
by the degree of reduction in crime especially within the residential area and the increase in property
prices. More importantly, this has taken place in an environment in which affordability of rental
units by low income families was not sacrificed for increased safety. In our assessment, ELDI has been
in the driver’s seat of this change given that the Zone 5 of the City of Pittsburgh Bureau of Police is
understaffed and the absence of any major undertaking with regards to public safety efforts by City
Hall.

These developments are however not without cost. For one, the use of off-duty police and the higher
vacancy rate stemming from the screening procedure for potential tenants impacts negatively on the
organization’s bottom line. Second, as the neighborhood has become more desirable, property prices
and rental rates have increased amidst development that threatens to drive out long-time residents.
Mindful of the goal of a mixed income neighborhood, ELDI has historically used deliberate and
purposeful strategies to maintain affordable housing in East Liberty. However, the surge in demand
for rental properties has increased the opportunity cost to the organization of achieving this objective.
Third, the slumlord properties typically targeted for acquisitions are so run down they cannot be
placed in service without significant investment. For most of these properties, the units need
significant work to be viable and the market could not yet justify the development cost.
Consequently, the housing market, left to its own devices, will not address these issues. This and the
earlier mentioned issues provide a compelling reason why soft funds like the Low Income Housing
Tax Credit (LIHTC) should be provided to ELDI.

                                                   2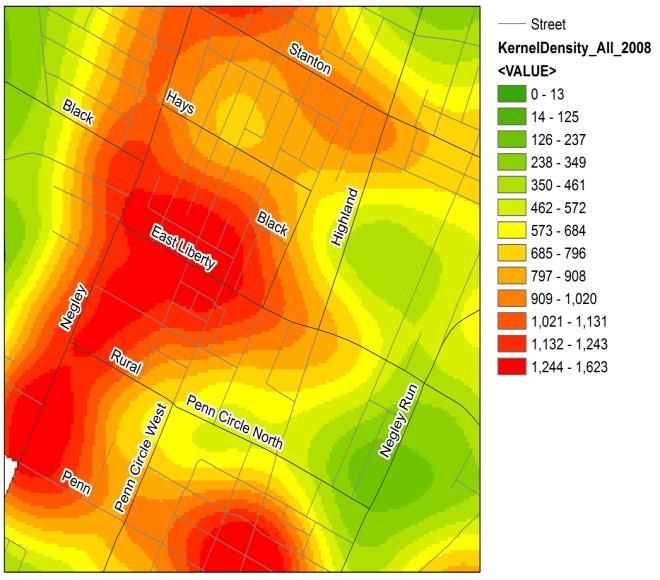
Overview and Background

From the late 19th Century through the mid 20th Century, East Liberty, a neighborhood in
Pittsburgh’s East End, was a bustling and successful area. During this period, East Liberty had a
thriving business district, which was the third largest downtown shopping area in all of Pennsylvania.
The homes in the neighborhood were built for the captains of the industries that dominated
Pittsburgh’s business landscape. The neighborhood itself was a transportation hub; with rail, roads
and streetcars passing through it, all of which brought businesses and shoppers to the area. However,
beginning in the 1960’s, disastrous urban planning including the misguided building of a pedestrian
mall along with a number of high-density high-rise housing projects nearly destroyed East Liberty.
The area was thrown into instability and turmoil and within a span of just a few years, East Liberty
became a blighted neighborhood. Unemployment and criminal activity rose and the neighborhood
was perceived as unsafe.

East Liberty Development Incorporated (ELDI) was formed in 1979 to address these problems by
fostering the revitalization of East Liberty. From its creation through the late 1990’s ELDI’s efforts
did not bear much fruit. In the late 1990s, a number of new leaders in East Liberty brought a sense of
urgency to tackling the neighborhood’s problems. Through a community-driven process, “A Vision for
East Liberty,” a 10-year master plan for development was created. This document, recently updated
along with new ideas and initiatives now drives the work of ELDI. As an essential part of this, ELDI
works in close collaboration with neighborhood stakeholders in the areas of Planning, Advocacy,
Facilitation and Investment in order to bring about positive change in the community.

Major efforts from the master plan enabled the replacement of the high-rise housing projects with
low-rise, townhouse-style mixed income housing. Other development efforts focused on bringing
businesses, shops and restaurants back to the area. Within the residential area, a primary objective of
the organization is achieving a mixed income neighborhood that is safe, stable and sustainable with
development efforts that benefit all residents. A significant strategy in realizing this objective is
gaining control of all abandoned, vacant and problem properties within the neighborhood. This
strategy has paid dividends as evident by the fact that East Liberty is past the tipping point in a
transformation from the urban ghetto of the mid to late 20th Century, to regaining its prominence as
a thriving business district and a desirable place to live, work and shop; a location of choice. From 2008
to 2012, there was a 49% decrease in crime incidents and home prices more than doubled within the
same period.

It is on this basis that ELDI Real Estate, the real estate arm of ELDI reached out to Numeritics, a
Pittsburgh based consulting practice. Specifically, Numeritics was tasked with examining the
connection between ELDI community development activities and the significant reduction in crime
in East Liberty. Apart from documenting ELDI activities, there was interest in putting more structure
and formalism on the semi-organic process that informed the strategy and the activities employed in
implementing that strategy. This is expected to give guidance to other groups who may have interest
in replicating ELDI’s approach.

                                                    3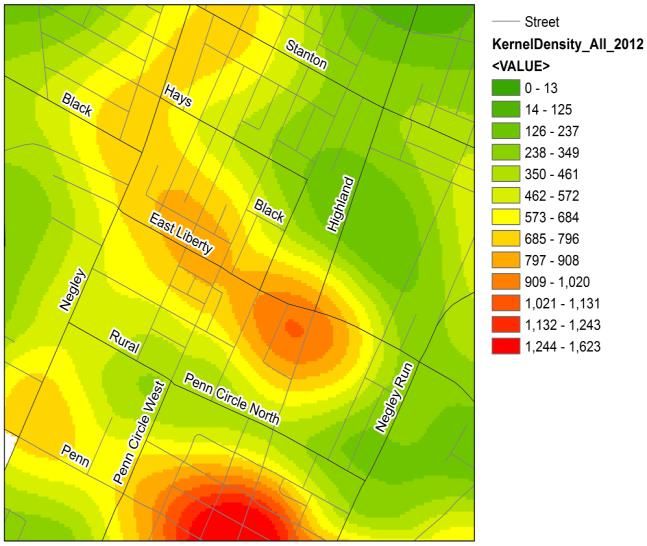
Theoretical Basis for the Intervention Strategies

In explaining the successes that ELDI has had in the revitalization of East Liberty, we look to a
number of evidence-based theories that are relevant to that transformation. This is not to say that
ELDI modeled their efforts on these theories, but rather that we are codifying them in order to
understand why their efforts have been successful. We have chosen to examine the theoretical basis
for these interventions using two lenses – first, initiatives and activities relevant to hot spot theories
and second, those relevant to the neighborhood’s social characteristics.

In 2006, two ELDI staff lived in the vicinity of the 500 Block of North Negley Avenue, one in East
Liberty and the other in Garfield. Each had continuous, daily, personal exposure to crime in the
neighborhood and all that such exposure entails. Eric Jester, an ELDI Project Manager, described the
impact of crime on himself and his family on Mellon Street as “existential.” In their experience, most
crime incidents emanate from the residents of nearby nuisance properties owned by slumlords or
abandoned properties. A decision was made to embark on targeted acquisition of these properties at
scale. These micro or direct interventions at specific addresses are similar to the hot spot policing
approach (Sherman et al, 19891; Spelman, 19952; Weisburd et al, 20043; Weisburd & Braga, 20064;
Braga et al, 20105 & 20116).

The literature cited above identified that a very small percentage of physical addresses in a
neighborhood are responsible for a disproportionate amount of criminal activity, and if police can
intervene in these addresses, there can be a correspondingly disproportionate decrease in crime. The
ratios vary - for example, the 3% of addresses generating 50% of all calls to the police is attributed to
Spelman in his Minneapolis study while Braga et al (2010) in a study of crime trends in Boston found
that 5% of street segments are responsible for 74% of gun crimes. For Weisburd et al (2004), it is a 1:
10 ratio using data from Seattle and a whooping 1:50 ratio, i.e., 1% of the street units generated 50%
of commercial robberies in a three decades study of Boston crime data by Braga et al (2011).

While there could be variations as to the exact ratio and the nature of the crime, there is a consensus
that crime clusters in few places and that preventative measures could be very effective if administered
surgically. If 3% of the addresses in a city produce more than half of all the requests for police

1
  Sherman L, Buerger M, Gartin P (1989a) Repeat call address policing: The Minneapolis RECAP experiment.
   Washington, DC: Crime Control Institute
2
  Spelman W (1995) Criminal careers of public places. In: Eck JE, Weisburd D (eds) Crime and places: Crime
   prevention studies 4, Willow Tree Press, New York
3
  Weisburd DL, Bushway S, Lum C, Yang S (2004) Trajectories of crime at places: a longitudinal study of street
   segments in the city of Seattle. Criminology 42:283–321
4
  Weisburd D, Braga AA (2006) Hot spots policing as a model for police innovation. Police innovation: Contrasting
   perspectives 225–244
5
  Braga AA, Papachristos AV, Hureau DM (2010) The concentration and stability of gun violence at micro places in
   Boston, 1980–2008. Journal of Quantitative Criminology 26:33–53
6
  Braga AA, Hureau DM, Papachristos AV (2011) The relevance of micro places to citywide robbery trends: a
   longitudinal analysis of robbery incidents at street corners and block faces in Boston. Journal of Research in
   Crime and Delinquency 48:7–32

                                                       4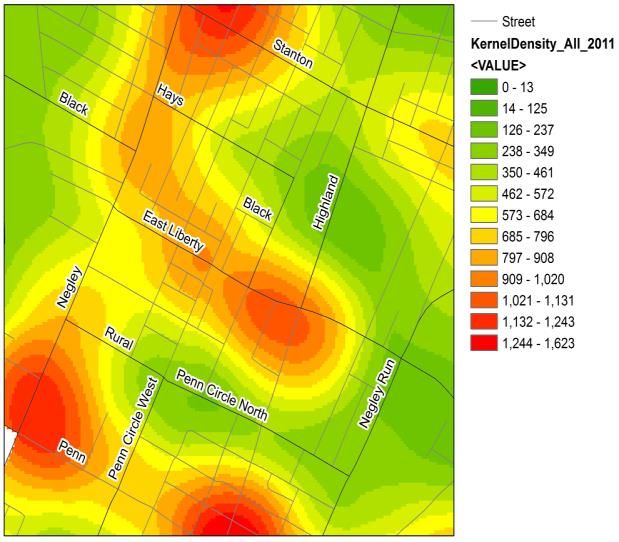
response, then concentrating police in these locations makes more sense than spreading them evenly
through a police beat. For this study, we have chosen to adopt Spelman’s ratio (3:50) given that it is
fairly conservative, references specific addresses and it best approximates the findings from the East
Liberty crime data analysis. This ratio, which we subsequently call the 3 – 50 rule, is a crucial aspect
of ELDI’s strategy.

Acquisitions are based on complaints from neighbors, observed nuisance properties and when a
buying opportunity presents itself. Oftentimes, these acquisitions are targeted at problematic
properties and when associations could be made between a property and criminal activities. In
essence, ELDI used the theory of hot spot policing, but used property acquisition and management as
the intervention. In fact, criminal activity data analysis revealed that ELDI had intervened in about
3% of all of the residential rental units in East Liberty, and that the crime rates decreased by
approximately 50% over the period in which the property acquisition and management strategy took
place – a validation of the 3 – 50 rule applied using a different form of intervention.

While ELDI’s approach is reminiscent of hot spot policing, the strategy comes with some
modification. The organization’s strategy is real estate-centric and the menu of interventions are
broader compared to just hot spot policing. For the acquired properties, orderly property
management was put in place through the hiring of a no-nonsense property manager – an example of
a place based management approach (Eck & Wartell, 19997). Place-based initiatives attempt to
leverage resources by focusing investments and corrective action measures in targeted places. These
measures can be instrumental in changing the culture of disorderly conduct and criminal activities in
specific places as demonstrated by Eck in a San Diego study of a randomized experiment in
apartment complexes.

ELDI has intuitively borrowed from these bodies of work by implementing a strategy aimed at
reducing crime through the property intervention at or near crime hot spots. We have labeled this hot
spot intervention of which policing is a subset. The hot spot intervention also includes a rigorous
screening procedure for prospective tenants, frequent inspection of the units and putting more boots
on the ground by employing uniformed off-duty police officers to patrol both ELDI and non-ELDI
properties that are deemed problematic.

Apart from these direct interventions, ELDI has also been instrumental in influencing and shaping
the social characteristics of East Liberty. Evidence from previous studies suggests that high levels of
structural density in a neighborhood lead to increase crime rates. Between 2001 and 2005, structural
density in East Liberty was reduced significantly when the high-rise projects in the commercial district
of the neighborhood were replaced with scattered mixed income properties. Subsequent acquisitions
have also emphasized a movement towards the use of scattered sites to avoid the concentration of
poverty particularly for the portfolio of their apartments meant for low-income families.

7
    Eck, John E. and Julie Wartell 1999 Reducing Crime and Drug Dealing by Improving Place Management: A
    Randomized Experiment. Research Preview. Washington, DC: National Institute of Justice.

                                                    5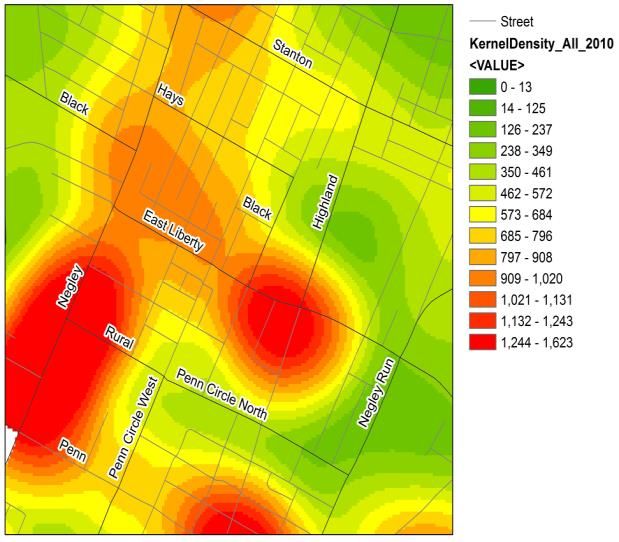
One of the major aspects of the work that ELDI has done is its emphasis on partnerships and
collaborations, and its use of town hall meetings and other platforms that put the residents in the
driver’s seat of the decision-making process. As noted in one of their recent Annual Reports, “…ELDI
works to build relationships, navigate public processes, and raise resources for partners to achieve
their missions for East Liberty.” The seeding of these collaborations and partnerships using platforms
that place the residents squarely in the center has helped foster a sense of belonging and ownership
within the neighborhood and consequently nurtured the collective efficacy (Sampson, 1989) within the
neighborhood. Essentially, these relationships build trust, and the sense of community that emerges
enhances residents’ desire to act on behalf of the common good. This helps to enforce social informal
controls without the intervention of outside authorities such as the police. Collective efficacy also
helps to counteract the effects of Social Disorganization,8 a theory that suggests that crime happens
when community relationships and local institutions fail or are absent.

Last but not the least is the Broken Windows theory (Kelling & Wilson, 1982). This theory posits
that there is a negative signaling effect of urban disorder that encourages more vandalism and crime.
ELDI ensured that vacant properties’ grass was cut, broken windows were at the very least boarded
up, and garbage was picked up. At times ELDI performed these tasks on abandoned properties that
they did not even own in order to generate a sense of order in the neighborhood.

ELDI Strategies and Activities

In examining the overall strategy employed by ELDI, what is obvious is how the strategy has been able
to build on the organization’s existing strength in community building complemented by effective
hot spot interventions. By and large, ELDI’s strategy for achieving its goals evolved in a semi-organic
manner, shaped largely by the staff’s personal experiences. In conversations with Eric Jester, a
resident of East Liberty and ELDI’s Project Manager tasked with handling ELDI’s Residential
Development, he described the work as “intensely personal” and mentioned that the strategy they
employed was informed by the “existential reaction to the prevailing environment.”

The strategy combines elements of social interaction (i.e. “let us try and see if it works”) with
intellectual cogitation (theoretically proven concepts and best practices). Initiatives that worked were
refined and made more specific to East Liberty’s situation. The ones that did not work were
jettisoned. Over a period of time, some existing literature on crime was built into this mode of
thinking. Concepts and theories like the Broken Windows that rang true were adopted by ELDI.
Lawns were mowed and abandoned properties were boarded up. The strategy of targeted property
acquisition coupled with rigorous property management, mirrors to a very large degree both place
based management and hot spot policing approaches.

8
    Sampson, R. J., & Groves, W. B. (1989). Community structure and crime: Testing social-disorganization theory.
    The American Journal of Sociology, 94, 774–802.

                                                         6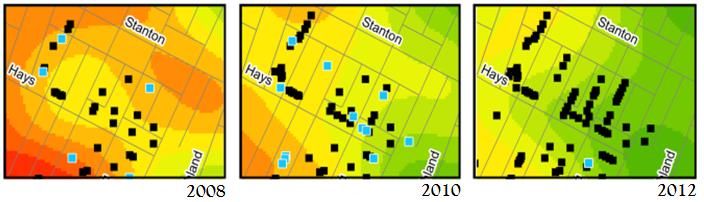
Wilcox and Eck coined the phrase “The iron law of troublesome places” to identify that a few specific
localities have a very large proportion of crime. As mentioned earlier in the study, these hot spots
generate a significant portion of criminal activities for any neighborhood. In East Liberty, the single
characteristic that most of these
properties possess is that they are Box 1: The Economics of Slumlords
owned by slumlords. The slumlords A slumlord maximizes his income stream by reducing maintenance
charge below market rent, pay scant costs to near zero. Absent much maintenance, a property’s integrity
attention to the physical condition suffers with the attending negative effect on the immediate
                                        surroundings. What becomes inevitable is that some form of parasitic
of their properties, and ask no relationship develops, where depending on where you draw the
questions of the tenants who in boundary, the slumlord and his tenants are the parasites and the
turn make no demands on the neighborhood, the host. This parasitic relationship is neither a
                                        symbiotic one in which both the parasite and its host flourish or
landlord.                               continue to exist in a manner that doesn’t jeopardize the host’s
                                         wellbeing nor is it a debilitating one in which the parasite feeds off its
The importance of this is not lost       host until there is nothing left to consume. On the contrary, it is a
on the staff at ELDI. This               relationship with an equilibrating mechanism that ensures that the
                                         host continues to exist albeit with a diminished quality of life. We call
realization allowed the problem of
                                         it equilibrium because the agents – slumlords and tenants have no
crime to be framed as a real estate      incentive to deviate from the status quo. Over time, however, this
problem, and begs the question “If       equilibrium may give way to a downward spiral as residents vote with
                                         their feet and demand for housing within the neighborhood
crime is a real estate problem, does
                                         plummets.
it demand a real estate solution?”
                                         This dysfunctional ecosystem thrives when there are renters with
                                         limited choices and landlords with limited ability to raise rents. These
This line of thinking explains
                                         agents are motivated to act purely in their self-interest and will
ELDI’s targeted acquisition at scale     exercise options that provide them the best outcomes. When the
strategy. More than 200 units were       neighborhood is such that it cannot sustain high rents, a single repair
                                         to a property could wipe out an entire year of a landlord’s profits. A
purchased, representing 3% of the
                                         property in need of repairs attracts a clientele who is willing to
housing       units    within    the     overlook those things. The over-looking, however, happens on both
neighborhood. Post-acquisition, an       sides. The landlord is more concerned with not losing a tenant who
                                         doesn’t make demands, and consequently, the landlord doesn’t ask
effective property manager was put
                                         questions about the tenant’s behavior.
in place with zero tolerance for
                                         Eventually a vicious cycle unfolds. Lower rent translates to thin
disorderly behavior and criminal         margins which lead to less investment. Or it could be the other way
activities. Problematic tenants were     round where less investment leads to fewer demand and the landlord
evicted and off-duty cops were           has to lower the threshold in terms of his demands – monetary or
                                         otherwise. Either way, over time the situation gets so bad that simple
brought in at random to literarily,      repairs are not feasible from a business perspective.
sit in front of nuisance properties
                                         Compounding the problem is the fact that most slumlord units are
in close proximity to ELDI               old and require lots of capital improvements. A repair as simple as a
properties.                              bath vanity could take a substantial chunk out of a slumlord’s annual
                                         income. A more involved renovation like installing new kitchen
This strategy has been very              complete with new cabinets, counters and flooring could cost the
                                         slumlord years of annual revenue. When possible, the slumlord
effective. Within the residential        resorts to shortcuts like smothering tar on the property’s roof,
area, there has been approximately       delaying repairs or ignoring aesthetics.
50% decrease in crime within a

                                                      7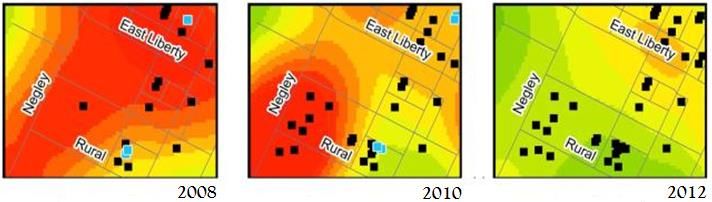
span of five years – the period from 2008 to 2012. However, this comes at a cost. The units are
typically in such poor condition that the cost of repairs is in excess of the ultimate value of the
renovated unit. In the absence of soft funds to cover the cost of repairs, ELDI is forced to operate
units in poor condition without making adequate repairs, which in turn makes the units harder to
rent and keep rented. Whereas a slumlord would solve this problem by accepting questionable
tenants, ELDI’s rigorous screening procedure for potential tenants and the zero tolerance for
disorderly conduct necessarily translate to a higher vacancy rate. In addition, the frequent inspection
of units and having uniformed off-duty police officers brought in periodically to patrol perceived hot
spots adds to the operating budget.

However, an ideal environment will be one in which the neighborhood would police itself without
the need for such outside intervention. In order for the reduction in crime to be sustainable, the “on
the spot” or hot spot interventions need to be complemented with social informal controls. The
challenge then is - in what way can the consciousness of the neighborhood be raised to such a degree
that residents know that disorderly conduct and similar behavioral patterns will not be tolerated?

It is essentially this question and the desire to achieve sustained reduction in crime incidences that
have informed ELDI overall strategy. Apart from hot spot interventions, the organization has been
able to leverage on the goodwill and social capital generated by more than two decades of community
development in East Liberty. This includes its credibility within the neighborhood; the positive
changes it has seeded; the collaborative partnerships it has fostered and the vehicles and platforms it
has created in order to involve residents and give them a say in the decision-making process.

Conceptual Framework`
Figure 1 presents a panoramic view of the overall strategy and the activities that drive the strategy’s

Figure 1: Conceptual framework
                                                  8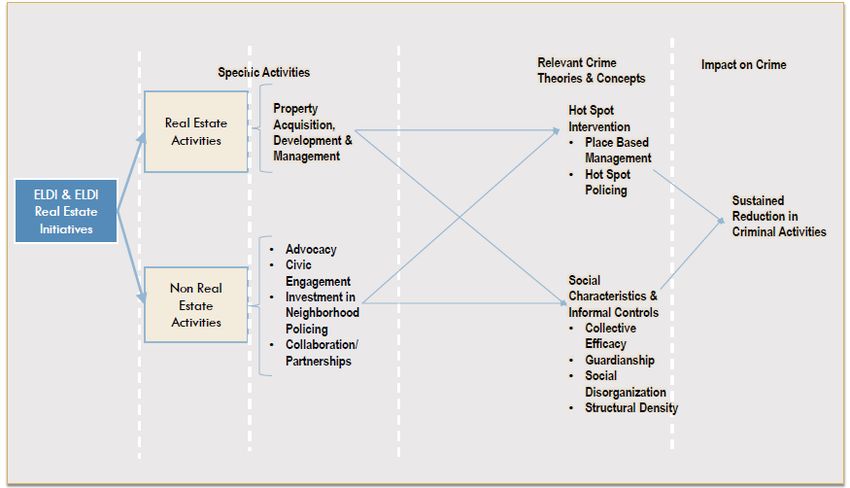
implementation. What we seek to achieve with the framework is to put more structure on the semi-
organic nature by which ELDI Real Estate functions. In addition, we intend to use the framework to
answer the question - given the what i.e., the decrease in crime rates, what plausible reasons explain
the why.

Our approach to addressing the question is one of a retrospective assessment. The conceptual
framework is presented as a hierarchy with five separate layers and structured in such a way that
blends both hot spot intervention activities with initiatives that influence the neighborhood’s social
characteristics. We find this approach innovative in that it combines both hot spot intervention with
social informal controls in a way that guarantees that the reduction in crime could be sustainable.

The objective is to use this framework to demonstrate the effect that ELRE’s initiatives have had on
East Liberty crime rates through reducing the situational opportunities for criminal activity and
improving the neighborhood’s social characteristics. These initiatives are broadly categorized into two
- a direct one that is primarily focused on the situational opportunities for crime and an indirect one
that shapes East Liberty’s social characteristics.

The framework builds on the logical relationship between adjacent layers, which are delineated by the
dotted white lines. This relationship could be either structural (elements to the right are subsets of the
layer immediately before it) or functional (achieving elements at any level is dependent on elements
immediately before it). ELDI’s strategy is captured by the framework where specific elements of the
hierarchical framework represent the activities, the concepts and the impacts observed. For each layer,
more information is provided on the elements and the functional relationship is specified. The box at
the extreme left represents the two arms of ELDI – both community development and real estate
arms.

Subsequent layers provide more information on these initiatives – initially categorizing them into real
estate and non-real estate activities and then, specifying the exact nature of the activities that were
carried out. The balance of the framework represents more functional relationships. One captures
the linkages between these activities and crime relevant theoretical concepts and the second shows
how these concepts impact on crime reduction. The latter is proven given the rich body of work in
existence that documents how these concepts have led to reduction in crime rates. The challenge is
with the former – being able to show how these activities are deployed to address the hot spot
interventions and how they shape the social characteristics of East Liberty. It is essentially this we seek
to demonstrate in the concluding part of this section.

Initiatives and activities that drive this strategy

ELDI activities are categorized broadly into two. These are real estate, which includes all activities
related to property acquisition, development and management and non-real estate that encompasses
advocacy, civic engagement, collaboration and partnerships fostered, investment in neighborhood
policing etc. An appreciable number of the real estate activities are micro in nature with direct

                                                      9
impacts on specific addresses and the non-real estate activities are indirect with the impacts typically
felt at the neighborhood level.9
Property Acquisition
ELDI’s primary real estate initiative is property acquisition and management. With this initiative,
some of the activities are ex-ante in nature – for example, identifying candidate properties to acquire
and some are ex-post property acquisition. Examples of ex-post acquisition activities include screening
of potential tenants, hiring effective property managers and conducting random and periodic unit
inspections. Typically, these acquisitions are targeted acquisitions and often done at scale - a
reflection of ELDI’s belief in the 3 - 50 rule. The figure below provides evidence of the magnitude of
this activity using building permit data.
Figure 2a shows building permit data
over a 12 year period for four
neighborhoods10 – East Liberty,
Highland Park, Garfield and
Morningside. Building permit data for
East Liberty tracks that of Highland
Park except for the occasional spikes
observed in 2006 and 2011 and to
some degree in 2008. East Liberty’s
building permits as a percentage of the
total number of building permits Figure 2a: Building permits data for four neighborhoods
issued in Pittsburgh’s Ward 11 ranges
from a low of 37% in 2002 to a high of
78% in 2006. In recent years, the
percentages have been 54% in 2010,
67% in 2011 and 50% in 2012.
The spikes observed in 2008 and 2011
could be attributed to ELDI. Figure 2b
shows the breakdown of the building
permits issues in East Liberty. The area
in red represents the total number of
building permits issued to ELDI over the
two year period. The area in green Figure 2b: Building permits data for East Liberty
represent the building permits issued to
9
An example of an activity that doesn’t fit squarely with this classification is the investment made in hiring
uniformed off-duty police officers. This obviously is part of the non-real estate activities though the intervention is
of a direct type and micro in nature.
10
The neighborhoods of Highland Park, Garfield and Morningside border East Liberty.
10ELDI in partnership with other entities while the blue area represents all other permits issued in East
Liberty. To give a sense of the magnitude of permits that can wholly or partially be attributed to
ELDI, the organization was responsible for or helped facilitate approximately 80% of all the building
permits issued in East Liberty in 2011.
Non-Real Estate Initiatives
As mentioned previously, ELDI’s activities have taken the form of Planning, Advocacy, Facilitation
and Investment. The organization’s real estate activities have made significant financial investments
in East Liberty’s residential and commercial real estate. At the same time, ELDI realizes that
successful neighborhoods need more than just improved real estate. In 1999 ELDI, with the input of
residents, business owners and other stakeholders created its first long-range 10-year master plan
called A Vision for East Liberty. This stakeholder engagement process, repeated in 2010 to form the
current community plan, created the structure on which the organization’s activities are anchored.
The master plan also set the stage for more detailed land use plans, traffic studies, bicycle plans, tree
plantings and other processes leading to positive community change.
Using the community plan as a backbone, ELDI advocates for the goals laid out in the plan and
other working documents. Advocacy efforts have taken place both within East Liberty and in the
regional and national arena in order to promote the community agenda. Efforts such as serving on
countywide task forces to effect change to the transit system or on storm water guidelines are a part of
what ELDI does in the way of advocacy.
Facilitation is another essential piece of the puzzle. ELDI works to facilitate public processes, build
relationships and raise resources in order to achieve their objectives for East Liberty. This
relationship building may take the form of supporting funding applications for nonprofit partners,
serving as a liaison between city government and ELDI stakeholders or helping other groups create
their own long-range plans. ELDI partners with other neighborhood community development
corporations (CDCs) in Bloomfield, Garfield, Friendship, Highland Park, Lawrenceville, Larimer and
Shadyside. The organization also works to create comprehensive systems of collaboration and
communication among service providers.
Finally, ELDI assists with putting financial backing behind this plan. This could be in form of debt at
market rate, concessionary or soft loan, tax credits or grants. All of these efforts - planning, advocacy,
facilitating and investing complement one another. When residents feel that their voice is being
heard, and that others are working on their behalf, community cohesion and trust is built.
Accompanying community cohesion and trust is collective efficacy, where residents become willing to
intervene to aid one another. This in turn creates informal social controls which generate stability in
the neighborhood.
11Documented Impact and Outcomes
We used a mixed method approach to document the impact and outcome of ELDI’s strategy. This
entails carrying out detailed analysis on existing secondary data and conducting a series of semi-
structured interviews with a selected number of individuals. These individuals include residents, the
Pittsburgh Police Zone 511 commander and ELDI staff. This approach provides a robust platform in
that the study employs quantitative measures of the value-added by ELDI and the measures are then
complemented by vignettes and stories from the interview sessions to provide rich, context-specific
and well-rounded findings.
Qualitative
Numeritics conducted a series of semi-structured interviews with East Liberty residents, business
owners and the Pittsburgh Police Commander in charge of Zone 5, in which East Liberty resides. All
subjects have a stake in the issue at hand, and each was very receptive to talking with us about ELDI’s
activities within the neighborhood. The goal of the interviews was to use this platform to collect and
recognize thoughts, opinions and perceptions that may not be captured through other data collection
methods as regards the impact of the efforts of ELDI and to complement these findings with the
quantitative data collected.
We created a semi-structured interview protocol to use as a guide, but we were open to changes in the
direction of the discussion based on the interviewee responses. All the residents confirmed that they
have benefited from ELDI Real Estate property acquisition management strategy. The individuals
interviewed said they have observed positive neighborhood changes as a result of ELDI’s partnering
with local community groups, banks and nonprofits to create synergies as they worked towards
revitalizing the neighborhood. The summary notes of the responses from residents are provided in
Box 2.
Particularly noteworthy is the conversation we had with the Commander Tim O’Connor, the Zone 5
Commander. The Commander was very appreciative of the work that ELDI does, and for the
relationship that ELDI has fostered with the police department. He acknowledged that ELDI has
helped the police by acquiring and managing nuisance and problem properties; contributed to
enhancing the neighborhood cohesiveness which in turn increases cooperation of residents with the
Police
11
The Zone 5 of the City of Pittsburgh Bureau of Police covers the neighborhood of East Liberty, Highland Park,
Stanton Heights, Morning Side, Garfield, Friendship, Bloomfield, Larimer, Lincoln-Lemington-Belmar,
Homewood and East Hills.
12Box 2: Summary Notes for the Semi – Structured Interviews
A more recent transplant to East Liberty from the Washington D.C. area cited ELDI’s efforts as the primary reason
why she and her spouse decided to purchase a home there. This woman had attended graduate school in
Pittsburgh and was looking to buy. Their real estate agent suggested looking at the new homes that ELDI had built
in the heart of East Liberty. In investigating the neighborhood, they talked extensively with ELDI personnel, who
were honest about the area, but also confident about the potential of the neighborhood. The woman and her
spouse were the first to buy one of the new homes in 2009. Directly next door to their house was a slumlord
property; a single-family home illegally subdivided into apartments. For some time after their purchasing the home
there were fights in front of the home, police were called, even a high-speed chase went on in the alley behind their
house. Within a short time, however, a young couple bought the neighboring house and converted it back to a
single family home, in large part due to the fact that investing in the neighborhood now made sense, with multiple
brand-new homes built by ELDI on the same street. After living in East Liberty for several years, the woman
decided to fulfill her lifelong dream of entrepreneurship by opening up her own shop, in East Liberty.
Another resident of eight years moved to East Liberty from an adjacent neighborhood where he lived for 18 years
as a renter. When he decided it was time to buy a house, he was priced out of that neighborhood, so he expanded
his search to East Liberty. He bought a century-old historic townhouse on a street parallel to the street on which
ELDI build brand-new homes, which was a major factor in his decision-making. In 2005 this resident had to deal
with a number of issues such as high levels of noise, garbage strewn on the street, nearby drug and prostitution
houses. He became president of the historic housing area on his street, and took a personal interest in positive
change in the neighborhood.
In those eight years he credits ELDI with doing a great deal to move the neighborhood forward. He says “ELDI
works hard at identifying community allies – bringing them together to talk about the problems in the
neighborhood. They would talk about what they were doing in their real estate division based on an overall
strategic approach and would make recommendations to the residents, to community leaders, to banks and
nonprofits working in the area. ELDI is more like city government than city government. We would call ELDI for
help rather than calling city government, because we knew we would get a response.” Right now he says the street
is quiet and clean – with the only noise being construction sounds of people renovating their homes.
We also interviewed a long time resident of East Liberty. This woman had lived in the same house for over 40
years, and had seen East Liberty through good times and bad. It was shortly after she moved in that life in East
Liberty took a turn for the worse. She never thought of moving out and her perseverance paid off. She is very
impressed with what ELDI has done in the neighborhood. A number of the homes on her street have been
impacted by ELDI. Directly across the street from her house are three historic turreted row-houses which were
neglected for a long term and were placed on the demolition list. ELDI purchased the homes, completely
renovated them and turned them into market-rate homes. Other homes and apartments on the street have been
acquired by ELDI and are now high-quality affordable rate homes.
Her assessment is that ELDI’s efforts have really helped in decreasing crime in all areas of the neighborhood. Her
opinion is “I don’t know where the crime goes and I really don’t care.” When asked what of ELDI’s activities, in
her opinion, had the biggest impact, she said “the best thing they do is buying the properties. That has made the
biggest change on the block. There’s no dirt on the street and I didn’t have to clean it up. This has been the best
summer that I have had since I moved here 40 years ago. It’s so peaceful.”
The commander said he observed a lot of residential construction within the neighborhood –
especially between East Liberty Boulevard and Stanton Avenue. He commented that many of the
slumlord properties provided a low quality of life for their residents, and that the properties that
ELDI has acquired and now manage as either affordable or market-rate housing are much better for
their residents. He sees the ELRE’s property management strategy of purchasing problem properties
and using aggressive managers as creating a huge disincentive for individuals who are up to no good.
13Having a zero tolerance for misconduct gets rid of problem tenants. In addition, ELDI’s strategy of
hiring off duty police officers to patrol nuisance properties has also sent a strong signal to the
community that disorderly conduct will not be tolerated, and that police are active and engaged in
the neighborhood. The commander said that East Liberty is definitely trending in the right direction,
while acknowledging that challenges still remain given that it is still a neighborhood in transition.
This trend has been beneficial given the decrease in foreclosures, vacant properties and boarded-up
properties. He also mentioned that the decrease in crime in East Liberty was not as a result of crime
moving to adjacent neighborhoods, as crime in those neighborhoods has not increased at the same
time that East Liberty’s has decreased.
A significant issue of relevance to the Commander is that Zone 5 has more crime per capita than
other zones in Pittsburgh. This situation, juxtaposed with the fact that he is operating at only 2/3 of
his ideal staff strength makes him see great value in having a working partnership with ELDI for a
host of reasons. The first is has already been mentioned; fewer nuisance properties translate into
fewer police calls for problems at those properties. In addition, ELDI’s work to develop a better sense
of community cohesion translates into more cooperation between residents and the police.
Quantitative
The quantitative measures of outcomes include trend data on crime and a retrospective assessment of
property prices. These analyses were carried out using secondary data. For all these measures, we have
used multi-year data that provide not only a snapshot at a point in time, but more importantly
provides a trend that presents a more comprehensive picture and on which some assessment could be
made with regards to future states. The analysis examined East Liberty data on crime incidences and
property prices relative to other neighborhoods in close proximity to East Liberty.
Annual data on crime from 2008 to 2012 was obtained from the Pittsburgh Police Department and
includes most of the neighborhoods in Pittsburgh’s East End. The crime incidences are classified
broadly into two categories12 – Part I crime, which covers eight serious crimes which could either be
against persons (aggravated assault, homicide, rape and robbery) or property (arson, burglary, auto
theft, and larceny). Part II covers a litany of lesser crimes that are not reported as reliably as Part I
crimes. The list includes public disorder, white collar crime, drug and alcohol offenses and all other
crime not otherwise specified excluding traffic violations.
Six neighborhoods in total were analyzed from 2008 to 2012. Apart from East Liberty, the
neighborhoods included Larimer, Garfield, Highland Park, Shadyside and Friendship, all of which
border East Liberty. To control for differences in population across these neighborhoods, the crime
data was converted to number of incidents per thousand of population. The aggregated crime analysis
12
The classification is based on uniform crime reporting (UCR) standard that was released in May 1985. This
version provided modifications to the approach used in reporting crime that dates back to January 1930.
14revealed that there was a decrease in crime from 221 in 2008 to 164 crime incidents per thousand in
2012. This represents a 26% decline in total crime in East Liberty over the five year period compared
to 20% for the surrounding neighborhood. Citywide, the same period witnessed a 16% decrease in
crime incidents measured per thousand of population.
Since aggregation masks local realities, another series of analysis was carried out using disaggregated
data. The findings revealed that Part II crimes fell by 30% in East Liberty compared to 25% in
surrounding neighborhoods. However, Part I property crimes decreased by only 4%. This could be
explained by the contradictory effect created by a thriving and more vibrant business district. The
significant increase in commercial activities in recent times has generated more opportunities for
larceny, auto theft and burglary and consequently, the development has helped sustain relatively high
Part I property crimes.
Within the same period, Part I
crime against persons decreased
by 54% in East Liberty
compared to 37% for the
surrounding neighborhoods.
The decrease in this type of
crime for each neighborhood is
shown in Figure 3a. Given this
study’s emphasis on the
residential area, this crime
subset is the crux of our analysis
for two reasons. For one, these
Figure 3a: Crime Incidents for selected neighborhoods are more reliable data since they
are often reported and have
more relevance to residential population
compared to the transient population of
the business district. Second,
establishing the value-added from
ELDI’s strategy and activities,
particularly the hot spot interventions,
has more relevance for Part I (persons)
crime.
The year on year decrease in Part I crime
against persons is particularly noticeable
for East Liberty given the steep negative
gradient. Given its relevance to and the
Figure 3b: East Liberty crime data by type
study’s interest in East Liberty’s
15residential area, we enriched the analysis by examining the crime data with the commercial district
excluded from the analysis. Figure 3b expatiates on the different crime types but now with a focus
solely on the residential part of East Liberty. Within the residential area, criminal incidents,
irrespective of the type decreased by 48.9%. The disaggregated figure shows a decrease of 50.2% in
Part I crime and a 47.9% decrease in Part II crime.
Crime Heat Maps
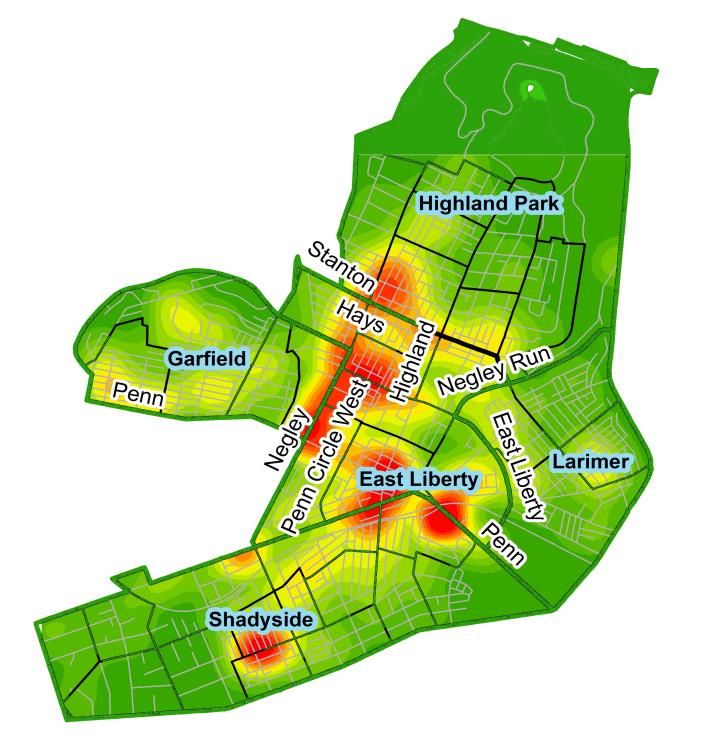
We showed the crime statistics for the neighborhoods in the east end of Pittsburgh using heat maps.
The neighborhood heat maps were generated using the Kernel density smoothing approach and are
shown in Figures 4a-b. The colors for the heat maps mimic the traffic light colors with red depicting
the worst-case scenario, amber or yellow representing a tolerable situation and green, the ideal state.
Figure 4a-b: 2008 (left) and 2012 (right) crime heat maps
The color coding for any one area is chosen relative to other areas and it is decided by comparing its
value to the mean across the total geographical area mapped – an area approximately 3.5 square miles
for the neighborhood.
We carried out a simple comparative analysis by eyeballing the heat map for the neighborhoods in
2008 compared to 2012. This allows us a panoramic view of East Liberty and the surrounding
neighborhoods. The areas showing up as the red blobs for both years are the persistent, chronic hot
spots and they represent the commercial district for both East Liberty and Shadyside. The reader
cannot but observe the radical transformation that occurred in the residential part of East Liberty
with the five year period.
16The crime data came from the Pittsburgh Police department and the data was geocoded using US
Streets Geocode service provided by ArcGIS online. Key arguments for the crime heat maps include a
cell size of 20 ft.; a search radius of 300 ft or approximately the length of a block; an area unit of one
square kilometer or 0.38 square mile; a kernel
density value measured by the number of crime
per square mile and a classification method based
on the mean and the standard deviation with 1/3
standard deviation around the mean as the
interval size. As can be seen from the legend, the
classification is uniform for all the heat maps. This
allows for a multi-year comparison and places all
the years on an even keel.
We continue to shed more light on the residential area of East Liberty and ELDI’s strategy by
mapping the crime data for all crime over the five year period using heat maps specific to East
Liberty. Figure 5a shows the crime hot spots in East Liberty in 2008 and subsequent figures in Figure
5 capture the hot spots in later years. Except for a reversal in the crime situation observed from 2009
Figure 4a-e: Heat maps with East Liberty’s hot spots arranged clockwise with 2008 on the top left
corner.
17to 2010, the rate of decrease in crime incidence has been nothing but spectacular.
The worsening of the crime situation from 2009 to 2010 was brought about by a slumlord who
anticipated being bought out and thus, ramped up his occupancy rate with nuisance tenants in order
to get some bargaining leverage. The property in question is located around the 300 block of Negley
Avenue. This property was bought by ELDI. After carrying out due diligence with regards to
screening potential tenants and putting an effective property manager in place, crime occurrence
declined appreciably as evident in the 2011 crime heat map. The decline was sustained all through
2012 with corresponding decrease observed all through East Liberty. The only area that proved to be
a persistent, chronic hot spot is the red blob at the center bottom which represents East Liberty’s
commercial district.
We wrap up this section by focusing on several hot spots and showing the correlation between the
decline in crime rates and the increase in the number of properties acquired by ELDI in or around
these hot spots. This is done by recreating the maps in Figure 4, with a focus on the hot spots and
superimposing ELDI property acquisition on the maps. The properties acquired are represented by
black boxes for properties purchased before the year shown on the map and blue boxes for those
purchased the same year as the one shown on the map.
One of the hot spots is the 300 block of North Negley Ave and the other is the 500-700 block of
Euclid Ave. These two spots have different characteristics. In 2008, the 300 block of North Negley
Figure 5a-b: Heat maps showing the correlation between crime trend and ELDI property acquisitions
was a crime hot spot while the 500-700 blocks of Euclid, St Clair and Mellon Street, though in a
tolerable state has some hot spots in close proximity to it. Crime incidences plummet in both spots
18over the five year period tracked in our analysis but what is more insightful are the approaches used
to achieve these outcomes.
The properties at Negley include the 300 block of Negley and the 500-800 blocks of Negley. The
properties at the 300 block are large apartment buildings between Rural and Rippey St. that are
conventionally financed while the properties at the 500-800 blocks include properties financed using
LIHTC. The organization has made a conscious effort to have a portfolio of buildings that are
architecturally inconspicuous, maintained in a high quality manner, structurally less dense by using
scattered sites and blends well with the neighborhood style that is typical of East Liberty. In addition,
effective property managers are recruited and empowered to evict nuisance tenants. However, they
are also encouraged to establish positive rapport with tenants by being on-ground and at times,
helping them access supportive service programs. The benefits created by ELDI go beyond their
properties. Spillover effects are noticeable in properties nearby either in terms of the general
ambience, in improved social informal controls or by virtue of the extra policing provided by
uniformed off-duty police officers.
In contrast to the properties on North Negley Avenue, the buildings at the 500 - 700 blocks of Euclid
and adjacent streets are single family homes. The worst slum apartment buildings on these blocks
were single family homes converted into two and three unit apartments. ELDI purchased these
properties and several were converted into high-quality affordable rental using LIHTC. The balance
was converted into single family homes and put on the market. The proximity to Highland Park was
the selling strategy for the homes put on the market with the investment serving two purposes. For
one, safety improved appreciably within the vicinity after they were purchased for the obvious reason
that an individual holding a quarter of a million dollar mortgage is not willing to put up with a
nuisance tenant who lives couple of doors down the street. Secondly, the properties provided enough
critical mass to drive up the comparable sales data and provided the impetus to get flippers interested
in the neighborhood.
Property Prices
The positive outcomes identified are not limited to crime reduction as mentioned above. It is
inevitable that there will be increased demand for properties, either to buy or rent, in neighborhoods
that are relatively safe and thriving given that safety is a precondition for market demand for housing.
This increased demand ultimately translates to higher property prices or rental rates. We have
provided some analysis in this respect using data from RealSTATs. The population of the housing
sales data we used was limited to only sales under consideration. These are arms-length transactions
with unrelated parties and where a state stamp of 1% of the sale price is listed on the deed. Excluded
are family transactions where the parties are related and no state stamp tax is paid; affidavit, where
the state stamp is not 1% of the sales listed on the deed and sheriff sales that include foreclosures and
tax delinquent sales.
19The property types considered are both old and new construction for detached, single family houses;
condominiums, town houses and apartment units, duplexes/triplexes and row houses excluding
properties with four units or more. In addition, to ensure comparability with regards to the quality of
the properties sold, we ignored all sales where the value of the transaction is less than $40,000.
Property prices in nominal dollars were tracked from 2006 to August 2013 for five neighborhoods –
East Liberty, East Hills, Homewood, Highland Park and Garfield. A decision was made to merge data
from East Hills and Homewood
given their comparable
characteristics, proximity and the
small data size from these
neighborhoods.
Figure 7a shows the nominal
average sales price for each
neighborhood from 2006 to
201313. Of the neighborhoods
covered, East Liberty has the
Figure 7a: Average property prices for selected neighborhoods lowest average sales price in
2006. However, it is the only
neighborhood that has reported consistent year on year appreciation in property prices. Within the
eight year window, property owners in East Hills/Homewood and Garfield actually experienced
depreciation in the value of their properties.
Figure 7b shows this in a slightly different manner. The figure shows the appreciation or depreciation
in property prices measured relative to 2006 values. With 2006 as the base year, a positive percentage
shows that on average, property prices
have appreciated and the magnitude
reflects the degree of the increase in
property prices. To put this in
perspective, assume two individuals
with $70,000 mortgage loan in 2006
with one buying in East Liberty and
the other in Garfield. The individual
who bought in East Liberty would
have experienced, on average, a 125%
increase in the value of her property
compared to a 40% decrease for the Figure 7b: Appreciation in property prices relative to 2006
individual who bought a property in average
13
2013 figures are only partial. It covers only the first 8 months of the year.
20You can also read