GROCERY STORE NEEDS ASSESSMENT
←
→
Page content transcription
If your browser does not render page correctly, please read the page content below
ABSTRACT
                                                This report contains the research process of the City
                                                of Tukwila’s Grocery Store Project. It presents
                                                findings, and offers recommendations for growth of
                                                both the City’s main grocery store and the City’s food
                                                system.

                                                Junpei Guo
                                                December 2014

      GROCERY STORE
NEEDS ASSESSMENT
 Tukwila International Boulevard Neighborhood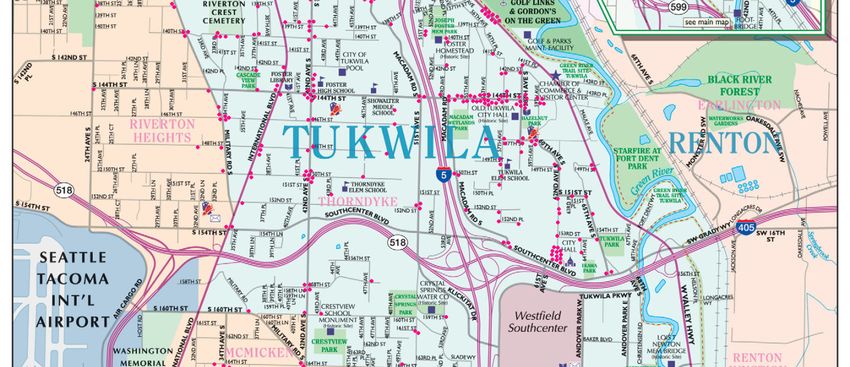
Contents
Executive Summary............................................................................................................................1
Chapter 1. Introduction ......................................................................................................................3
   Background on Tukwila ......................................................................................................................... 3
      Demographics....................................................................................................................................... 3
      Tukwila International Boulevard (TIB) .............................................................................................. 6
      Saar’s Super Saver Foods in Tukwila................................................................................................... 7
   Previous Work on Food Access ............................................................................................................. 8
   Grocery Stores in the Local Food System ............................................................................................. 8
   The Impact of Grocery Stores in Underserved Areas ......................................................................... 9
   Opportunities for Saar’s....................................................................................................................... 10
Chapter 2. Methodology .................................................................................................................. 12
   Literature Review ................................................................................................................................. 12
   Neighborhood Survey ........................................................................................................................... 12
   In-Store Survey ..................................................................................................................................... 12
   Focus Group .......................................................................................................................................... 13
Chapter 3. Data Analysis .................................................................................................................. 14
   Survey Results ....................................................................................................................................... 14
      Neighborhood Survey ......................................................................................................................... 14
      In-Store Survey ................................................................................................................................... 23
   Focus Group Feedback ......................................................................................................................... 32
Chapter 4. Findings and Recommendations ...................................................................................... 38
   Findings from the Data ......................................................................................................................... 38
   Recommendations ................................................................................................................................. 39
   Supplemental Food Business Models .................................................................................................. 40
Chapter 5. Concluding Summary ....................................................................................................... 44
Appendix A-Neighborhood Survey .................................................................................................... 45
Appendix B-In-Store Survey .............................................................................................................. 49
Appendix D-Budget .......................................................................................................................... 53
Bibliography .................................................................................................................................... 54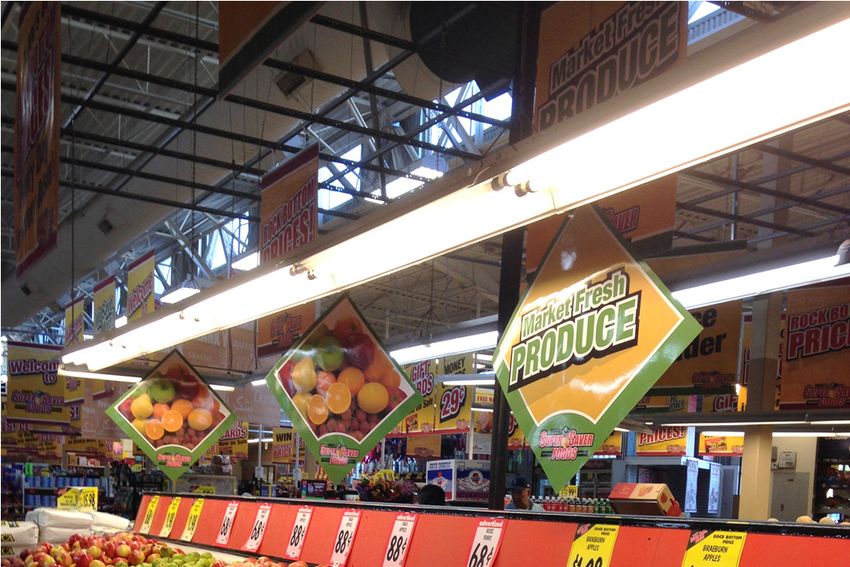
Executive Summary

The City of Tukwila initiated the Grocery Store Project in June of 2014, aiming at bringing a wide
variety of healthy food options to the community. Junpei Guo, Economic Development Intern
with the City, served as the project manager from June to December 2014, and composed this
final report to summarize the six-month process, as well as discuss next steps.

The City’s purpose for completing a grocery store analysis was to ensure that a quality, full-
service grocery store would be able to sustainably operate near the intersection of Tukwila
International Boulevard and South 144th Street, the current location of Saar’s Super Saver
Foods.

This project had four main goals:

   •   Identify food demand of Tukwila residents;
   •   Evaluate the strengths, weaknesses, and opportunities of existing local grocery stores,
       especially Saar’s Super Saver Foods, to better serve the neighborhood;
   •   Develop recommendations to improve the sustainability of Saar’s Super Saver Foods;
       and
   •   Develop supplemental food business models to ensure food access of the community.

In order to achieve these goals, we conducted thorough primary and secondary research
regarding the current food environment in Tukwila, the wants and needs of Tukwila residents,
as well as their expectations towards local grocery stores. Our methodologies included
literature review, a neighborhood survey, Saar’s in-store survey, and focus groups. We have
gathered a large amount of community input, and generated valuable findings and
recommendations for both the City and Saar’s Super Saver Foods.

Primary research findings include:

   •   The majority of Saar’s customer base has lower household income.
   •   Saar’s gained its reputation by offering wide ethnic food selections, attracting customers
       from local as well as surrounding cities.
   •   There is room for Saar’s to improve its food quality, store layout, and grocery selections.
   •   Transportation is not a barrier to grocery shopping for Tukwila residents.

Based upon these findings, we developed set of recommendations for Saar’s Super Saver Foods
and the City of Tukwila. Priority recommendations are as follows.

                                                1
For Saar’s:

   •   Examining ways to improve people’s perception of their food quality;
   •   Expanding organic options;
   •   Renovating store layout; and
   •   Upgrading parking lot security.

For the City:

   •   Continue its effort in revitalizing Tukwila International Boulevard;
   •   Continue building relationship with Saar's, and involve them in more community events;
       in the future; and
   •   Help connect Saar’s with King County’s Kitchen Cabinet Program.

This report also included feasibility analysis of supplemental food business models in Tukwila.
Models being analyzed were a farmers market, fresh produce trucks, and corner stores. These
models could serve as sources of food for residents who have limited access to large grocery
stores or have specific requirements for food.

The Grocery Store Project supplied an assessment of Saar’s, the main grocery store in Tukwila,
and offered suggestions for improvements based upon comments and suggestions from the
community. We hope that Tukwila residents will be able to see how their opinions might have
changed the food environment in Tukwila in the near future.

                                               2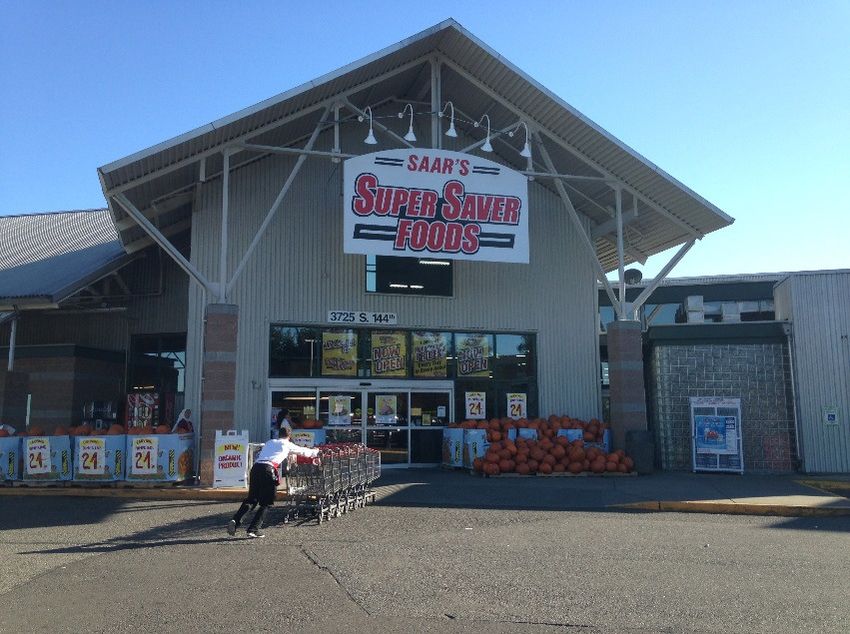
Chapter 1. Introduction
Prior to Saar’s Super Saver Foods, there were two other groceries stores operating at 3725 S
144th Street. One of the stores closed due to bankruptcy of the entire chain and another went
out of business. Given the importance of maintaining a grocery store in the neighborhood, the
City made the decision to do a study to assess methods to ensure a long-term successful
grocery store in Tukwila.

This project had three priorities. The goals were to gather and present:

       1. Information to help the existing grocery store better understand local customer demand
          in order to better serve the local neighborhoods.
       2. Information supporting the long-term use of the property as a quality, full-service
          grocery store.
       3. Information on supplemental business models that would strengthen the existing food
          environment and increase sources of healthy food options for Tukwila residents.

These priorities gave us direction for the research process, beginning with the background
research of Tukwila.

Background on Tukwila
In this section, we will present findings on the characteristics of the City of Tukwila to provide
context regarding the neighborhood.
Demographics
Tukwila is located in south King County, 12 miles south of downtown Seattle and just east of the
Seattle-Tacoma International Airport.1 The 2013 estimate of its population was 19,765, with a
total of 7,300 households and an average household size of 2.6. Approximately 60% of the
people rent their properties.

Since the first Bosnian refugees resettled in Tukwila in the 1990s, the city has transformed
demographically over the past two decades. Somali and Sudanese refugees resettled in the
2000s, and Bhutanese and Nepalese refugees after that.2 As of the 2010 census, the
neighborhood has persisted in a strong ethnic diversity. The racial composition is shown below.
The neighborhood is predominantly White, with the remainder mainly African American and
Asian.

1   "General Information About Tukwila." General Information About Tukwila. N.p., n.d. Web. 27 June 2014.
2
    "Tukwila." Confronting Suburban Poverty. N.p., n.d. Web. 16 July 2014.

                                                               3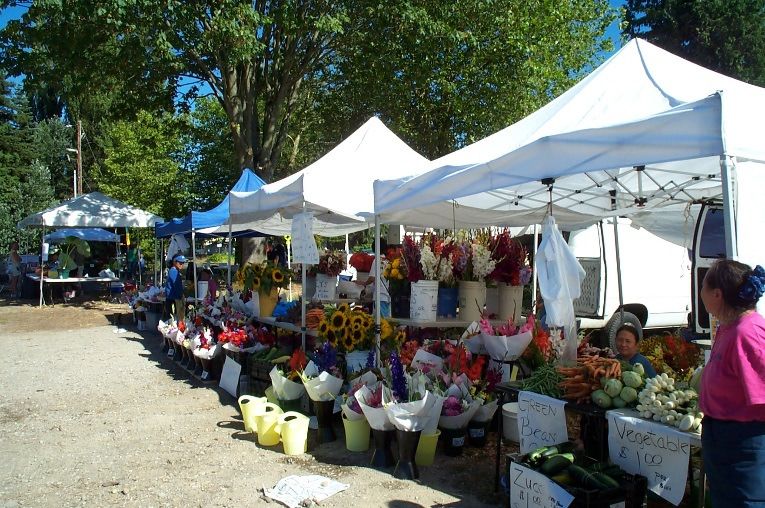
Tukwila Population
                                                                               White
                2.8%                  9.3%
                             6%                                                Black or African American
                                                              43.9%
                                                                               American Indian and Alaska Native
                  19%
                                                                               Asian

                                     17.9%                                     Native Hawaiian and Other Pacific
                                                                               Islander
                 1.1%                                                          Two or More Races

                                                                               Other Races

Figure 1. Tukwila population by ethnicity.

Table 1 below summarizes the income level of Tukwila residents; the column chart offers a
more straightforward view of it. We can identify from the chart that the low-income population
in Tukwila is higher than the Washington average--the city is extremely lacking in high-income
groups. Median household income is $43,333, approximately $16,000 less than the Washington
average $59,374.
Table 13. Washington State and Tukwila households income level.

                                                               Washington State                    Tukwila
                   Income and Benefits
                                                             Estimate    Percent             Estimate Percent
        Total households                                    2,619,995 2,619,995              7,300     7,300
        Less than $10,000                                   159,121    6.1%                  682       9.3%
        $10,000 to $14,999                                  111,915    4.3%                  348       4.8%
        $15,000 to $24,999                                  235,311    9.0%                  966       13.2%
        $25,000 to $34,999                                  248,228    9.5%                  841       11.5%
        $35,000 to $49,999                                  352,214    13.4%                 1,488     20.4%
        $50,000 to $74,999                                  499,007    19.0%                 1,544     21.2%
        $75,000 to $99,999                                  356,484    13.6%                 598       8.2%
        $100,000 to $149,999                                390,195    14.9%                 543       7.4%
        $150,000 to $199,999                                143,095    5.5%                  204       2.8%
        $200,000 or more                                    124,425    4.7%                  86        1.2%
        Median household income (dollars)                   59,374     (X)                   43,333    (X)
        Mean household income (dollars)                     77,232     (X)                   53,043    (X)

3
    "American FactFinder - Results." American FactFinder - Results. U.S. Census Bureau, n.d. Web. 30 June 2014

                                                               4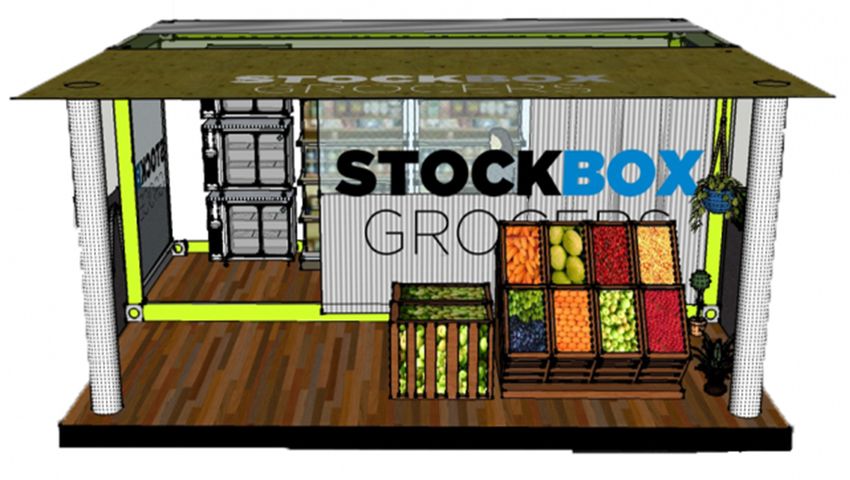
Households Income Level in 2012
                    25.00%
                                                          20.40% 21.20%
                                                               19.00%
       Percentage

                    20.00%
                                                                              14.90%
                                               13.20%   13.40%       13.60%
                    15.00%                         11.50%
                              9.30%        9.00% 9.50%                    8.20% 7.40%
                    10.00%   6.10%
                                       4.80%                                         5.50% 4.70%
                                     4.30%
                     5.00%                                                             2.80%           Washington
                                                                                             1.20%

                     0.00%                                                                             Tukwila

Figure 2. Washington State and Tukwila households income level.

Half of Tukwila’s workers are employed in retail, food service, warehousing, construction and
other services. These industries usually include low-paying jobs and were hit hard in the
aftermath of the financial crisis in 2008. As of 2009, 20.3% of Tukwila residents have income
below the poverty level, greater than the 16.2% of that of the whole state.4 Below is a chart
showing the breakdown by race/ethnicity of low income residents in Tukwila in absolute

numbers.

4
 "Tukwila, Washington (WA) Poverty Rate Data - Information about Poor and Low Income Residents." Tukwila, Washington
(WA) Poverty Rate Data. N.p., n.d. Web. 2 July 2014.

                                                                 5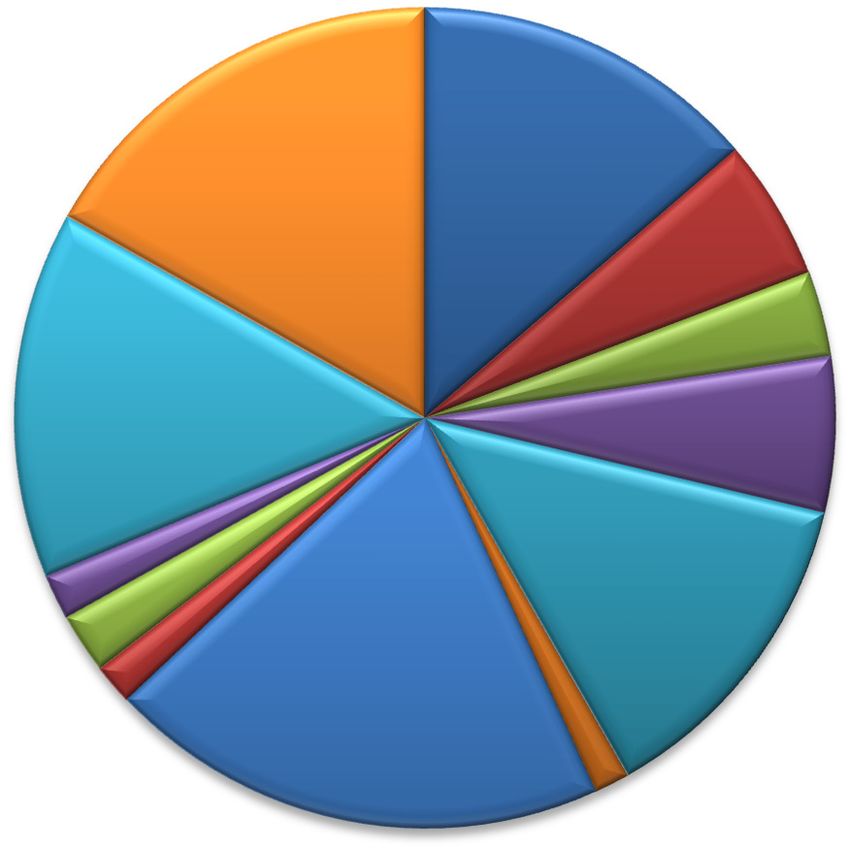
Figure 3. Breakdown by ethnicity of low income residents in Tukwila. (Source: http://www.city-
data.com/poverty/poverty-Tukwila-Washington.html)
2007 demographic statistics show that the total retail sales in Tukwila are roughly $1.55 billion,
much higher than its surrounding cities including Burien, SeaTac, Des Moines, slightly higher
than Kent, and $80 million less than Renton. We must be mindful that the population of each of
these cities is larger than Tukwila; Renton, especially, has a population five times of Tukwila’s.
However, most of the retail categories saw decreased spending over years since 2008, and food
and beverage stores are among them.5
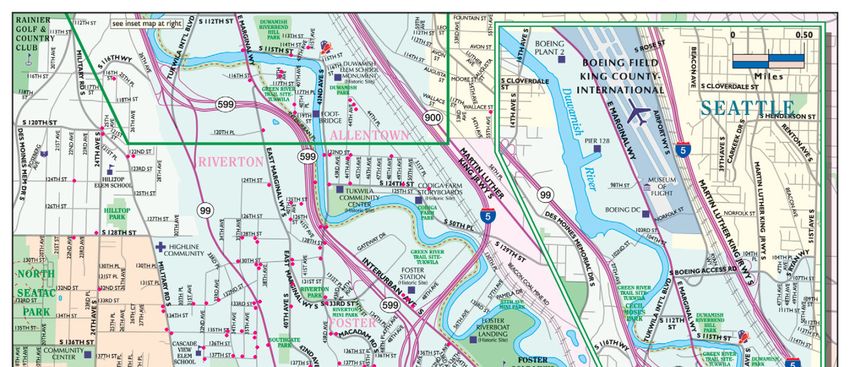
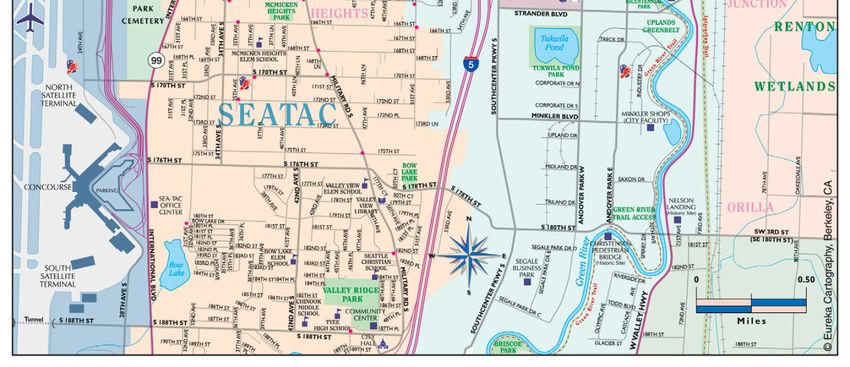
King County is relatively free of food
deserts; however, Tukwila is one of the
few exceptions. Food deserts, as defined
by the USDA, are “urban neighborhoods
and rural towns without ready access to
fresh, healthy, and affordable food.”6 The
map7 on the right may serve as a tool
assisting grocery retailers and community
developers in identifying areas for
potential development. Within the
borders of Tukwila, the green areas are
where “a significant number or share of
residents is more than 1 mile (urban) or
10 miles (rural) from the nearest
supermarket,”8 this is the traditional
definition of a food desert.
Areas of the City that would be
considered a “food desert” by the USDA
include the neighborhoods of Allentown9, Figure 4. Food desert around Tukwila. (Source: USDA)
Duwamish and Foster Point.
Tukwila International Boulevard (TIB)
5
“City of Tukwila Strategic Plan.” City of Tukwila. 2012.
6
"Agricultural Marketing Service." Agricultural Marketing Service - Creating Access to Healthy, Affordable Food. N.p., n.d.
Web. 27 June 2014.
7
"USDA ERS -FOOD DESERT." USDA, n.d. Web. 29 June 2014.
8 "USDA ERS." USDA ERS - Go to the Atlas. N.p., n.d. Web. 27 June 2014.
9
The City is currently conducting a door to door survey of Allentown residents and access to grocery stores has
been a stated concern of many of the residents.
6Puget Sound Regional Council found in their case statement that:10
“The Tukwila-International Boulevard (TIB) transit community…has a population of 4,155,
with 73 percent minority, making it one of the most diverse transit communities in the
region. The Community is a residential and commercial center for Somali immigrants to
the region.”
The majority of the households in TIB community rent. Nearly one out of five households is
living below the poverty level.
The Tukwila International Boulevard Corridor has been serving as a regional example of TOD
(Transit Oriented Development) that has attracted businesses and tourists since 2000. The TIB
light rail station opened in July 2009, connected to a 600-stall park and ride, and is served by
bus rapid transit and other transit routes. The Corridor is gradually becoming a friendlier
pedestrian area with new sidewalks.11
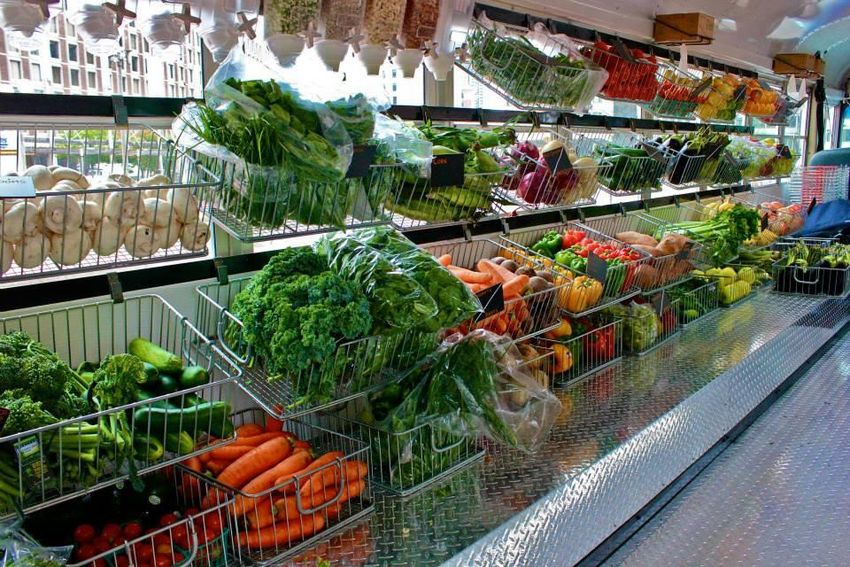
Saar’s Super Saver Foods in Tukwila
Opened in December 2013, Saar’s
Super Saver Foods is located at the
intersection of Tukwila International
Boulevard and South 144th street,
location of the former Tukwila Trading
Company and Larry’s Market. Saar’s
grocery store chain has been operating
as a Washington-based independent
grocery chain since 1988; the first
store was called Saar’s Market Place.12
Besides the Tukwila store, Saar’s also
operates in Seattle, Tacoma, Auburn,
Figure 5. Saar’s Super Saver Foods. (Photo credit: Junpei Guo)
Renton, Lakewood and Oak Harbor.
The location of Saar’s is close to the bus stops of Route 124 and 128, and is only 4 blocks (0.7
miles) away from the Link Light Rail -Tukwila International Boulevard Station. This is a key
location for the City of Tukwila where the neighborhood functions as one of Tukwila’s main
street and has direct driving access to every neighborhood in Tukwila.13 Pedestrian access from
10
"Tukwila International Blvd." LIGHT RAIL/BUS RAPID TRANSIT/BUS. Puget Sound Regional Council, Oct. 2013. Web. 30
June 2014.
11
"Market Analysis for Tukwila International Boulevard Corridor Located in Tukwila, Washington State." (2007): n. pag.
Gardner Johnson, 2007. Web. 1 Nov. 2014.
12 Slack, Eric. "Saar's Market Place." Retail Merchandiser. N.p., 2008. Web. 31 July 2014.
13 Derek Speck (City of Tukwila). February 19, 2013.
7other neighborhoods to TIB can be difficult due to the topography of the area. Although still
new to the community, Saar’s is now serving as the main grocery store in Tukwila.
Previous Work on Food Access
In March 2014, the City of Tukwila’s Department of Community Development (DCD) conducted
the Tukwila Comprehensive Plan Survey, and 262 responses were collected from online,
community connectors, and Community Conservation open houses. Questions covered
housing, business, food access and service needs along TIB. In food access section, people were
asked about whether they were able to buy the kinds of food they wanted near their homes, as
well as their primary sources of food.
71% of total respondents surveyed could find food they wanted near home. 87% respondents
purchased their food from large grocery stores; most of whom shop at Saar’s. Among those
who purchase their food from big box grocery stores (55%), Costco and Wal-Mart are the most
popular destinations. Half of all respondents also shop at ethnic grocery stores, including Halal
and Latino establishments.
Grocery Stores in the Local Food System
Food retailing is a for-profit business. Currently, however, a typical grocery store’s profit is
estimated to be $6,000 per week on average, differentiating them from other for-profit
businesses with larger profit margins.14 Although grocery stores provide an essential service to
their surrounding neighborhoods, they require enough profit to stay sustainable.
A food system includes all processes involving the production, processing, transport and
consumption of food.15 In Tukwila, most residents live within six miles of a grocery store.
Grocery stores, in this report, are defined as stores ranging from 30,000 to 70,000 square feet
and offering fresh produce, a meat and dairy department, and a grocery area. Below is a list of
existing major grocery stores in Tukwila.
Table 2. Existing grocery stores in Tukwila.
Saar’s Super Saver Foods
Grocery Stores
3725 S 144th St Tukwila, WA 98168
Cash & Carry Grocery Stores
230 Andover Park E Tukwila, WA 98188 Wholesale Grocers
Target
Grocery Stores
301 Strander Boulebard Tukwila, WA 98188
14"Access to Healthier Foods: Opportunities and Challenges for Food Retailers in Underserved Areas." Food Marketing Institute,
July 2011. Web. 26 June 2014.
15 "What Is the Food System?" Future of Food. University of Oxford, n.d. Web. 30 Sept. 2014.
8Seafood City Grocery Stores
1368 Southcenter Mall Tukwila, WA 98188 Fish & Seafood Markets
Costco Grocery Stores
400 Costco Dr, Tukwila, WA 98188 Wholesale Grocers
There are also many smaller retail stores that complement the food system, such as 7-Eleven,
Nasrulaah Grocery, and Javi's Mexi-Market. Most of these groceries and delis cater to the
ethnic communities in Tukwila, offering ethnic food like Halal meat.
The Impact of Grocery Stores in Underserved Areas
In most low-income areas, people’s choices about what to eat are severely limited by what they
can afford and by the options available to them. Therefore, a quality grocery store could be of
vital importance to the food desert area it is serving.
Access to healthful food
Major food businesses in Tukwila are fast food, including Wendy’s, McDonald’s, as well as some
other mainstream fast food chains. While unhealthy eating may be economically cheaper in the
short-term, the consequences of long-term limited access to healthy foods is one of the main
reasons that minority and low-income populations suffer from statistically higher rates of
obesity. Regarding this, a grocery store where healthful foods are accessible and affordable to
the neighborhood is necessary in offering healthy eating options.
New local job opportunities
According to the 2008-2012 American Community Survey,16 out of a total of 14,476 Tukwila
residents aged 16 and older, 4,501 are not in the labor force, and 1,046 are currently
unemployed among 9,975 who are in labor force.
Grocery stores usually offer new jobs for the neighborhood, since most grocery stores tend to
hire directly from the areas where they operate.17 Saar’s has benefited the area’s diverse
population by hiring a large number of area residents.
Poverty and crime reduction
Economic development is the most powerful instrument in reducing poverty and crime.18
Employment is the first step. Once a grocery store is set up in the densely populated area in
16 "American FactFinder - Results." American FactFinder - Results. U.S. Census Bureau, n.d. Web. 30 June 2014
17
"Access to Healthier Foods: Opportunities and Challenges for Food Retailers in Underserved Areas." Food Marketing Institute,
July 2011. Web. 26 June 2014.
18 Shapiro, Robert J., and Kevin A. Hessett. "The Economic Benefits of Reducing Violent Crime." Center for American Progress,
June 2012. Web. July 2014.
9Tukwila, the various employment opportunities a local grocery store could generate will attract
more people into workforce and alleviate poverty, thereby reducing crime rates.
Better access to grocery stores means that families spend less time and money on traveling
when grocery shopping. We believe that everyone deserves access to healthy food. Grocery
store access is an important piece of a comprehensive approach to fighting against food desert.
Opportunities for Saar’s
By addressing the following issues that the City has been striving to improve over years, we
believe there are great opportunities for Saar’s to attract more customers from local and
surrounding cities.
Convenient Transportation
Tukwila International Boulevard currently serves as one of the “Main Streets” in Tukwila. The
convenient bus and light rail service ensure an accessible ride for those from surrounding
neighborhoods. In addition, there are ample parking spaces both in the Saar’s parking lot.
Strategic Location
The property is at the intersection of Tukwila International Boulevard and South 144th street,
close to bus stops of Route 124 and 128, and is only 0.7 miles away from the Link Light Rail -
Tukwila International Boulevard Station. This is a key location for the city where the
neighborhood functions as Tukwila’s downtown, combining residential and commercial areas.19
Meanwhile, annual average daily traffic counts (AADTs) are a major concern of grocers during
site selection, as this is a good measure of consumer exposure. Most of them look for AADTs in
the range of 30,000 to 40,000 average cars or more per day in suburban areas.20 At Tukwila
International Boulevard, according to Washington State Department of Transportation
(WSDOT), the AADT in 2013 is 31,000.21 This means Saar’s has the potential to attract more
customers, especially if the store exterior were more visible and appealing.
The new Tukwila Village will be across the street from this location. Its groundbreaking was on
August 1st. Tukwila Village will have 300 senior apartments, 80 family apartments, a new library,
a new medical and dental clinic, 11,000 square feet of retail (Café, restaurants, etc.), a
community meeting room, and a plaza. It will bring in hundreds of new residents to live across
the street from the store location, and will become the central gathering place for residents
19
Derek Speck (City of Tukwila). February 19, 2013.
20 Brubaker, Benjamin T. "Site Selection Criteria in Community Shopping Centers: Implications for Real Estate Developers."
Massachusetts Institute of Technology, Sept. 2004. Web. 1 Oct. 2014.
21 "WSDOT - Annual Traffic Report." WSDOT, 2013. Web. 01 Oct. 2014.
10from all Tukwila neighborhoods. Saar’s could benefit greatly from this foreseeable economic
catalyst.
Improved Safety
The City has taken many steps over the years to improve public safety in this neighborhood.
Firstly, the City re-opened the Police Neighborhood Resource Center at 14862 Tukwila
International Boulevard in 2012. This facility greatly improves the speed with which police can
respond to calls for service in the neighborhood. The facility also houses monitors for the ten
video cameras the City has placed on key streetlight poles in the neighborhood. Police monitor
those cameras and can very quickly respond if they observe suspicious activity. Secondly, the
City Council has approved a 2013-2014 budget that enabled the City to hire more police officers
and staff. These investments are providing an increased police presence on Tukwila
International Boulevard and already improving safety. Lately the City has been working through
the US Attorney’s office to purchase the Great Bear, Boulevard, and Traveler’s Choice motels in
the neighborhood.22 The seizure of these motels by the Federal Government drastically reduced
crime in the area. These purchases were completed this summer.
Government Support
The City of Tukwila has a strong commitment in making TIB a great neighborhood. Millions of
dollars have been invested rebuilding Tukwila International Boulevard, installing sidewalks, and
undergrounding utilities. With a deep understanding of local residents’ demand for a high-
quality, full-service grocery store, the City has been actively building partnerships with different
parties that can help promote the process. The City has also been providing financial support to
various outreach activities in gathering community input, such as focus groups within Tukwila’s
diverse communities.
The City will continue to invest in infrastructure, social programs, and public safety in the long
run.
22 "2014 City-Wide Work Plan-Mid-Year Update." City of Tukwila. 1 July 2014.
11Chapter 2. Methodology
Literature Review
The literature review was performed to gather information about previous work on food access
and local food system, and gain understanding of the role of Saar’s Super Saver Foods, in
preparation for the following surveys and focus groups.
Neighborhood Survey
Our neighborhood survey aimed at gathering more information on consumers’ opinions about
grocery stores in Tukwila. There were 419 responses in total, with 275 from online and 144
through mail and from community events.
Questions of this survey were geared towards the following groups of people:
• People that regularly shopped at Saar’s Super Saver Foods
• People that didn’t shop at Saar’s Super Saver Foods
o Who were familiar with it
o Who were unfamiliar with it
Questions generally covered consumers’ grocery shopping behavior, shopping experience at
Saar’s, expectation of extended grocery services, and demographic information.
We distributed the survey at several community events held by the City between July and
September. For those who were unable to fill out the survey immediately, we offered self-
addressed envelopes so that they can mail the surveys back to us later. These community
events included the July 4th celebration at Fort Dent Park, Touch-A Truck on July 26th, National
Night Out on August 5th, Tukwila Village Groundbreaking on August 8th, and A Taste of Tukwila
on September 19th.
In-Store Survey
Based on the feedback we received from the neighborhood survey, we designed an in-store
survey to focus specifically on Saar’s customers. The questions included people’s grocery
shopping preferences and behavior, shopping experience at Saar’s, expectations of Saar’s and
other local grocery services, as well as general demographic information. We expected to
collect 100 responses within 10 days in September; a high volume of customers was expected
during this period, offering the best opportunity to collect data. However, we had to put it off
to October due to an unexpected delay in gift card authorization. The ultimate goal of the
12project, which this survey contributed to, was to provide Saar’s with information regarding the
needs of its customer base so that it may identify customers’ needs and cater to a greater
proportion of the community.
The timeframe was from October 7th to November 10th. We conducted this survey at Saar’s
Super Saver Foods at 3725 S 144th Street Tukwila, WA. Junpei Guo, the Economic Development
Intern for the City of Tukwila, coordinated the entire survey process. Our table was located near
the main entrance; as customers enter the store, they would be able to identify our table and
see a poster detailing our survey and giveaways. Each survey participant received a $3 Saar’s
gift card in return for their participation. The cost of these gift cards was shared evenly by both
Saar’s Super Saver Foods and the City of Tukwila. Participants reflected Tukwila’s diverse
population.
Focus Group
The goal of the focus groups was to further assess how people get food in an effort to
understand how our community could improve the accessibility and availability of healthy food
resources.
Participants of the first two focus groups were identified from our online neighborhood survey;
respondents that were willing to participate in our focus groups left their names and contact
information at the end of the survey, which was totally voluntary. For the first focus group, we
selected respondents from regular customers of Saar’s; the second focus group accommodated
people that knew Saar’s but chose to not shop there. Therefore, questions for the two focus
groups were slightly different.
Focus groups also gave us an opportunity to talk to communities that are not easily reached by
online surveys. With the understanding that people from different communities may have
different characteristics and needs, we conducted two focus groups with the Latino and Somali
communities respectively.
13Chapter 3. Data Analysis
After completing the neighborhood survey, in-store survey, and focus groups, we will now
discuss the summary of the data we collected. There are two major components in this section:
survey results and focus group feedback. Survey results are further divided into neighborhood
survey results and in-store survey results.
Survey Results
Neighborhood Survey
The Grocery Store Project neighborhood survey, with nine questions in total, was sent out to
the general public through mail, Survey Monkey, and during community events from July 4 to
September 22, 2014. We also posted the link to the survey on the City website and Tukwila
Reporter (both online and paper copy). We ended up getting 419 responses. Below is the
summary of this survey.
Question 1. When was the last time you shopped at Saar’s Super Saver Foods in Tukwila?
A week ago
A month ago
127, 30% 135, 32%
6 months ago or more
I don’t know Saar’s is in
57, 14% 51, 12% our neighborhood
I know Saar’s is in our
48, 12%
neighborhood but I don’t
shop there.
This is a classification question that sorts respondents based upon their shopping experience.
Their answers place them into two categories: people who regularly shop at Saar’s Super Saver
Foods in Tukwila and people who don’t shop there. The latter is further divided into people
who know Saar’s and those who don’t. From the pie chart we can see that 32% of the
respondents shopped there a week ago, while there is another 30% who know Saar’s but don’t
shop there. About a quarter of them are not regular shoppers there.
14Question 2a. Do you typically purchase your grocery needs at one store?
Yes 42.4%
No 57.6%
0 50 100 150 200 250 300
177 respondents answered yes and 240 answered no to this question. In surveys we distributed
at community events, we also asked people what products they purchase from each stores, and
there is a clear sign showing that people tend to buy different things from different stores.
Question 2b. Which of the following grocery stores do you shop at most often?
Saar’s Super Saver Foods 7.0%
Safeway 19.6%
Seafood City Supermarket 1.8%
Fred Meyer 14.6%
Target 6.6%
Costco 15.2%
WinCo Foods 5.6%
Wal-Mart 4.4%
Trader Joe’s 9.8%
Bartell Drugs 2.9%
Uwajimaya 2.9%
99 Ranch 1.2%
Cash & Carry 3.3%
Other 5.1%
0 50 100 150 200 250 300 350
This question aims at gathering information on people’s grocery shopping preferences. From
the products they list under each specific store, nearly one in five people shop at Safeway most
often, followed by Costco and Fred Meyer. Among all the stores listed here, only Saar’s,
Seafood City, Costco, Bartell Drugs and Cash & Carry are located in Tukwila, which add up to
30% in total. This means people shop outside of Tukwila 70% of the time.
15Question 3. How often do you shop at grocery stores?
None 0.5%
1-2 times a month 11.5%
3-5 times a month 42.1%
More than 5 times a month 45.9%
0 50 100 150 200 250
Nearly half of the people surveyed shop for groceries more than five times a month, and a total
of 88% of them shop at grocery stores at least three times a month.
Question 4a-4c are designed to examine the role of transportation in making shopping decisions.
Question 4a. How do you travel to shop at grocery stores?
Drive 90.5%
Bus 3.2%
Walk 5.9%
Other 0.5%
0 100 200 300 400 500
More than 90% of the respondents drive to grocery stores. 3.2% travel by bus and 5.9% on foot.
Question 4b. Please estimate the time you travel to purchase groceries.
Less than 10 minutes 43.8%
10-30 minutes 49.3%
30-60minutes 6.2%
More than an hour 0.7%
0 50 100 150 200 250
93% of all respondents spend less than 30 minutes commuting to grocery stores, among which
nearly half spend less than 10 minutes.
16Question 4c. Please provide the nearest cross street to where you live.
The map below shows the geographic locations of survey respondents’ places of residence.
17Question 5. How much do you typically spend every time you visit a grocery store?
$30 and under 5.0%
$31-$60 33.3%
$61-$100 38.1%
$100 and above 23.5%
0 50 100 150 200
Approximately 60% of respondents spend more than $60 per visit; only 5% spend $30 or less
every time they go grocery shopping. Overall, people spend an average of $81.3 per trip. Taking
into account people’s average monthly grocery shopping cost that was previously calculated,
Tukwila residents spend $374 on groceries every month.
Question 6a. Please circle the number that best represents your decision to purchase
groceries from a particular grocer.
Quality of food 4.68
2.71
Availability of food (variety, brands, 4.33
etc.) 2.91
Prices of food 4.28
3.27
Customer service 3.99
3.15
Overall
Cleanliness of store 4.49
2.95 Saar's
Travel time to the grocery store 3.71
4.12
Buying locally grown foods 3.63
2.65
Familiarity with a Grocery Chain 3.26
0.00 1.00 2.00 3.00 4.00 5.00
Among all 411 people that answered this question, the two most important factors for people
in choosing a primary grocery store are food quality and store cleanliness, followed by food
availability and prices. Buying locally grown food and familiarity with a grocery chain are not
major considerations when making grocery shopping decisions.
18Question 6b. Please circle the number that best represents how well Saar’s Super Saver Foods
in Tukwila meets your shopping expectations.
Based on the reflection of 309 people filled out this question, Saar’s is not doing a satisfying job
in providing quality food and keeping a clean store, scoring only 2.71 and 2.95 respectively.
However, travel time to it stands out among all criteria-it goes beyond the average by 0.41.
Question 7a. If you have shopped at Saar’s, what recommendations would you give
them/what do you expect to see in the future?
The excerpts below offer a flavor of the extensive responses provided to this question.
Although not included in their entirely here, some of the responses were quite comprehensive
and many respondents brought up multiple issues that they believe Saar’s can improve on.
It needs a "face lift". It needs fresher vegetables/fruits/herbs. It needs a butcher in-store.
Dairy products are dismally dated. Want to see more organic produce, on-shelf items, and
meat/poultry/fish/dairy fresh items.
I think the ethnic diversity of the groceries is great! I enjoy Trader Joe’s because of the
unique food items at reasonable prices. I do not necessarily like Safeway but it has a
brighter cleaner feel and some more reasonable prices. I feel I have to check expiration
dates on items at Saars… Saars staff is friendly and helpful so I would hope that would not
change. We have a lower income living in Tukwila...I would like to see food prices be
affordable for folks. I also am understanding that to bring in more choices costs would go
up for some items...I am okay with that.
The store needs to have quality produce available for a price. ORGANIC availability is a big
big big plus!!!
General appearance of inside store is dark, which results in the impression of the store being
dirty. Quality of food needs to go up - seems to be selling lots of pre-frozen items, such as
meats and vegetables. Good selection of alcohol. Better and "cleaner appearance" of other
household products, like beauty aids, baby foods and stuff, etc. Maybe have appearance
model of Trader Joe's and Whole Foods with half price of the latter.
There are so many signs in the overhead that the relevant information is lost in the clutter.
Would like to see some of the smaller shopping carts as an option to rolling around a
monster cart or packing around the store a little basket. Love all of the ethnic choices
available.
19Their stores need to be cleaner, sharper! When in Saar’s I always feel "old" and "tired" the
lighting the shelving everything always seems so tired and out dated. I use to go to a Saar's
on Pearl in Tacoma and it was always so depressing.
I'd tell them what I do/don't buy. I do buy pre-packaged items. I also appreciate that they
serve a number of cultures well with a variety of international food and ingredients. I don't
buy things that have short a shelf life - produce, meat, eggs, and milk. Also, everyone I talk
with that shops there seems to feel the prices are too high.
I will often go to Saar's for the produce, especially if I am looking for something a bit unique.
But I am concerned about purchasing meat. I have in the past and the quality is lacking.
Continue wide variety of ethnic food. Market to the wider Tukwila community, particularly
Caucasian. Many people have misconception that Saar's is low quality. I also sense some
racism on the part of Caucasians; keeping them from visiting Saar's.
As evidenced by these quotes, people’s major concerns are around food quality, customer
service, and store layout. However, there is also a strong community consensus that Saar’s can
do better than the status quo. Other frequently mentioned concerns include: improve store
security, serve fresh seafood, bring more varieties of food to store, etc.
Question 7b. What other services would you like at your neighborhood grocery store (check
all that apply)?
People’s comments are summarized into the chart below.
250
21.0%
200
14.2% 15.7%
150 12.8% 13.9%
100 9.0% 8.5%
4.8%
50
0
21.1% of the respondents want to see a coffee shop in their neighborhood grocery store. Floral
is at the second place, at 15.8%.
20Question 8. If there were a chance to have another grocery store in your neighborhood, what
would you expect it to be?
As TIB continues to transform, it is important that a grocery store remains in the area. As was
discussed above, Saar’s is the third store at the intersection of S. 144th and TIB in the last ten
years. The City’s goal is to work with Saar’s to allow it to be more sustainable and cater to the
needs of the community; however, having an understanding of the desires of the residents is
helpful in the event that Saar’s ceases to operate or if it is determined that the neighborhood
can sustain a second grocery store.
Grocery
Safeway,
Other, 16.8%, Outlet, 5.5%,
13.7%, 69
85 28
Costco, 3.4%,
17
WinCo Foods, Wal-Mart,
14.5%, 73 6.1%, 31
99 Ranch, Fred Meyer,
1.8%, 9 13.1%, 66
Trader Joe’s,
Uwajimaya, 19.8%, 100
2.4%, 12
Cash&Carry ,
Bartell Drugs,
1.6%, 8
1.4%, 7
Question 9a. Gender.
Male 27.6%
Female 72.4%
0 50 100 150 200 250 300 350
72.4% of respondents were female and 27.6% of them were male. Based upon the grocery
store survey women make more grocery shopping trips than men.
21Question 9b. Household size.
The average household size is 3.4. Assuming that each survey respondent is the only person
who does grocery shopping for his or her family, that is, the $374 monthly grocery cost applies
to the whole family, Tukwila residents’ grocery budget is $110/month per person.
Question 9c. What is your estimated annual household income?
250 51.1%
200
150
100 18.3%
12.5% 11.0%
50 3.4% 3.7%
0
More than half of the respondents have a household income of more than $55,000 annually.
The threshold we set for each option in this question was used to identify grocery needs of
medium to low-income population in the community.
Question 9d. Which community are you currently living in?
White Center,
2.0%, 1
Tukwila,
76.5%, 313 South Seattle,
SeaTac, 2.0%, 7.3%, 8
30
Renton,
2.9%, 12
Other,
Kent, 3.4%, 12
30, 7%
Burien, 6%, 14
A total of 313, or 76.5% of people surveyed, live in Tukwila. The rest 23.5% are from
surrounding cities including SeaTac, Burien, Kent, Renton, Federal Way, South Seattle, etc.
22Question 9e. What language do you use most commonly?
Vietnamese,2%, 7
Russian, 0.2%, 1 Mandarin/Canton
ese, 0.4%, 2
Somali, 1%, 4
Samoan, 1%, 3
English, 90%, 388
Other, 10%, 43
Spanish,
6%, 24
Arabic, 0.2%, 1
Japanese, 0.2%, 1
English is the most commonly used language among people surveyed. Other languages include
Spanish, Somali, Vietnamese, Samoan, etc.
In-Store Survey
The Grocery Store Project in-store survey consisted of ten questions, more targeted towards
Saar’s customers comparing to the neighborhood survey. 105 responses were received within a
total of 25 hours spent in store. Interestingly, we got significantly different data on some
questions than we got with the neighborhood survey.
Question 1. How often do you shop at Saar’s Super Saver Foods in Tukwila?
3, 3%
11, Less than 1 time a month
10%
1-2 times a month
54, 52% 3-5 times a month
36, 35%
More than 5 times a month
More than half of all respondents shop at Saar’s more than 5 times a month, and some indicate
that they buy food here on a daily basis. Nearly 90% visit Saar’s at least 3 times every month.
23Question 2a. How do you usually travel to shop here?
Drive 82.3%
Bus 4.4%
Walk 13.3%
Other (Please specify) 0%
0 20 40 60 80 100
Approximately 82% of people drive to Saar’s, an 8 percent drop comparing to respondents of
the neighborhood survey. However, the percentage of people walking exceeds the result in the
neighborhood survey by 8%; this reveals the store’s customer demographics in terms of
geographic locations-many of them are from nearby neighborhoods and they can easily pick up
what they need from Saar’s.
Question 2b. Please estimate the time you travel to shop here.
Less than 10 minutes 52.3%
10-30 minutes 41.1%
30-60minutes 4.7%
More than an hour 1.9%
0 10 20 30 40 50 60
More than 93% of all respondents can access the store within 30 minutes, including those who
take public transit. During survey collection, a few people mention that they would like to
spend an hour on commute because they prefer Saar’s to stores in their own neighborhoods.
Question 3. How much do you typically spend every time you visit us?
$30 and under 24.8%
$31-$60 35.8%
$61-$100 30.3%
$100 and above 9.2%
0 10 20 30 40 50
Roughly 40% of people spend over $60 per visit and 25% of them spend $30 or less, a contrast
to 60% and 5% respectively in the neighborhood survey.
24Question 4a. Is Saar’s your primary grocery store?
Yes 71.0%
No 29.0%
0 10 20 30 40 50 60 70 80
71% of all respondents, who also shop at Saar’s during survey period, consider Saar’s as their
primary grocery store. The other 30% shop at other grocery stores more often. Question 4b will
demonstrate people’s primary destinations for groceries.
Question 4b. Which of the following grocery stores do you shop at most often?
Saar’s Super Saver Foods 26.6%
Seafood City Supermarket 1.0%
Safeway 18.7%
Grocery Outlet 9.5%
Fred Meyer 6.6%
Target 3.3%
Costco 9.8%
WinCo Foods 7.9%
Wal-Mart 5.6%
Bartell Drugs 2.3%
Cash & Carry 2.3%
Trader Joe’s 3.6%
99 Ranch 0.7%
Uwajimaya 1.3%
Other(Please specify) 1.0%
0 10 20 30 40 50 60 70 80 90
Besides Saar’s itself, a preference towards Safeway (18.7%) and Costco (9.8%) can be observed
from the chart. Among all other stores, there is an 8% drop in Fred Meyer, 6.2% drop in Trader
Joe’s, and an emerging interest in Grocery Outlet (9.5%), in comparison to the neighborhood
survey.
25Question 5a. How satisfied are you with the following departments at Saar’s?
5.00 4.34
4.14 3.94 4.05 4.23 4.11 3.97
3.78 3.87 3.70 3.53
4.00 3.45
3.00
2.00
1.00
In this question we asked people to rate each department listed on Saar’s website. They were
only permitted to rate departments that they were most familiar with or have shopped at in-
store to avoid bias. It can be seen from the chart that produce and grocery were two most
highly rated categories at Saar’s, while beauty care and pets were at the bottom.
Question 5b. Please circle the number that best represents how well Saar’s meets your
shopping expectations.
5.00
4.30 4.39 4.34
4.13 4.18 4.16
3.99 3.98
4.00
3.00
In general, Saar’s gets higher ratings from its regular customers than from the entire
community. For example, food quality gets 4.13 in the in-store survey comparing to 2.71 from
the neighborhood survey; customer service gets 4.3 from Saar’s customers as 3.15 from the
general public; store cleanliness is 4.18 while it only got 2.95 in the neighborhood survey. This
could also explain why most survey participants choose Saar’s as their primary grocery store.
26Question 6a, 6b, and 6c are designed in regard to safety concerns of Saar’s customers.
Question 6a. What time during a day do you usually shop at Saar’s?
Daytime 36.9%
Nighttime 2.9%
Both 60.2%
0 10 20 30 40 50 60 70
More than 60% of people shop at Saar’s both during daytime and nighttime; very few shop
there only during nighttime.
Question 6b. Do you feel safe while shopping inside the store?
100% 2
90% 19
80%
70%
60%
50% 101
40% 84
30%
20%
10%
0%
Store Parking Lot
Yes No
Question 6c. Do you feel safe in the parking lot?
Almost everyone feels safe while shopping inside the store. Nevertheless, safety in the parking
lot is a concern to nearly 20% of respondents.
27Question 7. Please check the statements that you agree with.
I shop at Saar’s because it is the nearest grocery store to where I live. 66
a.
I shop at Saar’s because I prefer it over other grocery stores. 42
I prefer well-known name brands over generic or store brands. 14
b.
I don’t pay attention to the brand, but only care about the quality of the product and price. 59
I prefer to have a broad selection in brands when I am looking to buy a particular item. 37
c.
I don’t care for having a broad selection of an individual product. 24
I can always find what I am looking for very quickly at this store. 47
d.
I need to spend some time finding what I am looking for at this store. 21
There are four categories in this question-store preference, brands, selection, and shopping
time. For each category, people can choose one out of two statements that is most applicable
to them. The right column show the number of respondents that checked each statement.
More people shop at Saar’s because of its convenient location rather than their preference
towards it. Most of them pay more attention to food quality and price than to the brands, but
when they are looking to buy a particular item, they tend to prefer a broad selection in brands.
Out of every three customers, two can always find what they are looking for very quickly and
one need to spend some time to locate the item they want.
Question 8. What other services would you like to see at our store?
Other, 1.1%, 2
Floral,
11.6%, 22
Coffee
Shop,24.3%,
46
Pharmacy,
15.9%,30
Deli counter,
Food court, 11.6%, 22
8.5%, 16
Butcher , Bakery ,
9.5%, 18 17.5%, 33
Coffee shop stands out among all optional add-on services. Bakery is at the second place while
pharmacy follows closely after.
28Question 9. What, if anything, can we do to improve your shopping experience at this store?
People have divergent opinions about Saar’s. Out of 28 comments we gathered, some positive
ones are:
Everything is very good. Price is reasonable as is the quality.
All employees do good job. Keep it up!
However, most people left comments on aspects that they would like the store to improve on:
Better layout and more lightning outside.
Better pricing. Many items are cheaper at Safeway. Not very competitive.
Get the smaller shopping carts.
Has dirty appearance, found outdated moldy food on shelves, afraid to buy any meats, so
rarely buy anything but produce, previous Tukwila Trading Company was also horrible with
rotten food on shelves, would shop more often if trusted quality.
More local, more organic produce, more natural product, more variety-everything seems to
be Western Family, not my favorite.
Bakery-Why did your online ad state that something was baked in store when you do not
have an in-store bakery? Seafood-Have live seafood department.
The layout is difficult to navigate-can take too long to find in multiple areas.
More visible security, more lights throughout parking lot.
Question 10a. What is your gender?
Male 38.2%
Female 61.8%
0 10 20 30 40 50 60 70
The ratio of male and female is close to 4:6, more balanced than the neighborhood survey
which has a gender ratio of 3:7.
29Question 10b. What is your age group?
9 23 20 18 22 9
8.9% 22.8% 19.8% 17.8% 21.8% 8.9%
0 20 40 60 80 100 120
Under 25 25-34 35-44 45-54 55-64 65 and above
Most people surveyed fall into 25-34 and 55-64 age groups. A couple of teenagers filled out the
survey under the assistance of their parents.
Question 10c. What is your household size?
The average household size of people surveyed is 4.0.
Question 10d. What is your estimated annual household income?
30 26.5%
25 22.5%
20 15.7%
15 12.7% 12.7%
9.8%
10
5
0
In contrast to the neighborhood survey, respondents of the in-store survey are more on the
lower income level-26.5% of them have an annual household income of $10,000 and under; a
total of 49% of people’s families earn less than $25,000 year. More than half of the
neighborhood survey respondents have an annual household income of more than $55,000,
while the percentage here is only 12.7%.
30Question 10e. Which neighborhood are you currently living in?
Tukwila Hill 34.7%
Cascade View 13.9%
Foster 9.9%
Riverton 7.9%
Southcenter 5.9%
Mcmicken Heights 4.0%
Thorndyke 1.0%
Burien 8.9%
SeaTac 5.0%
Des Moines 4.0%
Kent 2.0%
West Seattle 2.0%
Federal Way 1.0%
0 5 10 15 20 25 30 35 40
More than one third of all survey respondents live on Tukwila Hill, also knows ad the Old
Tukwila Neighborhood; Cascade View is also a major place of residence of Saar’s customers.
There are 8.9% of customers coming from Burien, 5.0% from SeaTac, and 4.0% from Des
Moines.
Question 10f. What language do you use most commonly?
Spanish, 13.1% Somali
16
Vietnamese
Tigrinya
Other, 16.4%,20 Arabic
Urdu
Swahili
English, 70.5%, 86 Russian
Korean
Hmong
Hindi
Fijian
Amaric
Albanian
Similar to the neighborhood survey, English and Spanish are still two biggest languages spoken
by respondents. Other languages are listed in the chart, ordering by the number of people who
speak them.
31Focus Group Feedback
We conducted four focus groups between September 3rd and November 12th in order to further
identify the need of the community.
1st Focus Group
The first focus group was held on September 3, 2014 at Foster Public Library meeting room. We
sent out invitations to 21 randomly selected respondents from the online neighborhood survey
who had shopping experience at Saar’s and demonstrated an interest in participating in the
focus group; some of them are frequent shoppers and some only shopped there once or twice.
Ten of them confirmed to come, one tentative, and nine people showed up eventually.
However, one left before the focus group started due to some emergencies. There were 7
female and 1 male.
There were six questions in total, and for each of the questions we had 10-15 minutes for
people to discuss. All participants were generous and willing to share their thoughts and the
conversation was hence self-generated. Below is a brief summary of people’s answers to all
questions.
1. What influences your choice of a grocery store?
Quality of produce was most frequently mentioned by people. Besides that, store cleanliness,
proximity, travel time, and brands were also their major concerns.
As a follow-up to this question, we asked people about where they shopped for groceries most
often. It turned out that Fred Meyer and Costco are on top of the list, followed by PCC and
Trader Joe’s. People spoke highly of Saar’s ethnic food options, but in the meantime claimed
that sometimes they couldn’t find all their grocery needs at the store. Most of them “would like
to drive further to get a better selection.”
2. What is your primary source of food?
All participants said that grocery stores were their major source of food. Two persons in the
focus group owned home gardens. People went to farmers market once in a while, and Burien
and Georgetown ones were most often visited.
3. How often do you eat at home/out?
Three of them stated that they “eat at home at least 90% of the time.” Two student
participants only commented on restaurants in Tukwila. They also addressed that if there were
more restaurants in Tukwila, not just fast food chains, they would be happy to eat out more. All
agreed that Tukwila had many good Somali restaurants and they deserved more attention.
324. What do you think Saar’s can improve on?
People brought up various issues in this question. One thing that was constantly mentioned was
the quality of produce at Saar’s. “Things purchased at Saar’s don’t last,” “Always long wait at
check-out,” “Not thrilled with customer services at Saar’s,” and “Signs block where products are
located” were typical remarks. However, one person in the group had never had any of the
above issues at Saar’s.
5. What other services do you expect at Saar’s?
Two of them would like to see better beer and wine selection. Other services that people
discussed include bakery, deli, better seafood, and more organic produce.
We asked people if they have communicated their concerns to Saar’s, and only one said yes.
One person answered no because he “doesn’t think they would care,” while others already had
low expectations of Saar’s and feel that “complaining at any store isn’t worth it.”
6. Would you like a farmers market in Tukwila?
Everyone supported establishing a new Tukwila Farmers Market. They also mentioned the
Tukwila International Farmers Market that was put into operation in 2005. They agreed that the
main obstacle for Tukwila to have its own farmers market was a lack of market demand.
2nd Focus Group
Our second focus group took place on October 9th, 2014 at Foster Public Library meeting room.
There were five questions in total, and for each of the questions we had 10-15 minutes for
people to discuss. Same as the first focus group, participants were also randomly selected from
neighborhood participants; but what’s different from the first one was, most of the participants
indicated in the survey that they knew Saar’s is in our neighborhood but they chose to not shop
there. Meanwhile, there was a better gender balance, with five females and three males,
representing different age groups. A summary of the conversation is as follows.
1. What influences your choice of a grocery store?
People made grocery shopping decisions based on:
• Freshness and quality of the produce
• Surroundings of the store
• Familiarity with the store
• Organic food
• Proximity
33You can also read