Final Recommended Network - FEBRUARY 2021 - New Orleans Regional ...
←
→
Page content transcription
If your browser does not render page correctly, please read the page content below
Final
Recommended
Network
FEBRUARY 2021

                1 | Introduction & Executive Summary   i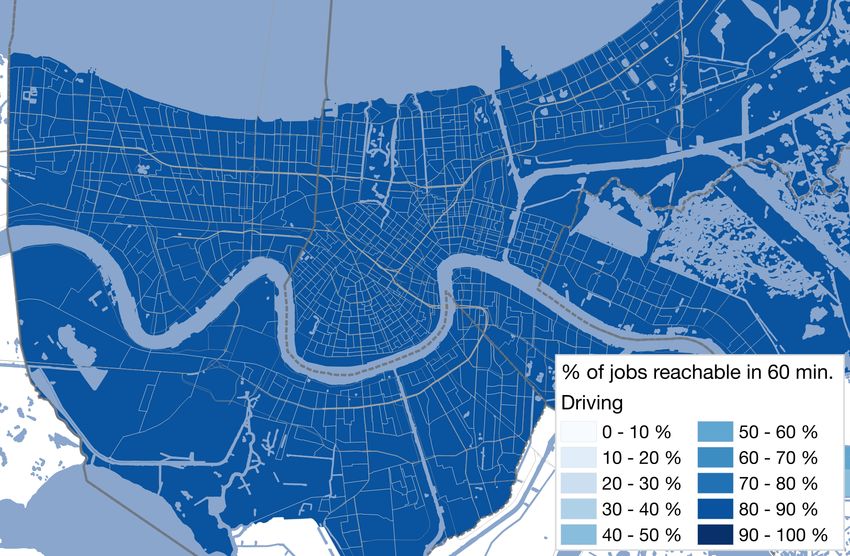
About New Links                                                                                                                                                    Community Engagement Process
                                                                                                                                                                   Community engagement for the New Links project was extensive and robust. The project team extensively consulted riders and
                                                                                                                                                                   other transit stakeholders over multiple phases of outreach during the two-year planning process that led to the development of
                                                                                                                                                                   the Final Recommended Network.
New Links is a collaborative project led by the planning staff of the Regional Planning Commission (RPC), which is a transportation
policy organization made up of elected officials, transportation agencies, and citizen representatives from the eight parishes in                                  The planning and execution of each phase of outreach was a major undertaking in which several important groups played a part.
the greater New Orleans region. The RPC is responsible for developing policies and plans for federally funded transportation                                       While surveys and information were distributed through a multitude of other channels, as described in the Final Network Report,
projects in the region.                                                                                                                                            public meetings and digital town halls were central to informing community members and collecting feedback during each phase.
The New Links project focuses on the services operated by the two largest transit providers in the greater New Orleans region:1                                    During Phase I, the RPC co-hosted a series of neighborhood meetings with the City of New Orleans’ Office of Neighborhood
                                                                                                                                                                   Engagement and Office of Transportation. During Phase II, RIDE New Orleans (RIDE) led a series of stakeholder meetings before
•     The Regional Transit Authority (RTA), which operates 40+ bus, streetcar and ferry routes primarily in New Orleans and the
      City of Kenner, and:                                                                                                                                         the pandemic began, and transitioned to hosting digital town hall meetings when in-person outreach became impossible. Phase
                                                                                                                                                                   III once again relied on digital town hall meetings led by RIDE. The RTA also assisted with rider-focused engagement for Phase III,
•     Jefferson Transit (JET), which operates 11 bus routes in Jefferson Parish.                                                                                   helping to survey transit riders and disseminate information on the Proposed Network.
In early 2018, the RTA board adopted their Strategic Mobility Plan (SMP), a 20-year comprehensive plan for enhancing the agency’s
transit service. As part of that plan, the agency committed to implementing a network redesign.

The RPC, which regularly works on planning projects with both the RTA and JET, was approached by the RTA in mid-2018 to lead
the planning for a network redesign that could include both agencies as part of a comprehensive effort. At the time, the RPC was
managing JET’s strategic planning process, and received positive feedback from JET leadership about the prospect of a regional
transit redesign that would involve both agencies. JET’s Strategic Plan, released in 2019, committed the agency to implementing
the recommendations of the network redesign along with the RTA. With the blessing of both agencies, the RPC initiated the New
Links study in early 2019.

Planning Process
The purpose of the New Links project is to develop a set of short-term recommendations for improving transit service that can
be implemented quickly using existing funding. The project involves two major components: a Comprehensive Operations
Analysis (COA) of existing transit and a planning process for a network redesign of the region’s transit system.

A Comprehensive Operations Analysis (COA) is a system-wide study of a transit network that includes a detailed, line-by-line
assessment of every transit route in a system. To conduct the COA, the New Links project team gathered and analyzed data
on existing lines operated by the RTA and JET to better understand how the existing regional transit system operates, who is
currently riding transit, and the strengths, weaknesses and challenges of the system. In March 2019, a national surveying firm
contracted with the RPC to gather data on system ridership and conduct a comprehensive demographic and Origin-Destination
(OD) survey of regional bus, streetcar and ferry routes. This data was used to create a detailed profile of transit usage in the region
including rider demographics, trip purposes, and origin-destination patterns.

The second task of the project consisted of developing a plan for a network redesign of RTA and JET services. A network
redesign involves re-imagining transit service in a city or region to create a plan for service that reflects current travel needs and
community priorities, and can be implemented using existing resources. The New Links project team developed a network
redesign plan to incorporate the results of the COA along with community feedback and a detailed analysis of regional transit
demand. A draft version of the plan was released for public comment in October 2019, and feedback on the draft plan is
incorporated into the Final Recommended Plan presented in this report.

While a portion of New Links was completed by a consulting team, the majority of the planning and analysis work on this
project was performed in-house by the planning and data science staff of the RPC and RTA, including the development of the
Phase II Service Concepts.

1T
  he study area for New Links includes the census-defined urbanized of Orleans, Jefferson, and St. Bernard Parishes. In addition to RTA and JET service, the
 project also incorporates recommendations for St. Bernard Urban Rapid Transit (SBURT), which operates a single fixed-route bus line serving St. Bernard Parish.

ii   Final Recommended Network                                                                                                                                                                                                                                                        About New Links iii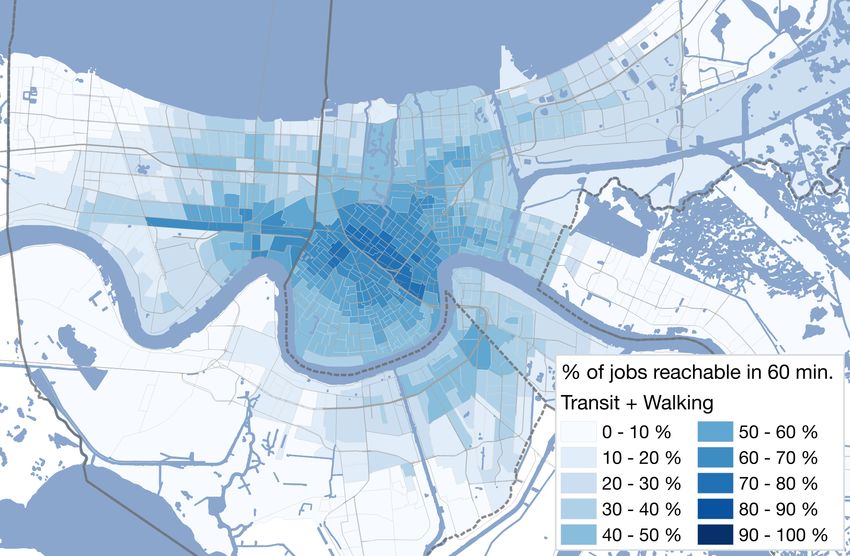
Table of Contents

                                    1 | Introduction & Executive Summary . . . . . . . . . . . . . . . . . . . . . . . . . . . . . . . . . . . . . . . . . . . . . . . . . . . . . 3
                                          What is New Links?. . . . . . . . . . . . . . . . . . . . . . . . . . . . . . . . . . . . . . . . . . . . . . . . . . . . . . . . . . . . . . . . . . . . . . . . . . . . 5
                                          What is the purpose of this report? . . . . . . . . . . . . . . . . . . . . . . . . . . . . . . . . . . . . . . . . . . . . . . . . . . . . . . . . . . . . . . 5
                                          Who developed this plan? . . . . . . . . . . . . . . . . . . . . . . . . . . . . . . . . . . . . . . . . . . . . . . . . . . . . . . . . . . . . . . . . . . . . . . 5
                                          What is a Network Redesign?. . . . . . . . . . . . . . . . . . . . . . . . . . . . . . . . . . . . . . . . . . . . . . . . . . . . . . . . . . . . . . . . . . . 5
                                          Why redesign the network?. . . . . . . . . . . . . . . . . . . . . . . . . . . . . . . . . . . . . . . . . . . . . . . . . . . . . . . . . . . . . . . . . . . . . 6
                                          What are the big takeaways?. . . . . . . . . . . . . . . . . . . . . . . . . . . . . . . . . . . . . . . . . . . . . . . . . . . . . . . . . . . . . . . . . . . . 8
                                          What was the process for developing the plan?. . . . . . . . . . . . . . . . . . . . . . . . . . . . . . . . . . . . . . . . . . . . . . . . . . . . 9
                                          What are the next steps?. . . . . . . . . . . . . . . . . . . . . . . . . . . . . . . . . . . . . . . . . . . . . . . . . . . . . . . . . . . . . . . . . . . . . . . 9

                                     2 | Summary of Public Engagement. . . . . . . . . . . . . . . . . . . . . . . . . . . . . . . . . . . . . . . . . . . . . . . . . . . . . . . 15
                                          Introduction. . . . . . . . . . . . . . . . . . . . . . . . . . . . . . . . . . . . . . . . . . . . . . . . . . . . . . . . . . . . . . . . . . . . . . . . . . . . . . . . .  17
                                          Phase I: Trade-offs (Summer–Fall 2019). . . . . . . . . . . . . . . . . . . . . . . . . . . . . . . . . . . . . . . . . . . . . . . . . . . . . . . . . 18
                                          Phase II: Service Concepts (Spring 2020) . . . . . . . . . . . . . . . . . . . . . . . . . . . . . . . . . . . . . . . . . . . . . . . . . . . . . . . . 20
                                          Phase III: Proposed Network. . . . . . . . . . . . . . . . . . . . . . . . . . . . . . . . . . . . . . . . . . . . . . . . . . . . . . . . . . . . . . . . . . . 23

                                     3 | Recommended Network Plan. . . . . . . . . . . . . . . . . . . . . . . . . . . . . . . . . . . . . . . . . . . . . . . . . . . . . . . . . . 27
                                          Existing Network overview. . . . . . . . . . . . . . . . . . . . . . . . . . . . . . . . . . . . . . . . . . . . . . . . . . . . . . . . . . . . . . . . . . . . 32
                                          Summary of recommended changes – regional network. . . . . . . . . . . . . . . . . . . . . . . . . . . . . . . . . . . . . . . . . . . 36
                                          Summary of recommended changes – New Orleans East. . . . . . . . . . . . . . . . . . . . . . . . . . . . . . . . . . . . . . . . . . 38
                                          Summary of recommended changes – Algiers and Gretna . . . . . . . . . . . . . . . . . . . . . . . . . . . . . . . . . . . . . . . . . 42
                                          Summary of recommended changes – Downtown. . . . . . . . . . . . . . . . . . . . . . . . . . . . . . . . . . . . . . . . . . . . . . . . 46

                                     4 | Measuring Impacts. . . . . . . . . . . . . . . . . . . . . . . . . . . . . . . . . . . . . . . . . . . . . . . . . . . . . . . . . . . . . . . . . . .  49
                                          Notes on measuring impacts . . . . . . . . . . . . . . . . . . . . . . . . . . . . . . . . . . . . . . . . . . . . . . . . . . . . . . . . . . . . . . . . . . 51
                                         Access to transit . . . . . . . . . . . . . . . . . . . . . . . . . . . . . . . . . . . . . . . . . . . . . . . . . . . . . . . . . . . . . . . . . . . . . . . . . . . . . 52
                                          Isochrone maps. . . . . . . . . . . . . . . . . . . . . . . . . . . . . . . . . . . . . . . . . . . . . . . . . . . . . . . . . . . . . . . . . . . . . . . . . . . . . . 54

                                     5 | Resilience and Priority Plan. . . . . . . . . . . . . . . . . . . . . . . . . . . . . . . . . . . . . . . . . . . . . . . . . . . . . . . . . . .  59
                                          Service allocation priorities. . . . . . . . . . . . . . . . . . . . . . . . . . . . . . . . . . . . . . . . . . . . . . . . . . . . . . . . . . . . . . . . . . . . 61
                                          60% funding scenario. . . . . . . . . . . . . . . . . . . . . . . . . . . . . . . . . . . . . . . . . . . . . . . . . . . . . . . . . . . . . . . . . . . . . . . . . 62
                                          80% funding scenario. . . . . . . . . . . . . . . . . . . . . . . . . . . . . . . . . . . . . . . . . . . . . . . . . . . . . . . . . . . . . . . . . . . . . . . . . 63
                                         100% funding scenario. . . . . . . . . . . . . . . . . . . . . . . . . . . . . . . . . . . . . . . . . . . . . . . . . . . . . . . . . . . . . . . . . . . . . . . . 64
                                         125% funding scenario. . . . . . . . . . . . . . . . . . . . . . . . . . . . . . . . . . . . . . . . . . . . . . . . . . . . . . . . . . . . . . . . . . . . . . . . 65

                                     6 | What Happens Next? . . . . . . . . . . . . . . . . . . . . . . . . . . . . . . . . . . . . . . . . . . . . . . . . . . . . . . . . . . . . . . . . . 75
                                          Short-term. . . . . . . . . . . . . . . . . . . . . . . . . . . . . . . . . . . . . . . . . . . . . . . . . . . . . . . . . . . . . . . . . . . . . . . . . . . . . . . . . . 77
                                          Long-term . . . . . . . . . . . . . . . . . . . . . . . . . . . . . . . . . . . . . . . . . . . . . . . . . . . . . . . . . . . . . . . . . . . . . . . . . . . . . . . . . . 78

iv   Final Recommended Network                                                                                                                                                                                                1
Table of Figures and Maps
Figure 1A: “What is a Network Redesign?”. . . . . . . . . . . . . . . . . 5 Figure 3D: Recommended Network frequency and span. . . . 37
Figure 1B: “Why redesign the network?”. . . . . . . . . . . . . . . . . . . 6 Map 3E: Existing Network – New Orleans East . . . . . . . . . . . . 39
Figure 1C: Average trip time to work (in minutes) by Map 3F: Recommended Network – New Orleans East . . . . . . 41
travel mode for Orleans Parish residents, 2014-2018 . . . . . . . . 6 Map 3G: Existing Network – Algiers and Gretna . . . . . . . . . . . 43
Map 1D: Percentage of jobs reachable within Map 3H: Recommended Network – Algiers and Gretna. . . . . 45
60 minutes using public transit and walking. . . . . . . . . . . . . . . . 7
Map 3I: Recommended Network – Downtown. . . . . . . . . . . . . 47
Map 1E: Percentage of jobs reachable within
60 minutes driving. . . . . . . . . . . . . . . . . . . . . . . . . . . . . . . . . . . . . . 7 Figure 4A: Percentage of residents in the region
within half mile of transit – weekdays at noon . . . . . . . . . . . . . 52
Map 1F: Recommended Network Map. . . . . . . . . . . . . . . . . . . . . 8
Figure 4B: Percentage of households in the region
Figure 1G: Percentage of residents in the region within within half mile of transit – weekdays at noon . . . . . . . . . . . . . 52
half mile of transit – weekdays at noon . . . . . . . . . . . . . . . . . . . 10
Figure 4C: Percentage of jobs in the region
Figure 1H: Percentage of households without access to a car within half mile of transit – weekdays at noon . . . . . . . . . . . . . 52
in the region within half mile of transit – weekdays at noon. . 10
Figure 4D: Percentage of residents in poverty in the
Figure 1I: Timeline of the New Links Process . . . . . . . . . . . . . . 12
Introduction &
region within half mile of transit – weekdays at noon. . . . . . . 53
Figure 2A: RTA Strategic Mobility Plan (SMP)
1
Figure 4E: Percentage of residents of color in the
outreach findings. . . . . . . . . . . . . . . . . . . . . . . . . . . . . . . . . . . . . . 17 region within half mile of transit – weekdays at noon. . . . . . . 53
Executive Summary
Figure 2B: JET Strategic Plan outreach findings. . . . . . . . . . . . 17 Figure 4F: Percentage of households without access to a car
Figure 2C: Phase I engagement strategies and metrics . . . . . 18 in the region within half mile of transit – weekdays at noon. . 53
Figure 2D: Phase I findings. . . . . . . . . . . . . . . . . . . . . . . . . . . . . . 19 Map 4G: Access within 60 minutes to the New Orleans
Figure 2E: Trade-off – direct v. circuit route . . . . . . . . . . . . . . . 19 CBD – weekdays at noon . . . . . . . . . . . . . . . . . . . . . . . . . . . . . . . 55
Figure 2F: Trade-off – connecting v. single route. . . . . . . . . . . 19 Map 4H: Access within 60 minutes to Lakeside
Shopping Center – weekdays at noon . . . . . . . . . . . . . . . . . . . . 56
Figure 2G: Phase II engagement strategies and metrics. . . . . 21
Map 4I: Access within 60 minutes to Elmwood
Figure 2H: Concept A – Coverage + Consistency . . . . . . . . . . . 21 – weekdays at noon. . . . . . . . . . . . . . . . . . . . . . . . . . . . . . . . . . . . 57
Figure 2I: Concept B – Ridership + Frequency. . . . . . . . . . . . . . 21 Map 4J: Access within 60 minutes to Delgado
Figure 2J: Concept C – Access + Speed. . . . . . . . . . . . . . . . . . . . 21 Community College – weekdays at noon. . . . . . . . . . . . . . . . . . 58
Figure 2K: Phase II survey findings. . . . . . . . . . . . . . . . . . . . . . . 23 Figure 5A: Percentage of residents in the region within
half mile of transit (60% system) – weekdays at noon. . . . . . . 61
Figure 2L: Phase III engagement strategies and metrics . . . . 23
Figure 5B: Percentage of jobs in the region within
Figure 2M: Phase III survey results by frequency
half mile of transit (60% system) – weekdays at noon. . . . . . . 61
riding transit. . . . . . . . . . . . . . . . . . . . . . . . . . . . . . . . . . . . . . . . . . 24
Figure 5C: 60% funding scenario service plan. . . . . . . . . . . . . . 62
Figure 2N: Phase III survey results by race. . . . . . . . . . . . . . . . . 24
Figure 5D: 80% funding scenario service plan . . . . . . . . . . . . . 63
Figure 2O: Phase III survey results by COVID ridership. . . . . . 25
Figure 5E: 100% funding scenario service plan. . . . . . . . . . . . . 64
Figure 2P: Phase III Survey results by plans to ride
transit after COVID . . . . . . . . . . . . . . . . . . . . . . . . . . . . . . . . . . . . 25 Figure 5F: 125% funding scenario service plan. . . . . . . . . . . . . 65
Figure 2Q: Phase III survey results by parish. . . . . . . . . . . . . . . 25 Map 5G: 60% funding scenario map. . . . . . . . . . . . . . . . . . . . . . 66
Map 3A: Existing Network Map. . . . . . . . . . . . . . . . . . . . . . . . . . 30 Map 5H: 80% funding scenario map. . . . . . . . . . . . . . . . . . . . . . 68
Figure 3B: Existing Network frequency and span. . . . . . . . . . . 33 Map 5I: 100% funding scenario map. . . . . . . . . . . . . . . . . . . . . . 70
Map 3C: Recommended Network Map . . . . . . . . . . . . . . . . . . . 34 Map 5J: 125% funding scenario map. . . . . . . . . . . . . . . . . . . . . 72
2 Final Recommended Network 3What is New Links?
New Links is a planning project to reimagine how public transit connects Orleans, Jefferson, and St. Bernard parishes. The
Regional Planning Commission (RPC) is working with the Regional Transit Authority (RTA) and Jefferson Transit (JET) to
develop recommendations for redesigning the region’s transit network to create more reliable, equitable, and connected bus
and streetcar service.
What is the purpose of this report?
This report presents the Final Recommended Network, the project team’s recommendation for the best possible transit network
that can be run using the combined resources of the RTA and JET prior to the COVID-19 pandemic. The Final Recommended
Network is the culmination of two years of planning and community engagement work by the New Links project team.
In addition, this report presents:
• A summary of the three phases of public engagement which led to the Final Recommended Network and the key feedback
from the public which informed the plan.
• A Resilience and Priority Plan addressing how the RTA and JET should prioritize service if the funding environment for transit
changes after the pandemic.
• A summary of the steps required for the transit agencies to implement the plan.
Who developed this plan?
The network was designed by the RPC, RTA and JET transportation planning staff. Although the transportation planners designed
the network, it is meant to reflect the priorities of riders and stakeholders and was developed in close coordination with RTA and
JET leadership.
What is a Network Redesign?
A network redesign is a transit planning process that begins by wiping the slate clean and starting from scratch. Working together,
planners and the public can decide where, when, and how transit should serve a region. Many cities, including Houston, TX
and Columbus, OH, have successfully grown ridership, improved frequency, and increased the reliability of transit service by
reallocating existing resources.
Figure 1A: “What is a Network Redesign?”
What is a
Network Redesign?
A network redesign takes
and creates a new and improved
existing resources (vehicles,
map and service plan.
drivers, operating budget)
4 Final Recommended Network 1 | Introduction & Executive Summary 5Why redesign the network? Riders have consistently indicated that they are ready for change and that they would be willing to make
trade-offs to make transit service better and more reliable.
Transit in Greater New Orleans has not been rethought in a long time. Many of the features of the current system are based on
a scaled-down version of the regional network run by RTA and JET before Hurricane Katrina in 2005. The network includes many Map 1D: Percentage of jobs reachable within 60 minutes using public transit and walking
bus lines that were designed for a different time in the city’s history, and some of these “legacy” services are not well-suited to
the current needs of the region. Since Hurricane Katrina in 2005, there has been significant growth in the region and major
changes to the places where residents live and work, but the transit network has not fully kept up with those changes.
Figure 1B: “Why redesign the network?”
Over the decades, our region has seen immense growth, yet
our current public transit is not keeping up.
It takes almost twice as long There aren’t enough Ongoing maintenance
for a transit rider to reach stop and transfer facilities. issues make the system
their destination than it does even more unreliable.
for someone with a car.
Figure 1C: Average trip time to work (in minutes) by travel mode for Orleans Parish residents, 2014–2018
SOURCE: RIDE NEW ORLEANS, 2020
Map 1E: Percentage of jobs reachable within 60 minutes driving
13
23
23
24 AVERAGE
25
44
SOURCE: CENSUS BUREAU, 2014-2018 ACS
Poor reliability, limited stop amenities and roadway infrastructure for transit users, and other issues add to the challenge of
using public transit. Limited coordination between transit services operating in Orleans and Jefferson parishes make cross-parish
trips difficult for riders. Because most bus lines in the city are designed to get riders to and from Downtown New Orleans, it is
difficult and time-consuming to access destinations in other parts of the region.
Taken together, these issues create significant barriers for residents of the region who must rely on transit to get to jobs and
other destinations. A typical resident can only reach 43% of the region’s jobs in 60 minutes or less via transit and walking,
while a person driving a car can reach over 99% of the region’s jobs.2
SOURCE: RIDE NEW ORLEANS, 2020
2 Source: Ride New Orleans, 2020 State of Transit Report.
6 Final Recommended Network 1 | Introduction & Executive Summary 7AN
RR
CU
Map 1F:
Recommended Network Map
VI
NC
EN
T
E
YN
HA
OA
D 68
MICHOUD
ER
IC
RV
BU
E
0S
LL
I-1
AR
D
Bullard @ Walmart
66 62, 66, 68, 73
N 62 73 DW
YER
ISO
RE
E RR
A
YN
HA MO
D
62
BU
ND
Y
Y
LL
TI
66
CR
Lake Forest Plaza
N
DOW
GE
OW
T
FORES
SOUTHERN
61, 62, 66, 68, 73, 94
LD
UNIVERSITY OF
W LOYOLA
VINTAGE
LAKE
UNIVERSITY
DE
NM
O
NEW ORLEANS
AT NEW
E LOYOLA
R
ORLEANS NEW ORLEANS
AN
EAST HOSPITAL
READ
SIMON EUR
LEON C ENT
OCHSNER
DWYER FM
61
MEDICAL CTR
CHE
PRESS
KENNER
62 61
FRANKLIN
W ESPLANADE
ST. ANTHONY
94
LOYOLA
S
55
GRES
W ESPLANADE
TRAN
POW
55 61/62
CON
57 NTEUR
CHEF ME
HOUMA
ER
SCO
FILMORE
EAST
E6 Desire Parkway
JEFFERSON
NTIN
ELYSIAN FIELDS
GENERAL
HOSPITAL
55, 61, 62,
Veterans @ Williams E7
CANAL BLVD
MIRABEAU
E
80, 94, 96
NTA
201, E1
SEVERN
VETERANS
L
HARRISON LY
E1 52b GEN
TIL
WISNER
GE
E1
CLEARY
BRID
VETERANS CATON 61/62
201
ORT
NI
0
BAIN
I-1
CAUSEWAY
MARCO
80
AIRP
I-10 DILLARD
UNIVERSITY
E1
PARIS
ST.
W NAPOLEON I-610
BONNABEL
BER
LOUIS ARMSTRONG
NEW ORLEANS
E6 94
NA
INTERNATIONAL AIRPORT
RD
ELYSIAN FIELDS
A
DESAIX
LOUIS
52a 96
FRANKLIN
RIE
DELGADO
E7 METAI COMMUNITY
ON
COLLEGE
LT
ES
OL
AMS
PL
W METAIRIE 91
E
RR
AN
DESIR
AD
52
CA
D
WILLI
N MIRO
CLEA
OA
E N GA
Cemeteries
N
LVEZ
BR
E2 AIRLINE 91 FLO
RIDA
RVIEW
27, 47A, 91, E1
N
OR
27 47a 47b LE
AN 55 84 N RO
S CHEB
POLAND
DA AIRLINE LAVE
E7 VI
D E2 96 57
E2 84
RI
Elmwood 47 N CLA
86
ELO
E
VE 39, E7, W10 IBOR
E7
RN
TU
R EARHART EXPY LA 88 NE
TUP
BO
NE
E1 Elysian Fields ST CLA
AI
CA
17
HLE
CITRUS Xavier UDE
CL
NA
RT
@ St. Claude
IN
39
E
39
UV
17, 27, 39, L
ME
N
PA
CAFF
49, 55, 80, 88
SA
M
96, E2 WJ
ELM
Y
RA
CLE
VA
UD
HW 96 HOSPITAL GE
T
N
N EA PER
WOO
27
ARV
O OCHSNER
HIC
E RS MEDICAL RH UMC EZ
3
R
F AR
DE
TU
JEF
WA
AD
CENTER
E
T
IEW
KOR
D PK
URIC
86
CA
N
NUNEZ
RO
86
SH
RO
ST. BERNARD COMMUNITY
DE
Y
Carrollton CHA
SB
LSUHSC COLLEGE
Arabi
HOSPITAL
ING
AS
MA
RTRE S
LA
12, 16, 39 S
ID
Algiers Ferry
TO
84, 86, 88, S
N
EG
DE
ST.
W10
O
ENIE
PO 1 Terminal
N
N
LE
YD
TO
39 VE
R W 17 MLK, RA 1, 103
LL
ILL S
RI OPELOUSAS
O
JR.
S. C
OW
RR
BLV
CA
D WS
LAIB
AY
TO
TB
IS
L B LANDRY
S
DW
ERN
12
PAR
L
DELGADO
ORN
ED
103 ARD
OA
WEST BANK
HW
16
AN
CAMPUS
16/17
BR
Y
E
O
ST
.C
HA LE GE
TULANE
AL MARDI GRAS NM
RL UNIVERSITY
LA
S 15 EYE
ES
OCHSNER
27 114 W2/W3 R
LEAKE
BAPTIST Algiers
15 FRERET
AN
LOYOLA
UNIVERSITY Park & Ride
N
105
N
105, 114
11
HA
LOU
NAPOLEON
JA
CK
P
12
O
SO
ISIA
SH
103
KABEL
N
BRIDGE CITY 105
WHITNEY
BI
NA
LAY
NE BE
CH
ZI HR 114
91
AR
GA
C
SON M
MA 4
RY
LES AN
ST. CHAR S
FRANKLIN
OAKS
HEN
W10 96 HW
TOURO
JEFFER
TE
94
INFIRMARY
Y
RR
INT
114b
Y
114a
GARDEN
E PO
11
WOODLAND
HOLIDAY
GAM
MIL
BINO Tchoupitoulas
EJ
TCHOUPITOULAS Wilty Terminal
UD
11, 96
E
BERKLEY
NIN
GE
CHILDREN’S
SULLEN
103, 105, 114, GE
LER
HU
HOSPITAL
W1 N
OL
W2/W3
PE
W2, W3, W8
EY
DE
BUT
PIT
RE
UNIVERSITY
W8 GA
P
OF HOLY
Z
CA
UL
LO
CROSS
LE
N
103
G
STU
MP
AV
F L
NIA
E
LO
CO
TU
LL
IS
IE
W2
JAM
CAROL SUE
TERRY
Walkertown Terminal K EX
WY W3
E ST
W1, W2, W4, W10 AN
W1 WES W ESTB BE
LL
TBAN E
BER
K EX CH
MA
WY AS
NICOLLE
NAR
NH
SE
BEHRMAN
WEST
AT
JEFFERSON
DH
MEDICAL
TA
AMES
BARATARIA
CENTER
N
WY
LAP
ALC
WALL
O W4
OCHSNER
MEDICAL CTR
W3
WEST BANK
0 1MI W8
SERVICE FREQUENCY LAPALCO
LAPALCO
114a
5–15 MINS 114 ROUTES LIKE 114 SPLIT INTO a & b BRANCHES
114b POS
T
16–20 MINS
61 BUS & STREETCAR LINES CAN JOIN TOGETHER FOR
25–30 MINS 61/62 W4
62 MORE FREQUENT SERVICE ON CERTAIN CORRIDORS
IA
35–60 MINS
R
TA
RA
BA
61+ MINS
TRANSFER POINT
REGIONAL HUB
1 | Introduction & Executive Summary 9
020821What are the big takeaways? Improved frequency
The new network would significantly improve the number of people living within a half mile of bus lines coming at least every
Figure 1G: Percentage of of
residents in the region 15 or 20 minutes.
Percentage residents within 1/2within
mile ofhalf mile service:
transit of transit – weekdays at noon
February More equitable service
9% 19% 39% 72% 79% (21%)
2019 The improved service would be strongest for residents who are most likely to need transit. People living in poverty and households
February without access to a car would see the greatest gains in access to frequent service.
15% 19% 37% 71% 78% (22%)
2020
Recommended
21% 38% 44% 71% 73% (27%) More efficient service
Network
The new network incorporates best practices to make service more efficient. This includes removing overlapping segments
from many bus routes and structuring RTA and JET services so that they do not compete for riders.
Service 5-15 minutes 20 minutes 25-30 minutes
Frequency: 35-60 minutes >60 minutes No service
Better job access across parish lines
The new network is structured to create better workforce connections for riders. The network significantly improves the number
of residents who would have access to major job hubs in both Jefferson and Orleans parishes.
Transfer hubs
FigurePercentage of households
1H: Percentage without
of households access
without to atocar
access within
a car 1/2region
in the mile of
within half mile of transit – weekdays at noon
transit service: The new network would establish transfer hubs at several locations in Orleans, Jefferson and St. Bernard parishes. Some of these
February hubs would use existing transfer facilities (such as Wilty Terminal), while others would require new facilities (such as the proposed
16% 34% 61% 87% 92% (8%) hub in New Orleans East).
2019
February Setting up regional transfer hubs makes it possible to run more frequent and more reliable service to New Orleans East, the
29% 35% 63% 86% 92% (8%)
2020 West Bank, and Jefferson Parish by eliminating some of the overlap between different services and by shortening the running
Recommended time for certain routes connecting to Downtown. These improvements also create better connections for riders traveling within
44% 64% 71% 88% 91% (9%)
Network a neighborhood. The trade-off for these improvements is that some riders must make an extra transfer to get Downtown.
Service 5-15 minutes 20 minutes 25-30 minutes Reduced coverage
Frequency: 35-60 minutes >60 minutes No service In order to make these improvements, the plan eliminates or consolidates some existing bus lines with other routes, reducing
coverage. A few areas of the region that currently have bus service would lose coverage as part of the redesign.
10 Final Recommended Network 1 | Introduction & Executive Summary 11What was the process for developing the plan? What are the next steps?
The RPC will deliver the New Links recommendations to RTA and JET leadership for their review and approval. The RTA and
JET will review the recommendations using their own internal processes, and ultimately, the RTA board will vote on the plan.
Figure 1I: Timeline of the New Links Process If approved, the New Links network could be implemented within the next 12 months, by early 2022.
Timeline of New Links Process:
Community Outreach Community Outreach Community Outreach Community Outreach
RTA and JET Phase I: Trade-offs Phase II: Service Phase III: “What do
Strategic Plans for Improving Service Concepts People Think of the Plan?”
2017–2018 JULY–SEPT 2019 FEB–JUNE 2020 OCT 2020–JAN 2021
17 18 19 20 21
MAR–JUNE 2019 OCT 2019–JAN 2020 JULY–SEPT 2020 FEB 2021
Gather Data and Develop Service Develop Proposed Release Final
Analyze Bus System Concepts Transit Plan Recommendations
New Links is the result of a two-year process, combining multiple phases of community feedback with a detailed review of
the operating needs and regional market for public transit:
Rider feedback
The most important components of the planning process were the priorities identified by riders and other transit stakeholders
during the RTA and JET strategic planning processes and during New Links outreach in 2019 and early 2020.
Agency strategies
This plan reflects strategies developed by the RTA and JET in their strategic planning processes as described in the 2018 RTA
Strategic Mobility Plan and the 2019 JET Strategic Plan.
Ridership and operations data
In 2019, the project team conducted a detailed study called a Comprehensive Operations Analysis (COA) of existing transit
services. The COA included detailed data on ridership, on-time performance, and fleet usage for the RTA and JET.
Data on transit needs
The planning team developed a transit propensity index to understand where people live, work, and attend school. The
methodology for this index was based on the transit index developed by the RTA for its Strategic Mobility Plan. The New Links
analysis builds upon that effort with newer and more detailed data including additional information on housing, school enrollment,
and higher education.
Data on regional travel
The network plan incorporates data on where and when people travel. Some of this information comes from the Origin-
Destination survey of RTA and JET riders conducted in 2019 which provides information on who is using the transit system and
where, when, and why people travel. The New Links project team also used other sources of travel data on employment and
educational trips to understand overall regional travel patterns and identify where transit connections need to be improved.
12 Final Recommended Network 1 | Introduction & Executive Summary 13Summary of
2 Public Engagement
14 Final Recommended Network 15Introduction
This section summarizes the public engagement process for the Recommended Network Plan. The project team extensively
consulted riders and other transit stakeholders over multiple phases of outreach during the two-year planning process that
led to the development of the Final Recommended Network.
The engagement process builds on community outreach done by the RTA and JET during the development of their long-range
strategic plans which initiated the New Links effort. The RTA’s Strategic Mobility Plan (SMP) was released in 2018, while JET’s
Strategic Plan was released in 2019.
Both plans offer a wide-ranging, 20-year vision for transit improvements and agency growth. When creating their plans, both
agencies performed extensive public outreach engaging a significant number of riders and non-riders to determine public
priorities for transit improvements.
The New Links proposal builds directly on those long-term planning efforts by the RTA and JET, and the public priorities
gathered during their outreach are a core part of New Links.
Figure 2A: RTA Strategic Mobility Plan (SMP) outreach findings
What 4 types of strategies are most important
to improve public transportation?
frequent riders occasional riders infrequent riders
Fast, Frequent Service Fast, Frequent Service Fast, Frequent Service
Night & Weekend Options Night & Weekend Options Night & Weekend Options
Stops & Facilities Stops & Facilities Stops & Facilities
Technology Technology Technology
Fares & Passes Fares & Passes Fares & Passes
Vehicles Vehicles Vehicles
On-Demand Service On-Demand Service On-Demand Service
Development & Parking Development & Parking Development & Parking
Least Most Least Most Least Most
Importance Importance Importance
Figure 2B: JET Strategic Plan outreach findings
What did the public have to say
about the current network?
JET Riders Want Greater Reliability and more Morning, Night and Weekend Service.
More late night, early morning, and weekend service 55%
Greater Reliability 54%
Go to more places 24%
Better bus stops 21%
16 Final Recommended Network 2 | Summary of Public Engagement 17TRADE-OFF 1: WALKING DISTANCE
Phase I: Trade-offs (Summer–Fall 2019) Trade-offs: one-seat rides vs. transfers
During the first phase of New Links public outreach, in the Summer and Fall of 2019, the project team surveyed members
of the public about their key priorities for improving transit service. TRADE-OFF
TRADE-OFF
1: WALKING
1: WALKING
DISTANCE
DISTANCE
During Phase I public meetings, the public considered trade-offs showing two different versions of a trip using transit: the
first version showed a trip with a single-seat ride but a longer overall wait time for a bus, and the second showed a trip with
an additional transfer but less waiting time. Most riders and non-riders preferred the second scenario with the transfer.
The goal of Phase I outreach was to better understand which features of good transit were most important to the public Direct Route Circuit Route
and to introduce the concept of trade-offs. With the project designed to be cost-neutral, the New Links team asked the public Figure 2E: Trade-off – direct v. circuit route
Direct Route
Direct Route Circuit Route
Circuit Route
Longer walking distance Shorter walking distance
More trips per day Fewer trips per day
to provide feedback on how to improve the current transit system using the existing budget for the regional transit agencies.
They asked community members what trade-offs they would be willing to make to achieve better transit service within the Direct Longer
Shorterwalking Longer
distance
overall commute walking distance Circuit Shorter walkingShorter
Longer overall commute distance
walking distance
Route More trips per day More trips per day
Route Fewer trips per Fewer
day trips per day
Direct routes travel in straight lines and do not meander to reach This route winds through an area to allow for shorter walks to and from
areas outside a corridor. This means walking farther to get to and from transit stops. The lengthier route means fewer trips and longer commute
network. Trade-offs included frequency, transfers, speed, access, stop proximity, and overall connectivity. Shorter overall Shorter
commute
transit stops.
overall commute
times.
Longer overall commute
Longer overall commute
Direct routes travel in straight
Directlines
routes
andtravel
do not
in straight
meanderlines
to reach
and do not meander to reach This route winds throughThis
an area
routetowinds
allowthrough
for shorter
an area
walkstotoallow
and from
for shorter walks to and fr
Figure 2C: Phase I engagement strategies and metrics TRIP ORIGIN areas outside a corridor. This
transit stops.
areasmeans
outsidewalking
transit stops.
a corridor.
farther
Thistomeans
get towalking
and fromfarther to get to and from TRIP ORIGIN transit stops. The lengthier
times.
transit
route
times.
stops.
means Thefewer
lengthier
trips and
routelonger
means commute
fewer trips and longer com
During Phase I, the project team gathered
TRIP ORIGIN TRIP ORIGIN TRIP ORIGIN TRIP ORIGIN
DESTINATION DESTINATION
over 2,000+ surveys.
DESTINATION DESTINATION DESTINATIO
12 468+ 41 Walking distance Vehicle Transit Route Walking distance Vehicle Transit Route
Public Meetings Potential Audience Tabling Events & Trade-offs: walking to transit
(Kick-off & Open House Meetings) Reach for Media Ride-alongs (including RTA Events)
During Phases I and II, the project team asked members of the public several questions related to how far people are willing to
walk to get
Walking
PREFER
to their
distance
Walking
DIRECT
bus ordistance
streetcar.
Vehicle Transit Route Transit Route
Vehicle
PREFER
Walking distance
CIRCUIT
Walking distance
Vehicle Transit Route Transit Route
Vehicle
2,000+ 63 1,000+ Understanding how people feel about walking is important for designing a transit network in several ways:
Survey Participants Stakeholder Meetings, Citizens at
Community Meetings and Engagement Events • First, it helps planners understand how far apart bus routes running parallel to each other should be spaced. A transit system can
Pop-Up Tabling Events PREFER
PREFER
DIRECT
DIRECT
be designed so that routes are more frequent but spaced farther apart, or less frequent but closer together. It is generally more
New Links is a partnership between the Regional Planning Commission and the Regional Transit Authority, in
collaboration with Jefferson Transit and St. Bernard Urban Rapid Transit, with support from the City of New Orleans. PREFER
PREFER
CIRCUIT
CIRCUIT
efficient to design bus systems with more widely spaced routes because there is less duplication (overlap) between bus routes.
• Second, it helps planners establish standards for direct service and deviations. Deviations are essentially detours where
Figure 2D: Phase I findings a bus leaves a corridor to provide direct service to a particular destination. Deviations make travel times longer for most riders
and
New Links is can
a partnership contribute
New Links
between
is a partnership toPlanning
the Regional poor
between service
theCommission
Regional reliability.
Planning
and the
Commission
Regional Transit
and the
Authority,
RegionalinTransit Authority, in
collaboration with Jefferson
collaboration
Transit
with
andJefferson
St. Bernard
Transit
Urban
andRapid
St. Bernard
Transit,Urban
with support
Rapid Transit,
from the
with
City
support
of New
from
Orleans.
the City of New Orleans.
Phase I • Third, understanding how the public feels about walking helps planners set standards for how far apart bus stops should be.
When there are lots of stops near each other, riders will generally spread out among more stops on a line forcing the bus to
Key public input findings slow down and stop at each one. More stops also make it easier for buses to get caught at red lights at intersections which
adds to travel time. However, communities prioritize closer stops, even if it means less reliable service. Understanding how
the community feels on this issue is crucial to the overall network design.
Better FREQUENCY and EXPANDED
71%
TRADE-OFF 1: WALKING DISTANCE TRADE-OFF 2: TRANSFERS
All three of the issues above are related to the same idea: it’s possible to design bus service to travel to everyone’s doorstep,
SERVICE HOURS are common
TRADE-OFF
TRADE-OFF
2: TRANSFERS
2: TRANSFERS
themes from all participants. of meeting participants are WILLING but the bus service you get is slow, infrequent, unreliable, and not useful for most people.
TO TRANSFER if it means a SHORTER
TRAVEL TIME and more trips per day. During Phase I public meetings, people considered a trade-off showing two versions of a transit trip: one with a shorter walk but
slower trip, and one with a longer walk but a faster trip. Most riders and non-riders preferred the faster trip with the longer walk.
Frequent riders, occasional riders and
Direct Route Circuit Route Connecting Routes Single Route
infrequent riders all have SIMILAR
80%
Fewer trips per day
TRANSIT PRIORITIES. Longer walking distance Shorter walking distance Figure 2F: Trade-off – connecting v. single route More trips per day
Connecting Routes
Connecting Routes Single Route Single Route
Shorter overall commute Longer overall commute
More trips per day Fewer trips per day
Connecting Single
Routes on a network designed with fewer connections make
Shorter overall commute of meeting participants would prefer Longer overall commute A transit network designed with many connections can make it easier to
Fewer trips per day
longer trips to get people where they need to go.
Fewer trips per day
More trips per day More trips per day
get more places more quickly. This means transferring more often.
A DIRECT ROUTE, even if they have This
Route Route
Direct routes travel in straight lines and do not meander to reach route winds through an area to allow for shorter walks to and from
areas outside a corridor. This means walking farther to get to and from transit stops. The lengthier route means fewer trips and longer commute
Shorter overall commute
Shorter overall commute Longer overall commute
Longer overall commute
RELIABILITY is an important concern.
transit stops.
to WALK FARTHER TO A STOP. times. Routes on a network designed with fewer
Routes
connections
on a network
makedesigned with fewer connections
A transit network designed with manyAconnections
transit network
can designed
make it easier
with to
many connections can make it easier to
longer trips to get people where they longer
need totrips
go. to get people where they need to go.
get more places more quickly. This means
get more
transferring
places more
morequickly.
often. This means transferring more often.
TRIP ORIGIN TRIP ORIGIN TRIP ORIGIN TRIP ORIGIN
TRIP ORIGIN TRIP ORIGIN TRIP ORIGIN TRIP ORIGIN
DESTINATION DESTINATION
DESTINATION DESTINATION
Walking distance Vehicle Transit Route Walking distance Vehicle Transit Route Walking distance Vehicles Transfer Transit Routes Walking distance Vehicles Transit Routes
DESTINATION DESTINATION DESTINATION
18 Final Recommended Network 2 | Summary of Public Engagement 19
PREFER DIRECT PREFER CIRCUIT Walking distancePREFER
Walking CONNECTING
distance
Vehicles Transfer
Vehicles Transit Routes
Transfer Transit Routes PREFER
Walking distance SINGLE
Walking distanceROUTE
Vehicles Transit Routes
Vehicles Transit RoutesPhase II: Service Concepts (Spring 2020) Concept A: Coverage + Consistency:Concept
Service Frequency
A: Coverage + Consistency: Service Frequency Figure 2H: Concept A – Coverage + Consistency
Pa
Pa
ris
COVERAGE +
ris
COVERAGE +
Rd
Rd
Weekdays 9:00 AM - 3:00 PM Weekdays 9:00 AM - 3:00 PM
Concept A: Coverage + Consistency: Service Frequency
Pa
ris
COVERAGE +
Rd
CONSISTENCY
Little Woods
CONSISTENCY
Little Woods
Weekdays 9:00 AM - 3:00 PM
In Phase II of New Links, the project team used planning data and public feedback gathered during Phase I to develop three
60 60
62 62
Paris Rd
Paris Rd
CONSISTENCY
Mo
rriso
n Rd
64
Mo
rriso
n Rd
Little Woods 64
65 60
65
62
Paris Rd
detailed Service Concepts showing different ways the public transit network could be redesigned using existing resources.
n Rd
Bu
rriso 64
Bu
W. Loyola Dr
Cro
lla
W. Loyola Dr
Cro
lla
Mo
rd
62
wd
rd
E. Loyola Dr
62
wd
Av
E. Loyola Dr
Av
er Blv
65
e
er Blv
e
Dr
60 60
64
d
Simon Dr
64
d
n C. 10 Simon 10
University of Leo n C.
Leo
Rd
Bu
University of
Rd
t Blvd
W. Loyola Dr
Cro
New Orleans
Williams Blvd
lla
ly
Lake Fores New Orleans t Blvd
Williams Blvd
ly
til
Lake Fores
Dow
rd
New Orleans
62
til
Gen
wd
Dow
New Orleans
67
E. Loyola Dr
Gen
Av
East Hospital 67
er Blv
East Hospital
Lakeview New Orleans East
ld
e
nma
Some bus routes change to bring
New Orleans East64
ld
nma
Lakeview
O
SUNO 64 60
O
SUNO Dr 64
n Rd
d
Simon
n Rd
201 n C. 10
W. Esplanade Ave
Franklin Ave
201 Leo
62 University of
St. Anthony Ave
W. Esplanade Ave
Franklin Ave
Rd
65
Con
62
St. Anthony Ave
65 t Blvd
Con
New Orleans
Williams Blvd
ly
60 Lake Fores
Paris Ave
til
Dow
New Orleans
gres
60
Paris Ave
55 90
Gen
Kenner vd
gres
55 90 67
Kenner Robert E. Le e Bl vd East Hospital
W. Esplanade Ave Robert E. Le e Bl
New Orleans East
ld
Pontchartrain Blvd
nma
s Dr
W. Esplanade Ave
Pontchartrain Blvd
Phase II engagement launched in February 2020 and was originally scheduled to conclude in April 2020. During the first part of
Lakeview
O
s Dr
32nd St SUNO 64
ur Hwy
Canal Blvd.
32nd St ur Hwy
Canal Blvd.
more people to jobs and other
East Jefferson Chef Mente
n Rd
East Jefferson Chef Mente
General Hospital 52 80
201 W. Esplanade Ave 57
General Hospital 67 52 57 80
Franklin Ave
67
Press Dr
62
St. Anthony Ave
31st St 65
Con
Press Dr
31st St
Gentilly 60
Gentilly
Paris Ave
10
gres
55 90
E5 Kenner 10 51 Robert E. Le e Bl
vd
Fleur de Lis Dr
Metairie E5 51
Fleur de Lis Dr
W. Esplanade Ave
Metairie
Veterans Blvd
Concept A looks a lot like
Pontchartrain Blvd
s Dr
Veterans Blvd
Concept A looks a lot like
32nd St Harrison Ave ur Hwy
Canal Blvd.
Memorial Harrison Ave
Veterans E1 Memorial
Veterans
East Jefferson
General E1
Hospital
Chef Mente
52 80
destinations.
90 94 57 94 67
90
Press Dr
31st St
Causeway Blvd
Causeway Blvd
St.
Gentilly67
10
St.
Phase II, input was collected through six public meetings, a web survey, and a series of pop-up and ride-along events to survey
10
Williams Blvd
Dillard
10
Williams Blvd
Berna
202 Dillard
Berna
Napoleon Ave. University
202 67 E5Chickasaw St 51
Fleur de Lis Dr
Napoleon Ave.
Metairie
Elysian Fields Ave
University St
the bus and streetcar
Veterans Blvd Chickasaw
Concept A looks a lot like
Elysian Fields Ave
the bus and streetcar
10 Zachary 90 10 90
rd Ave
Taylor Dr Harrison Ave Taylor Dr
Zachary
rd Ave
Memorial
Veterans E1 62
E8 E8 62 94
Louis Armstrong New Orleans Louis Armstrong New Orleans 610 610 90
51
Causeway Blvd
International Airport
Canal Blvd
51
St.
International Airport 10
Canal Blvd
Williams Blvd
Dillard
65
Berna
Napoleon Ave. Delgado 202 University 65 67 St
Chickasaw
system right now, but with
Elysian Fields Ave
Desaix Blvd Delgado
the busright
system and streetcar
now, but with
Community Desaix Blvd
10 ZacharyCommunity 90
rd Ave
Taylor Dr
St
Rd College
St
Rd College
ie
Louisa
E8 64 ie 62
Louisa
T 64
transit riders. Due to the COVID-19 outbreak that halted in-person outreach in mid-March, the project team made the decision
Es
r
E5
T Es 610
tai
Louis Armstrong New Orleans 27 91 plan
r
E5
tai
27 91 plan
Me
51
e
International Airport
Me
48 ad
Canal Blvd
d Av
e
Airlin
48 ad
d Av
e Hwy Airlin e e
e Hwy Av
65
e
E2 Av
oa
47 e 84 Flor Delgado
some changes:
Av
e
E2
oa
84 Flor
system right now, but with
ida 47 DesaixeBlvd
some changes:
Av
Br
N Galve Ave ida
Mid-City
Community
Br
llton
Jeffers N Galve Ave
61
Mid-City
z St
N
llton
on H Jeffers
61
St
College z St
N
wy on H 27 Rd
rro
wy ie 27
rro
Louisa
91 64
Ca
t St
T Es 91
Ca
t St
r
E5
tai
61 27 Ca91 plan
S
E2 Ca
32 E2 84 61
Mazan
Airline Dr 80
S
Me
90
e
32
Mazan
na Airline Dr 80
90 nal 48 ad
d Av
Airlin l St e 84
Earhart Expy e Hwy 48 St 48 Av
E8 N Claib Expy
Earhart
Ave
e
E2
oa
E3 E8 84 Flor
e
47 e
Ave
•some changes:
Av
E3 N Claib
Av
49 57
e
28 52 orne ida
Br
47 94
Av
Tul 28 52 49 57 N Galve orne Ave
to extend Phase II outreach in partnership with Ride New Orleans. During April and May 2020, RIDE hosted a series of digital
Mid-City
Ave 47
llton
Jeffers 94
St
Tul
rice
an
61
ne
St. Claud z St Ave
N
on H
St
rice
e Av an
ne
St. Claud
• Some bus routes change to
e
wy e Ave 27
or
e Av
Some bus routes change to
rro
88
ro
e
e 51 e Ave
or
Xavier
St. Mau
Blvd 88
ro
aib
51
on
49Citrus Blvd Xavier e 91
St. Mau
Ca
t St
aib
Citrus St. Clau
on
49
M
Busesto jobsand streetcars come at the
University St. Clau
Cl
39 de Ave 61
S
M
E2 University Ca
Cl
32
Mazan
Airline Dr 39 80 de Ave
5 90
N
na 5 84
N
Ochsner l St
E3 27 202 E3 E8 Ochsner Earhart Expy
27 48
Ave
Medical Center 202 N Claib
Edwards
E3
e
Medical Center
Edwards
Nunez
Av
28 52 49 57 orne
bring more people to jobs
28 2 W Tul 47 94 Nunez
bring
Somemore people
Community Ave W
32 28 Judge ane Av
St
2
rice
ne
St. Claud Community
32
e
Jud
90
• bus routes change to
e
d Av
e
College e Ave
or
90 ge
Elmwood 88
ro
XavierPerez
d Av
e 51 College
St. Mau
Elmwood
Blvd Pe
aib
on
101 108 49
Ave
Citrus St. Clau rez
St
oa
St. Bernard Dr 101
Ave
108
M
St
10 University
Cl
oa
St. Bernard Dr
as
39Parish Hospital 10 de Ave
S Br
as
39 5
S Br
N
id
Parish Hospital
same times every hour, so timetables
Ma 39
id
town hall events with project team members which highlighted the key elements of the Service Concepts for different
on
Ochsner Ma
E3
on
rtin
90 27
and other destinations.
Le
90 202 rtin
and other destinations.
Le
Medical Center
Edwards
Lu Lu
the Nunez
Sr
bring more people to jobs
108 N the W
r Kin
32 Pete 28 2 108 N Jud S Community
Chalmette
Was
e
Kin Pe
ChalmettePerez Dr
Was
g Jr 90 ge
d Av
rs ters College
Elmwood
g Jr
SC
Carrollton
hin
St
SC
Hue
Blv
Carrollton
hin
101 St
Ave
Hue
W10 Blv 108
St
oa
d St. Bernard
gt
laib
W10 10 d
gt
y
laib
as
on
S Br
101 Parish Hospital
y
P.
rn 39
on
• Buses and streetcars come
id
102 101
P.
eA rn
o
• Buses and destinations.
streetcars come
Ma
Lo
Av
Tulane
on
v16
102
Harahan
eA
o
Lo
Av
Tulane
v16
rtin
Harahan
ng
90
e
and other are easier to remember.
Le
12 University e
ng
Pontchartrain Expy
e
Ge 12 University e Lu
Br
91 ne the Pontchartrain Expy Ge
Br
Pace Blvd
S
id
115 114 ral 91 115 108 ne N
Pace Blvd
id
r Kin
ge
94 W2 Me 114 ral Pe
Chalmette
Was
ge
Loyola yer
Loyola
94 g Jr W2 Me
yer
ters
SC
e Av
Carrollton
hin
St
neighborhoods in Orleans and Jefferson parishes.
e Blv
Hue
University Av e Av
15 University
at the same times every
32 la W10 Av d e
gt
15
laib
12
at the same times every
yo 32 la
y
12
on
Lo yo 101
P.
102 rn
• Buses and streetcars come
Lo 102 102
St
eA
o
Lo
Av
Tulane
v16
Harahan
St
Lou
St. 108
ng
Holiday Dr
ay
Gretna
Lou
108
e
12 St.
University e
Holiday Dr
Ch
AlgiersLoyola
ay
Gretna
114 Pontchartrain Expy
Napoleon Ave
Brid Ge
dw
Ch
Algiers
Br
114
isia
Garden
Napoleon Ave
ar l Brid
T
dw
ge 91 ne
isia
Garden
ar l
Pace Blvd
es
T
id
City ge 115 114 ral
oa
Av es
ge
City 94 W2
na
oa
Ave e 114 Av Me
na
Br
101 Ave e yer
hour, so timetables are
114
Br
District 91
Ave
101
hour,
at theso timetables are
e Av
District
Ave
University Av 91 e
15
same times every
27 32MacArthur Blvd la
M ag
115 108 27
Lo
yo 12 115 108
MacArthur B
102 lvd
azine M ag
St
St St azine S
Lou
ulas St 108
T
Holiday Dr
ay
GretnaT
115 Stt. C 102
ulas
Algiers
pito 114 102
Napoleon Ave
11 Brid Ge ha 115
dw
pito
Westwego
isia
Garden
u
Tcho ge ne 11rle T Ge
WestwegoAve
Stum
u
easier to remember.
City s Tcho ne
st Dr
oa
Stum
ral Av
easier to timetables
remember.are
114
Woodland Dr
108
na
st Dr
114 ral
Woodland Dr
De e 114 108
Br
101
hour, so
De
pf
District 91
Ave
Ga
Ea
10
pf
Ga
Ea
10
Blvd
ull
a St
Berkley Dr
Blvd
MacArull
a St
e Dr 27 115 theur B Berkley Dr
108 Dr lvd
ian
M ag 115
ian
101 azine 115
en
St
Louis
St 101
en
ulas
Louis
T 102
Gard
• Some JET buses run later
W3 pito
115
Gard
Ge
• Some
easierJET buses run later
114 11 W3
WestwegoW8
u
W1 Tcho ne 114
Figure 2G: Phase II engagement strategies and metrics
Stum
W8
to remember.
st Dr
W1 py 114 ral
Woodland Dr
108
ndale
py
k Ex De
ndale
k Ex
pf
Terrytown
Ga
Legend
Ea
an 10
Terrytown
Legend
an
Blvd
ull
a St
stb Berkley Dr
Avo
stb e Dr
Avo
We Tu We Tu
ian
llis 115
at night, like RTA buses do
101 llis
Terry Pkwy
en
at night, like RTArun
buses do
Dr
Louis
Terry Pkwy
Dr
Gard
• Some JET buses later
115 W3 W8 114
W1 115
W1 W1 py
ndale
Wes
tban Wes k Ex
Terrytown
Legend
tban
Harvey
k Exp an
W2
Harvey
y k Exp stb
Avo
W2
now.
y
now.
We Tu
T
Ma
llis
T
at night, like RTA buses do
W10
Ma
Terry Pkwy
0 - 15 Minutes
W10 Dr
0 - 15 Minutes
nh
West Jefferson
1
nh
West Jefferson
Behrman Ave
1
att
now. buses willSome JET buses run later at night,
Medical Center 115
Behrman Ave
att
Medical Center
an
W1
an
Blv
Wes
Blv
tban
• More buses will be on time,
Lap
Harvey
• More be on time,
d
alco Lap k Exp
d
Blvd alco y W2
Blvd
T
Ma
W3
16 - 25 Minutes
W10
0Marrero
-- 15
25Minutes
W3
16 Minutes
nh
West Jefferson
1 11
Behrman Ave
att
Medical Center
an
Marrero
but some bus routes come but some like
buswill
routes RTA
time, buses do now.
be oncome
Blv
• More buses
Lap
d
During Phase II, the project team used several
Lapa alco
lco Blvd W8 Blvd Lapa
lco Blvd W8
26 - 35 Minutes
W3
1 16 - 25
26 35 Minutes
W3
11
W3
Barataria Blvd
less often.
Barataria Blvd
less
but often.
Ames Blvd
Ames Blvd
Marrero
Lapa
lco Blvd W8 some bus routes come
1 36+ Minutes 11 26 -Minutes
36+ 35 Minutes W3
Barataria Blvd
less often.
Ames Blvd
W1 W1
Concept A: Coverage + Consistency
T Transfer Facility T1 36+ Minutes
Transfer Facility
methods of in-person and online strategies.
W1
End of Route T End of Route
Transfer Facility *Note: These are concepts only, *Note: These are concepts only,
One Way Route One Way
End of Route
Route and not service proposals. ¯ ¯ and notThese
*Note: service proposals.
are concepts only,
One Way Route
¯ and not service proposals.
FREQUENCY +
Figure 2I: Concept
Concept B: Ridership + Frequency:B – Ridership
Service
ConceptFrequency + Frequency
B: Ridership + Frequency: Service Frequency
FREQUENCY +
Pa
Pa
ris
ris
Rd
Rd
Weekdays 9:00 AM - 3:00 PM Weekdays 9:00 AM - 3:00 PM
Concept B: Ridership + Frequency: Service Frequency
FREQUENCY +
6 372
Pa
RIDERSHIP
ris
RIDERSHIP
Rd
Little Woods Little Woods
Weekdays 9:00 AM - 3:00 PM
RIDERSHIP
60 64 60 64
Paris Rd
Paris Rd
Mo
rriso
n Rd
Mo
rriso
n Rd
Little Woods
60 64
Paris Rd
n Rd
Bu
66
Cro
Bu
rriso 66
Cro
lla
W. Loyola Dr
67
lla
W. Loyola Dr
67
rd
wd
Mo
rd
wd
Public Meetings Survey Participants
62
Av
E. Loyola Dr
62
er Blv
Av
E. Loyola Dr
er Blv
e
60
e
60
d
on Dr
d
Dr
n C. Sim 10 Simon 10
Leo n C.
Bu
University of 66
Cro
Many bus routes change in this
Leo
Rd
University of
Rd
lla
t Blvd
W. Loyola Dr
New Orleans 67
Williams Blvd
ly
Lake Fores New Orleans t Blvd
rd
wd
Williams Blvd
ly
til
Lake Fores
Dow
62
til
Gen
Av
Dow
E. Loyola Dr
New Orleans
er Blv
Gen
New Orleans
e
East Hospital East 60
ld
nma
Hospital
ld
nma
Lakeview
O
SUNO 64
New Orleans
Lakeview
O
SUNO
d
64
on Dr
New
10 Orleans
n Rd
n Rd
C. Sim
201
East
n
East
W. Esplanade Ave 201
Franklin Ave
Leo
62 University of
St. Anthony Ave
W. Esplanade Ave
Franklin Ave
Rd
Con
62
St. Anthony Ave
t Blvd
Con
New Orleans
Williams Blvd
ly
Lake Fores
concept, and some routes with few
Paris Ave
til
Dow
gres
Paris Ave
55 90
Gen
Kenner vd
gres
55 90
New Orleans
W. Esplanade Ave
Kenner Robert E. Le e Bl Robert E. Le e Bl
vd East Hospital
ld
Pontchartrain Blvd
nma
s Dr
W. Esplanade Ave ur Hwy
Pontchartrain Blvd
Lakeview
O
s Dr
SUNO 64
New Orleans
32nd St Hwy
Canal Blvd.
32nd St Chef Mente ur
Canal Blvd.
East Jefferson Chef Mente
n Rd
East Jefferson
52
East
General Hospital 201 57
W. Esplanade Ave General Hospital 66 67 52 57
Franklin Ave
67
Concept B has fewer routes
66
Press Dr
62
St. Anthony Ave
31st St
Concept B has fewer routes
Con
Press Dr
31st St
Gentilly Gentilly
Paris Ave
10
gres
55 90
Kenner 10 vd
riders are merged with other routes.
Fleur de Lis Dr
Robert E. Le e Bl
Metairie
Fleur de Lis Dr
Metairie
Veterans Blvd W. Esplanade Ave
Pontchartrain Blvd
s Dr
Veterans Blvd ur Hwy
32nd St Harrison Ave
Canal Blvd.
Memorial Harrison Ave Chef Mente
Veterans E1 Memorial
Veterans
East Jefferson
E1
General Hospital
90 52 57 66 67
than the system right now,
94 90
Concept B has fewer
rightroutes
80
Press Dr
than the system now,
31st St 94 80
Causeway Blvd
Causeway Blvd
St.
Gentilly
10
St.
10
Williams Blvd
Dillard
10
Williams Blvd
Berna
Dillard
Berna
Napoleon Ave. St
Fleur de Lis Dr
University
Napoleon Ave. Chickasaw
Metairie
Elysian Fields Ave
University St
Veterans Blvd Chickasaw
Elysian Fields Ave
10 Zachary 32 10 32
rd Ave
Taylor Dr Harrison Ave Taylor Dr
Zachary
rd Ave
Memorial
Veterans E1
18 21
610 90
but they have more service:
Louis Armstrong New Orleans
thanthey
the have
system right now,
610 94
but more service:
Louis Armstrong New Orleans 80
Causeway Blvd
International Airport
Canal Blvd
St.
International Airport 10
62
Canal Blvd
Williams Blvd
Dillard 62
Berna
E3 Napoleon Ave. Delgado E3 University St
Chickasaw
Elysian Fields Ave
Desaix Blvd Delgado Desaix Blvd
Community 10 ZacharyCommunity 32
rd Ave
201 66 Taylor Dr
St
Rd College
201 66
St
Rd College
ie
Louisa
ie
Louisa
T
r
Es
T Es610
•butMany
theybus
have more service:
tai
Louis Armstrong New Orleans 91
r
plan
tai
91
Me
plan
e
International Airport
Me
48
Canal Blvd
d Av
e
Airlin ad
48 62
• Many bus routes change
d Av
e Hwy Airlin e ad
routes change
e Hwy Av e
84 E3 80
e
E2
oa
27E2 47 Flor Delgado Av
Av
80
e
oa
e 84 Flor
ida 27 47 Desaix
Av
Br
N Galve Ave Community eBlvd ida
Br
llton
Jeffers N Galve
More bus routes come at least every
Ave
61 z St
N
llton
on H Jeffers
Mid-City 61 66
201
St
College z St
N
on H Rd
Mid-City
wy
rro
wy Ca ie
rro
Louisa
91 Ca
Ca
t St
T
na 91
Ca
t St
r
57 85 Es
91 nal St
tai
61 l St
S
E2 57 85
in this concept, and some
pl
61
Mazan
Airline Dr
S
Me
E2
in this bus
concept, and some
an
e
Mazan
Airline Dr
32 48
d Av
Airlin ad
• Many routes change
Earhart Expy e Hwy 48 48 32 e
Av
N ClaibExpy
Earhart
Ave
80
e
E2
oa
E3 84 Flor
e
27 47
Ave
Av
E3 e N Claib
Av
e
52 ida
Br
Tul 47 orne
94
Av
49 Tul 52 N Galve Ave
47 orne
llton
Jeffers an Ave 94
St
49
rice
84 61
ne
St. Claud z St
N
on H e Av an Ave
Mid-City
St
rice
ne
e Av St. Claud
e
wy e Ave
or
rro
15 minutes all day. These bus routes
ro
e 88
e
84 e Ave
or
Xavier Ca e
St. Mau
Blvd 88
ro
aib
routes with few riders are
on
91
Virtual Meetings Stakeholder Meetings,
49 Xavier
St. Mau
Ca
Blvd
t St
aib
routes with few riders are
Citrus na
on
49
M
University Citrus 57 85
Cl
38 l St
61
S
M
E2 University
in this concept, and some
Cl
38 38
Mazan
Airline Dr
N
38
N
Ochsner 32 Ochsner St. Clau
Earhart Expy 32 48 32
NSt.
Ave
Medical Center
Edwards
E3 Clau
e
Medical Center de Ave Claib
Edwards
Nunez
Av
84 Tul 52 de Ave
2 W
Jud an 47 94 Community 49 orne
Ave 84 W
Nunez
St
2
rice
ne
85 St. Claud
merged with other routes.
e Av Community
e
Jud
90 ge 85
merged withfew
other routes.
e
d Av
e
84College e Ave
or
90 ge
Elmwood
ro
XavierPerez e 88
d Av
College
St. Mau
Elmwood
Blvd Pe
aib
routes with riders are
on
49
Ave
108 rez
St
Citrus
oa
Dr
also run late-night and on weekends.
St. Bernard
Ave
108
M
St
10 University
Cl
oa
27 38 St. Bernard Dr
as
10
S Br
38
Parish Hospital27
as
S Br
N
id
Ma Parish Hospital
32
id
on
Ochsner Ma
on
rtin
90 St. Clau
Le
rtin
90
Community Meetings and
Le
Medical Center
Edwards
Lu de Ave
• More bus routes come
the Lu Nunez
Sr N84
• More buswith
routes come
108 N the W
r Kin Pe 2 108 Jud S Community
Chalmette
Was
85
merged other routes.
e
Kin Pe
ChalmettePerez Dr
Was
ters
g Jr 90 ge
d Av
ters College
Elmwood
g Jr
SC
Carrollton
hin
St
SC
Hue
Blv
Carrollton
hin
28 St
Ave
Hue
Blv 108
St
oa
d 28 St. Bernard
gt
laib
27 10 d
gt
y
laib
as
on
S Br
Parish Hospital
y
P.
rn
on
id
P.
eA 102 rn
o
Ma
Lo
Av
Tulane
on
v16
Harahan
eA 102
o
Lo
Av
Tulane
at least every 15 minutes
v16
rtin
Harahan
ng
90
e
Le
at least every 15 minutes
12 University e
ng
Ge
e
12 University e Lu Ge
Pop-Up Tabling Events
Br
ne
• More bus routes come
91 the
Br
ne
Pace Blvd
ral S
id
91 108 N
Pace Blvd
W2 114 ral
id
Me r Kin
ge
94 Pe
Chalmette
Was
W2 114 Me
ge
Loyola yer
Av Loyola
94 g Jr yer ters
SC
e Pontchartrain Expy
Carrollton
hin
e e Blv Av St
Hue
University
la
Av University Av 28 Pontchartrain Expy e
d
gt
laib
yo 12 la
y
12
on
all day. These bus routes
Lo 108 108 yo
P.
32 rn
all
at day.
leastThese
every bus routes
Lo 108 108
St
32 eA 102
o
Lo
Av
Tulane
Lou
v16
Harahan
St
St.
15 minutes
Lou
ng
Holiday Dr
ay
Gretna
e
Ch 12 St.
University e
Algiers
Holiday Dr
ay
Gretna
Ge
Napoleon Ave
Brid 114
isia
dw
Ch
Algiers
Br
Garden
Napoleon Ave
ar l ne
Brid
T 114
isia
dw
ge 91
Garden
ar l
Pace Blvd
es
T ral
id
City ge
oa
es W2 114
na
Av Me
ge
City 94
oa
Ave
na
e Av yer
Br
Ave Loyola e
Ave
Br
District 91
e Pontchartrain Expy Av
Ave
District
University 108 Av 91 e
also run late-night and on
108
also run late-night and on
27 MacArthur B la
lvd 27 yo 12 MacArthur B
all day. These bus routes
M ag Lo 108 108
32 lvd
More major bus routes go between
azine M ag
St
Lou
St St azine S
ulas t
T
Holiday Dr
ay
GretnaT
Stt. C
as S
pito
Algiers
Napoleon Ave
11 Brid Ge ha toul 114
isia
dw
Westwego Garden
u 11 upi T Ge
Woodland Dr
Tcho ge ne rle
WestwegoAve
Stum
Woodland Dr
City sA Tc o ne
st Dr
h
oa
Stum
ral
na
st Dr
De ve ral
weekends.
Br
De
weekends.
Ave
pf
District 91
Ga
Ea
pf
Ga
Ea
108
Blvd
also run late-night and on
ull
a St
Berkley Dr
Blvd
MacArull
a St
e Dr 27 theur B Berkley Dr
Dr lvd
ian
102 M ag
ian
azine 102
en
t
Louis
St
en
as S
New Orleans and Jefferson parishes.
Louis
toul T
Gard
W3 W8 114
Gard
11 upi W8 Ge 114
Westwego W3
Woodland Dr
Tcho
• More major bus routes go
ne
Stum
• More major bus routes go
st Dr
py ral
ndale
py
k Ex De
weekends.
ndale
k Ex
pf
Legend
Terrytown
Ga
Ea
an
Legend
Terrytown
an
Blvd
ull
a St
stb Berkley Dr
Avo
stb e Dr
Avo
We Tu We Tu
ian
llis 102
llis
Terry Pkwy
en
Dr
Louis
Terry Pkwy
between New Orleans and
Dr
Gard
between New Orleans
routesand
W3 W8 114
• More major bus go
py
ndale
Wes
tban Wes k Ex
Legend
W2
Terrytown
tban
Harvey
k Exp an
W2
HarveyWe
y k Exp stb
Avo
y Tu
T
Jefferson Parish.
Ma
llis
T
Jefferson Parish.
0 - New
15 Minutes
Ma
Terry Pkwy
0 - 15 Minutes
Dr
nh
West Jefferson
1
between Orleans and
nh
West Jefferson
1
Behrman Ave
att
Medical Center
Behrman Ave
att
Medical Center
an
an
Blv
Wes
Service Concepts
Blv
Lap tban
W2
Harvey
d
alco Lap k Exp
d
• There are changes to local
alco y
• There are changes to local
Blvd Blvd
T
Jefferson
16 -Parish.
Ma
25 Minutes 0Marrero
-- 15
25Minutes There are changes to local bus
W3
16 Minutes
W3
1
nh
West Jefferson
11
Behrman Ave
att
Medical Center
an
Marrero
Blv
bus service in New Orleans • bus service in New Orleans
Lap
d
alco
There are
26 -changes to local
Lapa Blvd Lapa
lco Blvd lco Blvd
35 Minutes 16 - 25
26 35 Minutes
W3
1 11
W8
service in New Orleans East and
W8
Barataria Blvd
Barataria Blvd
Ames Blvd
Ames Blvd
East and on the West Bank. East
bus and on in
service the West
New Bank.
Orleans
Marrero
During Phase II of New Links, the project team developed three distinct Service Concepts.
Lapa
lco Blvd
1 36+ Minutes 11 26 -Minutes
36+ 35 Minutes W8
Barataria Blvd
Ames Blvd
East and on the West Bank. on the Westbank.
Concept B: Ridership and Frequency
T Transfer Facility T1 36+ Minutes
Transfer Facility
End of Route T End of Route
Transfer Facility
*Note: These are concepts only, *Note: TheseOne
areWay
concepts
Route only,
The concepts were built to illustrate in practical terms what it would look like to design a transit network based on the priorities and not service proposals. and notThese
*Note: service proposals.
are concepts only,
One Way
End of Route
Route
¯ ¯
identified by the public during strategic planning and New Links Phase I3.
and not service proposals.
One Way Route
¯
ACCESS + ACCESS +
Concept C: Access + Speed: Service Concept
Frequency
C: Access + Speed: Service Frequency
Figure
Weekdays 9:00 2J: Concept C – Access + Speed
Pa
Pa
ris
ris
Rd
Rd
Weekdays 9:00 AM - 3:00 PM AM - 3:00 PM
ACCESS +
Concept C: Access + Speed: Service Frequency
SPEED
Pa
Each concept was built around a different core set of priorities and required different trade-offs: SPEED
ris
Rd
Little Woods Little Woods
Weekdays 9:00 AM - 3:00 PM
SPEED
61 61
Paris Rd
Paris Rd
Mo
rriso
n Rd
Mo
rriso
n Rd
Little Woods
61
Bu
Paris Rd
Bu
lla
lla
n Rd
rd
67
• In Concept A (the “Coverage and Consistency” concept), the existing network was tweaked to make it easier-to-use,
rd
67
Cro
rriso
Av
61
Cro
W. Loyola Dr
Av
61
W. Loyola Dr
e
wd
Mo
e
wd
60
E. Loyola Dr
60
er Blv
Concept C is very different, to make longer trips faster:
E. Loyola Dr
er Blv
60 60
d
Dr
d
Bu
Simon Dr
Concept C is very different,
10 Simon
Concept C is very different,
62
lla
n C. n C. 62 10
rd
University of Leo Leo 67
Rd
Cro
300 University of
Av
Rd
t Blvd 61
W. Loyola Dr
New Orleans 67 300
Williams Blvd
ly
t Blvd 67
Lake Fores New Orleans
e
Williams Blvd
ly
til
wd
Lake Fores
Dow
til
Gen
60
Dow
E. Loyola Dr
Gen
New Orleans
er Blv
360 New Orleans
60
ld
nma
East Hospital 360
LakeviewNew Orleans East
consistent, and reliable while preserving most existing coverage. Concept A was the most similar to the existing RTA and
ld
nma
Lakeview
O
SUNO 64 East Hospital
New Orleans East
O
SUNO 64
d
on Dr
n Rd
to make longer trips faster: Concept C is very different,
n Rd
to make longer trips faster:
201 n C. Sim 62 10
W. Esplanade Ave 201
Franklin Ave
University of Leo
St. Anthony Ave
W. Esplanade Ave
Franklin Ave
Rd
96
Con
300
St. Anthony Ave
t Blvd 96
Con
New Orleans 67
Williams Blvd
ly
360 Lake Fores
Paris Ave
til
Dow
gres
360
Paris Ave
90
Gen
Kenner vd
gres
90
Kenner Robert E. Le e Bl vd New Orleans
Robert E. Le e Bl 360
New express bus routes run during
W. Esplanade Ave
ld
Pontchartrain Blvd
nma
s Dr
East Hospital
New Orleans East
W. Esplanade Ave
Pontchartrain Blvd
Lakeview
O
s Dr
32nd St SUNO 64
ur Hwy
Canal Blvd.
32nd St Hwy
Canal Blvd.
403 Chef Mente Menteur
n Rd
East Jefferson
•to make longerbus
trips faster:
General Hospital 52 55
East Jefferson57 403
55 Chef
201 W. Esplanade Ave General Hospital 52 57
Franklin Ave
Press Dr
St. Anthony Ave
31st St
• New express bus routes run
66 96
Con
JET system. To make service more reliable, the project team assumed that bus timetables would be adjusted to allow buses
Press Dr
31st St
New express routes run
66
Gentilly 360
Gentilly
Paris Ave
10
gres
90
Kenner 10 vd
Fleur de Lis Dr
Robert E. Le e Bl
Metairie
Fleur de Lis Dr
Metairie
Veterans Blvd W. Esplanade Ave
Pontchartrain Blvd
300
s Dr
Veterans Blvd 300
32nd St Harrison Ave ur Hwy
Canal Blvd.
the day. runThey make only a few stops
Memorial Harrison Ave
Veterans E1 Memorial
Veterans East Jefferson
E1 Hospital 403
55 Chef Mente
during the day. They make
96 52 57
during the day. They make
General
90 90 96
Press Dr
31st St
•New express bus routes
66
Causeway Blvd
Causeway Blvd
St.
Gentilly
10
St.
10
Williams Blvd
Dillard
10
Williams Blvd
Berna
300 Dillard
Berna
Napoleon Ave. 300 St
Fleur de Lis Dr
University
Napoleon Ave. Chickasaw
Metairie
Elysian Fields Ave
University St
Veterans Blvd 62 Chickasaw
Elysian Fields Ave
10 62 300
to run more slowly in traffic. This would make service more reliable but at the cost of bus service being slower and less
Zachary 10
rd Ave
Taylor Dr Harrison
only a few stops and travel
Ave Taylor Dr
Zachary
rd Ave
Memorial
only a few
thestops and travel
Veterans E1
during day.and
They travel fast to get people across
make
403
Louis Armstrong New Orleans Louis Armstrong New Orleans 610 300 403 64 610 300
90 64 96
Causeway Blvd
International Airport
Canal Blvd
St.
International Airport 10
Canal Blvd
Williams Blvd
310 Dillard
Berna
Napoleon Ave. Delgado 300 310 University St
Chickasaw
Elysian Fields Ave
Desaix Blvd
fast, to get people across
Delgado Desaix Blvd 62
fast,
only to get stops
people across
Community 10
94 ZacharyCommunity
rd Ave
Taylor Dr
a few and travel
St
Rd College
94
St
Rd College
ie
Louisa
ie
Louisa
403
T 64
r
Es
T Es610
tai
Louis Armstrong New Orleans 91
r
town quickly.
plan 300
tai
91
Me
plan
e
International Airport
frequent resulting in longer trip times.
Me
48
Canal Blvd
d Av
e
Airlin ad
48
d Av
e Hwy Airlin ad
town quickly.
e e
e Hwy 80310
town quickly.
Av e e
E2 80
oa
27E2 47 Av 84 Flor Delgado Av
oa
e Av 84 Flor
ida 27 47 Desaix
fast, to get people across
Br
on N Galve Ave Community eBlvd ida
Br
Jeffers llt on N Galve Ave
61 z St
N
on H Jeffers llt College
Mid-City 61 94
St
z St
N
on H rro Rd
Mid-City
wy wy rro
Ca 84 ie
Louisa
Ca 91 Ca
S 84
t St
T
na S Ca 91
t St
r
Es
tai
E2 61 l St
E2 85 61 91 nal St pl
Mazan
Airline Dr
• Some bus routes stop every
90
Me
an
e
Mazan
Airline Dr
• Some bus routes stop every
90 48
d Av
Airlin
Earhart Expy e Hwy 48
ad 85
e
town quickly.
e e
Av 48 80
Av
e
Earhart Expy Av
Ave
E2
oa
E3 84
Av
N Claib 27 47 Flor
Ave
E3 e N Claib ida
52
ne
Br
Tul 47 96 orne on
52 N Galve Ave
ne
Jeffers Ave Tulllt 47 96 orne
St
or
rice
an
61 St. Claud z St
N
on H Ave
Mid-City
St
or
rice
e Av
49 rroane St. Claud
aib
e
wy e Ave
88 49
ro
aib
e
e Ca CaAve e Ave
Xavier 84
St. Mau
Blvd 88
ro
Cl
on
88 Xavier 91
St. Mau
Blvd S
t St
4-6 blocks, instead of 1-3
Citrus
Cl
on
na 88
• 4-6 blocks, insteadstopof 1-3
M
University Citrus
N
38 61
M
l St
Some bus routes stop every 4-6 blocks,
E2 University
N
38 38
Mazan
Airline Dr
Some bus routes every
90 38 90 85
Ochsner St. Clau 90 48
e
Ochsner Earhart Expy St. Clau
Av
Ave
Medical Center de Ave
Edwards
402 E3 Medical Center N Claib de
Edwards
Nunez
52
ne
402 W Tul 47 96 orneAve Nunez
2
e
Jud Community Ave W
St
249
or
rice
an
d Av
e
St. Claud Jud Community
• In Concept B (the “Ridership and Frequency” concept), the New Links team considered larger changes to the existing
d Av
e Av
90 ge
blocks. They will travel
aib
e
College e Ave
90 ge
Elmwood
blocks. Theyinstead
will travel
88
ro
XavierPerez e College
St. Mau
Elmwood
Blvd Pe
oa
Cl
on
88
oa
4-6 blocks, of 1-3
Ave
rez
St
Citrus St. Bernard Dr
S Br
Ave
M
St
10 University
N
27 38 St. Bernard Dr
S Br
as
38
Parish Hospital27 10
as
id
Parish Hospital
Ma 90
id
on
instead
travel willof 1-3 blocks. They will travel
Ochsner Ma
on
rtin St. Clau
90
Le
rtin
90
Le
Medical Center de Ave
Edwards
Lu 402 Lu
the Nunez
Sr
faster, but some people will
N the W
Carrollton 2
e
S
faster,
blocks.but some people
r Kin Pe N Jud Community
Carrollton Chalmette
Was
d Av
Kin Pe
ChalmettePerez Dr
Was
ters
90 ge
They will
g Jr ters College
Elmwood
g Jr
SC
hin
St
SC
oa
Hue
Blv
hin
101 St
Ave
Hue
Blv
St
d St. Bernard
gt
101
S Br
laib
28 27 10 d
gt
y
laib
as
on
28 Parish Hospital
y
P.
rn
on
id
P.
eA rn
o
Ma
Lo
Av
network, redesigning it to increase ridership and create more frequent, all-day service by reallocating resources to the
on
Harahan
eA
o
Lo
Av
rtin
Harahan
ng
ve
90
e
have to walk farther to get
Le
12 16
ng
Pontchartrain Expy ve
e
have tobut
walk farther
faster, to get but some people will have to
Tulane Ge 12 Lu
16
Br
91 ne Tulane the Pontchartrain Expy Ge
Br
Pace Blvd
University S
faster, some people will
id
ral 91 ne N
Carrollton
Pace Blvd
W2 114 University
id
r Kin
ge
96 Me ral Pe
Chalmette
Was
e W2 114
ge
Loyola la
Av yer
Loyola
96 g Jr Ave Me
yer
ters
SC
Av
hin
yo la St
Hue
University e yo Blvd 101 Av
315 Lo University e
gt
laib
12 315 Lo
28 12
y
on
310
P.
310 rn
to the bus.
St
eA
o
to thetobus.
Lo
Av
Harahan
St
St.
ng
Holiday Dr
ve
ay
Gretna
e
have walk farther to get
12 St.
Ch 114 16
Algiers
Holiday Dr
ay
Gretna
Pontchartrain Expy
Napoleon Ave
Lou
Brid Tulane Ge
dw
Ch 114
Algiers
Br
Garden
Napoleon Ave
Lou
ar l Brid
T
dw
ge 91 ne
Garden
ar l
Pace Blvd
es University
T
id
City ge ral
bus. bus routes farther to get to the bus.
walk
oa
isia
Av es W2 114
ge
City 96
oa
102 e Me
isia
Ave e Av
Br
Ave Av yer 102
highest-performing routes. Concept B had fewer bus lines than the existing system but better quality service on those lines.
Loyola e
Br
na
District 91
108 la
na
315 Av
District
315 University yo 91 108 e
Ave
315
• Many local bus routes
Lo
Ave
MacArthur B
12
• Many
to thelocal
90 M ag 310 90 Mag lvd
MacArthur B
lvd
azine
St
St St azine S
ulas t
T
Holiday Dr
ay
GretnaT
Stt. C
as S 114
pito
Algiers
Napoleon Ave
Lou
11 Brid Ge ha toul
dw
Westwego Garden
u 11 upi T Ge
Woodland Dr
Tcho ge ne rle
WestwegoAve
Stum
Woodland Dr
City sA Tc o ne
st Dr
h
oa
Stum
isia
ral
st Dr
De ve ral 102
Br
connect riders to “hubs”
De
na
pf
District 91
Ga 108
• connect riders
bustoroutes
“hubs”
Ea
pf
315 Ga
Ea
Blvd
ull
a St
Berkley Dr
Ave
Many local
Blvd
MacArull
a St
e Dr theur B Berkley Dr
90 Dr lvd
ian
M ag
ian
azine
en
t
In Concept B, a significant number of bus lines would be eliminated to improve the quality of service on core, high-ridership Legend
Louis
St
en
108 as S
Louis
toul T 108
Gard
Gard
11 upi Ge
Westwego
Woodland Dr
Tcho ne
Stum
py
where they can transfer to
st Dr
Legend Many local bus routes connect riders
py ral
where they cantotransfer
“hubs”to
k Ex
ndale
k Ex De
ndale
connect riders
an
pf
Terrytown
Ga
Ea
stb an
Terrytown
Blvd
ull
a St
stb Berkley Dr
Avo
We e Dr
Avo
Tu We
Tu
ian
llis llis
Terry Pkwy
en
Dr
Louis
Terry Pkwy
Dr 108
Gard
express routes for the rest express routes for the rest
Legend
py
where they can transfer to
k Ex
ndale
Wes Wes
to “hubs”
inrest where they can transfer to
tban an
services. Concept B assumed that on high-frequency lines, bus stops might be spaced up to a quarter mile apart.
Terrytown
0 - 15 Minutes
W2 tban
Harvey
k Exp stb
0 - 15 Minutes
W2
Harvey
y k Exp
1
Avo
310 y We
1
310 Tu
T
Ma
llis
T
of their trip. Hubs are in
Ma
Terry Pkwy
of their trip. Hubs
forare
Dr
nh
West Jefferson
nh
West Jefferson
express routes the
Behrman Ave
att
Medical Center
Behrman Ave
att
Medical Center
an
an
Blv
Wes
16 - 25 Minutes
Blv
tban
16
0 -- 15
25Minutes
Minutes
Lap W2
Harvey
d
1
alco Lap k Exp
d
11
express
are in routes for the rest of their trip.
alco y
downtown, New Orleans
Blvd 310
downtown,
of their trip.New Orleans
Blvd
T
Ma
Hubs
W3 W3
nh
West Jefferson
Behrman Ave
att
Medical Center
an
Marrero
26 - 35 Minutes 26 35 Minutes
Marrero
Blv
1 11 16 - 25 East, Algiers, Metairie, the
Lap
East, Algiers,New Metairie, the
d
Lapa alco
downtown, Orleans
lco Blvd Blvd Lapa
lco Blvd
Hubs are in Downtown, New Orleans
W8 W3
• In Concept C (the “Access and Speed” concept), the project team took a “blank slate” approach to redesigning service
W8
Barataria Blvd
Barataria Blvd
Ames Blvd
Ames Blvd
1 36+ Minutes 11 36+
26 -Minutes
35 Minutes
Marrero
Lower 9th Ward, Gretna, Lower 9th Ward, Gretna,
Lapa
lco Blvd
East, Algiers, Metairie, the
East, Algiers, Metairie, the Lower
W8
Barataria Blvd
Express (30 Minutes) Express (30 Minutes) Kenner, Elmwood, and other Kenner, Elmwood, and other
Ames Blvd
W4
1 11 36+ Minutes
W4
Lower 9th Ward, Gretna,
with the goal of improving the speed of regional trips between different areas of Orleans and Jefferson parishes. Concept C T Transfer Facility T1 Transfer
Express Facility
(30 Minutes)
W4
places. places.
Kenner, Elmwood, 9thand Ward,other Gretna, Kenner, Elmwood,
Concept C: Access + Speed
End of Route End of Route
T Transfer Facility *Note: These are concepts only, *Note:places.
introduced commuter express services which would create faster connections between key job markets in Orleans and One Way Route One
End Way Route
of Route ¯ and not service proposals. ¯ and
These are concepts only,
notThese
*Note: service are
and
proposals. other
concepts only,
places.
Jefferson. In Concept C, more riders would be required to transfer than in Concepts A and B to connect to the new
One Way Route
¯ and not service proposals.
express services.
3 Refer to the New Links Service Concepts Overview report for detailed maps and descriptions of the three Concepts.
20 Final Recommended Network 2 | Summary of Public Engagement 21You can also read