Are Shelters in Place?: Mapping the Distribution of Transit Amenities via a Bus-Stop Census of San Francisco - eScholarship
←
→
Page content transcription
If your browser does not render page correctly, please read the page content below
Are Shelters in Place?: Mapping the Distribution of
Transit Amenities via a Bus-Stop Census of San Francisco

Austin Brown, Executive Director, Policy Institute for Energy, Environment, and the Economy, University of

Marcel E. Moran, Institute of Transportation Studies, University of California, Berkeley

July, 2021

Published in Journal of Public Transportation, Volume 23, Number 3
Are Shelters in Place?

      Mapping the Distribution of Transit Amenities via a Bus-Stop Census of San Francisco

                                               Abstract
Transit stops serve as crucial components of journeys for riders, but their condition is often left out of
equity considerations. Two important empirical questions are what stop amenities, such as places to sit,
clear signage, shelters for inclement weather, and unobstructed curbs are present, and how are they
distributed across systems, which may reveal neighborhood or route-specific disparities. San Francisco,
CA represents an ideal case for which to pursue this question, given it maintains a ‘transit first’ policy
directive that mandates public space prioritize transit over private automobiles. An in-person census of
2,964 street-level bus stops was conducted over three months, which finds that a majority of stops lack
both seating and shelter of any kind, that route signage varies widely in format and legibility, and that
roughly one third of all stops are obstructed by on-street parking, rendering them difficult to use and
exposing riders to oncoming traffic. Stops in the city’s northern half are more likely to feature seating,
shelter, and unobstructed curbs, whereas amenity “coldspots” nearly all lie within the city’s southern
half. Stop amenities also vary sharply by bus route, such that routes with the longest headways (and thus
waiting times) provide on average the least seating, shelter, and clear curbs. These three amenities –
seating, shelter, and unobstructed curbs – are also present to a greater degree in Census tracts with
higher shares of white residents. This census demonstrates that equity evaluations of transit must
include stop amenities, which are often overlooked, can undermine transit’s attractiveness, and even
compound long-standing imbalances in service quality for underserved communities. Furthermore,
studies of this kind can inform where amenity upgrades should be prioritized, targeting those areas
currently lacking in high-quality stops, and raising the minimum standard of stop amenities overall.
Finally, given data collected in this census is almost entirely unavailable to riders within current trip-
planning and wayfinding applications, this work raises the possibility of expanding transit-data
standards to include amenity details.

Keywords: Transit, Equity, Buses, GIS

                                                    1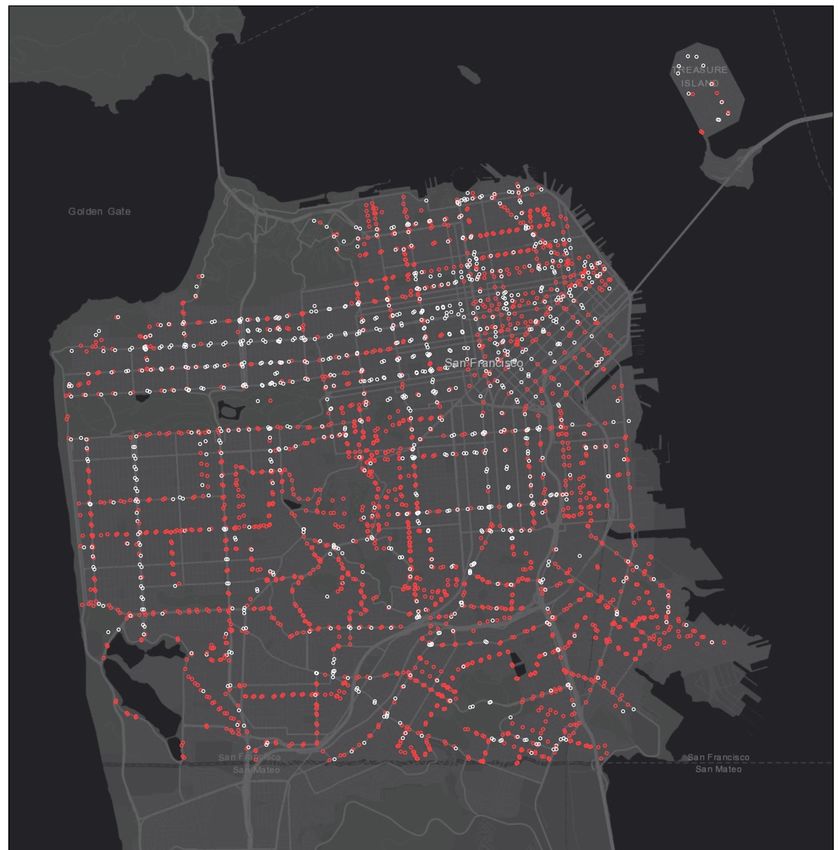
Journal of Public Transportation                                                                March, 2021

Introduction
Cities across the United States have set ambitious goals for increasing the share of trips which take place
on transit, such as Boston (over 40% by 2030) and Portland (25% by 2035) (“Go Boston 2030,” 2017;
“Transportation System Plan,” 2018). These targets relate to manifold objectives, including reducing
congestion, as well as improving air-quality and lowering carbon emissions. Indeed, transit not only
moves people more efficiently in terms of space on the road, but it also requires less energy per traveler
(Barrero et al., 2008; Lowe et al., 2009; Hodges, 2010). Regardless of these potential benefits, transit
ridership has been falling in nearly all U.S. cities over the last decade (Amin, 2018), and dropped
precipitously during the COVID-19 pandemic (Hart, 2020). For transit systems to reverse these long and
short-term trends, they must provide a level of service that competes with alternatives like personal
automobiles, bicycles, and walking, but also ridehailing (such as Uber and Lyft), and micromobility
(shared bikes and scooters). This is particularly relevant given a number of studies on emerging modes
indicate a shift away from transit (Graehler, Jr. et al., 2018; Schaller, 2018).

Transit’s attractiveness generally stems from the spatial extent of routes, their frequency, and fare
prices. However, features such as clear signage, places to sit, shelters to provide shade and protection
from inclement weather, ease in boarding and exiting vehicles (e.g. unobstructed curbs), and screens
providing real-time arrival estimates are also influential. Indeed, as Portland, Oregon’s TriMet agency
puts it, “the public’s first impression of TriMet and its services is the bus stop” (Baldwin et al., 2010).
Though, cursory use of many transit systems indicates that stop amenities are often inadequate (lack of
clear signage, seating, shelters, etc.) and inconsistently distributed (the number of amenities varies from
stop to stop). Indeed, U.S. media outlets have held contests for ‘sorriest bus stops’ and made calls for
‘worst bus stop signs,’ with entrants showing stops located perilously close to high-speed arteries,
framed in by concrete barriers, and lacking legible signage of any kind (Schmitt, 2018; Bliss, 2019).
Beyond poking fun at such facilities, these articles highlight a notable gap in the transit literature:
comprehensive analyses of stop amenities. Such data could shed light on a number of pertinent
questions, particularly: how have resources been divided among routes and neighborhoods in terms of
transit stops? Given the widespread goals of increasing transit ridership as well as improving the travel
experience for those already riding, the paucity of research on stop amenities stands out.

One approach to fill this gap is to conduct a census: in-person visits to each stop in a given transit system
in order to catalog the presence of seating, signage, curb obstructions, shelters, and other amenities.
San Francisco, CA operates a fixed-route transit system (managed by the San Francisco Municipal
Transportation Agency, or SFMTA) that includes buses, light-rail, cable cars, and street cars. San
Francisco is guided by a ‘Transit-First’ policy which stipulates that: “travel by public transit, by bicycle
and on foot must be an attractive alternative to travel by private automobile,” and that “decisions
regarding the use of limited public street and sidewalk space shall encourage the use of public rights of
way by pedestrians, bicyclists, and public transit” (“Transit-First Policy,” 2007). A census of San
Francisco’s bus stops is a direct way to evaluate if these directives are reflected in transit infrastructure.
The city also stands out generally due to its innovative transportation policies, including one of the
country’s first dynamic parking-pricing schemes (Pierce and Shoup, 2013), pilot programs for shared
bikes and scooters (Moran, 2021), a streamlined planning process for bicycle and bus lanes (Swan,

                                                      2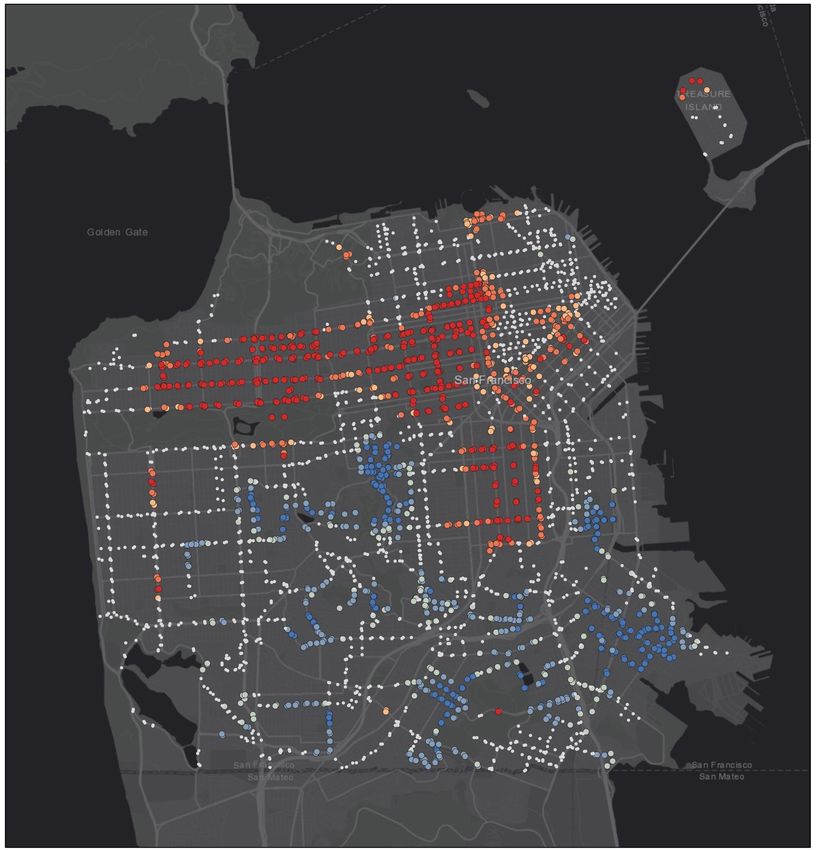
Journal of Public Transportation                                                               March, 2021

2019), and the banning of private automobiles from its main thoroughfare, Market Street (Fitzgerald
Rodriguez, 2020). Given leadership on these fronts, it is of interest if San Francisco provides adequate
bus-stop amenities, and if it does so consistently citywide.

This paper proceeds by reviewing academic studies of bus stops, including those which connect stop
amenities to rider experience and changes in travel behavior. It then details the methods of this census,
including which amenities were cataloged, and what other datasets (including route headways) were
ushered to put the findings into context. The results section covers the low levels of seating and shelter
present across bus stops citywide, the roughly one third of stops which are obstructed by on-street
parking, and how these relate to San Francisco’s geography and sociodemographics. Stop amenities are
analyzed by route and headway category, which display wide variation. Finally, the conclusion section
draws upon the findings of the census for policy recommendations for other transit systems grappling
with inadequate and inconsistent stop amenities.

Literature Review
Scholars have analyzed bus stops in a number of different ways: critiques of stop design and quality,
surveys of riders on stop preferences, testing of effects of stop amenities on ridership, and
investigations of how transit agencies make decisions regarding stop investment and prioritization. As to
the first category; there is evidence that the orientation of bus-shelter doors (either facing toward or
away from the roadway) influence pollution riders are exposed to (Moore et al., 2012), and that many
stops lack nearby crosswalks (Pulugurtha and Vanapalli, 2008; Hosford et al., 2020). Loukaitou-Sideris
(1999) closely observed a small number of bus stops in Los Angeles to determine if certain features lend
themselves to crime. Her study found that specific attributes likely do so, including bus shelters which
are closed in by walls to the degree that the view of the interior space from the street was blocked.
Corazza and Favaretto (2019) usher a great number of attributes about roughly 200 bus stops in a single
district of Rome (including trash cans, street lights, and bollards, among others), which serves in part as
inspiration this study.

As to surveys, the Federal Transit Administration sponsored a project that surveyed bus riders in four
cities on stop design, finding highest preference for those with pitched roofs, one side fully open to the
elements, and clear walls over opaque surfaces (Lusk, 2001). Another survey, based in the Twin-Cities
region of Minnesota found that respondents perceived waiting times were shorter if stops had benches
and shelters (Fan et al., 2016), and a subsequent study from the same area determined that adjacent
trees also decreased perceived waiting times (Lagune-Reutler et al., 2016). These complement research
which finds that providing real-time scheduling for arrivals can also make waiting less frustrating (Ferris
et al., 2010; Watkins et al., 2011; Woetzel et al., 2018), and even improve riders’ sense of safety
(Abenoza et al., 2018). In addition, rider surveys have suggested that perceptions of bus-stop comfort
can also factor into the decision to switch to a car (Han et al., 2018).

In addition to stated preferences, two studies have linked stop quality to rider behavior. In Salt Lake
City, researchers documented that the installation of seating, shelters, and sidewalks correlated with
increases in stop-level ridership and decreases in paratransit-service demand (Kim et al., 2018).

                                                     3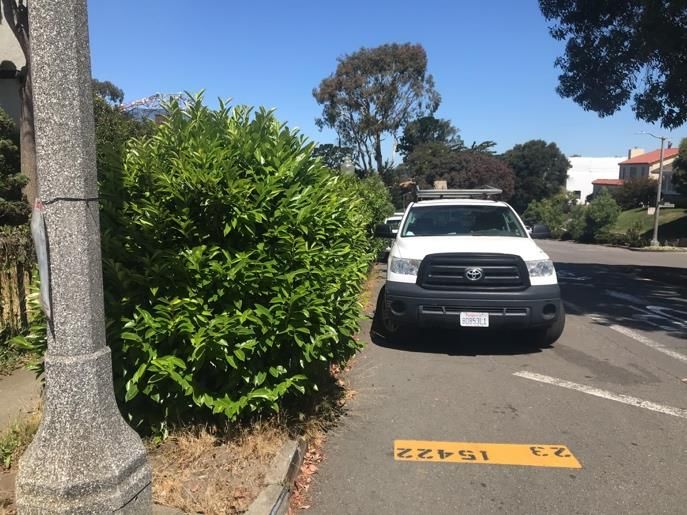
Journal of Public Transportation                                                               March, 2021

Likewise, bus stops in Chicago which had real-time arrival screens installed were associated with
increased ridership, when comparing routes which did and did not receive the new hardware (Tang and
Thakuriah, 2012).

It is important to consider how transit agencies make decisions regarding stop amenities. One report on
the topic concluded that “in most instances, the estimated number of passenger boardings has the
greatest influence” (Fitzpatrick et al., 1996). For example, the WMATA system’s “Guidelines: Design and
Placement of Transit Stops” calls for a bus shelter to be present based on stop-specific ridership – in this
case whether or not there are at least 50 boardings per day (2009). This logic is echoed by numerous
other agencies, including Rogue Valley Transportation District in Oregon (“Bus Stop Design & Planning
Guide,” 2011), OmniTrans in Southern California (Parsons and Gruen, 2013), and GCRTA in the
Cleveland, OH area (Feke et al., 2018). However, one obvious pitfall of this approach is that it can
become a self-fulfilling prophecy, in that low-amenity stops may actively deter ridership, which means
they will never qualify for upgrades. Second, this logic means that riders at more popular stops will
inherently be provided better facilities than those who live or commute to less-popular stations.

There is also evidence that factors beyond ridership drive the distribution of stop amenities. Indeed, the
Star Tribune in Minnesota compared bus boardings to stop amenities using publicly-released data
(Roper, 2014), and identified hundreds of stops lacking a shelter of any kind even though they qualified
for amenities given ridership benchmarks. At the same time, many other stops had shelters even though
ridership was far lower. Moreover, a study of bus stops in Los Angeles indicated that the primary
determinant of where shelters were present was the revenue-generating potential of shelter
advertisements (Law and Taylor, 2001). This finding has particular importance for San Francisco; SFMTA
at one point contracted out shelter construction to an advertising firm (Roth, 2009), an agreement
which left it up to the private vendor to not only upgrade existing shelters, but install new ones as well
(Gordon, 2007). Though, SFMTA’s press release announcing the contract noted that “SFMTA will have
approval over the construction schedule to ensure that priorities such as volume of passenger boardings
and distribution throughout the city are followed” indicating support for linking ridership and stop
investment.

Beyond these analyses, transit agencies, metropolitan planning organizations, design firms, and
nonprofits have also produced resources on how transit stops can be improved, and have examined
their own facilities. These measures emphasize stop siting, providing riders with a way to submit
feedback regarding maintenance issues, maximizing seating along crowded sidewalks, incorporating
lighting and heating, and modifying curbs with bus-stop bulbs (Robson and Piczenik, 2009; NACTO, 2016;
Farrington and Schwartz, 2017; Buchanan and Hovenkotter, 2018; Colosi et al., 2018). Beyond guidance,
a small number of transit agencies have released audits on their own bus stops, such as those focused
on accessibility (Finch, 2013; “Bus Stop Safety and Accessibility Study,” 2018; “Space Coast Area Transit,”
2018), or how amenities vary by which jurisdiction maintains them (“Metro Transit Bus Stop Amenities
Study,” 2018). In the Atlanta Region, several organizations have partnered for “Operation Bus Stop
Census,” which seeks to crowdsource information on stop quality across the MARTA system by releasing
a free smartphone application anyone can use to submit information (Clanton, 2020).

                                                     4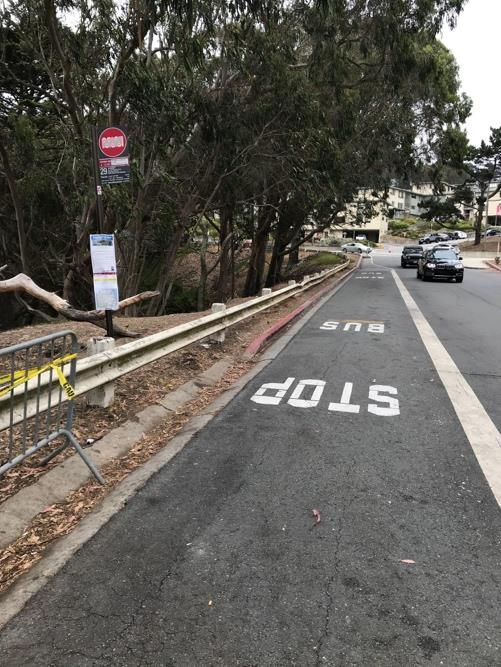
Journal of Public Transportation                                                              March, 2021

Outside of stops, there is also ample evidence that transit service is inequitably provided, both in terms
of mode and location. Golub and colleagues (2013) detail the history of transportation funding in
Northern California’s East Bay, which was biased in terms of suburban rail compared to urban buses, the
latter of which served a more-diverse and low-income population (see also Attoh, 2019). This pattern of
underinvestment in bus transit has been mirrored elsewhere, including Los Angeles, which involved a
successful legal fight over inadequate funding (Grengs, 2007). Along with spatial and modal disparities,
there are also specific populations who struggle with transit infrastructure generally and stops in
particular, such as people with vision impairments (Azenkot et al., 2011). As one study notes:

        One specific challenge for blind and low vision bus riders is locating and verifying bus stop
        locations, particularly in new or unfamiliar areas. They often search for physical landmarks such
        as the bus shelter, benches, or transit sign as a cue that they have reached the stop, but the
        design and location of the stop relative to the intersection are frequently quite variable.
        (Campbell, 2014)

People with other disabilities also consistently experience difficulty in navigating transit systems,
including stops (Wu et al., 2011), which can have significant consequences in terms of social exclusion
(Stanley et al., 2011; Aarhaug and Elvebakk, 2015).

While there demonstrably are differences in bus stop quality across space, and issues with specific
populations using them, a clear definition of equity is required regarding the distribution of bus-stop
amenities. One approach, in line with a utilitarian conception of equity (Di Ciommo and Shiftan, 2017),
would entail that the highest number of riders receive some amount of benefit (in the form of stop
amenities) given existing budget constraints. This might result in stop amenities being concentrated only
along the bus routes with high ridership, given it could maximize the number of riders using amenities.
Though, as noted above, the spatial distribution of ridership may be in part tied to the presence of these
very amenities, meaning that stop-investment patterns can themselves shape ridership.

In contrast, a conception of equity drawn from the work of Rawls (specifically his ‘difference principle’),
would favor distributing benefits such that those with the least resources receive a higher share than
those better off to begin with (Rawls, 1999; Martens, 2016; Pereira et al., 2017). In the context of bus
stops, this definition of equity would prioritize that amenities be present at stops in low-income and/or
minority neighborhoods, and not primarily determined by ridership alone. Third, the ‘social minimum’
principle, advanced by Waldron (1986) and others (Weithman, 1995), focuses on the minimum standard
of the distribution of goods. Applied here, that would entail that all stops in the system at least meet
some established criteria. For example, that each bus stop has legible route signage, a curb
unobstructed by parked automobiles, and at least seating for a single waiting rider.

Both of these latter approaches – priority for underserved neighborhoods, and bringing up stops to a
minimum standard– would benefit riders most in need (regardless of what part of the bus system they
use), and encourage more ridership. Of course, no transit agency has an unlimited budget, and so
decisions regarding system investment must always be made with fiscal constraints in mind. This relates
to both Rawls’ difference principle and the interest for a minimum standard across stops. Indeed, given
not every stop can be upgraded at once, these principles suggest that stop improvements should occur

                                                     5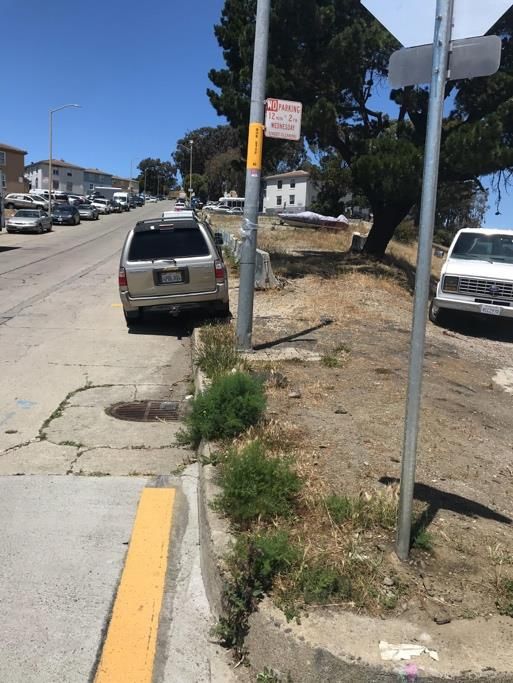
Journal of Public Transportation                                                                 March, 2021

first in the areas most in need, which would both raise more stops to a minimum standard, and in doing
so benefit the least well-off riders.

Overall, scholarship suggests that bus-stop amenities influence ridership, that a number of transit
agencies are mindful of the need to improve their stops, and that such improvements could benefit
riders who frequently face challenges with transit journeys. However, there are as of yet no
comprehensive stop censuses, or spatial analysis of such findings across an entire city. Thus, the
opportunity exists to conduct a bus-stop census, which can generate both locally-salient findings as to
the distribution of stop amenities, and also insights for agencies elsewhere about how such data relate
to equity goals.

Methods
The primary method of this census is in-person visits to every street-level bus stop in San Francisco
managed by SFMTA. This does not include the Bay Area Rapid Transit (BART) or Caltrain systems (which
are rail), nor does it include SFMTA stops for cable cars, street cars, or light-rail. However, this census
does include stops which are shared among SFMTA’s different modes for those which explicitly serve a
bus route. This census also excludes bus stops that exclusively serve other systems, such as SamTrans,
AC Transit, and Golden Gate Transit, which are centered in other counties.

Before this census began, attempts at obtaining detailed stop-amenity information from SFMTA were
made. This included queries within SFMTA’s website, and San Francisco’s open-data portal, as well as
email correspondence with SFMTA staff. These steps uncovered a single geospatial dataset which lists
the location of each bus stop, though it only includes one binary amenity attribute: the presence or
absence of a shelter. While this dataset is a useful starting point, it is reductive in terms of a stop’s full
condition, leaving out signage, seating, and curb status, among others. Likewise, SFMTA’s general transit
feed specification (GTFS) – which lists every stop system wide and is used by trip-planning applications –
contains no amenity information. Headways (i.e. frequency) by route were drawn from SFMTA’s system
map (dated “Winter/Spring 2019”), which predates COVID-related service cuts (Cassidy, 2020). For
buses, there are three headway categories: service every 10 minutes or less, service every 10-20
minutes, and service every 20-30 minutes.

This census took place over the months of May, June, and July 2020. Throughout the data-collection
process, SFMTA records (updated as of April, 2020) on the location of every bus stop were referenced in
order to ensure all were visited in person (outside of those within active-construction zones). The
presence of the following amenities was recorded at each stop:

            •   Route Signage (see Figure 1)
                    o Metal sign;
                    o Paint on a metal pole;
                    o Paint on a telephone pole;
                    o Paint on the pavement; and
                    o Marking on bus shelter;
            •   Shelter (e.g. roof of some kind);

                                                      6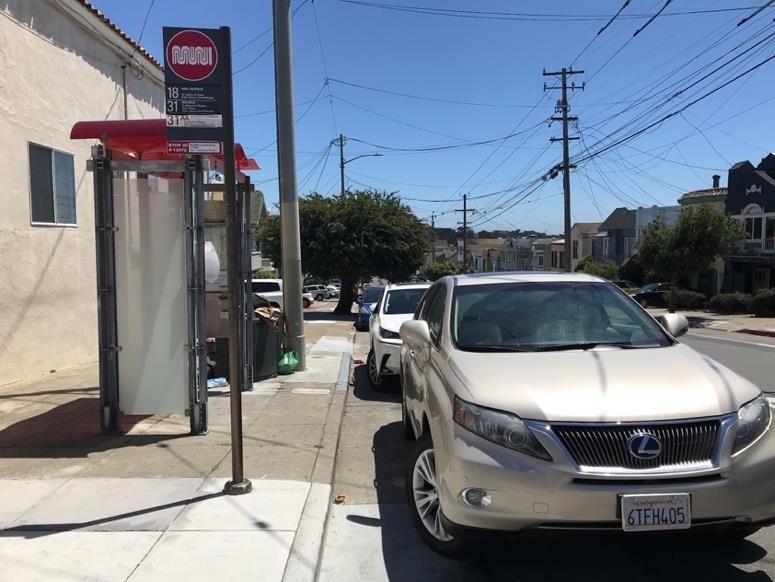
Journal of Public Transportation                                                             March, 2021

            •     Seating;
            • Electronic ETA Screen (and if present, if such screen is operating);
            • Stop ID for the NextBus system (generally via stickers);
            • Route/System Map; and
            • Unobstructed Curb (vs. those blocked by on-street parking)
A photograph of each bus stop was also taken. While determining if most amenities were present was
straightforward, evaluating the status of the curb requires more explanation. In San Francisco, curbs
running along bus stops are marked in a number of different ways, including with large stencil-painted
lettering which read “BUS STOP,” as well as by curbs painted the color red, or metal signs which read
“No Parking.” Thus, determining whether or not a specific bus stop was obstructed by parking was not
guided by the presence or absence of automobiles parked in front of it, but whether or not any of these
marking types (lettering, curb coloring, or specific no-parking signage) was present. If none of these
were visible (i.e. the curb was marked like any other) then it was cataloged as a parking-obstructed stop.
There were also other ways to confirm this, such as signs indicating when parking was allowed, or if
parking meters were present. In addition, route signage was only recorded as being present at stops if
markings (be they stickers, signs, or paint) were legible in person.

FIGURE 1. Route signage examples of bus stops in San Francisco, CA, including (clockwise from top left):
metal signs, paint on metal poles, shelter markings, paint on pavement, and paint on telephone poles

                                                    7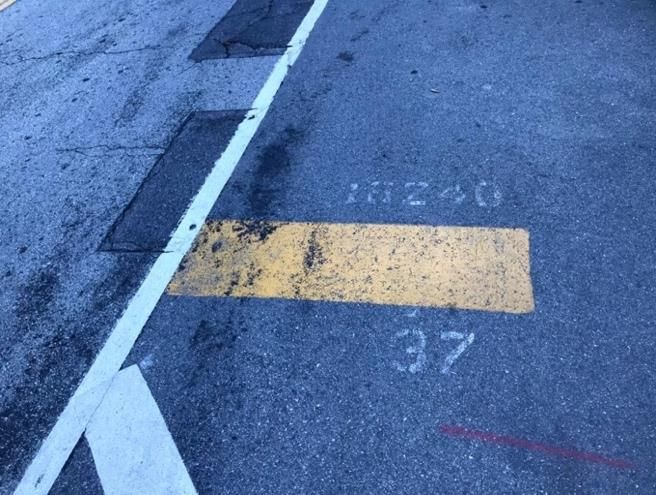
Journal of Public Transportation                                                               March, 2021

Beyond these specific amenities, in-person inspection of all bus stops allowed for more-qualitative
observations as well, including signage legibility, sidewalk quality, how obstructed curbs varied by
parking layout, and how different sidewalk designs influenced stop functionality.

Though a census of this kind could perhaps be conducted remotely, such as by employing “street view”
imagery from Google Maps or similar services, there are several advantages to the in-person method
undertaken here. First, street view varies in terms of image quality, and level of obstruction from
vehicles, which makes cataloging stop amenities difficult. Indeed, the resolution and angles of street
view rarely allow for detection of NextBus ID stickers, electronic ETA signs (and if they are functioning),
or pavement markings. Second, street view is not uniform in terms of timing across a city such as San
Francisco. While major streets are captured by street-view vehicles at least once a year, images from
less-central streets – many of which contain bus stops – can be several years old. Thus, an in-person
census conducted over a relatively short period of time ensures that data are not only accurate but also
temporally consistent.

Results
Between May and July, 2020, 2,964 SFMTA street-level bus stops were visited across San Francisco, with
all present amenities cataloged (see Figure 2). In terms of seating, 34% of stops included seating of some
kind, be it chairs or benches of varying materials and types. Similarly, 31% of stops featured shelters.
Legible route signage of some kind was present at 89% of stops, with paint on metal street poles as the
most common type (present at 41% of stops), followed by shelter markings (23%), paint on pavement
(19%), metal signs (18%), and paint on telephone poles (7%). There were 516 stops (19% of all stops)
which featured more than one type of legible route signage, such as both paint on the pavement and a
shelter marking. A NextBus ID was posted at 81% of all stops, which came in various formats, including
stickers, as a component of metal signs, paint on the pavement, and a few stops with hand-scrawled
numbers. Working electronic screens displaying ETA information were present at 21% of stops, and an
additional 2% of stops had ETA screens which were not functioning. Route maps were present at 30% of
stops, and almost always as a component of bus shelters.

                                                     8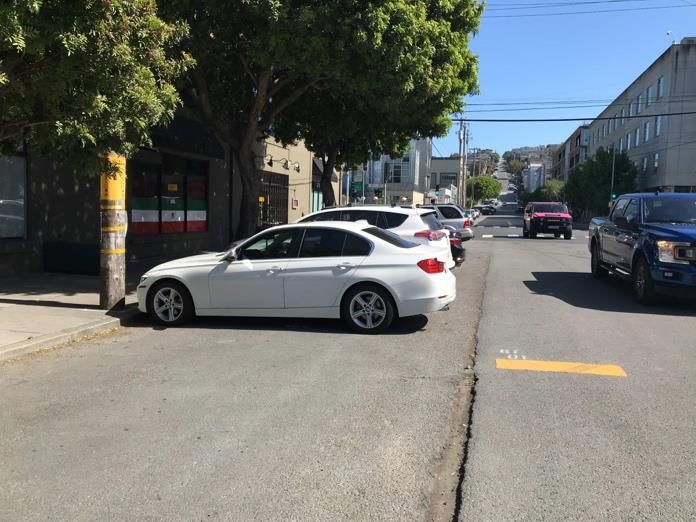
Journal of Public Transportation March, 2021
FIGURE 2. Bar chart of amenities across 2,964 SFMTA bus stops
100
90
80
70
60
Percent
50
40
30
20
10
0
Route NextBus ID Clear Curb Seating Shelter Route Map ETA Screen
Signage (Working)
Curbs were obstructed by on-street parking at 32% of stops, meaning there was not enough designated
curb space (often called a “dedicated bus zone”) for a bus to pull up, which forces riders to step into the
street to board, and often navigate through parked cars (see Figure 3).
FIGURE 3. Bus stops in San Francisco where on-street parking obstructs riders
from entering and exiting the bus, both at those with and without shelters
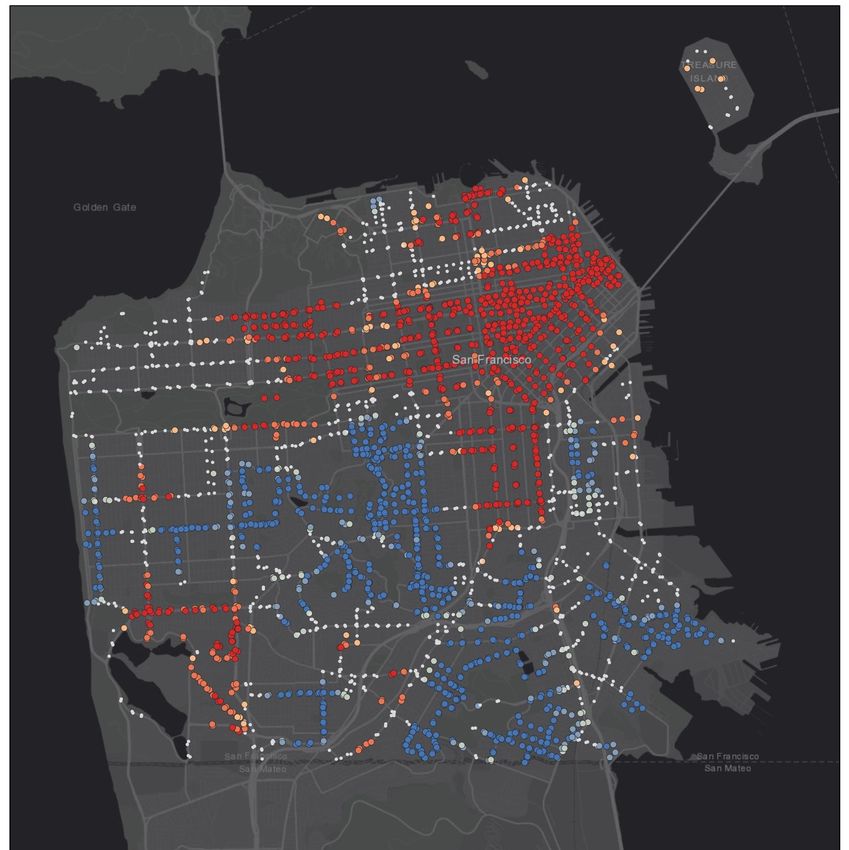
All bus stops visited during the census had their geographic locations recorded based on GPS
coordinates from ESRI’s Survey123 smartphone application run on an iPhone 7, which is generally
accurate within 10 meters of true positions, and allows for data exporting into spatial-analysis software
(Lamoureux and Fast, 2019; Merry and Bettinger, 2019). When limiting the analysis to seating, several
visible patterns emerge, including a higher share of stops featuring seating in the city’s northern half
(see Figure 4a). It is also evident that Bayview/Hunters Point, a historic African-American neighborhood
in the southeast corner of the city, contains very few stops with seating at all. Using the municipally-
9Journal of Public Transportation March, 2021
designated geographical center of San Francisco (Rubenstein, 2016), it is possible to quantify the
distribution of amenities by half. Indeed, among bus stops in the city’s northern half, 45% provide
seating, compared to just 22% in the southern half. That pattern is nearly identical for shelters: 42% of
stops in the northern half feature shelters, compared to 22% in the southern half. In comparison, the
differences in amenities between the eastern and western halves of the city are far smaller; seating is
provided at the same percentage of stops (34%), and shelter is provided at 32% of stops in the eastern
half versus 30% in the western half.
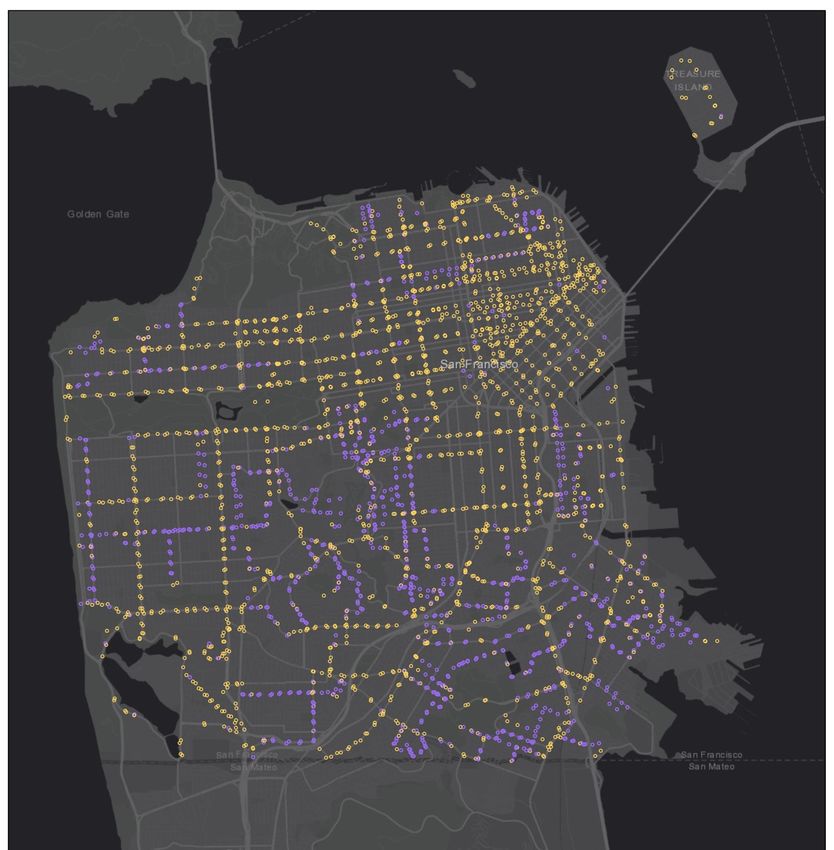
A “hotspot” analysis of these amenities further illustrates this high-level geographic pattern. The Getis-
Ord Gi* test detects where stops with similar values (in this case, those with or without a given amenity)
cluster together (Songchitruksa and Zeng, 2010). Applied to bus-stop data, clusters of stops providing
seating are primarily present in the city’s northern half, including its central-business district in the
northeast quadrant and residential neighborhoods running west. In comparison, seating “coldspots” –
clusters of stops lacking seating – nearly all lie in the city’s southern half (see Figure 5a).
Mapping bus stops by curb type (clear vs. obstructed) displays a similar picture, in that stops clear of on-
street parking are present to a far greater degree in the city’s northern half (80%) than its southern half
(53%) (see Figure 4b). Likewise, these differences were less pronounced in the eastern half vs. western
half comparison (68% of stops with clear curbs in the eastern half vs. 65% in the western half). The
Getis-Ord Gi* test similarly indicates that clear curbs hotspots sit almost entirely within the city’s
northern half, notwithstanding a small hotspot also present in the southwest quadrant within a large
private housing development (see Figure 5b). In addition, nearly every curb “coldspot” occurs within the
city’s southern half, including a broad portion of the southeast quadrant.
Beyond these north-south and east-west analyses, U.S. Census and bus-headway data were also
integrated into spatial analyses in order to consider how amenities vary by route frequency and race.
When broken down by Census tract (based on 2019 American Community Survey data), bus stops in
tracts with a higher than average share of white residents are more likely to feature seating (37%),
shelter (34%), and clear curbs (71%), than to those in tracts with a higher than average share of people
of color (31%), (29%), and (62%), respectively. Indeed, for every one percentage increase in a tract’s
white residents, the odds that a given bus stop features seating increases 0.9%, 0.8% for shelters, and
1% for clear curbs (estimated from a logistic regression). In contrast, this relationship was not evident in
terms of income; tracts household incomes both above and below the city’s median figure ($112,449 as
of 2019) were equivalent in terms of the likelihood stops feature seating, shelter, and unobstructed
curbs. Lastly, the effect of a Census tract’s density was different from both these of previous categories,
in that those with lower-than average densities had stops 11-12% less likely to feature seating and
shelter, but only 4% less likely to provide clear curbs.
Given the evidence of amenities following some corridor patterns from the spatial analyses (such as
consistent seating), each bus route comprising the SFMTA system was analyzed in terms of what
percentage of its stops include a given amenity. The provision of amenities varies significantly across
routes: seating ranges from 10% of stops on some routes to 75% on others, shelter likewise varies from
5% to 76%, clear curbs from 16% to 100%, route maps from 0% to 74%, functioning ETA screens from 0%
to 54%, route signage from 78% to 100%, and NextBus IDs from 66% to 100% (see Table 2, appendix).
10Journal of Public Transportation March, 2021
Figure 4a: Map of bus stops in San Francisco, shaded by the presence of seating
Presidio
Golden Gate Park
Bayview/Hunters
Point
Bayview/
Hunters Point
Lake Merced
11Journal of Public Transportation March, 2021
Figure 4b: Map of bus stops in San Francisco, shaded by the presence of curb status
Presidio
Presidio
GoldenGate
Golden GatePark
Park
Bayview/Hunters
Bayview/
Point
Hunters Point
Lake Merced
12Figure 5a: Hotspot and Coldspot analysis (Getis-Ord Gi*) for bus-stop seating
Presidio
Golden Gate Park
Bayview/Hunters
Bayview/
Point
Hunters Point
Lake Merced
13Journal of Public Transportation March, 2021
Figure 5b: Hotspot and Coldspot Analysis (Getis-Ord Gi*) for bus-stop curb status
Presidio
Golden Gate Park
Bayview/
Bayview/Hunters
Hunters Point
Point
Lake Merced
14When divided into three headway categories, routes with the most-frequent service (headways of 10
minutes or less) had the highest share of stops with seating (51%), shelters (51%), and clear curbs (88%).
Routes with the second-most frequent service (headways between 10 and 20 minutes) had a lower
percentage of stops with seating (40%), shelters (36%), and clear curbs (72%). Finally, those routes with
the least-frequent service (headways between 20 and 30 minutes) had the lowest percentage of stops
with seating (17%), shelters (15%), and clear curbs (44%).
Importantly, the variation in route frequency across San Francisco may be contributing to the
geographic patterns of stop amenities. Indeed, of the stops in the northern half of the city, 45% are
served by the most-frequent routes, 44% are served by the second-most frequent routes, and just 11%
are served by the least-frequent routes. This represents a far-higher share of stops served by more-
frequent routes than those stops in the southern half, where 16% are served by the most-frequent
routes, 39% are served by the second-most frequent routes, and 45% are served by the least-frequent
routes. This raises the question of if the north-south amenity disparities can be explained by the
geographic differences in route frequency. A mediation analysis determined that differences in route
frequency explain approximately 40% of the effect of location (north vs. south) on the presence of
seating, which means that 60% of the geographic effect documented is unexplained by route frequency.
This finding merits further analysis, including considering other potentially-relevant sociodemographic,
transit-service, and land-use variables, which are addressed in the discussion section.
Confirmed by observations during the census, there is a clear inter-relatedness between seating,
shelters, route maps, and ETA screens, which are generally either all present at a stop or all absent (see
Table 1). For example, for those stops with shelters, 98% of them also provide seating. That group of
amenities has a less strong relationship to unobstructed curbs and route signage, for example, if a curb
is clear there is only a 47% chance the stop also features seating.
TABLE 1. Stop Amenity Inter-relatedness. ETA Screens are counted only for those which are functional
Seating Route Signage Shelter Clear Curb NextBus ID Route Map ETA Screen
If Seating is present - 85% 90% 92% 90% 88% 62%
If Route Signage is
32% - 29% 66% 87% 28% 20%
present
If Shelter is present 98% 83% - 85% 91% 94% 67%
If Curb is Clear 47% 88% 43% - 83% 42% 29%
If NextBus ID is present 37% 95% 35% 68% - 34% 24%
If Route Map is present 99% 83% 98% 93% 91% - 70%
If ETA Screen is present 100% 82% 99% 92% 93% 99% -
15Journal of Public Transportation March, 2021
In terms of qualitative observations made during the course of the census, first, many stickers on bus
shelters, intended to alert riders as to which route a stop was served by, were worn out from the sun
and illegible (see Figure 6). Second, the placement of NextBus ID stickers was far from uniform; many
were posted very high up on metal or telephone poles (making them difficult to read), and others were
obstructed by screws and bolts. Signage painted onto wooden telephone poles was by far the most
challenging to read. Pavement paint was worn in many places to the degree that its markings were
illegible. Pavement paint was also often obscured by parked cars, which can make it difficult to locate
such stops if no other signage is present. To this point, 51% of the stops marked solely with pavement
paint had parking-obstructed curbs (123 of 242 total), meaning that they are difficult for riders to locate.
As noted in the methods section, only the presence of legible route signage were recorded during the
census.
FIGURE 6. Examples (clockwise from top left) of shelter markings worn out from the sun, obscured
NextBus ID stickers, telephone poles with difficult-to-read lettering, and worn out pavement paint
There were also aspects of sidewalks which influence stop quality. This includes sidewalk width and
evenness. Indeed, very thin sidewalks – barely allowing for two people walking in opposite directions to
pass each other – entails that someone waiting for a bus likely feels in the way of pedestrians and may
instead wait on the street. In addition, some higher-income neighborhoods maintain a sidewalk design
which leaves bus riders little room to wait. In these locations, stretches of vegetation (grass, shrubs,
16Journal of Public Transportation March, 2021
hedges) between the sidewalk and the road (known as a “planting strip”) entail that riders must either
wade through that area to board or be visible to arriving buses, or wait in the street. These types of
issues likely render such stops non-functional for many riders with mobility impairments, large items
such as strollers, and/or safety concerns (see Figure 7).
FIGURE 7. Examples of stops with accessibility issues, including (clockwise from top left) those which
lack sidewalks, are fenced in by guardrails, are obstructed by perpendicular parking, and are blocked by
dense vegetation
Discussion
Equity in transport must not only include a system’s coverage, frequency, cost, and directness, but also
the stops at which all trips begin and end. For this to happen, agencies must first maintain accurate
records as to how stop amenities are distributed, from which they can then prioritize improvements. An
in-person census of 2,964 street-level bus stops in San Francisco reveals inconsistency in and inadequacy
of amenities, ranging from stops which are clearly marked, provide shelter, seating, real-time arrival
17Journal of Public Transportation March, 2021
information, clear curbs, and route maps, to those which are invisible to potential riders, uncomfortable
for those waiting, and hemmed in by parked cars. Employing a conception of equity based on the social
minimum principle, which applied here scrutinizes stop amenities based on their minimum level of
investment, this study finds significant deficits: shelters and seating are absent at a majority of all bus
stops, nearly a third of all stops are obstructed by on-street parking, and more than one in ten stops
lacks legible route signage of any kind. Moreover, employing Rawls’ difference principle, which here
concerns the spatial distribution of stop amenities, indicates that the northern half of the city has a
greater percentage of stops with seating, shelter, and clear curbs. In addition, clusters of low-amenity
stops lie within the city’s southeast corner and its southern half generally. There is also evidence of a
relationship between stop amenities and race, such that census tracts with higher shares of white
residents are more likely to feature bus stops with seating, shelters, and clear curbs.
Breaking down stop amenities by bus route also reveal large disparities, from those routes which have
seating at 75% of stops compared to just 10% along others. These differences are further evident when
dividing routes by headways; those stops which are served least frequently by buses are least likely to
provide seating, shelters, or clear curbs. In essence, the longer a rider likely has to wait for a bus in the
SFMTA system, the lower the chance is there are amenities which would make such waiting
comfortable. Indeed, there is also a connection between route frequency and the geographic
distribution of stop amenities; stops in the north half of San Francisco are far more likely to be served by
higher-frequency stops (though this does not fully explain the north-south amenity imbalance). This
study does not challenge the general logic of providing stop amenities at high-usage stops, nor does it
believe all stops should be equivalent in terms of investment, but it calls into question the paucity of
amenities at low-usage stops, or put another way, the lack of a minimum standard for bus stops. Indeed,
as the literature review demonstrates, amenities at a bus stop may actually alter ridership, meaning that
a low-amenity stop can actively deter it from ever growing. When stops within an entire neighborhood
lack basic amenities, as this census identifies in San Francisco, increasing bus ridership may prove
difficult.
In addition, a number of qualitative issues were observed, including legibility issues with route signage
and NextBus ID stickers, lack of sidewalks or those without pavement, and vegetation which impedes
riders’ ability to reach the curb. These instances indicate that as much value as there is in quantifying
the presence of specific amenities across a system, there is also benefit to visually reviewing transit
stops for basic accessibility issues.
There are several directions future research on bus stops can take. First, censuses of this kind generate a
rich trove of data that create the opportunity for deeper analyses concerning the presence or absence
of amenities and different features of the urban environment. This relates to employment density,
automobile ownership, the number of adjacent traffic lanes and speed limits, as well as attributes such
as topography, populations of seniors and children, and proximity to rail transit. Though some stop-
amenity patterns may be linked to explicit agency policy, others may be less obvious. Furthermore, if
transit-stop censuses are to take place elsewhere, researchers must consider how regional differences
might dictate what constitute relevant amenities. For example, San Francisco has a mild climate –
without particularly hot summers or cold winters – which means that there is no expectation that bus
18Journal of Public Transportation March, 2021
stops maintain heating or cooling capabilities. In contrast, northern cities such as Minneapolis, MN or
Portland, ME may be places where bus-stop heating is of primary importance, whereas the availability of
shade and air-conditioning could be a crucial amenity in cities such as Dallas, TX or Phoenix, AZ. There
are also many other variables which could be related to stop amenities, such as street-tree coverage
and/or intensity of the localized heat-island effect, road type and speed limits, and whether or not a
stop serves multiple lines and is a common transfer point, among others. Moreover, censuses would
benefit from rider interviews to understand if and how amenities influence tripmaking, as well as
transit-agency interviews to determine what strategy was in place guiding the distribution of stop
amenities to begin with.
Beyond this pressing research questions, several immediate policy recommendations flow from this
census, for SFMTA as well as other agencies to which similar stop-amenity inadequacy and inconsistency
likely apply. While time consuming, such a census is a straightforward, highly-accurate means of
appraising stop amenities. This method is an ideal way to put oneself in the perspective of a system’s
current or potential riders in order to understand what may be encouraging or deterring usage. Indeed,
close and repeated observation of stops over time can reveal subtle issues – like the placement of
NextBus ID stickers – which may otherwise remain invisible.
As to specific amenities, first, the signage inconsistency documented (on top of the 11% of stops with no
signage at all) makes locating stops difficult, particularly for those who have low-vision, or who are
infrequent riders. Though SFMTA indicated that it would add metal signs to all stops (Bialick, 2015), this
is still far from being the case, with the most common route signage being paint on metal street poles.
Second, stops in any system which require riders to wade through parked cars in order to board are
incredibly inconvenient and plainly fail a ‘transit-first’ policy. Such a layout is difficult to navigate for
anyone with a mobility impairment, or with a stroller, and explicitly privileges automobile storage over
transit use. Similar issues with stop accessibility in other cities have drawn lawsuits arguing transit
agencies are violating the Americans with Disabilities Act (Sachs, 2007; Nobles, 2016). Third, given
evidence that wait times are perceived as significantly longer for those who have to stand, seating of
some kind should be present at as many stops as possible, rather than the current state of the SFMTA
system, which provides seating at less than half of all stops.
This study has several limitations. First, a census of bus stops leaves out other system features which
undoubtedly influence travel, such as pricing, layout, vehicle quality, crowding, and the ability to reach
stops safely (Spears et al., 2013). Second, this study does not address or account for other factors
contributing to stop quality, such as placement in relation to the block or nearest intersection (Diab and
El-Geneidy, 2015), how bus stops relate to the flow of pedestrians (Hall et al., 2006), or the relationship
of stops to bus and bike lanes (Zhang et al., 2018). Third, simply noting the presence of an amenity at a
certain stop can leave out important details; for example, many of the ETA screens across the SFMTA
system are often incorrect even when they are to outward appearances functioning (Graf, 2020).
Fourth, as would be the case at nearly any point in time, this study excluded a small number of bus stops
in San Francisco due to active construction, which prevented amenities from being cataloged. Fifth,
there are likely other amenities that could have been included in this census, such as adjacent street
lights, trash cans, or sidewalk incline. Lastly, there are other forms of public transit citywide, including
19Journal of Public Transportation March, 2021
light-rail, commuter rail (Caltrain), and a subway system (BART), which this study does not address but
nonetheless influences travel-behavior decisions and possibly SFMTA decision-making as to stop
investments.
Finally, this census gathered data that could likely benefit riders if incorporated into trip-planning and
wayfinding applications. One way this could be achieved is if GTFS, the technical standard for transit
data sharing, is expanded to include stop amenities, such as seating and shelters. This would then
require transit agencies to populate their stop records with current amenity information. Such additions
could allow services like Google Maps or Apple Maps to alert users as to which stops have specific
amenities, which could affect travel choices. For example, someone who has trouble standing for
extended periods of time may want to filter nearby bus stops by those which provide seating. Or, riders
may sort stops by the presence of shelter on a day with heavy rain. These scenarios only scratch the
surface of possible advantages from making amenity information available to application developers,
and eventually, travelers. Overall, stop amenities are an important component of transit trips, they can
be reliably cataloged via manual visits, and reveal a great number of details about the allocation of
resources across a system, which can inform improvements and perhaps even individual trip making.
20Journal of Public Transportation March, 2021
References
Abenoza, R.F., V. Ceccato, Y.O. Susilo, and O. Cats. (2018). “Individual, Travel, and Bus Stop
Characteristics Influencing Travelers’ Safety Perceptions.” Transportation Research Record 2672
(8): 19–28. https://doi.org/10.1177/0361198118758677.
Amin, R. (2018). “Transit Ridership on the Decline Across the U.S.” The Urbanist, SPUR,
December 2018. https://www.spur.org/publications/urbanist-article/2019-01-24/transit-
ridership-decline-across-us.
Attoh, K.A. (2019). Rights in Transit: Public Transportation and the Right to the City in
California’s East Bay. Geographies of Justice and Social Transformation 40. Athens: The
University of Georgia Press.
Azenkot, S., S. Prasain, A. Borning, E. Fortuna, R.E. Ladner, and J.O. Wobbrock. (2011).
“Enhancing Independence and Safety for Blind and Deaf-Blind Public Transit Riders.” Human
Factors in Computing Systems, Conference on Human Factors in Computing Systems, , May,
3247–56. https://doi.org/10.1145/1978942.1979424.
Baldwin, B., H. Boll, A. Lehto, J. Tump, Y. Park, M. Wyffels, W. Schlegel, and D. Huntington. (2010). “Bus
Stops Guidelines.” Portland, OR: TriMet. https://nacto.org/wp-
content/uploads/2015/04/bus_stop_guidelines_trimet.pdf.
Barrero, R., J.V. Mierlo, and X. Tackoen. (2008). “Energy Savings in Public Transport.” IEEE
Vehicular Technology Magazine 3 (3): 26–36. https://doi.org/10.1109/MVT.2008.927485.
Bialick, A. (2015). “Muni’s Yellow Pole Markings at Transit Stops Will Be Replaced By Real
Signs.” Streetsblog San Francisco (blog). April 23, 2015.
https://sf.streetsblog.org/2015/04/23/munis-yellow-pole-markings-at-transit-stops-will-be-
replaced-by-real-signs/.
Bliss, L. (2019). “Very Bad Bus Signs and How to Make Them Better.” CityLab, September 19,
2019. https://www.citylab.com/transportation/2019/09/bus-stop-sign-design-public-
transit-investment-city-signage/598279/.
“Bus Stop Design & Planning Guide.” (2011). Rogue Valley Transportation District.
https://www.rvtd.org/Files/RVTD%20BUS%20STOP%20DESIGN%20GUIDELINES.pdf.
“Bus Stop Safety and Accessibility Study.” (2018). Radford, VA: New River Valley
Metropolitan Planning Organization. http://nrvrc.org/wp-content/uploads/2018/05/RT-Bus-
Stop-Safety-and-Transportation-Study.pdf.
Campbell, M., C. Bennett, C. Bonnar, and A. Borning. (2014). “Where’s My Bus Stop?
Supporting Independence of Blind Transit Riders with StopInfo.” In Proceedings of the 16th
International ACM SIGACCESS Conference on Computers & Accessibility, 11–18. ASSETS ’14.
Rochester, New York, USA: Association for Computing Machinery.
https://doi.org/10.1145/2661334.2661378.
Cassidy, M. (2020). “Muni to Close Majority of Bus Lines Because of Coronavirus.” San
Francisco Chronicle, April 5, 2020, sec. Local.
https://www.sfchronicle.com/bayarea/article/Muni-to-close-majority-of-bus-lines-due-to-
15180935.php.
21Journal of Public Transportation March, 2021
Clanton, N. (2020). “MARTA Army Wants Your Opinion on Atlanta Bus Stops.” Atlanta
Journal Constitution, February 5, 2020. https://www.ajc.com/news/transportation/marta-army-
wants-your-opinion-atlanta-bus-stops/s3XY1sDz5fIVCMjupn82eP/.
Colosi, L., R. Burk, and K. Barr. (2018). “Harrisburg Bus Stop Optimization Project.” City of
Harrisburg Pennsylvania.
https://static1.squarespace.com/static/56dc3f9cb654f9876576bab7/t/5c866701e4966b5f3f4b9
bcc/1552312070233/HarrisburgBusStopOptimizationReport.pdf.
Corazza, M.V., and N. Favaretto. (2019). “A Methodology to Evaluate Accessibility to Bus
Stops as a Contribution to Improve Sustainability in Urban Mobility.” Sustainability 11 (3): 803.
https://doi.org/10.3390/su11030803
Diab, E.I., and A.M. El-Geneidy. (2015). “The Farside Story: Measuring the Benefits of Bus
Stop Location on Transit Performance.” Transportation Research Record: Journal of the
Transportation Research Board, no. 2538. https://trid.trb.org/view/1337034.
Di Ciommo, F., and Y. Shiftan. (2017). “Transport Equity Analysis.” Transport Reviews 37 (2):
139–51. https://doi.org/10.1080/01441647.2017.1278647.
Erhardt, G.D., M. Graehler, Jr., and R.A. Mucci. (2018). “Understanding the Recent Transit
Ridership Decline in Major US Cities: Service Cuts or Emerging Modes?” In . Washington, D.C.
https://usa.streetsblog.org/wp-content/uploads/sites/5/2019/01/19-04931-Transit-Trends.pdf
Fan, Y., A. Guthrie, and D. Levinson. (2016). “Perception of Waiting Time at Transit Stops and
Stations.” Minneapolis, MN: Center for Transportation Studies - University of Minnesota.
http://www.cts.umn.edu/Publications/ResearchReports/reportdetail.html?id=2502.
Feke, M., B. Temming, and J. Freilich. (2018). “Bus Stop Design Guidelines.” Cleveland, OH: Greater
Cleveland Regional Transit Authority.
https://www.riderta.com/sites/default/files/serviceplanning/BusStopDesignGuidelines.pdf.
Ferris, B., K. Watkins, and A. Borning. (2010). “OneBusAway: Results from Providing Real-
Time Arrival Information for Public Transit.” In Proceedings of the SIGCHI Conference on Human
Factors in Computing Systems, 1807–1816. CHI ’10. Atlanta, Georgia, USA: Association for
Computing Machinery. https://doi.org/10.1145/1753326.1753597.
Finch, C.D. (2013). “Bus Stop Accessibility Study.” Roanoke Valley Area Metropolitan
Planning Organization. https://rvarc.org/wp-content/uploads/2013/10/Bus-Stop-
Accessibility-Study_9-26-13.pdf.
Fitzgerald Rodriguez, J. (2020). “End of an Era: Market Street to Go Car Free Jan. 29.” San
Francisco Examiner, January 2, 2020, sec. The City. https://www.sfexaminer.com/news/end-of-
an-era-market-street-to-go-car-free-jan-29/.
Fitzpatrick, K., K. Hall, D. Perkinson, L. Nowlin, and R. Koppa. (1996). “Guidelines for the Location and
Design of Bus Stops.” Report 19. College Station, TX: Texas A&M University.
https://nacto.org/docs/usdg/tcrp_report_19.pdf.
“Go Boston 2030.” (2017). City of Boston.
https://www.boston.gov/departments/transportation/go-boston-2030.
Golub, A., R.A. Marcantonio, and T.W. Sanchez. (2013). “Race, Space, and Struggles for
22Journal of Public Transportation March, 2021
Mobility: Transportation Impacts on African Americans in Oakland and the East Bay.” Urban
Geography 34 (5): 699–728. https://doi.org/10.1080/02723638.2013.778598.
Gordon, R. (2007). “S.F. Muni Board OKs Plan for Clear Channel to Sell Transit Shelter Ads.”
San Francisco Chronicle, September 4, 2007, sec. Bay Area & State.
https://www.sfgate.com/bayarea/article/S-F-Muni-board-OKs-plan-for-Clear-Channel-to-
2505237.php.
Graehler Jr, M., R.A. Mucci, and G.D. Erhardt. (2019). “Understanding the Recent Transit
Ridership Decline in Major US Cities: Service Cuts or Emerging Modes?” In , 19. Washington, D.C.
https://trid.trb.org/view/1572517.
Graf, C. (2020). “Muni Arrival Time System Set to Get $89 Million Upgrade.” San Francisco
20, July 22, 2020, sec. The City. https://www.sfexaminer.com/news/muni-arrival-time-system-
set-to-get-89-million-upgrade/.
Grengs, J. (2002). “Community-Based Planning as a Source of Political Change: The Transit
Equity Movement of Los Angeles’ Bus Riders Union.” Journal of the American Planning
Association 68 (2): 165–78. https://doi.org/10.1080/01944360208976263.
“Guidelines: Design and Placement of Transit Stops.” (2009). Washington, D.C.: Washington
Metropolitan Area Transit Authority.
https://nacto.org/docs/usdg/design_and_placement_of_transit_stops_kfh.pdf.
Hall, S., J. Desyllas, and A. Byrne. (2006). “Bus Stops – How People Actually Use Them and
the Implications for Design.” ETC Proceedings, 31.
https://stuff.mit.edu/afs/athena/course/11/11.951/OldFiles/oldstuff/albacete/Other_Documen
ts/Europe%20Transport%20Conference/traffic_engineering_an/bus_stops_how_peop1480.html
Han, Y., W. Li, S. Wei, and T. Zhang. (2018). “Research on Passenger’s Travel Mode Choice
Behavior Waiting at Bus Station Based on SEM-Logit Integration Model.” Sustainability 10 (6): 1–
23.
Hart, K. (2020). “Public Transit’s Death Spiral.” Axios, April 8, 2020, sec. Health.
https://www.axios.com/coronavirus-public-transportation-subway-bus-ridership-9f039bd9-
459b-45f9-954c-b26380a037dc.html.
Hodges, T. (2010). “Public Transportation’s Role in Responding to Climate Change.” US DOT
Federal Highway Administration.
https://www.transit.dot.gov/sites/fta.dot.gov/files/docs/PublicTransportationsRoleInRespondin
gToClimateChange2010.pdf.
Hosford, K., S. Tremblay, and M. Winters. (2020). “Identifying Unmarked Crosswalks at Bus
Stops in Vancouver, Canada.” Transport Findings, June. https://doi.org/10.32866/001c.13207.
Kim, Y.K., K. Bartholomew, and R. Ewing. (2018). “Impacts of Bus Stop Improvements.”
UT-18.04. Utah Department of Transportation - University of Utah Department of City &
Metropolitan Planning. http://mrc.cap.utah.edu/wp-content/uploads/sites/8/2015/12/UT-
18.04-Impacts-of-Bus-Stop-Improvements.pdf.
Lagune-Reutler, M., A. Guthrie, Y. Fan, and D. Levinson. (2016). “Transit Stop Environments
and Waiting Time Perception: Impacts of Trees, Traffic Exposure, and Polluted Air.”
Transportation Research Record 2543 (1): 82–90. https://doi.org/10.3141/2543-09.
23Journal of Public Transportation March, 2021
Lamoureux, Z., and V. Fast. (2019). “The Tools of Citizen Science: An Evaluation of Map-Based
Crowdsourcing Platforms.” Spatial Knowledge and Information Canada 7 (4): 7.
Law, P., and B.D. Taylor. (2001). “Shelter from the Storm: Optimizing Distribution of Bus Stop
Shelters in Los Angeles.” Transportation Research Record 1753 (1): 79–85.
https://doi.org/10.3141/1753-10.
Loukaitou-Sideris, A. (1999). “Hot Spots of Bus Stop Crime.” Journal of the American Planning
Association 65 (4): 395–411. https://doi.org/10.1080/01944369908976070.
Lusk, A. (2001). “Bus and Bus Stop Designs Related to Perceptions of Crime.” FTA
MI-26-7004-2001.8. Federal Transit Administration, U.S. Department of Transportation.
https://cdn1.sph.harvard.edu/wp-content/uploads/sites/1008/2013/09/bus-and-bus-stop-
lusk.pdf.
Merry, K., and P. Bettinger. (2019). “Smartphone GPS Accuracy Study in an Urban Environment.” PLOS
ONE 14 (7): e0219890. https://doi.org/10.1371/journal.pone.0219890.
“Metro Transit Bus Stop Amenities Study.” (2018). Madison Area Transportation Planning
Board.
http://www.madisonareampo.org/planning/documents/BusStopAmenitiesStudy.pdf.
Moore, A., M. Figliozzi, and C.M. Monsere. (2012). “Air Quality at Bus Stops: Empirical
Analysis of Exposure to Particulate Matter at Bus Stop Shelters.” Transportation Research
Record, January. https://doi.org/10.3141/2270-10.
Moran, M.E. 2021. “Drawing the Map: The Creation and Regulation of Geographic Constraints on Shared
Bikes and E-Scooters in San Francisco, Ca.” Journal of Transport and Land Use 14 (1): 197–218.
https://doi.org/10.5198/jtlu.2021.1816.
NACTO, ed. (2016). Transit Street Design Guide.
Washington: Island Press. https://nacto.org/2016/04/14/transit-street-design-guide/
“Next Generation Customer Information System.” (2020). Presented at the SFMTA Board of
Directors Meeting, San Francisco, CA, June 16.
https://www.sfmta.com/sites/default/files/reports-and-documents/2020/06/6-16-
20_item_14_contract_-_customer_info_system_-_slide_presentation.pdf.
Nobles, W.P. (2016). “New Orleans Faces Lawsuit over Inaccessible Bus Stops.” The Times-
Picayune, March 29, 2016, sec. New Orleans.
https://www.nola.com/news/traffic/article_5a1506a5-c8ef-514a-a3ec-e4687ffa2413.html.
Parsons, and Gruen. (2013). “Transit Design Guidelines.” OmniTrans. https://design.omnitrans.org/wp-
content/uploads/2014/03/OmnitransDesignGuidelines-08.pdf.
Pereira, R.H.M., T. Schwanen, and D. Banister. (2017). “Distributive Justice and Equity in
Transportation.” Transport Reviews 37 (2): 170–91.
https://doi.org/10.1080/01441647.2016.1257660.
Pierce, G., and D. Shoup. (2013). “Getting the Prices Right.” Journal of the American
Planning Association 79 (1): 67–81. https://doi.org/10.1080/01944363.2013.787307.
Pulugurtha, S., and V. Vanapalli. (2008). “Hazardous Bus Stops Identification: An
24You can also read