Multifaceted disparity approach reveals dinosaur herbivory flourished before the end-Cretaceous mass extinction
←
→
Page content transcription
If your browser does not render page correctly, please read the page content below
Paleobiology, 44(4), 2018, pp. 620–637
     DOI: 10.1017/pab.2018.26

     Multifaceted disparity approach reveals dinosaur herbivory
     flourished before the end-Cretaceous mass extinction

     Klara K. Nordén, Thomas L. Stubbs, Albert Prieto-Márquez, and Michael J. Benton

     Abstract.—Understanding temporal patterns in biodiversity is an enduring question in paleontology.
     Compared with studies of taxonomic diversity, long-term perspectives on ecological diversity are rare,
     particularly in terrestrial systems. Yet ecological diversity is critical for the maintenance of biodiversity,
     especially during times of major perturbations. Here, we explore the ecological diversity of Cretaceous
     herbivorous dinosaurs leading up to the K-Pg extinction, using dental and jaw morphological disparity
     as a proxy. We test the hypothesis that a decline in ecological diversity could have facilitated their rapid
     extinction 66 Ma. We apply three disparity metrics that together capture different aspects of morpho-
     space occupation and show how this approach is key to understanding patterns of morphological evo-
     lution. We find no evidence of declining disparity in herbivorous dinosaurs as a whole—suggesting that
     dinosaur ecological diversity remained high during the last 10 Myr of their existence. Clades show
     different disparity trends through the Cretaceous, but none except sauropods exhibits a long-term
     decline. Herbivorous dinosaurs show two disparity peaks characterized by different processes; in the
     Early Cretaceous by expansion in morphospace and in the Campanian by morphospace packing. These
     trends were only revealed by using a combination of disparity metrics, demonstrating how this approach
     can offer novel insights into macroevolutionary processes underlying patterns of disparity and eco-
     logical diversity.

     Klara K. Nordén, Thomas L. Stubbs, and Michael J. Benton. School of Earth Sciences, University of Bristol, 24
        Tyndall Avenue, Bristol BS8 1TQ, U.K. *Present address: Department of Ecology and Evolutionary
        Biology, Princeton University, Princeton, New Jersey 08544, U.S.A. E-mail: knorden@princeton.edu.
     Albert Prieto-Márquez. Field Museum of Natural History, 1400 S. Lake Shore Drive, Chicago, Illinois 60605,
        USA. Present address: Institut Català de Paleontologia Miquel Crusafont, Universitat Autònoma de
        Barcelona, Carrer de l’Escola Industrial 23, 08201 Sabadell, Spain.

     Accepted: 26 June 2018
     Data available from the Dryad Digital Repository: https://doi.org/10.5061/dryad.pp07dm0

                               Introduction                                     taxonomic diversity did not equal losses in
        Studies of biodiversity in deep time are often                          ecological diversity (Edie et al. 2018), support-
     focused on taxonomic diversity (Jackson and                                ing the notion that these processes can be
     Johnson 2001). In contrast, how taxonomic                                  decoupled. This is important, because ecologi-
     diversity relates to a second aspect of biodi-                             cal diversity may increase the robustness and
     versity—ecological diversity—is little under-                              resilience of ecosystems, even as species diver-
     stood (Swenson 2011). Ecological diversity is                              sity declines. Resilience is defined as the ability
     broadly defined as the diversity of ecotypes, or                            of an ecosystem to recover after major pertur-
     niches, occupied (Magurran 1988). It is likely                             bations (Elmqvist et al. 2003; Hooper et al.
     that species diversity is positively correlated                            2005). Ecosystems that have high resilience can
     with ecological diversity—but it is not obvious                            adapt better and regain species diversity that
     that this relationship will be linear. High                                was lost during times of environmental stress,
     diversity in species can be accommodated                                   while low resilience facilitates extinction cas-
     either through increased packing within occu-                              cades (Walker 1995; Elmqvist et al. 2003; Folke
     pied ecological space (niche partitioning) or                              et al. 2004; Lindegren et al. 2016). Ecological
     through expansion into new niches (niche                                   diversity is therefore likely to be important for
     expansion [MacArthur 1965]). A recent study                                both the maintenance and recovery of
     exploring both taxonomic and ecological diver-                             biodiversity.
     sity of bivalves during extinction events in the                              These topics are of great interest to paleon-
     Phanerozoic found that great losses in                                     tologists, yet studies with a long-term

      © 2018 The Paleontological Society. All rights reserved. This is an Open Access article, distributed under the terms of the
      Creative Commons Attribution licence (http://creativecommons.org/licenses/by/4.0/), which permits unrestricted
Downloaded from https://www.cambridge.org/core. IP address: 176.9.8.24, on 11 May 2020 at 04:50:56, subject to the Cambridge Core terms of use, available at
      reuse, distribution, and reproduction in any medium, provided the original work is properly cited.
https://www.cambridge.org/core/terms. https://doi.org/10.1017/pab.2018.26
                                                                                                                                     0094-8373/18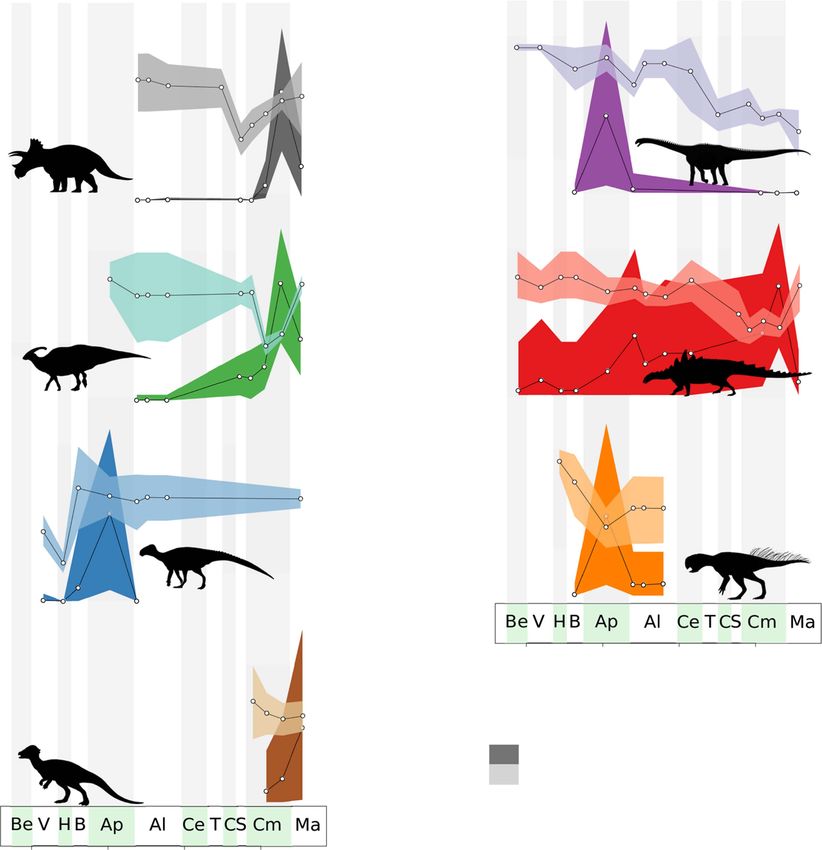
DINOSAUR HERBIVORY FLOURISHED BEFORE EXTINCTION                                                            621

        perspective on ecological diversity have been                                 To gain a better understanding of how
        rare, especially in terrestrial systems. While                             ecological diversity evolves, particularly in
        many studies have explored morphological                                   the face of environmental change and how this
        disparity patterns in clades (Erwin 2007;                                  may relate to mass extinctions, there is a need
        Hughes et al. 2013), only a subset has focused                             for a long-term and detailed study of ecological
        on ecologically important traits (such as teeth                            diversity in terrestrial systems. Such
        and jaws). Many studies also limit the infer-                              approaches have previously been successful
        ences that can be made by calculating only a                               in uncovering the evolutionary dynamics of
        single metric, usually variance-based disparity.                           clades through time in marine biotas (Foote
        This is unfortunate, as using several metrics                              1999; Korn et al. 2013; Hopkins and Smith 2015;
        describing different aspects of morphological                              Marx and Fordyce 2015; Stubbs and Benton
        disparity is key to identifying patterns in                                2016; Smithwick and Stubbs 2018). To this
        ecological diversity (Foote 1999; Bush and                                 purpose, we explore the ecological diversity of
        Novack-Gottshall 2012; Novack-Gottshall                                    herbivorous dinosaurs during the last 80 Myr
        2016a, b). Novack-Gottshall (2016a) developed                              of their reign, ending with the K-Pg mass
        a conceptual framework describing the dispar-                              extinction 66 Ma. We use dental and jaw
        ity trends we might expect during different                                morphological disparity as a proxy for diver-
        processes of “ecospace” utilization, including                             sity in feeding habits and, by extension,
        contraction (loss of ecological diversity),                                ecotypes. The rationale for this is that morpho-
        redundancy, and niche partitioning. A key                                  logical variation in the jaws and dentition is
        message is that different modes of evolution,                              expected to have a strong ecomorphological
        such as loss of morphospace occupation versus                              signal, with major adaptive innovations and
        packing, cannot be distinguished using only                                modifications being intrinsically related to diet
        metrics describing variance or mean distance,                              and feeding mode (Norman and Weishampel
        for example, sum of variances (SoV) and mean                               1985; Barrett and Rayfield 2006; Cantalapiedra
        pairwise distances (Fig. 1; Ciampaglio et al.                              et al. 2013; Button et al. 2014; Gill et al. 2014;
        2001; Novack-Gottshall 2016a). Packing refers                              Stubbs and Benton 2016).
        to how densely taxa occupy a given region of a                                The K-Pg mass extinction event was one of
        morphospace. Close packing may be caused by                                the most severe in the history of life, leading to
        redundancy in functional morphology, where                                 the complete extinction of nonavian dinosaurs,
        the same morphology is shared among many                                   among many other groups. There is now
        taxa (Novack-Gottshall 2016a; Pigot et al.                                 abundant evidence that an asteroid impact
        2016). Yet these alternatives will lead to                                 coincided with the extinction (Alvarez et al.
        radically different interpretations (extinction                            1980; Schulte et al. 2010), and it is also
        on the one hand and packing on the other).                                 concurrent with a large igneous event, the
                                                                                   eruption of the Deccan Traps (Renne et al.
                                                                                   2015). The mass extinction was preceded by a
                                                                                   period of extreme climate changes (Friedrich
         A                        B                       C
                                                                                   et al. 2012)—possibly weakening ecosystems
                                                                                   before the final extinction. The extinction of the
                                                                                   dinosaurs is therefore an excellent test case of
                                                                                   whether lowered ecosystem resilience can
                                                                                   catalyze major extinction events, as has been
        FIGURE 1. Different disparity metrics capture different                    suggested for other mass extinctions (Roop-
        aspects of disparity. A, Original morphospace occupation                   narine et al. 2007; Dick and Maxwell 2015). The
        (shaded). A decrease in distance-based metrics (mean                       lead-up to the extinction of the dinosaurs is of
        pairwise disparity [MPD] or sum of variances [SoV])
        could be either due to an increase in packing in                           added interest, because it has been suggested
        morphospace (B) or a decrease in the volume occupied in                    that dinosaurs showed a broad-scale global
        morphospace (C). Measuring morphovolume in addition                        decline in speciation rates through the last 40
        to distance-based metrics allows us to separate these
        events, as morphovolume will not be affected by                            Myr of the Cretaceous (Sakamoto et al. 2016),
        morphospace packing.                                                       challenging the general consensus that there

Downloaded from https://www.cambridge.org/core. IP address: 176.9.8.24, on 11 May 2020 at 04:50:56, subject to the Cambridge Core terms of use, available at
https://www.cambridge.org/core/terms. https://doi.org/10.1017/pab.2018.26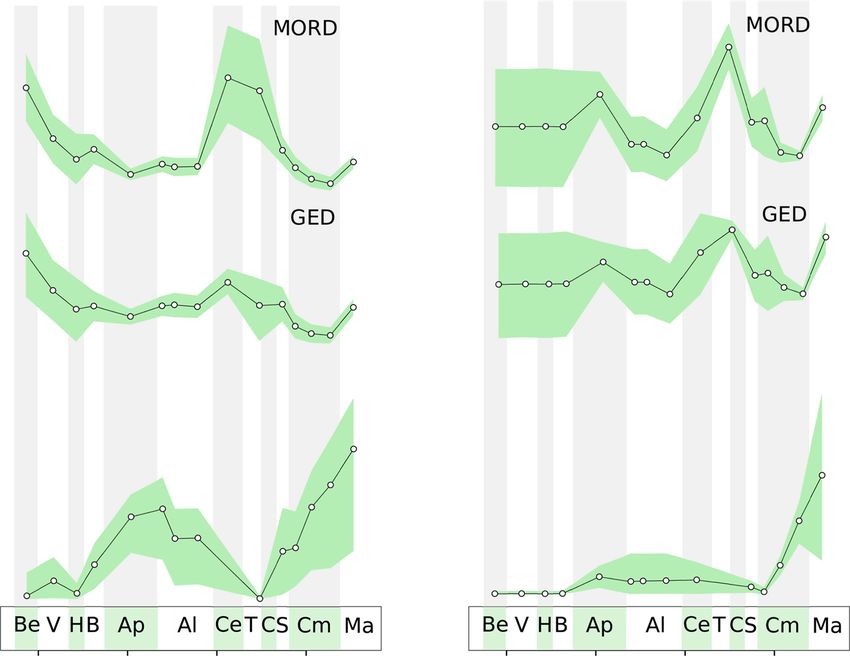
622                                                    KLARA K. NORDÉN ET AL.

     was no decline in diversity in their last 10 Myr                           understanding of how the disparity of all
     (Fastovsky et al. 2004; Wang and Dodson 2006;                              herbivorous dinosaurs was changing during
     Barrett et al. 2009; Lloyd 2012; Mitchell et al.                           the Cretaceous. Conflicting results for the same
     2012; Brusatte et al. 2015; Starrfelt and Liow                             clades (hadrosaurs and theropods) suggest
     2016). Herbivorous dinosaurs are of particular                             that different approaches may yield different
     interest, as they were hugely abundant and                                 results (e.g., different sets of taxa, different sets
     positioned at the bottom of the vertebrate food                            of morphological characters, different dispar-
     chain, and therefore changes in their diversity                            ity metrics). Further, it is reasonable to believe
     and ecology had the potential to create cascad-                            that disparity will vary depending on which
     ing effects through the ecosystem (Pringle et al.                          part of the organism one measures, and
     2007; Vila et al. 2016). Moreover, herbivores are                          whether geometric morphometrics or discrete
     expected to encompass more species with                                    characters are used (Mongiardino Koch et al.
     dietary specializations than carnivores (Ber-                              2017). Time binning and the temporal scope of
     nays and Graham 1988; Codron et al. 2016), so                              the analysis also matter, with some analyses
     herbivorous dinosaurs should have been parti-                              having investigated only the latest Cretaceous
     cularly sensitive to environmental perturba-                               (Brusatte et al. 2012), and others the whole of
     tions (Davies et al. 2004; Clavel et al. 2011).                            the Mesozoic, but with larger time bins
        Several studies have investigated dinosaur                              (MacLaren et al. 2017). Timescales matter:
     disparity leading up to the K-Pg extinction,                               peaks and troughs might be part of long-term
     three of which exclusively focused on ecomor-                              fluctuations, which would be missed if the
     phology (Larson et al. 2016; Strickson et al.                              temporal focus is too narrow, while using large
     2016; MacLaren et al. 2017). Larson et al. (2016)                          time bins may obscure short-term events and
     used a geometric morphometric approach,                                    trends.
     finding that the dental morphospace occupa-                                    This study extends, and complements, ear-
     tion of different maniraptoran clades remained                             lier disparity studies on dinosaurs by exploring
     stable throughout the Santonian–Maastrich-                                 this theme using a larger data set, multiple
     tian interval. Strickson et al. (2016) used                                disparity metrics, smaller time bins, including
     discrete dental characters of ornithopods                                  the great majority of herbivorous dinosaur
     and found that their disparity peaked in                                   taxa, and investigating global, regional, and
     the Coniacian–Santonian, with a trough in the                              clade-specific trends. By doing so, we uncover
     Campanian, followed by an increase in the                                  new detail and previously unaddressed
     Maastrichtian. MacLaren et al. (2017) explored                             aspects of dinosaur disparity dynamics pre-
     disparity using geometric morphometrics and                                ceding their extinction and demonstrate how a
     biomechanical characters of lower jaws from                                multifaceted approach to disparity is critical to
     herbivorous dinosaurs and showed a steady                                  understand the dynamics of morphological
     increase in disparity throughout the Cretac-                               evolution.
     eous, with no decline in the Maastrichtian.
     Based on discrete characters from the whole
     skeleton, Brusatte et al. (2012) detected declines                                          Materials and Methods
     in the disparity of ceratopsians and hadrosau-
     roids, but not among smaller ornithopods,                                    Taxon Sampling.—A list of all herbivorous
     theropods, and sauropodomorphs, from the                                   dinosaur taxa (excluding theropods) during
     Campanian to the Maastrichtian. This result                                the Cretaceous period was created using the
     both contrasts with (Strickson et al. 2016) and                            Paleobiology Database (http://paleodb.org) in
     agrees with (Larson et al. 2016) previously                                conjunction with the literature. All valid
     mentioned studies.                                                         species, according to Weishampel et al. (2004),
        These recent studies have been valuable                                 plus new species described after that paper’s
     in exploring both patterns of dinosaurian                                  publication (referenced in Supplementary
     adaptation and different data and methods,                                 Data) with any cranial and/or dental material
     but it is hard to make direct comparisons                                  were included. After the character matrix was
     between studies and build an overarching                                   constructed, taxa with >70% missing data were

Downloaded from https://www.cambridge.org/core. IP address: 176.9.8.24, on 11 May 2020 at 04:50:56, subject to the Cambridge Core terms of use, available at
https://www.cambridge.org/core/terms. https://doi.org/10.1017/pab.2018.26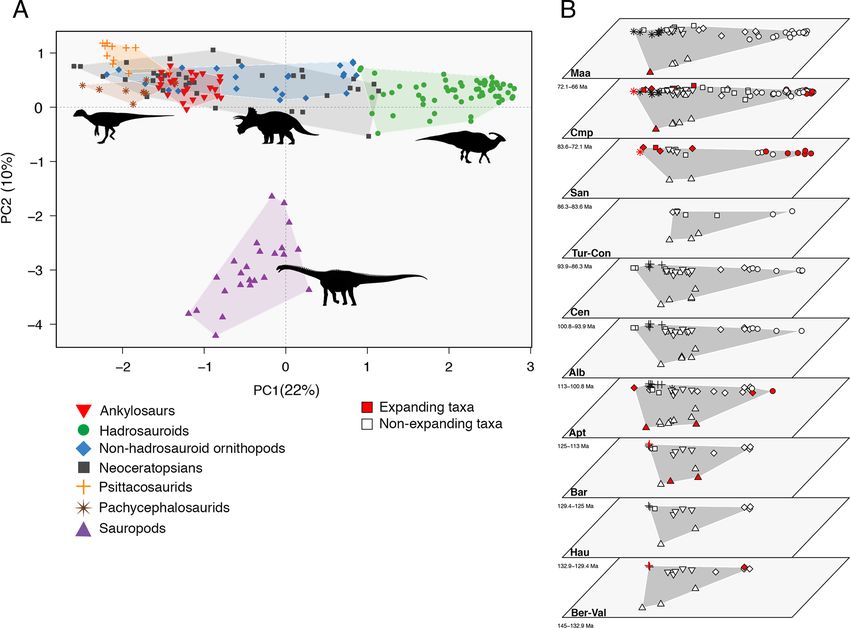
DINOSAUR HERBIVORY FLOURISHED BEFORE EXTINCTION                                                            623

        excluded. This cutoff was chosen to exclude as                             variation in all groups included and to add
        few taxa as possible (26), yet remove extreme                              characters describing jaw morphology. We
        outliers. This was checked visually by                                     used photographs and descriptions of
        inspecting morphospace plots for different                                 specimens in the literature for scoring of
        cutoff values. The final matrix used for                                    characters      (listed   and     referenced    in
        analysis consisted of 194 species, with 34%                                Supplementary Data 2).
        missing data overall (Supplementary Data 2).                                  Timescale and Time Bins.—The Cretaceous
           We excluded herbivorous theropods for                                   timescale used in this study is based on
        four reasons. (1) There is some debate about                               Gradstein et al. (2012) and the updates in the
        which theropods were herbivorous and which                                 2016 International Chronostratigraphic Chart.
        might have been omnivorous. (2) Character                                  Using this timescale, dinosaur-bearing
        choice: our characters are focused on tooth                                geological formations were given start and
        morphology, which would be a poor estimate                                 end dates based on Weishampel et al. (2004) or,
        of beak disparity. Adjusting the characters to                             if available, more recent publications
        accommodate beak morphologies would have                                   (Supplementary Data 2). The first and last
        drastically increased missing data in the data                             appearance dates of each taxon were then
        set, both from nonapplicable dental characters                             assigned based on these formation ages. We
        in beaked taxa and the addition of nonapplic-                              conducted a sensitivity test to evaluate the
        able beak-specific characters in toothed taxa.                              effect of different time-bin divisions (geological
        High percentages of missing data affect dis-                               substages, geological stages and equal-length
        parity analyses negatively; therefore, to main-                            time bins of 10, 5, and 3 Myr; Supplementary
        tain good quality we would need to cut a larger                            Figs. 1, 2). By evaluating the effects of these
        proportion of taxa, ultimately reducing the                                divisions, we constructed a modified series in
        sample size of the study. (3) Rarity: herbivor-                            which long time bins were divided into
        ous theropods constitute ~5% of herbivorous                                substages (Albian and Campanian) and two
        dinosaur species diversity in the Cretaceous                               short bins with particularly few taxa, Coniacian
        (Butler and Barrett 2008; Butler et al. 2009).                             and Turonian, were combined. This division
        (4) Minimal impact: all key herbivorous ther-                              allowed for time bins that were most equal in
        opod clades appear in the Early Cretaceous                                 sample size and duration (∼5 Myr), without
        (therizinosaurs, ornithomimids, and ovir-                                  either increasing error bars dramatically or
        aptorids) and continue through the Cretac-                                 losing temporal information in the data.
        eous, so if they were included, they would                                    Disparity Analyses.—All analyses were
        likely increase morphospace occupation, and                                conducted in R v. 3.2.2. (R Core Team 2015).
        increase expansion in the Early Cretaceous, but                            For constructing a distance matrix, we
        not change the main trends during the Cretac-                              calculated generalized Euclidean distances
        eous. Other methodological approaches would                                (GED) (Wills 1998, 2001) and maximum
        be more suitable for including beaked forms,                               observable distances (MORD) using the
        such as geometric morphometrics measuring                                  package Claddis (Lloyd 2016). GED has the
        the shape of the jaw (although theropods were                              benefit of always returning a complete matrix
        also excluded from the largest such study, by                              (required for ordination) by filling in a mean
        MacLaren et al. [2017] on the basis of lack of                             distance (based on calculable distances) into
        complete specimens).                                                       missing fields. MORD rescales the calculable
           Morphological Characters and Scoring.—                                  distances based on the information available,
        Eighty-eight      morphological     characters,                            by dividing each distance by the maximum
        encompassing dental and jaw morphology,                                    distance calculated from the observed
        were used in the analysis (Supplementary                                   characters (Lloyd 2016). Using both distance
        Data 1). Forty-two of the dental characters                                matrices, we then calculated preordination
        were adopted from Strickson et al. (2016), with                            (weighted mean pairwise disparity [WMPD])
        minor adjustments to the scoring of                                        and postordination (SoV, principal coordinates
        ornithopods. Another 46 were collected from                                analysis [PCO] convex-hull volume) disparity
        sources chosen to cover morphological                                      metrics.

Downloaded from https://www.cambridge.org/core. IP address: 176.9.8.24, on 11 May 2020 at 04:50:56, subject to the Cambridge Core terms of use, available at
https://www.cambridge.org/core/terms. https://doi.org/10.1017/pab.2018.26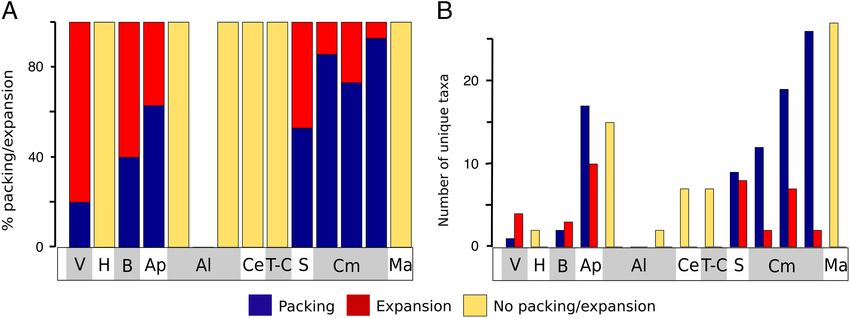
624                                                    KLARA K. NORDÉN ET AL.

        Mean pairwise disparity measures how                                    used as the cutoff point. A bootstrap method
     similar a given number of taxa are, that is, how                           (1000 replicates) was applied to estimate
     closely packed they are in morphospace. The                                90% confidence intervals. Following Kotrc
     WMPD is different, in that it gives more weight                            and Knoll (2015a), we also quantified the
     to pairwise distances based on more compar-                                strength of association between all discrete
     able characters (Close et al. 2015). To test for                           characters and the PCO axes using Cramér’s V
     effects of sample size and produce 90% con-                                coefficient (Supplementary Note 1, Supple-
     fidence intervals, we applied a bootstrap ana-                              mentary Fig. 4).
     lysis (1000 replicates with replacement).                                     We quantified the total amount of morpho-
     Confidence intervals were based on percentiles                              space occupied through time by measuring the
     of the bootstrap distribution.                                             PCO convex-hull volume. PCO volume based
        For postordination metrics (SoV, PCO                                    on a convex hull is sensitive to outliers (Kotrc
     volume) we applied a PCO to the GED and                                    and Knoll 2015b), which can create large peaks
     MORD distance matrices. A common problem                                   in volume from single data points. This can be
     when PCO is applied to a distance matrix                                   adjusted by changing the alpha shape para-
     based on discrete characters is the creation of                            meter, which allows large empty spaces (with
     negative eigenvalues. Negative eigenvalues in                              few data points) to be removed. The alpha
     a PCO can be corrected by adding a constant of                             shape parameter regulates the radius by which
     equal size to the largest negative eigenvalue to                           such spaces are “scooped out.” We calculated
     all distances (e.g., Cailliez correction; Cailliez                         volumes for three dimensions (PC 1–3) using
     1983). We explored how well “corrected” and                                different values of alpha. The range of values to
     “uncorrected” scores represent the original                                be tested was determined by visually inspect-
     distance matrix, and how this affected the SoV                             ing morphospace plots for different alpha
     statistic (Supplementary Note 2, Supplemen-                                values. We also calculated raw morphospace
     tary Figs. 3, 6). We note that the variation                               volumes. For volumes and alpha shapes, we
     explained by PC 1 and PC 2 is notably higher                               calculated 90% confidence intervals based on
     when no correction is used. Negative eigenva-                              percentiles of a bootstrap distribution (1000
     lues need not be a problem for the representa-                             replicates).
     tion of the first few PC axes if the greatest                                  To measure the amount of morphospace
     absolute negative value is smaller than the                                packing and expansion for each time bin, we
     greatest positive value (Legendre and                                      used the niche packing “flexible” metric
     Legendre 1998). This condition is met in our                               (NP flexible) created by Pigot et al. (2016). This
     data set. We discuss the fit of our ordination                              metric is calculated by estimating the number
     data to the original distances in the Supple-                              of species in a volume A1 that can be packed
     mentary Material. In summary, we found a                                   within another volume A2. A1 and A2 are
     high correlation (95%) between distances after                             sequential time bins, so, for example, to
     ordination axes and original distances when no                             calculate the percentage packing in the Cam-
     correction was applied. This suggests that                                 panian, A1 is the Campanian and A2 the
     results from SoV and WMPD should be                                        Santonian. A greedy algorithm sequentially
     comparable.                                                                removes species from A1, each time choosing
        The SoV statistic measures the spread of                                the data point that incurs maximum loss of
     taxa in morphospace. In this aspect, it is like                            morphovolume. Once the modified A1
     WMPD. SoV can be measured for any number                                   volume reaches the same volume as A2, the
     of axes, and how many are included varies                                  taxa remaining in A1 are considered to con-
     between studies. We included 30 axes based on                              tribute to packing, and the removed taxa are
     the R2 values of the correlation between dis-                              considered to expand trait space. In this way,
     tances in the PCO space with the original dis-                             percentages for expansion and packing can be
     tances in the GED or MORD matrices                                         calculated. The benefit of this algorithm is that
     (Supplementary Fig. 3). At the point where the                             it compares packing in the absolute volumes
     curve plateaus, additional axes do not add to                              of A1 and A2, irrespective of their positions in
     the variation explained, and this can hence be                             morphospace.

Downloaded from https://www.cambridge.org/core. IP address: 176.9.8.24, on 11 May 2020 at 04:50:56, subject to the Cambridge Core terms of use, available at
https://www.cambridge.org/core/terms. https://doi.org/10.1017/pab.2018.26
DINOSAUR HERBIVORY FLOURISHED BEFORE EXTINCTION 625
Results unchanged when using two approaches for
calculating morphological distances from the
Distance-based Disparity Trends.—Distance- discrete character data, the GED (Fig. 2D,E)
based metrics (WMPD and SoV) highlight and MORD (Fig. 2A,B). There is a major
three key trends in herbivorous dinosaur discrepancy between the two distance
disparity, revealing an Aptian peak, a measures in the time from the Albian to the
Campanian low, and a stable/increasing Turonian–Coniacian, when the MORD metric
trend in the Maastrichtian (Fig. 2A,B,D,E). records a sharp rise, but the GED metric
As expected, both distance-based metrics, suggests unchanged or decreasing disparity.
within-bin WMPD (Fig. 2A,D) and the SoV The Aptian peak is not pronounced using the
(Fig. 2B,E), show almost identical trends. This MORD metric, but it does appear using smaller
confirms that our ordination has not time bins (Supplementary Figs. 1, 2). Apart
distorted the original distances in any from these key features, distance-based
major way (we explore this more in depth in disparity remains relatively stable during the
the Supplementary Material). They are also Cretaceous.
A D
B E
C F
FIGURE 2. Disparity of herbivorous dinosaur teeth and jaws through the Cretaceous. A, Weighted mean pairwise
disparity (WMPD), maximum observable distances (MORD)-based disparity; B, sum of variances (SoV), MORD-based
disparity; C, morphovolume (principal coordinates analysis [PCO] convex-hull volume) based on MORD: upper graph
raw volumes, lower graph alpha shapes; D, WMPD, generalized Euclidean distances (GED)-based disparity; E, SoV,
GED-based disparity; F, morphovolume based on GED: upper graph raw volumes, lower graph alpha shapes. Shaded
envelopes represent 90% confidence intervals based on 1000 bootstrap replicates. Stratigraphic abbreviations: Be,
Berriasian; V, Valanginian; H, Hauterivian; B, Barremian; Ap, Aptian; Al, Albian; Ce, Cenomanian; T, Turonian; C,
Coniacian; S, Santonian; Cm, Campanian; Ma, Maastrichtian.
Downloaded from https://www.cambridge.org/core. IP address: 176.9.8.24, on 11 May 2020 at 04:50:56, subject to the Cambridge Core terms of use, available at
https://www.cambridge.org/core/terms. https://doi.org/10.1017/pab.2018.26626 KLARA K. NORDÉN ET AL.
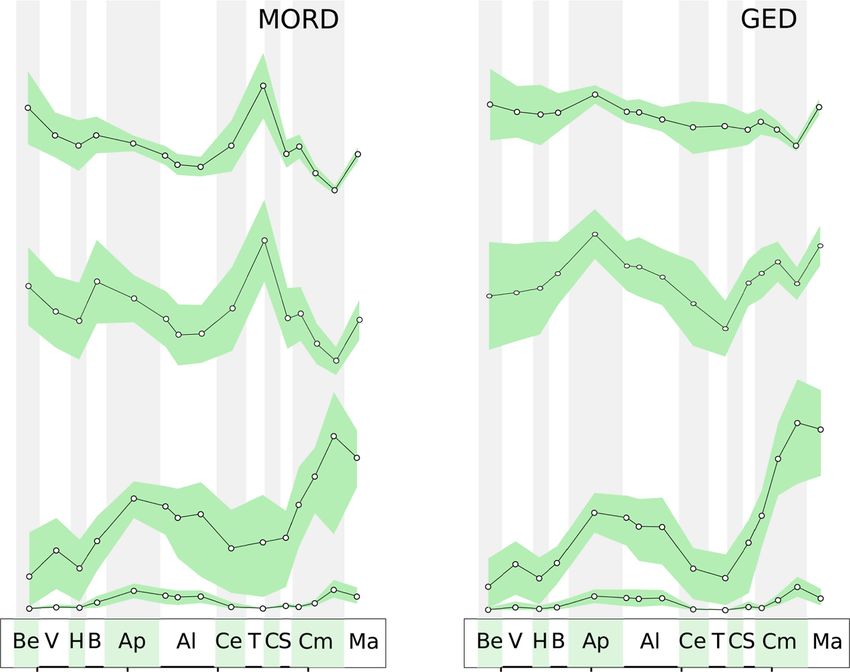
FIGURE 3. Jaw and dental morphospace occupation for groups of herbivorous dinosaurs. PC 1–PC 2 explains 32% of
variance, and the correlation between pairwise distances from the first two PC axes and squared pairwise distances
from the original matrices is 0.86 (Supplementary Note 1). A, Total morphospace occupation with convex hulls drawn
around the major clades. B, Temporal trends in morphospace occupation through the Cretaceous. Both plots are based
on the generalized Euclidean distances metric, and expanding taxa (shaded in B) are based on a two-dimensional
packing analysis. Stratigraphic abbreviations: Ber, Berriasian; Val, Valanginian; Hau, Hauterivian; Bar, Barremian; Apt,
Aptian; Alb, Albian; Cen, Cenomanian; Tur, Turonian; Con, Coniacian; San, Santonian; Cmp, Campanian; Maa,
Maastrichtian.
Silhouettes from PhyloPic.org: upper left image by Mathew Wedel, under Creative Commons Attribution 3.0
unported license (https://creativecommons.org/licenses/by/3.0/); upper middle image by Raven Amos, under
Creative Commons Attribution 3.0 unported license (https://creativecommons.org/licenses/by/3.0/); upper right
image and lower image licensed under Public Domain Dedication 1.0 license (https://creativecommons.org/
publicdomain/zero/1.0/).
Morphospace Occupation.—Phenotypic similar- in morphospace (Supplementary Fig. 3A).
ity between taxa can be visualized in a Herbivorous dinosaur clades generally form
morphospace based on the jaw and dental clusters within the morphospace, with some
character data (Fig. 3). The first two axes groups occupying distinct regions, such as
represent 32% of the total variation, high for a hadrosauroids and the highly divergent
morphospace built on a discrete character data sauropods (Fig. 3). The separation between
set (e.g., Brusatte et al. 2012; Halliday and clades in morphospace is significant between
Goswami 2016), but low compared with a all groups except non-hadrosauroid
landmark-based data set. However, a strong ornithopods and neoceratopsians, using
correlation (R = 0.86) between PC scores on the nonparametric multivariate analysis of
first and second axes and original distances in variance (NPMANOVA) for pairwise
the distance matrix confirms that this is a good comparison (Supplementary Table 1). We
representation of the relative placement of taxa note, however, that NPMANOVA can be
Downloaded from https://www.cambridge.org/core. IP address: 176.9.8.24, on 11 May 2020 at 04:50:56, subject to the Cambridge Core terms of use, available at
https://www.cambridge.org/core/terms. https://doi.org/10.1017/pab.2018.26DINOSAUR HERBIVORY FLOURISHED BEFORE EXTINCTION 627
misleading when dispersion differs greatly in necessity increase the density of taxa). If
groups: a significant result can be confounded sample size does not increase, species can still
by difference in spread, rather than solely expand, or lack expansion, but the latter does
by difference in position (Anderson 2001). not exemplify packing. Our morphospace
In PC 1–PC 2 morphospace, ornithischians packing analysis shows that the Aptian and
with less derived teeth, such as early Campanian peaks in morphovolume are
ornithopods, ankylosaurs, psittacosaurids, characterized by different processes.
and pachycephalosaurids, converge, forming Morphospace packing was elevated in the
a group. More derived ceratopsians and Campanian, while the Aptian exhibits a
ornithopods diverge and approach the area combination of both packing and expansion
occupied by hadrosauroids. Statistical tests, (Fig. 4). Packing is high in the Campanian, both
based on Cramér’s V coefficient, confirm that in absolute numbers and as a percentage
most characters contribute to the positioning of compared with expansion. Apart from the
taxa in morphospace, and there is no bias for Aptian, expansion is high in the Valanginian,
certain individual characters or categories of Barremian, and Santonian. The Hauterivian,
characters (e.g., dentary and maxillary teeth or Albian, Cenomanian, Turonian–Coniacian,
jaw-related features; Supplementary Fig. 4). and Maastrichtian all show drops in sample
Morphovolume Disparity Trends.— size and a lack of morphospace expansion.
Morphovolume (PCO convex-hull volume) Regional Trends.—Our data set allows
values during the Cretaceous show both division between the most well sampled
similarities and marked differences compared geographical regions, the Eurasian and North
with distance-based metrics (Fig. 2C–F). The American continents (Fig. 5). The distance-
volume of morphospace occupied is high in the based metrics for Eurasia lack the Aptian high
Aptian, in agreement with distance-based disparity but show the same low Campanian
metrics, but it is also high in the Campanian, disparity. The North American trend shows
when distance-based metrics give low values. both high disparity in the Aptian and low
These patterns are unchanged using different disparity in the Campanian, in agreement
distance metrics. Morphospace volumes are with the global trend. In contrast to the
sensitive to outliers, and we have accounted for global trend, however, there is an increasing
this by changing the alpha shape parameter, trend from the Albian to the Turonian–
which removes large areas of empty space, and Coniacian. Morphovolumes for both
by applying a bootstrap method. Alpha continents retain the Aptian–Albian and
volumes clearly reduce the variability in Campanian peaks in disparity, mirroring the
calculated volumes, suggesting this approach global trend (similar trends are recorded for
is effective in removing the impact of outliers. MORD-based distances; see Supplementary
Even with confidence intervals and for low Fig. 8).
alpha values, the peaks in the Aptian–Albian Clade-Specific Trends.—Herbivorous dinosaur
and Campanian remain (Fig. 2C–F), suggesting clades show distinct disparity dynamics
they are not caused by outliers. Patterns are (Fig. 6). Both distance metrics generally show
similar for both distance metrics, but the identical patterns; therefore, only results based
MORD metric shows high variability in the on the GED distance metric are discussed here
Turonian–Coniacian bin, probably reflecting (see Supplementary Information for MORD
the peak recorded by distance-based metrics. analyses). Neoceratopsians exhibit a decrease
However, this increase does not persist at in distance-based disparity in the Santonian
decreasing alpha values. Similar patterns are and then increase throughout the rest of
seen when six morphospace axes are included the Late Cretaceous, with morphovolumes
(hypervolumes; Supplementary Fig. 5). increasing in tandem in the Campanian, then
Morphospace Packing and Expansion.—We decreasing in the Maastrichtian (Fig. 6A).
define morphospace packing as an increase in Hadrosauroids dramatically decrease in
species within the same volume as recorded distance-based disparity in the middle
from the previous time bin (which will by Campanian, and then recover previous levels
Downloaded from https://www.cambridge.org/core. IP address: 176.9.8.24, on 11 May 2020 at 04:50:56, subject to the Cambridge Core terms of use, available at
https://www.cambridge.org/core/terms. https://doi.org/10.1017/pab.2018.26628 KLARA K. NORDÉN ET AL.
FIGURE 4. Morphospace packing through time. Each value is calculated as the volume in the younger bin
accommodated in previous bin. A, Proportion of unique taxa contributing to packing/expansion for two dimensions;
B, number of unique taxa contributing to packing/expansion for two dimensions. “No packing/expansion” refers to
bins where sample size decreases, therefore they do not constitute packing but a lack of expansion in morphospace. All
volume estimates are based on the generalized Euclidean distances metric. Stratigraphic abbreviations as in Fig. 2.
A D
B E
C F
FIGURE 5. Regional disparity trends. Disparity trends for Eurasian taxa: A, Weighted mean pairwise disparity
(WMPD), maximum observable distances (MORD) based; B, WMPD, generalized Euclidean distances (GED) based;
C, principal coordinates analysis (PCO) volume, GED based. Disparity trends for North American taxa: D, WMPD,
MORD based; E, WMPD, GED based; F, PCO volume, GED based. Shaded envelopes represent 90% confidence
intervals based on 1000 bootstrap replicates. Stratigraphic abbreviations as in Fig. 2.
Downloaded from https://www.cambridge.org/core. IP address: 176.9.8.24, on 11 May 2020 at 04:50:56, subject to the Cambridge Core terms of use, available at
https://www.cambridge.org/core/terms. https://doi.org/10.1017/pab.2018.26DINOSAUR HERBIVORY FLOURISHED BEFORE EXTINCTION 629
A E
B F
C G
D
FIGURE 6. Clade-specific disparity trends. Trends in principal coordinates analysis (PCO) volume (darker shading) and
weighted mean pairwise disparity (WMPD) (lighter shading) through the Cretaceous for: A, neoceratopsians;
B, hadrosauroids; C, non-hadrosauroid ornithopods; D, pachycephalosaurids; E, sauropods; F, ankylosaurids;
G, psittacosaurids. All values based on the generalized Euclidean distances metric (see Supplementary Information for
maximum observable distances–based disparity). Shaded envelopes represent 90% confidence intervals based on 1000
bootstrap replicates. Stratigraphic abbreviations as in Fig. 2. Silhouettes from PhyloPic.org: A, By Raven Amos, under
Creative Commons Attribution 3.0 unported license (https://creativecommons.org/licenses/by/3.0/); B and E, under
Public Domain Dedication 1.0 license (https://creativecommons.org/publicdomain/zero/1.0/); C, by Jaime Headden,
under Creative Commons Attribution 3.0 unported license (https://creativecommons.org/licenses/by/3.0/); D, by
Emily Willoughby, under Creative Commons Attribution-ShareAlike 3.0 unported license (https://creativecommons.
org/licenses/by-sa/3.0/); F, by Scott Hartman, under Creative Commons Attribution 3.0 unported license (https://
creativecommons.org/licenses/by/3.0/); G, by Pete Buchholz, licensed under Creative Commons Attribution-
ShareAlike 3.0 unported license (https://creativecommons.org/licenses/by-sa/3.0/).
of disparity in the Maastrichtian (Fig. 6B). remain on a stable level of disparity through the
Hadrosauroid morphovolumes, in contrast, Aptian–Albian and Maastrichtian (Fig. 6C).
increase through the Campanian, peaking in High morphovolume is recorded in the Aptian.
the late Campanian, with a decrease in the Pachycephalosaurids show stable distance-
Maastrichtian. Non-hadrosauroid ornithopods based disparity in the Campanian and
increase in disparity in the Barremian, then Maastrichtian and increasing morphovolumes
Downloaded from https://www.cambridge.org/core. IP address: 176.9.8.24, on 11 May 2020 at 04:50:56, subject to the Cambridge Core terms of use, available at
https://www.cambridge.org/core/terms. https://doi.org/10.1017/pab.2018.26630 KLARA K. NORDÉN ET AL.
during the same interval (Fig. 6D). Sauropods Morphospace saturation coupled with high
exhibit high distance-based disparity values in morphovolume in the Campanian indicates
the Aptian and middle to late Albian, which that this was not a time when dinosaurs were
then plummet toward the Maastrichtian declining in morphological disparity. On the
(Fig. 6E). Similarly, sauropod morphovolumes contrary, dinosaurs were flourishing, with the
peak in the Aptian, then decrease through the Late Cretaceous seeing the radiation of suc-
rest of the Cretaceous. Ankylosaurs show the cessful groups such as hadrosaurids and neo-
lowest levels of distance-based disparity in the ceratopsians. This exemplifies how low
Santonian, compared with their relatively stable disparity values from distance-based metrics
and higher disparity in the Early Cretaceous, but can be caused by increased packing and high
show an increase in the Maastrichtian (Fig. 6F). morphodensity, rather than a loss of morpho-
Ankylosaur morphovolume also remains stable volume (Novack-Gottshall 2016a). New spe-
through the Cretaceous, with a slightly cies filled in and saturated the morphospace
increasing trend toward the late Campanian. already occupied, a process that was particu-
Finally, psittacosaurids record the highest levels larly seen in hadrosauroids, which became
of distance-based disparity in the Hauterivian, very diverse and abundant in the latest Cre-
a decrease in the Aptian, but recovery in taceous but did not show wide variation in jaw
the Albian, albeit with slightly lower than and dental morphology (Strickson et al. 2016).
Hauterivian values (Fig. 6G). In contrast, Very low distance-based disparity coupled
psittacosaurid morphovolume peaks in the with high morphovolumes in the hadrosaur-
Aptian. oids confirms this (Fig. 6B).
The decreased morphodensity and mor-
phovolume in the Maastrichtian represents an
Discussion effect opposite to what happened in the Cam-
panian: a thinning in morphospace. Whether
Disparity Trends in the Cretaceous.—We find this is a true trend or an edge effect is unclear.
three key results: (1) an Aptian peak in Either way, our results do not indicate any
disparity characterized by expansion and long-term decline in dinosaur disparity pre-
packing; (2) a second disparity peak in ceding the end-Cretaceous extinction, in
the Campanian characterized by intense agreement with previous disparity studies
morphospace packing; and (3) a thinning out (Brusatte et al. 2012; Larson et al. 2016; Strick-
of morphospace in the Maastrichtian. These son et al. 2016; MacLaren et al. 2017).
results paint a picture of a largely resilient An exception can be seen in sauropods,
dinosaurian ecosystem that was able to adapt which appear to have truly been in long-term
and flourish in the face of climate-driven decline. A combined decrease in distance-
environmental changes. based disparity and volume suggests declin-
Morphospace expansion in the Aptian sug- ing morphological diversity (as opposed to
gests that this was a time of diversification of morphospace packing) (Fig. 6E), in agreement
dental and jaw morphologies, particularly with the known disappearance of broad-
among sauropods and early hadrosauroids crowned sauropods in the Late Cretaceous
(Fig. 3). This includes Nigersaurus taqueti, (Chure et al. 2010). Sauropods, large herbivores
which is the only sauropod known to have with slow generation times, might have been
evolved a specialized “dental battery” (Sereno more sensitive to extreme environmental
and Wilson 2005), and early hadrosauroids changes during the mid-Cretaceous (Gaston
(Altirhinus kurzanovi, Jinzhousaurus yangi) with and Blackburn 1995; Purvis et al. 2000; Cardillo
primitive versions of dental batteries. Dental et al. 2005).
batteries would later become more advanced In sum, our disparity results show a
in hadrosaurids and were likely a key factor in dynamic pattern of waxing and waning of
the success of this group in the Late Cretaceous clades—sauropods flourishing in the Aptian–
(Norman and Weishampel 1985; Strickson Albian then diminishing in the Late Cretac-
et al. 2016). eous, while other clades rose to prominence
Downloaded from https://www.cambridge.org/core. IP address: 176.9.8.24, on 11 May 2020 at 04:50:56, subject to the Cambridge Core terms of use, available at
https://www.cambridge.org/core/terms. https://doi.org/10.1017/pab.2018.26DINOSAUR HERBIVORY FLOURISHED BEFORE EXTINCTION 631
(e.g., hadrosaurids, ceratopsians). Collectively, Differences to Previous Analyses.—Our
herbivorous dinosaurian ecosystems show no analyses reveal differences in temporal,
signs of “weakening” preceding the Cretac- regional, and clade-specific trends compared
eous mass extinction. with earlier studies. MacLaren et al. (2017) did
Contrasting Diversity and Disparity in not identify a disparity peak in the Aptian, as
Hadrosauroids.—Empirical studies suggest in this study, but instead their distance-based
that ecosystem species richness is positively disparity value rises steadily throughout the
correlated with specialization, suggesting that Cretaceous. Neither did they recover a trough
ecosystems with high species diversity mediate in the Campanian. Their study used 10 Myr
the increase in species numbers mainly time bins and a smaller sample, which might
through niche partitioning rather than niche be responsible for the discrepancy. Large time
expansion (Case 1981; Belmaker et al. 2012; bins can alter disparity curves substantially, as
Pigot et al. 2016; Pellissier et al. 2018). Our is evident from adjusting time bins for our
results show that a similar pattern might be own data, and this effect has also been
true for one of the most species-rich groups of demonstrated previously (Deline and Ausich
dinosaurs, the hadrosauroids. Once advanced 2011). Applying 10 Myr bins, both distance-
dental batteries had evolved in early based metrics show a steadily decreasing
hadrosauroids, these structures required little trend starting in the Early Cretaceous
change to ensure huge success for the (Supplementary Figs. 1, 2). Another reason
clade. Our measures are currently limited to might be the difference in method and
estimating morphospace packing, but an morphology measured, as MacLaren et al.
interesting further avenue of research is to test (2017) used geometric morphometrics and
whether the taxa filling morphospace are functional traits relating to lower jaw shape,
doing so in an even manner or are more while our study used discrete characters with a
densely populating certain areas. Novack- focus on both dental and jaw morphology.
Gottshall (2016a) offers a framework to test Brusatte et al. (2012) found global decreases in
these hypotheses, by measuring the degree of hadrosaur, neoceratopsian, pachycephalosaur,
redundancy versus partitioning. Redundancy and ankylosaur disparity from the Campanian
refers to the occupancy of niches identical to to the Maastrichtian, and an increase in
those previously occupied by existing species. sauropod disparity. This is the exact opposite
Though suggestive, a high degree of redun- of the results reported here: sauropods show a
dancy/partitioning in our morphospace does decrease and all other groups record an
not necessarily equal niche partitioning. “Niche increase in distance-based disparity from the
space” has many more dimensions than dif- Campanian to the Maastrichtian (Fig. 6). This is
fering feeding modes. For example, differences intriguing and suggests that dental and jaw
in body size incur differences in predation disparity, linked more tightly to feeding
pressures (with higher predation pressures on ecology, might show a different pattern from
small animals). In modern African savanna the disparity of the entire skeleton. Further
ecosystems, such differences can lead to dif- studies should explore the disparity of the
fering habitat preference (open/vegetated) entire skeleton, to clarify whether and how
and, consequently, differing resource use overall disparity dynamics differ from those of
among herbivores (Riginos and Grace 2008). If dental and jaw morphology alone. Also in
hadrosauroids are disproportionally spread contrast to Brusatte et al. (2012), our main
out along some other axis of niche space, it is trends are shared on the Eurasian and North
possible that they might not have exhibited American continents (Fig. 5). This further
greater niche partitioning than other groups. A strengthens the argument that herbivorous
more detailed analysis should also include a dinosaurs worldwide were not experiencing
spatial dimension, as hadrosaurs on different long-term declines (Brusatte et al. 2015) and
continents could inhabit similar niches without suggests that the trends recovered herein are
competing. not restricted to regional patterns.
Downloaded from https://www.cambridge.org/core. IP address: 176.9.8.24, on 11 May 2020 at 04:50:56, subject to the Cambridge Core terms of use, available at
https://www.cambridge.org/core/terms. https://doi.org/10.1017/pab.2018.26632 KLARA K. NORDÉN ET AL.
The overall message of this study is different remove large peaks caused by outliers. We also
from that of Sakamoto et al. (2016), who found use two dissimilarity metrics (MORD and
declines in speciation rates, but the results need GED) to investigate how robust our results
not be contradictory. Sakamoto et al. (2016) did are to different methodological approaches.
find increasing speciation rates in neocera- How effective are these methods for identi-
topsians and hadrosaurids, indicating radia- fying spurious peaks? The Turonian–Con-
tions of these groups, which agrees with the iacian peak using the MORD metric is
morphospace packing results presented here. significantly higher than any other point.
Furthermore, we present data suggesting However, it is not recorded by the GED metric.
sauropods were the only group declining in This suggests that this peak in disparity is not a
disparity, apparently coinciding with declining stable result, as it is not reproducible using two
speciation rates. This is not to say that specia- alternative metrics. Similarly, the same Tur-
tion rates and disparity must be coupled, but it onian–Coniacian peak does not persist at low
is interesting to note that in the case of non- alpha levels in the volume estimates. The
avian dinosaurs, both trends seem to co-occur, sample size in this bin is low, and upon
with reduced speciation rates matched by low inspection of morphospace occupation
morphological diversity in sauropods, and through time, it appears that the MORD metric
high speciation rates matched by high volume- estimates higher disparity between neocera-
based disparity (but low distance-based dis- topsians, sauropods, and hadrosauroids than
parity due to packing) in hadrosauroids. does the GED metric. This suggests that the
Therefore, the overall picture of dinosaur evo- Turonian–Coniacian peak is caused by a few
lutionary dynamics preceding the extinction is very disparate taxa. Large areas of empty
one of faunal turnover, with some clades morphospace are often a sign of bias caused by
prospering and others declining, rather than a missing data, and the ability of the MORD
collective decline. In addition, the focus here on metric to handle missing data that are not
morphospace volume and packing provides randomly distributed (Lloyd 2016) should be
different insights than a study of coupled spe- investigated. The implications of this are that
ciation and lineage extinction rates. we should be cautious to interpret the Tur-
Potential Biases.—When using fossil data, the onian–Coniacian peak (and trough) as a real
relative proportion of bias and true signal can phenomenon—it is probably a result of poor
be difficult to estimate. Contrary to MacLaren sampling in this bin (Supplementary Fig. 7).
et al. (2017), a decrease in disparity coinciding However, the Aptian and Campanian patterns,
with an increase in sample size does not prove which we have focused on as our main result,
that disparity measures are not biased by persist with MORD and GED metrics, both for
sample size. A decrease in distance-based low alpha values and with the bootstrap con-
disparity could be due to either reduced fidence interval. Our bootstrap and alpha
morphospace occupation or extensive packing shape analysis do reveal, however, that the
(high morphodensity) (Fig. 1). Packing in very high volume in the latest Campanian is
morphospace is likely to be higher when a unstable. We cannot be certain that the Cam-
larger sample is included, and thus increased panian had a higher morphovolume than the
sample size can also cause drops in disparity. Aptian—but high volumes in the Aptian and
Here, we apply a bootstrap method to simulate the Campanian, as compared with other time
the effect of random sampling, as done bins, are well supported. We suggest our data
elsewhere (e.g., Halliday and Goswami 2016; set is reliable enough to illuminate larger-scale
Strickson et al. 2016; MacLaren et al. 2017). We patterns.
also use alpha shape volumes, following Kotrc The clade-specific analyses, particularly for
and Knoll (2015a), to remove large areas of morphovolume, are influenced by low sample
empty morphospace in volume estimates. The size. Fine temporal trends can therefore not be
volume analyses show that applying alpha discerned, and peaks should be interpreted
shapes strongly reduces the confidence with caution. Higher sample sizes are achieved
interval, suggesting it is a useful method to for neoceratopsians and hadrosauroids, and
Downloaded from https://www.cambridge.org/core. IP address: 176.9.8.24, on 11 May 2020 at 04:50:56, subject to the Cambridge Core terms of use, available at
https://www.cambridge.org/core/terms. https://doi.org/10.1017/pab.2018.26DINOSAUR HERBIVORY FLOURISHED BEFORE EXTINCTION 633
these are the only clades that can be interpreted Aptian–Albian and Campanian–Maastrichtian
with certainty. Both clades are well sampled, are particularly well sampled (Starrfelt and
and it is interesting to note that in the Campa- Liow 2016). It is therefore reasonable to con-
nian bin, ceratopsians exhibit coupled increase sider the Albian–Aptian and Campanian–
in volume and variance-based disparity Maastrichtian disparity values as good esti-
(expansion), while hadrosauroids show an mates, while the other bins should be treated
increase in volume but decrease in the variance with more caution, particularly for volume
metric. estimates. These two peaks are also the most
Ultimately, disparity analyses can only interesting from the morphospace packing/
record the disparity of the known fossil record. expansion perspective, with the combined
Therefore, although we have shown that some expansion/packing in the Albian and intense
trends are robust to random sampling, we packing in the Campanian. Therefore, the
cannot account for the fact that some geological pattern of morphospace packing in the Cam-
intervals are relatively poorly sampled and panian is relatively well supported. Note,
will underestimate the true disparity more however, that the TRiPS method has been
than other bins. PCO volumes will naturally be criticized (Close et al. 2018), because it can only
closely linked to sample size when sample size truly standardize diversity data once sampling
is low, as each species will add/remove some is sufficient in each time bin (i.e., has reached
volume (as opposed to measuring variance). the asymptote in the species discovery curve),
For very large data sets, this effect is likely to be and when sampling is not sufficient, it over-
less pronounced, because the effect of sample estimates binomial sampling probabilities.
size tapers out (Ciampaglio et al. 2001). The Different clades also show differing degrees
extent and effect of sampling bias on the dino- of preservation: in particular, sauropods do not
saur fossil record is a subject of much debate, often preserve skull material. Is the steady
and a number of methods and models have decline in sauropods just a sampling artifact?
been developed to estimate bias (Barrett et al. This possibility cannot be excluded, and only
2009; Brusatte et al. 2015; Sakamoto et al. 2016; increased sampling can resolve this. Never-
Starrfelt and Liow 2016). Subsampling by theless, the available fossil record of sauropods
standardizing to very low sample sizes likely suggest broad-crowned forms were lost in the
causes much of the real signal to be wiped out, Late Cretaceous, which saw the radiation of the
resulting in a nearly flat diversity curve (Close narrow-crowned titanosaurs (Chure et al.
et al. 2018). The phylogenetic diversity estimate 2010). Therefore, as far as we can tell from the
accounts for ghost lineages and, when applied known fossil record, there is a real loss in
to the dinosaur fossil record, mostly follows sauropod morphological diversity in the Late
that of the raw taxonomic count; therefore, Cretaceous, which fits with our disparity
depending on position, it either confirms the curve—a coupled loss in volume and distance-
major diversity trends or demonstrates that the based disparity. Hadrosaurs and ceratopsians,
phylogenetic diversity estimate cannot remove on the other hand, are relatively well sampled
biases effectively. The majority of recent in the Campanian–Maastrichtian, and the
diversity studies have been based on the resi- disparity trends recovered in this period for
duals model (Barrett et al. 2009; Upchurch et al. these clades are better supported.
2011; Lloyd 2012; Mannion et al. 2012; Brusatte Disparity Is Multifaceted.—“Disparity” is
et al. 2015), which has since been shown to be sometimes discussed in terms of a uniform
based on incorrect statistical assumptions and measure of morphological variety. The
is therefore flawed (Sakamoto et al. 2017; preferred metric in studies of the fossil record
Dunhill et al. 2018). A different approach is to is distance-based metrics, as this measure is
quantify the sampling rate of each bin to least sensitive to sample-size biases. Such
estimate true richness, the TRiPS method, as biases are particularly a concern for the
applied by Starrfelt and Liow (2016). vertebrate fossil record. But our data show
Their results confirm diversity peaks in the explicitly that disparity has two aspects,
Aptian and Campanian and suggest that the variance and volume, and different metrics
Downloaded from https://www.cambridge.org/core. IP address: 176.9.8.24, on 11 May 2020 at 04:50:56, subject to the Cambridge Core terms of use, available at
https://www.cambridge.org/core/terms. https://doi.org/10.1017/pab.2018.26634 KLARA K. NORDÉN ET AL.
are needed to capture these aspects (Foote pairwise distances or SoV, is the only feasible
1999; Ciampaglio et al. 2001; Wills 2001; option, particularly where sample size is very
Kotrc and Knoll 2015a, b; Novack-Gottshall small in some bins (as in our clade-specific
2016a, b). Pairwise dissimilarity is a very analyses). A conservative approach is never to
robust measure of disparity, but it has been apply volume-based metrics, as measures
demonstrated that it “does not give an might be so distorted by biases that no “real”
adequate estimation of the amount of signal will be visible, even on relatively good
morphospace occupied” (Ciampaglio et al. data sets. This is possible, but does not change
2001: p. 711). Appreciating this can change the fact that distance-based metrics and
the way we interpret disparity trends. The volume-based metrics describe two different
distance-based metric on its own suggests aspects of disparity. If we can only measure
“disparity” was low in the Campanian. But one, our inferences of the evolutionary pro-
was it low because the number of cesses underlying this trend must equally be
morphologies present was low, or because limited.
new clades were radiating into the same
morphospace? This is an important
distinction to make: the first scenario suggests Conclusion
decline and extinction, the other the Our results suggest that dinosaur ecological
diversification of successful clades. diversity, as far as it is reflected by dental and
The contrast between disparity trends in jaw disparity, was not declining in the Late
hadrosauroids and sauropods also demon- Cretaceous, rejecting the hypothesis that dino-
strates this. Both clades show approximately saur ecosystems were weakened preceding the
the same decrease in distance-based disparity extinction. Instead, herbivorous dinosaurs
from the Early to Late Cretaceous. Just con- were flourishing in the Campanian, with no
sidering this metric, we could conclude they significant loss in disparity in the Maastrich-
were decreasing equally in “disparity.” When tian. Clade-specific analyses reveal how differ-
morphovolumes are measured, however, ent clades rose and fell in disparity during the
hadrosauroid disparity increases in volume in Cretaceous, notably a long-term decline in
the Late Cretaceous, while sauropod disparity sauropod disparity and morphospace packing
decreases. These distinct trends show that the in hadrosaurids, a group that was radiating in
two clades show radically different patterns: the Campanian. These trends reveal complex
hadrosauroids flourished, while sauropods relationships among disparity, diversity, and
were in decline. diversity dynamics. Sauropods increased in
Our study explicitly underlines the impor- diversity but decreased in speciation rates and
tance of considering several aspects of dis- disparity, and hadrosauroids, while diversify-
parity. The measures used here are not ing, did not expand proportionally in morpho-
exhaustive but can be extended further to get a space, but rather retained a specific tooth/jaw
more in-depth understanding of disparity pat- morphology. We show how disparity trends
terns (e.g., measures of clustering/dispersion are multifaceted and cannot be described in
in morphospace). Using modeling to identify simple terms of increases and decreases, or by
particular modes of evolution in morphospace just a single metric. Thus, using a combi-
is also a promising approach and would be an nation of metrics, each describing different
interesting way to further our analysis aspects of disparity, is key to understanding
(Novack-Gottshall 2016a, b). We show that the dynamics of morphological diversity
measuring morphospace volume and packing, through time.
a relatively easy to implement extension of
typical methods employed in disparity studies,
can substantially increase the depth of the Acknowledgments
analysis. We thank M. J. Ryan (Cleveland Museum
There might be cases in which a measure of Natural History), C. Bullar (University
robust to sample-size differences, such as mean of Bristol), J. Mallon (Canadian Museum of
Downloaded from https://www.cambridge.org/core. IP address: 176.9.8.24, on 11 May 2020 at 04:50:56, subject to the Cambridge Core terms of use, available at
https://www.cambridge.org/core/terms. https://doi.org/10.1017/pab.2018.26You can also read